daylight and visual comfort analysis of … · ludde gölén abstract i abstract the main...
TRANSCRIPT
Dept of Architecture and Built Environment: Division of Energy and Building DesignDept of Building and Environmental Technology: Divisions of Building Physics and Building Services
DAYLIGHT AND VISUAL COMFORT ANALYSIS OF AN AUDITORIUM AND LANDSCAPE OFFICE-Using Advanced Lighting Simulations
Ludde Gölén
Master Thesis in Energy-efficient and Environmental BuildingsFaculty of Engineering | Lund University
Ludde Gölén
Daylight and V
isual Com
fort Analysis of an Auditorium
and Landscape Offi
ceM
aster Thesis EEBD
-14/08

Lund UniversityLund University, with eight faculties and a number of research centers and specialized institutes, is the largest establishment for research and higher education in Scandinavia. The main part of the University is situated in the small city of Lund which has about 112 000 inhabitants. A number of departments for research and education are, however, located in Malmö and Helsingborg. Lund University was founded in 1666 and has today a total staff of 6 000 employees and 47 000 students attending 280 degree programs and 2 300 subject courses offered by 63 departments.
Master Program in Energy-efficient and Environmental Building DesignThis international program provides knowledge, skills and competencies within the area of energy-efficient and environmental building design in cold climates. The goal is to train highly skilled professionals, who will significantly contribute to and influence the design, building or renovation of energy-efficient buildings, taking into consideration the architecture and environment, the inhabitants’ behavior and needs, their health and comfort as well as the overall economy.
The degree project is the final part of the master program leading to a Master of Science (120 credits) in Energy-efficient and Environmental Buildings.
Examiner: Marie-Claude DuboisSupervisor: Åke Blomsterberg
Keywords: Visual comfort, visual discomfort, Luminance ratio, Daylight Glare Probability, daylight availability, conflict, connectivity and glare.
Thesis: EEBD–14/08
Ludde Gölén
Abstract
I
Abstract
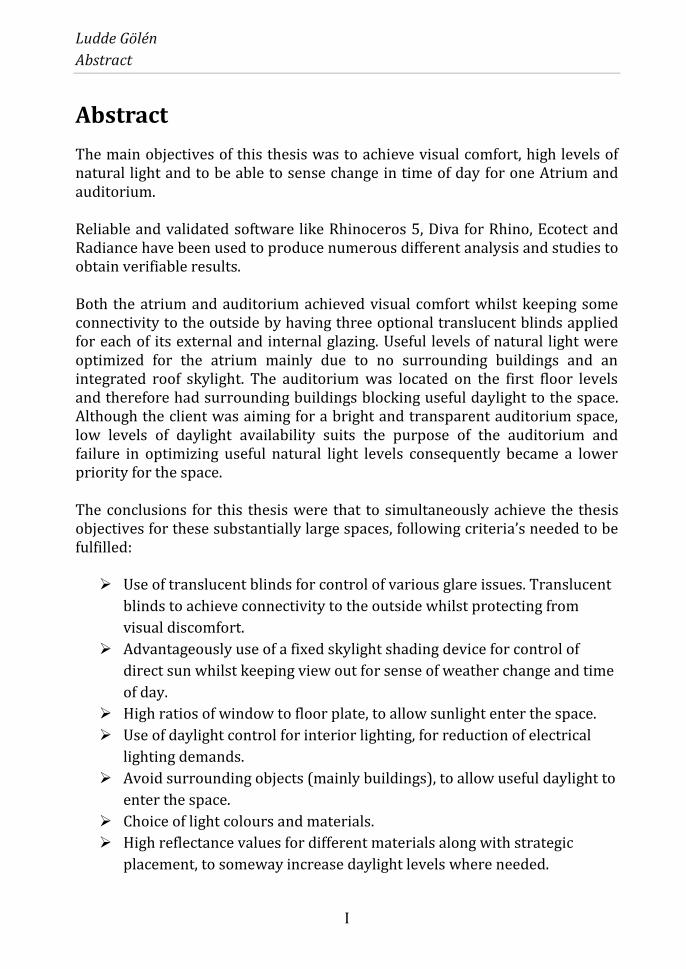
The main objectives of this thesis was to achieve visual comfort, high levels of natural light and to be able to sense change in time of day for one Atrium and auditorium. Reliable and validated software like Rhinoceros 5, Diva for Rhino, Ecotect and Radiance have been used to produce numerous different analysis and studies to obtain verifiable results. Both the atrium and auditorium achieved visual comfort whilst keeping some connectivity to the outside by having three optional translucent blinds applied for each of its external and internal glazing. Useful levels of natural light were optimized for the atrium mainly due to no surrounding buildings and an integrated roof skylight. The auditorium was located on the first floor levels and therefore had surrounding buildings blocking useful daylight to the space. Although the client was aiming for a bright and transparent auditorium space, low levels of daylight availability suits the purpose of the auditorium and failure in optimizing useful natural light levels consequently became a lower priority for the space. The conclusions for this thesis were that to simultaneously achieve the thesis objectives for these substantially large spaces, following criteria’s needed to be fulfilled:
Use of translucent blinds for control of various glare issues. Translucent
blinds to achieve connectivity to the outside whilst protecting from
visual discomfort.
Advantageously use of a fixed skylight shading device for control of
direct sun whilst keeping view out for sense of weather change and time
of day.
High ratios of window to floor plate, to allow sunlight enter the space.
Use of daylight control for interior lighting, for reduction of electrical
lighting demands.
Avoid surrounding objects (mainly buildings), to allow useful daylight to
enter the space.
Choice of light colours and materials.
High reflectance values for different materials along with strategic
placement, to someway increase daylight levels where needed.
Ludde Gölén
Abstract
II
Allow balancing between value-based decisions to somehow achieve
high performance for all outcomes.
Keywords: Visual comfort, visual discomfort, Luminance ratio, Daylight Glare Probability, daylight availability, conflict, connectivity and glare.
Ludde Gölén
Acknowledgements
III
Acknowledgements
First of all I would like to thank everyone participating in helping me completing this thesis report. Special thanks to Åke Blomsterberg (professor at Lunds University and consultant at WSP Malmö) who’s patiently has given me thoughtful and appreciated advice and comments throughout my thesis progress. Special appreciation goes to Andrew Corney (consultant at WSP Cambridge) who’s wisely been supporting me with ways of thinking, different strategies & ideas and how to approach different issues regarding daylight and visual comfort among many other things.

Ludde Gölén
Contents
IV
Contents
ABSTRACT ........................................................................................................................................................... I
ACKNOWLEDGEMENTS ............................................................................................................................... III
CONTENTS ........................................................................................................................................................ IV
TERMINOLOGY / NOTATION ...................................................................................................................... V
1 INTRODUCTION ..................................................................................................................................... 1
1.1 PROBLEM MOTIVATION.................................................................................................................. 1 1.2 BACKGROUND .............................................................................................................................. 2 1.3 OBJECTIVES ................................................................................................................................. 2 1.4 SCOPE ........................................................................................................................................ 3
2 METHODOLOGY ..................................................................................................................................... 4
2.1 SOFTWARE USE & INFORMATION .................................................................................................... 5 2.1.1 Rhinoceros 5 & DIVA-for-Rhino ...................................................................................... 5 2.1.2 Ecotect 2011 .................................................................................................................. 5 2.1.3 Radiance ........................................................................................................................ 6
2.2 LOB, LONDON OFFICE BUILDING..................................................................................................... 6 2.2.1 RIBA plan of work ........................................................................................................... 7 2.2.2 Site & Building Information ............................................................................................ 8
3 ANALYSIS & RESULTS ....................................................................................................................... 13
3.1 AUDITORIUM STUDY ................................................................................................................... 13 3.1.1 Clients’ Brief ................................................................................................................. 16 3.1.2 Sun Path Diagram ........................................................................................................ 17 3.1.3 Daylight Autonomy ...................................................................................................... 23 3.1.4 Visual Comfort Study .................................................................................................... 26 3.1.5 Conflicts between value-based decisions for the Auditorium ...................................... 46
3.2 ATRIUM (LANDSCAPE OFFICE) STUDY .............................................................................................. 51 3.2.1 Clients’ Brief ................................................................................................................. 53 3.2.2 Sun Path Diagram ........................................................................................................ 54 3.2.3 Daylight Autonomy ...................................................................................................... 65 3.2.4 Visual Comfort Study .................................................................................................... 72 3.2.5 Conflicts between value-based decisions for the Atrium ............................................. 82
4 CONCLUSIONS ...................................................................................................................................... 87
5 REFERENCES ........................................................................................................................................ 89
APPENDIX A .................................................................................................................................................... 91
APPENDIX B .................................................................................................................................................... 92
APPENDIX C ................................................................................................................................................. 100

Ludde Gölén
Terminology / Notation
V
Terminology / Notation
Acronyms / Abbreviations LOB London Office Building IEQ Indoor Environmental Quality DGP Daylight Glare Probability VLT Visual Light Transmission DA Daylight Autonomy DLDC Daylight-Linked Dimming Control
Ludde Gölén
Introduction
1
1 Introduction
1.1 Problem motivation
The commercial buildings sector is one of the fastest rising energy consuming sectors. This is mainly due to the progression of commercial and public activities and their associated demand for heating, cooling, lighting and other indoor appliances (ECEEE, 2014). With a greater focus on energy efficiency and architectural emphasis, decision makers and building regulations drive the designs of new properties to become increasingly more insulated and airtight but also with a greater portion of windows which sometimes leads to a deterioration of the indoor environmental quality, if the design and realization on the construction site are not done properly. For occupants in commercial premises, it can trigger a notable reduction in productivity due to poor thermal comfort and visual discomfort (Cardy, 2013). Modern design of office buildings has a tendency to increase the portion of windows to be more impressive with grand visibility and well day lit rooms (Voll, 2008). This is a result of architectural emphasis and implementations where potential problems are often not considered or understood, although the knowledge is available. A higher proportion of windows in relation to wall area may cause:
Higher risk of visual discomfort
Higher risk of direct sun causing distraction.
Increased energy use for heating and cooling.
Overheating.
Greater challenge in optimizing energy use, visual and thermal comfort
to a reasonable investment and life cycle cost.
Unintentional heat losses during winter (depending on the glazing
properties).
(Blomsterberg, 2008)
The work carried out in this thesis will look to demonstrate how a good design process can achieve good examples of how to design a comfortable visual space while maintaining good levels of light to obtain high performance level among users.

Ludde Gölén
Introduction
2
1.2 Background
This thesis subject origin from a client’s brief containing goals and requirements related to one auditorium and atrium with respect to daylight and visual comfort. All the daylight analysis within the thesis is therefore a result from the client’s brief but also from the architect drawings & models. The analysis is not only there to show relevant results and conclusions in regard to daylight but also meant to communicate the relationship, design process and work progress between the client and the consultant in that way that each daylight chapter within the thesis represents the stages on which the results have been presented to the client. For the daylight and visual comfort study, consultants have been working in close relationship with different architects to meet the client’s requirements. Regular meetings have been arranged to update and share relevant information. Future studies, changes and overall ideas have been shared and decided so that every participant, together, can achieve high quality results and outcomes for the client. The 3D model containing the auditorium and atrium has been given as a fixed model from the architect, where WSPs responsibilities have been to analyse and give applicable recommendations for future decisions.
1.3 Objectives
The main objective of this thesis and study is to clarify and state the outcome from the client’s brief in regard to daylight & visual comfort from a consultant’s point of view in building design. It also looks into the relationship created as a result of value-based decisions regarding the visual comfort, connectivity, daylight availability and blind selection for one auditorium and atrium. Daylight and the visual comfort will be explored in a real life project assigned by a real client where it will be shown how one can achieve good daylight and visual comfort conditions for one atrium (office space) and auditorium. The idea is to implement this philosophy within each analysis whilst satisfying the clients need with a motivated outcome. The material produced from this thesis is basically an attempt to help the client and architects make decisions with the best conceivable intention towards a good design and value engineering, based on the client’s brief. This thesis deviates therefore from the standard scientific report and will instead try to reflect the actual work and design process made from a real

Ludde Gölén
Introduction
3
consultancy company project with help from the applicable results & conclusions made related to the objectives.
1.4 Scope
Daylight and visual comfort will be analysed in perspective of windows, positioning, blind options, glare, location, direction, reflectance, luminance ratio, daylight glare probability and sense in time of day. The conflict created as a result of value-based decisions will be analysed in perspective of the daylight studies, help from experienced consultants and lastly in perspective of costs related to what the owner hypothetically has to pay in salaries over a year (see conflict chapters). Conflicts from value-based decisions are not the focus of this thesis but instead interesting to see how it correlates for the auditorium and atrium spaces. The conflict or relationship created as a result of value-based decisions for this thesis is in the meaning of consequences, where a solution or decision regarding the visual comfort, connectivity, daylight availability and blind selection consequently will affect the outcome of one or the other when simultaneously seeking for high performance of the outcomes. E.g. the consequence of adding blinds to a glazing (value-based decision) and creating visual comfort might result in a reduction in daylight availability etc. Hence there is a conflict or relationship as a result of a value-based decision. The thesis will not include analysis of embodied energy, the environmental footprint, photovoltaic, solar thermal and life cycle cost analysis. Information about the building envelope and HVAC system has not been received in this stage of design and will therefore not be included in this thesis. Focus lay in solving daylight and visual comfort issues and information about the envelope & HVAC system is consequently not relevant for this study. Different assumptions and targets that are set and stated in relation to daylight and visual comfort have been chosen in early stage meetings and alongside the work process. Only an atrium & auditorium for an office development in London will be analysed and presented in this thesis.
Ludde Gölén
Methodology
4
2 Methodology
WSP design process and work methodology is to understand the principles before any analysis which creates a strong and proficient approach to clients and the various projects WSP participate in. This can be expressed with certain steps or ideas of how to design and derive to an end result. The methodology for each case study (auditorium & atrium) within this thesis will therefore follow certain steps throughout the research and analysis to obtain prominent results. Certain steps will deviate from WSP design process and have been added to make this thesis as scientific as possible. See below:
1. Literature review.
2. Receive and understand the clients’ brief and objectives.
3. Illustrate interpretation of results.
4. High performance analysis with reliable and validated software’s, to
identify and overcome potential problems with regard to clients’ brief.
Software’s that will be used:
- Rhinoceros 5 (3D modelling tool)
- Plug-in DIVA for Rhino (daylight analysis tool).
- Ecotect 2011 (daylight & building analysis tool).
- Radiance (render daylight and lighting scenes).
(All the analysis has been conducted from the WSP Cambridge office and
the tools above have therefore been used in this thesis).
5. Analyse and present results and point out the overall conceptual ideas &
strategies that achieve visual comfort. Present in an understandable way
and complete the client’s brief.
Secondly present and show outcomes from the analysed relationship
created as a result of value-based decisions regarding the IEQ and blind
selection for each case study.
6. Conclude and discuss the various results given from the analysis made.
The intention is to build the analysis chapters from these steps and by that also give the reader a perspective of the consultant’s point of view and work process. As mentioned before, each daylight chapter represents or follows the stages that material have been produced and presented to the client, which unintentionally therefore will reflect the process and relationship between the client and the consultant.

Ludde Gölén
Methodology
5
2.1 Software Use & Information
2.1.1 Rhinoceros 5 & DIVA-for-Rhino
Rhinoceros 5 is a common 3D modelling tool for architects and designers within the building industry. The software can among other things create, analyse, render and edit different scenes and structures. Its main purpose is to create and build models for different analysis. DIVA-for-Rhino is a highly optimized daylighting and energy modelling plug-in for Rhinoceros 5. The plug-in was initially developed at the Graduate School of Design at Harvard University and is now distributed and developed by Solemma LLC. DIVA-for-Rhino allow users to carry out a series of environmental performance evaluations of individual buildings and urban landscapes including example: radiation maps, photorealistic renderings, climate-based daylighting metrics and annual & individual time step glare analysis (Lagios, 2012). Use in Thesis Rhinoceros 5 is used to model 3D objects/buildings that later can be analysed with DIVA. DIVA is used to simulate and analyse for example daylight autonomy, point in time glare, annual glare and photorealistic renderings (evaluating visual comfort).
2.1.2 Ecotect 2011
Ecotect is a comprehensive concept-to-detail design tool. Ecotect Analysis offers a wide range of simulation and building energy analysis functionality that can improve performance of existing buildings and new building designs. Tools within the software enable one to visualize and simulate a building's performance within the context of its environment. Ecotect 2011 is good for: whole-building energy analysis, thermal performance, water usage and cost evaluation, solar radiation, daylighting and shadows & reflections (Autodesk, 2014). Use in Thesis Ecotect 2011 is used to create sun path diagrams to evaluate direct sunlight. It is also used to produce readable scripts and files for Radiance, to be able to run through cloud computing which produce photorealistic images with Radiance.
Ludde Gölén
Methodology
6
2.1.3 Radiance
Radiance is a suite of programs for the analysis and visualizations of lighting in design. Input files specify the scene geometry, materials, luminaires, time, date and sky conditions. Calculated values include spectral radiance, irradiance and glare indices. Simulation results may be displayed as colour images, numerical values and contour plots (Radiance, Synthetic Imaging System, 2002). The primary advantage of Radiance over simpler lighting calculation and rendering tool is that there are no limitations on the geometry or the materials that may be simulated. Radiance is used by architects and engineers to predict illumination, visual quality and appearance of innovative design spaces, and by researchers to evaluate new lighting and daylighting technologies (Radiance, Synthetic Imaging System, 2002). Use in Thesis Radiance is used to produce daylight renderings evaluating visual comfort and brightness ratio between focal point and surrounding objects for different scenes and time of day. It uses input files (as mentioned above) produced from Ecotect that later are transferred to Linux (cloud computing) and calculated with Radiance to produce high quality daylight renderings. Cloud computing using Radiance is used to generate multiple rendered images within a short time stretch. Cloud computing is a way of connecting to external computers that can run multiple renderings among multiple computers and cores i.e. one does not have to make one simulation at a time, instead perhaps 20 images can be produced over a much shorter time period and length than doing it individually from one computer.
2.2 LOB, London Office Building
LOB is a large office building being developed for a business shareholder company in London. At this stage it is a confidential project and therefore goes under the name above or short for LOB. LOB contains many interesting and modern spaces and solutions, especially one auditorium and atrium. This thesis will analyse these spaces with regard to daylight & visual comfort and the possible conflict created as a result of value-based decisions.

Ludde Gölén
Methodology
7
2.2.1 RIBA plan of work
RIBA plan of work is the guideline used in the UK for building related developments and refurbishments. RIBA plan of work is not used in this thesis more than to illustrate the design process used in the UK and to show at what stage the LOB project is in. RIBA plan of work was first developed in 1963 and is the definitive UK model for the building design and construction process containing eight stages:
1. Strategic definition (identify client’s business case and strategic brief and
other core project requirements).
2. Preparation and brief (develop project objectives).
3. Concept design (prepare concept design, including outline proposals for
structural design, building services systems, outline specifications and
preliminary cost information along with relevant project strategies in
accordance with design programme. Final project brief).
4. Developed design (prepare developed design, including coordinated
and updated proposals for structural design, building services systems,
outline specifications, cost information and project strategies in
accordance with design programme).
5. Technical design (prepares technical design in accordance with design
responsibility matrix and project strategies to include every participant
in accordance with design programme).
6. Construction (offsite manufacturing and onsite construction in
accordance with construction programme and resolution of design
queries from site as they arise).
7. Handover and close out (handover of building and conclusion of building
contract).
8. In use (undertake in use services in accordance with schedule of
services).
(Royal Institute of British Architects, 2013). This study was made between stages three and four where WSP inputs and results has an effect on how the conceptual design and building service will be applied. WSP is only looking at the daylight design for the London Office Building where the daylight studies could have an impact on the design of the atrium and auditorium if wanted.
Ludde Gölén
Methodology
8
2.2.2 Site & Building Information
This chapter is intended to give the reader some perspective of the building, climate and surrounding conditions in regard to the objectives of this thesis. Detailed measurements and information were not given for the overall building (more than received 3D-model, which focus on the atrium and auditorium) and will therefore not be presented in this chapter. Instead will the auditorium and atrium chapters contain more detailed measurements and information since that is more relevant for this thesis. LOB is located in London, United Kingdom, with an East oriented main façade. LOB aims to be built as a modern and high quality building with high end architectural emphasis and solutions. High focus was on creating a natural daylit space with high visual comfort. To increase and keep a high performance level among workers, as well as creating a light, fresh and transparent atmosphere and building. This is especially applied for the atrium and auditorium which will have large quantity of windows in relation to wall area (more information in the “auditorium” and “atrium” chapters). The building will be operating from early mornings until evenings during weekdays with high internal loads from computers, printers and other indoor appliances. This is also applied for the atrium.
Ludde Gölén
Methodology
9
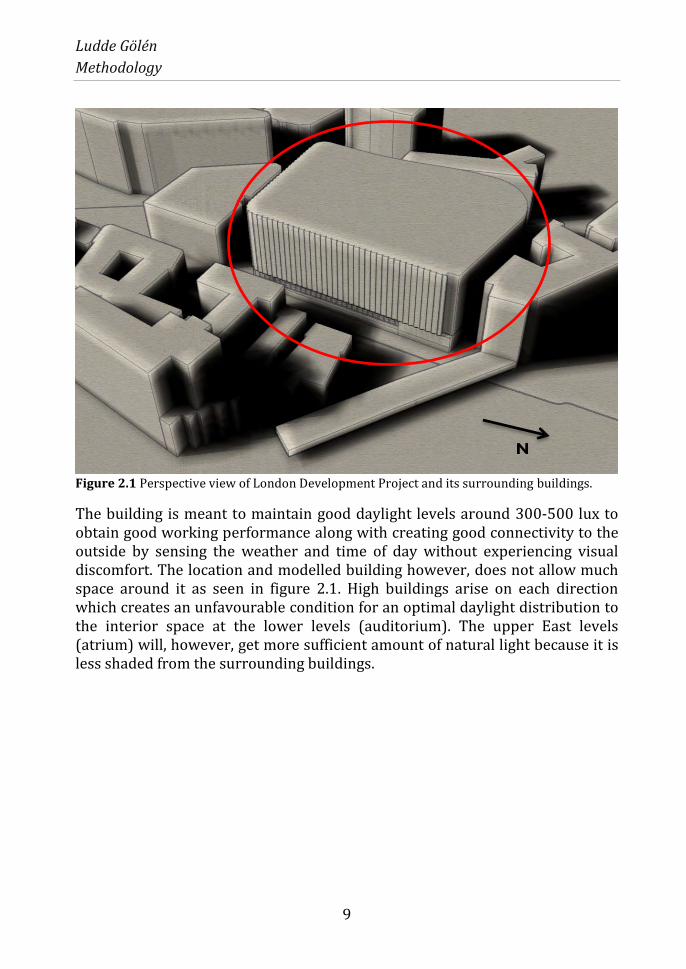
Figure 2.1 Perspective view of London Development Project and its surrounding buildings.
The building is meant to maintain good daylight levels around 300-500 lux to obtain good working performance along with creating good connectivity to the outside by sensing the weather and time of day without experiencing visual discomfort. The location and modelled building however, does not allow much space around it as seen in figure 2.1. High buildings arise on each direction which creates an unfavourable condition for an optimal daylight distribution to the interior space at the lower levels (auditorium). The upper East levels (atrium) will, however, get more sufficient amount of natural light because it is less shaded from the surrounding buildings.
N
Ludde Gölén
Methodology
10
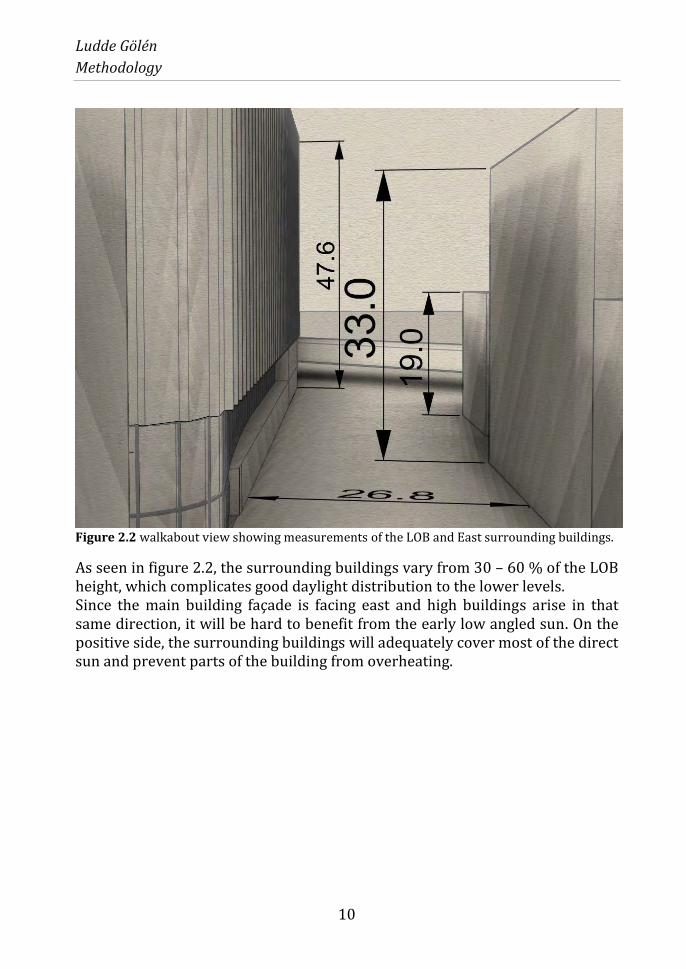
Figure 2.2 walkabout view showing measurements of the LOB and East surrounding buildings.
As seen in figure 2.2, the surrounding buildings vary from 30 – 60 % of the LOB height, which complicates good daylight distribution to the lower levels. Since the main building façade is facing east and high buildings arise in that same direction, it will be hard to benefit from the early low angled sun. On the positive side, the surrounding buildings will adequately cover most of the direct sun and prevent parts of the building from overheating.
Ludde Gölén
Methodology
11
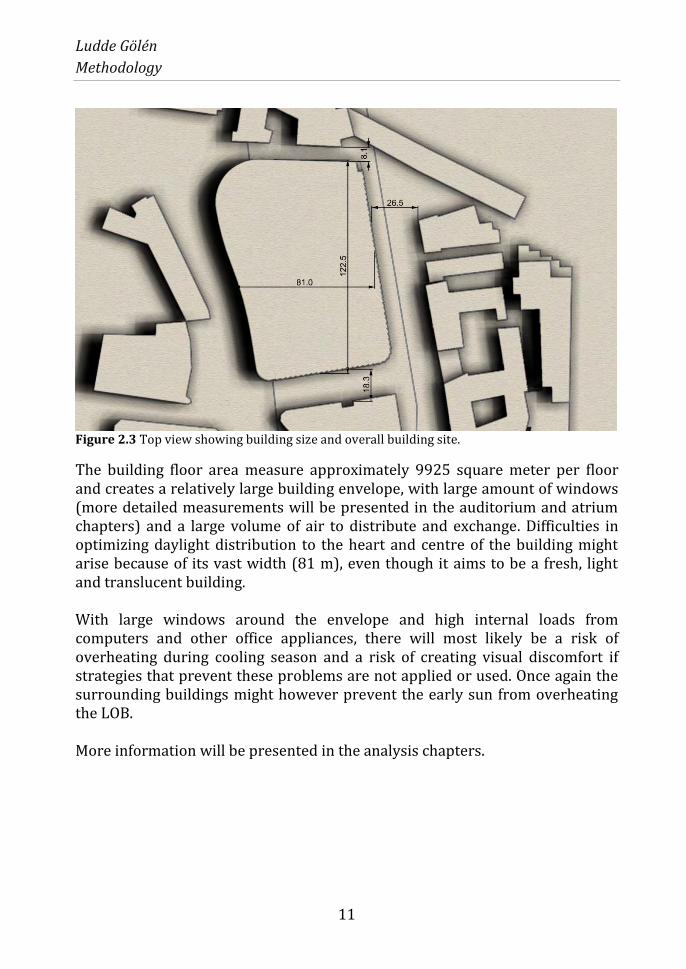
Figure 2.3 Top view showing building size and overall building site.
The building floor area measure approximately 9925 square meter per floor and creates a relatively large building envelope, with large amount of windows (more detailed measurements will be presented in the auditorium and atrium chapters) and a large volume of air to distribute and exchange. Difficulties in optimizing daylight distribution to the heart and centre of the building might arise because of its vast width (81 m), even though it aims to be a fresh, light and translucent building. With large windows around the envelope and high internal loads from computers and other office appliances, there will most likely be a risk of overheating during cooling season and a risk of creating visual discomfort if strategies that prevent these problems are not applied or used. Once again the surrounding buildings might however prevent the early sun from overheating the LOB. More information will be presented in the analysis chapters.

Ludde Gölén
Methodology
12
Climate
Figure 2.4 Picture showing average (middle line), minimum and maximum temperature for London.
London has a moderately mild climate with few degrees below zero. This mild and cool climate give the user a perfect opportunity to use fresh air by natural ventilation during heating season, to procure a more preferable indoor climate, as well as a reduced monthly energy bill. Another useful tool to reduce ones monthly energy bill in this mild climate is to optimize daylight to enter during heating season and free heating can be utilized. Especially with large windows that allow large quantities of light to enter. The middle line above represents the average temperature in London, whereas the upper line stands for the maximum temperature and the lower line stands for the minimum temperature in London.

Ludde Gölén
Analysis & Results
13
3 Analysis & Results
This chapter constitutes the core analysis of this thesis containing daylight studies for the auditorium and atrium spaces. The goal is to investigate the occurrence of direct sun, the magnitude of daylight availability (daylight autonomy) and finally achieve visual comfort for the two spaces. Various conflicts that may occur for the two spaces will also be discussed in this chapter. Chapters are presented in that order it was presented to the client and contains sufficient material which the client and architect have used to make relevant decisions regarding the LOB project and its associated daylight issues.
3.1 Auditorium Study
The auditorium is meant to hold early morning meetings, update meetings, lectures and other work related sittings for approximately 400 people from around 7am – 18 pm during weekdays. The auditorium is located on the ground and upper ground floor with large (6m x 2.8 m) windows facing east. The audience is also facing east when looking at the presenter and screen. Geometry Table 3.1 Geometry for Auditorium space
Total floor area 1400 m2 Ceiling height, ground floor 11.1 m Ceiling height, mezzanine floor 6.95 m Glazing size & Total glazing area 2.8 x 6 m respectively 252 m2 Internal glazing size & Total glazing area 1.4 x 3 m respectively 67.2 m2
Figure 3.1 perspective view from the mezzanine, looking over the auditorium.
Ludde Gölén
Analysis & Results
14
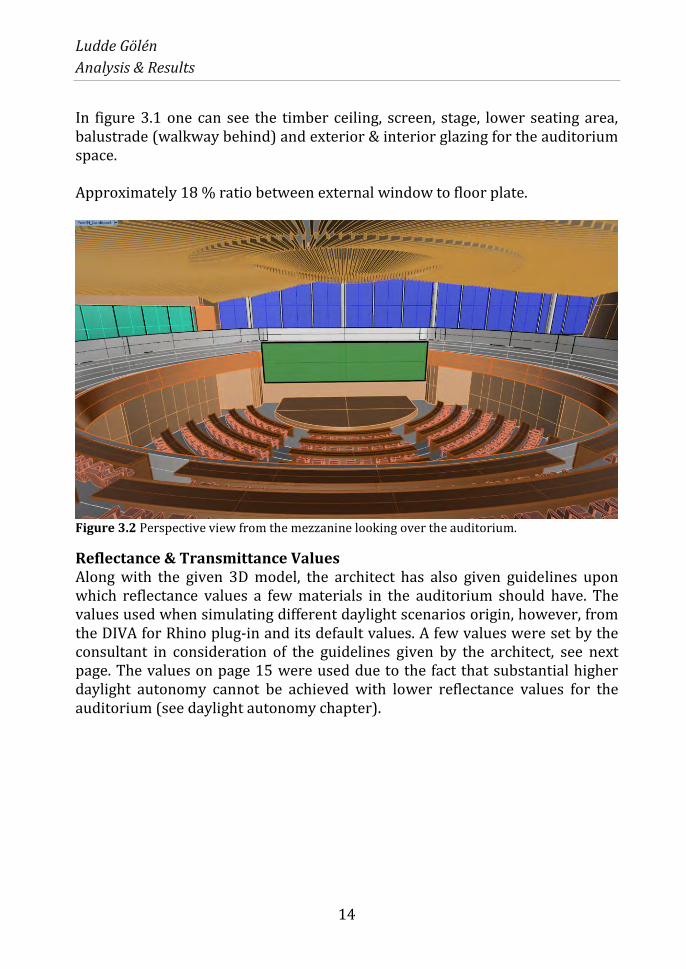
In figure 3.1 one can see the timber ceiling, screen, stage, lower seating area, balustrade (walkway behind) and exterior & interior glazing for the auditorium space. Approximately 18 % ratio between external window to floor plate.
Figure 3.2 Perspective view from the mezzanine looking over the auditorium.
Reflectance & Transmittance Values Along with the given 3D model, the architect has also given guidelines upon which reflectance values a few materials in the auditorium should have. The values used when simulating different daylight scenarios origin, however, from the DIVA for Rhino plug-in and its default values. A few values were set by the consultant in consideration of the guidelines given by the architect, see next page. The values on page 15 were used due to the fact that substantial higher daylight autonomy cannot be achieved with lower reflectance values for the auditorium (see daylight autonomy chapter).

Ludde Gölén
Analysis & Results
15
Figure 3.3 Different material guidelines given from the architect.
Figure 3.3 guidelines and the Diva for Rhino default values for different materials have led to the reflectance and transmittance values below. These values were used for the various simulations and renderings in the thesis. Table 3.2 Summarised reflectance values
Interior walls 50 % Carpet floor 20 % Exterior walls (incl. surrounding buildings) 35 % Exterior pathway 20 % Desks 20 % Chairs 20 % Timber ceiling 50 % Black ceiling (above timber ceiling) 50 % Balustrade 50 % Copper geometry 50 % Screen 250 cd/m2 when turned ON Exterior glazing (double pane) 65 % Transmittance Internal glazing (single pane) 88 % Transmittance
Ludde Gölén
Analysis & Results
16
3.1.1 Clients’ Brief
A client’s brief is a platform to communicate important benchmarks and information among participants (in this case between client and consultant). The client’s brief was in this case created in an early stage meeting where criteria, targets and way of measurements in regard to daylight and the auditorium space were decided. Criteria The Client’s request regarding the auditorium:
The occupants should sense change in weather and time of day.
Optimize the use of natural light.
Maintain good contrast and visual comfort levels for the presenter and
audience.
Target What to look for:
Clouds passing in front of the sun should be noticeable. Natural light
conditions should vary based on time of day.
Achieve levels of natural light in the space that can enable reductions in
electric lighting.
Glazing brightness should not be kept substantially brighter than the
primary focus on stage.
Way of measurement Achieve substantial change in brightness level measured on vertical
surfaces (glazing) between sunny and cloudy sky.
Compare the frequency (% time, Daylight Autonomy) that key
illuminance level thresholds (eg 500 lux) are achieved on the horizontal
plane (ground floor and desk level) for different options.
Daylight renderings with viewpoints from the audience comparing
luminance on glazing and presenter/screen.
Ludde Gölén
Analysis & Results
17
3.1.2 Sun Path Diagram
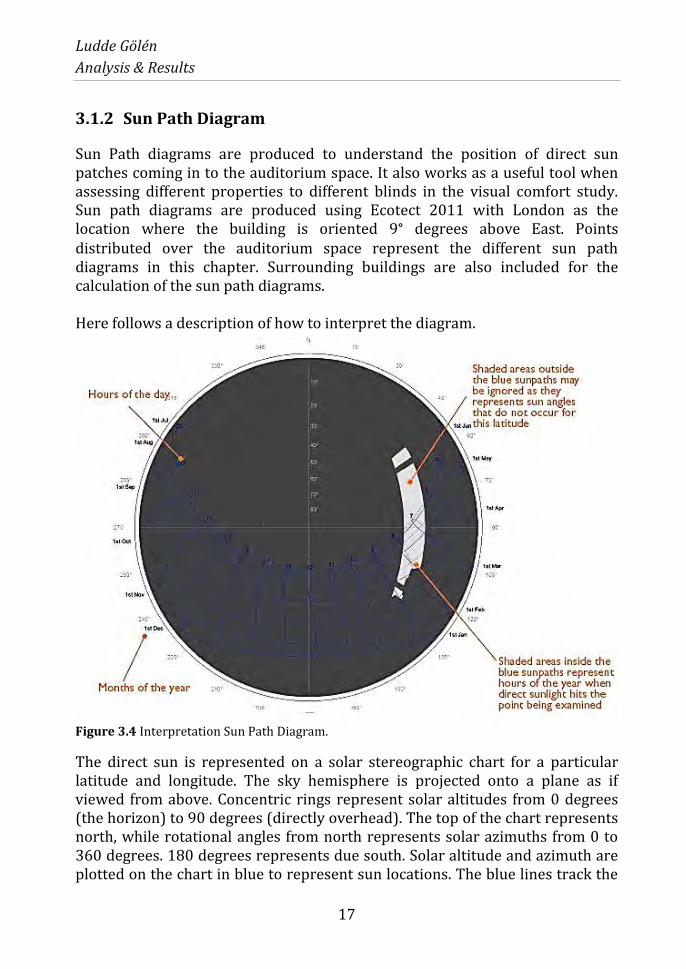
Sun Path diagrams are produced to understand the position of direct sun patches coming in to the auditorium space. It also works as a useful tool when assessing different properties to different blinds in the visual comfort study. Sun path diagrams are produced using Ecotect 2011 with London as the location where the building is oriented 9° degrees above East. Points distributed over the auditorium space represent the different sun path diagrams in this chapter. Surrounding buildings are also included for the calculation of the sun path diagrams. Here follows a description of how to interpret the diagram.
Figure 3.4 Interpretation Sun Path Diagram.
The direct sun is represented on a solar stereographic chart for a particular latitude and longitude. The sky hemisphere is projected onto a plane as if viewed from above. Concentric rings represent solar altitudes from 0 degrees (the horizon) to 90 degrees (directly overhead). The top of the chart represents north, while rotational angles from north represents solar azimuths from 0 to 360 degrees. 180 degrees represents due south. Solar altitude and azimuth are plotted on the chart in blue to represent sun locations. The blue lines track the

Ludde Gölén
Analysis & Results
18
sun’s path from sunrise to sunset for each month of the year, as labelled on the right and left sides of the graph. Crossing over these lines are shorter ones representing times of the day. Altered points across the space have been chosen to represent the amount of direct sun in the auditorium. If direct sun enters the auditorium space over longer hours, direct sun control for potential blinds might be needed. Point A-I represents a seat among the audience. Point J-L does not represent a seat but rather points on the balcony overhang from the mezzanine. Point M-O represents people seating points in the upper balcony. Point P & Q represent points on the walkway above and behind the stage.
Figure 3.5 The various points representing direct sun across the auditorium space.
The produced sun path diagrams represented in this chapter starts with Point A and follows until point Q. Not all of the points and its corresponding sun path diagram will be represented here due to similar results and images (see appendix A for complete scope).

Ludde Gölén
Analysis & Results
19
Figure 3.6 Point A first row.
Almost no direct sun hits point A except for half an hour between 8-9 AM around June – July. This is seemingly a small amount of direct sun, but it is still direct sun and a person being seated around this point and hour will most likely experience visual discomfort.

Ludde Gölén
Analysis & Results
20
Figure 3.7 Point B first row.
Point B receives direct sunlight for less than one hour on spring, summer and fall mornings. Like point A, this is not much direct sunlight but still direct sunlight and a person being seated around point B will most likely experience visual discomfort. Point C receives a negligible amount of direct sun.
Ludde Gölén
Analysis & Results
21
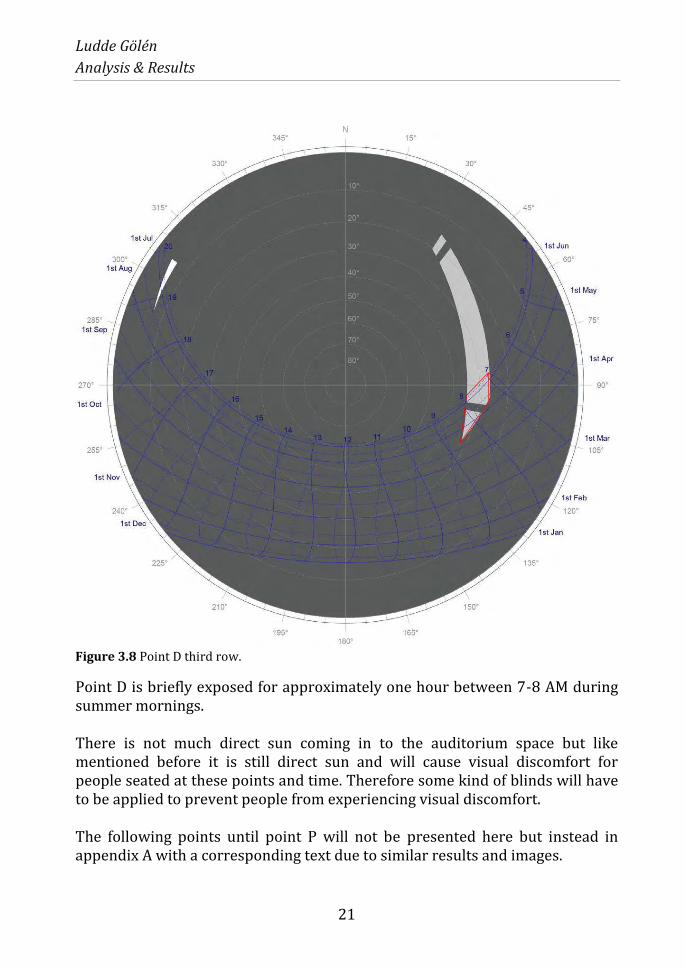
Figure 3.8 Point D third row.
Point D is briefly exposed for approximately one hour between 7-8 AM during summer mornings. There is not much direct sun coming in to the auditorium space but like mentioned before it is still direct sun and will cause visual discomfort for people seated at these points and time. Therefore some kind of blinds will have to be applied to prevent people from experiencing visual discomfort. The following points until point P will not be presented here but instead in appendix A with a corresponding text due to similar results and images.
Ludde Gölén
Analysis & Results
22
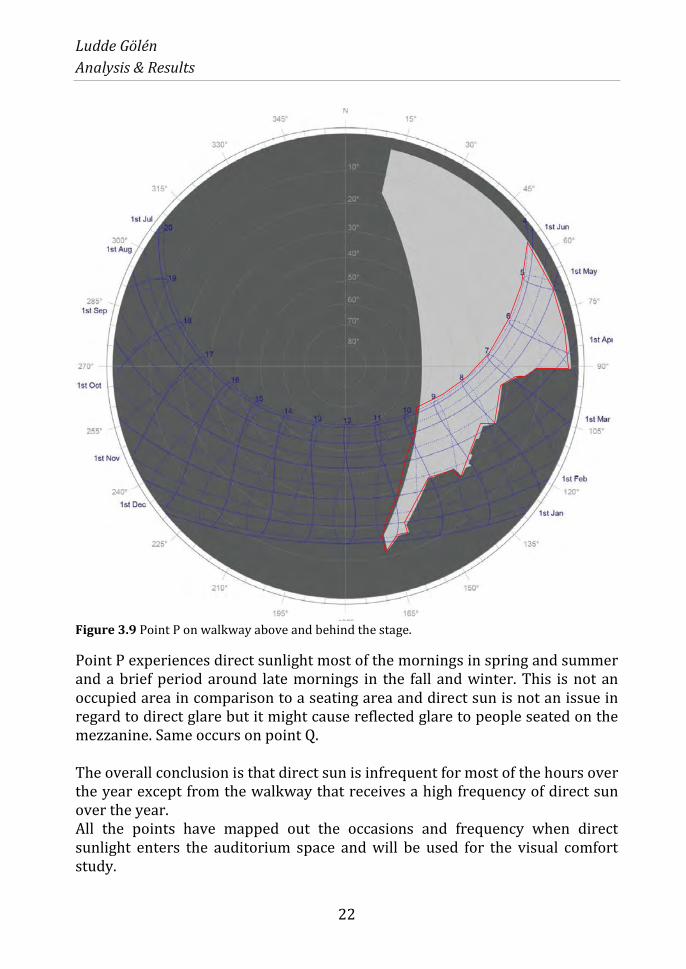
Figure 3.9 Point P on walkway above and behind the stage.
Point P experiences direct sunlight most of the mornings in spring and summer and a brief period around late mornings in the fall and winter. This is not an occupied area in comparison to a seating area and direct sun is not an issue in regard to direct glare but it might cause reflected glare to people seated on the mezzanine. Same occurs on point Q. The overall conclusion is that direct sun is infrequent for most of the hours over the year except from the walkway that receives a high frequency of direct sun over the year. All the points have mapped out the occasions and frequency when direct sunlight enters the auditorium space and will be used for the visual comfort study.
Ludde Gölén
Analysis & Results
23
3.1.3 Daylight Autonomy
Daylight autonomy is analysed to understand and procure a safe and satisfactory level of natural light in the auditorium space. Daylight autonomy calculations are produced via Rhinoceros 5 and Diva for Rhino. The space varies in levels and usage so different lux targets were set to be met. Lux is the unit for illuminance which is a measurement of how much the incident light (luminous flux) illuminates a surface (METREL, 2002). This is not only to see how much natural light enters the space, it also informs whether there is value in varying blind and finish properties to improve natural light levels for the auditorium and if daylight control can be used to reduce electrical demand. Target light levels: These targets have been set by consultants participating in this study.
500 Lux – Desks in conference mode
300 Lux – Desks in conference with less desk based visual acuity
requirements.
200 Lux – Break out area requirement and seating maintenance.
100 Lux - Circulation lighting requirement.
Daylight autonomy is in this case defined as “percentage of occupied hours per year when the targeted illuminance level can be maintained by daylight alone”. The lower lux targets are first being analysed to see if there is sufficient amount of light entering the auditorium space at all. Daylight autonomy for the auditorium is calculated with blinds assumed being up all year around with an occupancy schedule between 09:00 a.m. – 17:00 p.m. during weekdays.
Ludde Gölén
Analysis & Results
24
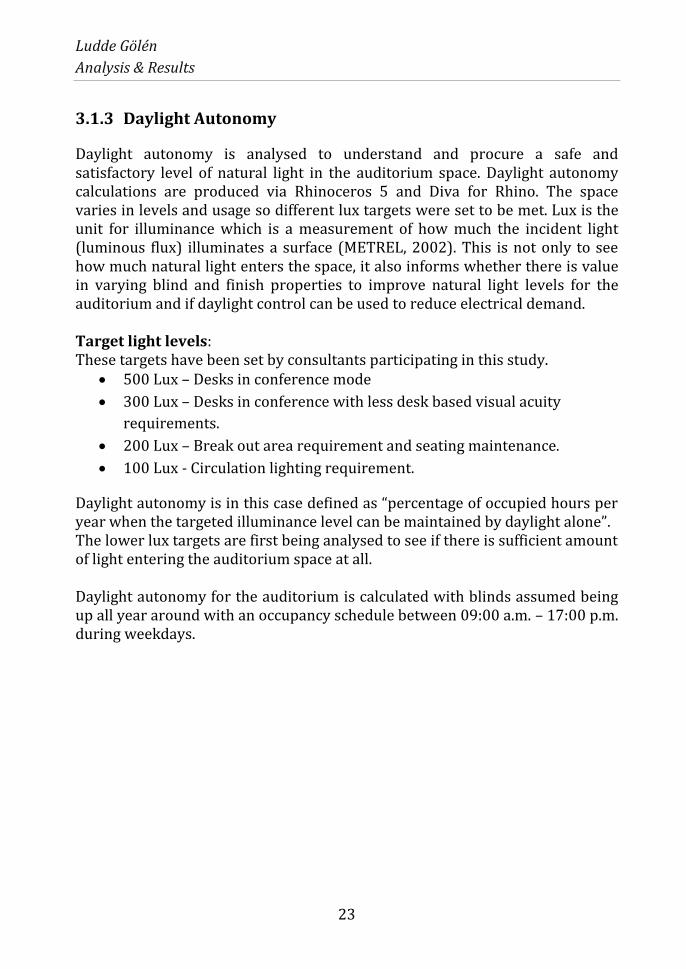
Circulation level (100 lux target): This is calculated for circulation area on ground and mezzanine floor.
Figure 3.10 Daylight autonomy for 100 lux target on circulation area. The black highlighted area represents the mezzanine floor.
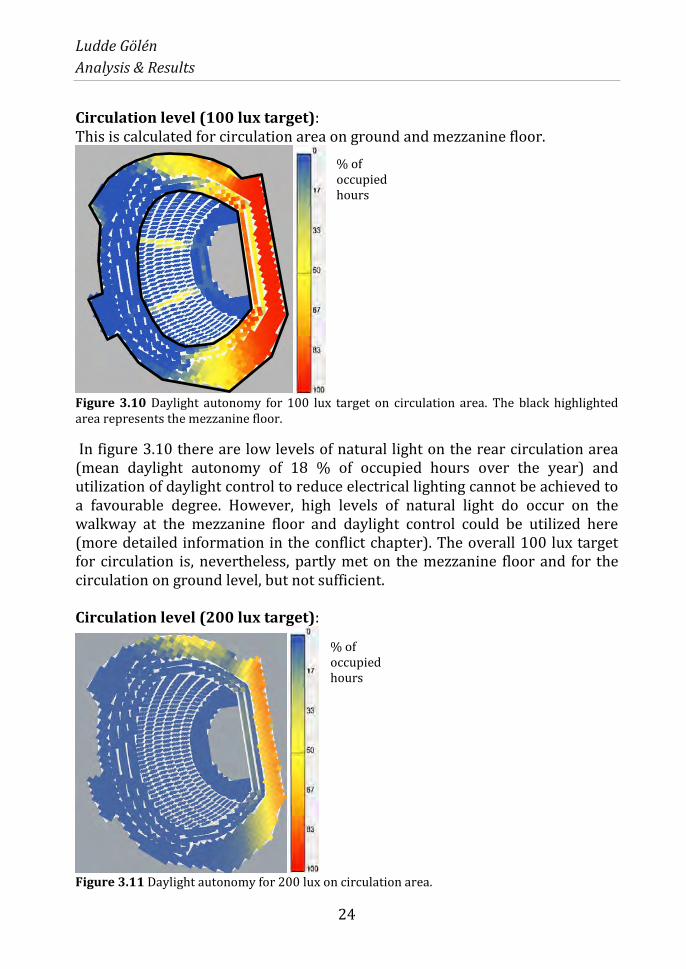
In figure 3.10 there are low levels of natural light on the rear circulation area (mean daylight autonomy of 18 % of occupied hours over the year) and utilization of daylight control to reduce electrical lighting cannot be achieved to a favourable degree. However, high levels of natural light do occur on the walkway at the mezzanine floor and daylight control could be utilized here (more detailed information in the conflict chapter). The overall 100 lux target for circulation is, nevertheless, partly met on the mezzanine floor and for the circulation on ground level, but not sufficient. Circulation level (200 lux target):
Figure 3.11 Daylight autonomy for 200 lux on circulation area.
% of occupied hours
% of occupied hours

Ludde Gölén
Analysis & Results
25
There is not a major change in daylight autonomy for the 200 lux target compared to the 100 lux target more than less occupied hours where the set target is met (mean daylight autonomy of 11 % for occupied hours over the year). Daylight control around the walkway is still applicable to reduce electrical lighting demand. It can therefore be said that even with its grand windows there is still not enough natural light in the auditorium space. The poor Daylight autonomy results for circulation level will not be a key factor in determining material finishes or blind selection as there are no meaningful ways to substantially improve this daylight performance to be beneficial or considerable. Hence, there is no value in looking at higher lux targets (300 & 500 lux) for the circulation area. Desk level (100 lux target): This is calculated on desk level (approximately 0.8 m above floor level).
Figure 3.12 Daylight autonomy for 100 lux at desk level.
Mean daylight autonomy of 22 % of occupied hours over the year when the targeted lux level is met for the desk area. Sufficient desk light is not enough to be supplied by daylight alone and relying in artificial lighting to adequately meet the target is needed. There is not enough daylight to benefit from daylight control due to the low DA values produced on desk level.
% of occupied hours

Ludde Gölén
Analysis & Results
26
Desk Level (200 lux target) Table 3.3 Summarised DA results
Figure 3.13 Daylight Autonomy for 200 lux at desk level.
There is very little natural light projecting the desk level at 200 lux target (mean daylight autonomy of 3 % of occupied hours over the year) and use of daylight control to reduce electrical lighting for the desks are inconvenient. Like the circulation area, daylight autonomy should not be the main factor for choice of material finishes or blind selection as the DA is unfortunately too low to benefit from this. However, one solution would be to install LED task light to be able to some extent reduce electrical lighting demands. If the client wants higher natural light levels in the auditorium space, there would have to be substantial modifications and suggestions to the model which is impractical and inappropriate in this stage of design. Further focus lay in solving the visual comfort issue and blind selection which evidently also became the highest focus (i.e. lack of daylight).
3.1.4 Visual Comfort Study
The objective of this study is to report on the visual comfort and sense in time of day. It informs and outlines what kind of blinds and finish properties to choose along with a better understanding of how to achieve high performance in regard to visual comfort in the auditorium. In the “conflict” chapter, the value in applying a blind for a space is discussed and, if applied, is there value in having more than one blind added to a glazing and space (depending on different glare sources).
Task Area Mean Daylight Autonomy
Circulation Level(100 lux)
18 %
Circulation Level(200 lux)
11 %
Desk Level(100 lux)
22 %
Desk Level(200 lux)
3 %
% of occupied hours
Ludde Gölén
Analysis & Results
27
Results in this study is built on a set of images and on comparison of options based on a range of metrics such as different blind properties, difference in daylight glare probability and difference in luminance ratio among objects in the field of view etc. This is important because although methods for measuring impacts are available, there are no standards that establish thresholds for acceptability for this space.
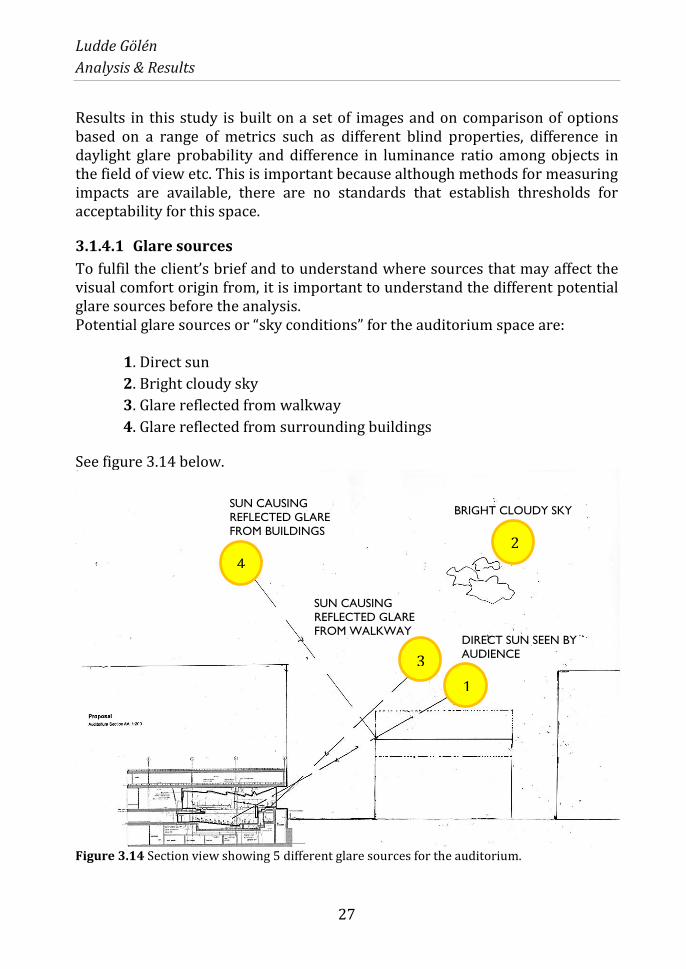
3.1.4.1 Glare sources
To fulfil the client’s brief and to understand where sources that may affect the visual comfort origin from, it is important to understand the different potential glare sources before the analysis. Potential glare sources or “sky conditions” for the auditorium space are:
1. Direct sun
2. Bright cloudy sky
3. Glare reflected from walkway
4. Glare reflected from surrounding buildings
See figure 3.14 below.
Figure 3.14 Section view showing 5 different glare sources for the auditorium.
2
44444
1
SUN CAUSING
REFLECTED GLARE
FROM WALKWAY
BRIGHT CLOUDY SKY SUN CAUSING
REFLECTED GLARE
FROM BUILDINGS
DIRECT SUN SEEN BY
AUDIENCE 3

Ludde Gölén
Analysis & Results
28
These conditions occur during different dates and hours over the year, see below. These will be analysed in regard to visual comfort. These dates and hours were carefully chosen with help from the Rhinoceros software (meaning these conditions occur with the highest intensity during these dates and hours according to Rhinoceros software and analysis made).
Condition 1 represents 3 July at 07:30 a.m.
Condition 2 represents 3 July at 10:00 a.m.
Condition 3 represents 4 October at 09:30 a.m.
Condition 4 represents 1 July at 13:30 p.m.
3.1.4.2 Interpretation of results
The four different skies or glare sources will be analysed and simulated via Rhinoceros 5 and the daylight plug in Diva for Rhino from four points during the chosen dates and times above. Each simulated point will produce a certain amount of images with both sunny and cloudy sky where Daylight Glare Probability (DGP), Luminance ratio and contrast between the images are compared with different blind properties applied to the exterior glazing. This is useful when determining the overall suitable blinds that achieve visual comfort in the auditorium space (look further in blind selection chapter).
Figure 3.15 Figure showing analysing points.
A
B
D
C

Ludde Gölén
Analysis & Results
29
Point A will be analysed to identify direct sun and represents condition 1
from the different glare sources.
Point B will be analysed to identify glare from bright cloudy sky and
represents condition 2.
Point C (standing) will be analysed to identify glare reflected from
walkway and represents condition 3.
Point D will be analysed to identify glare reflected from surrounding
buildings and represents condition 4.
The conditions that are being analysed in this thesis was chosen to be analysed from these points due to the fact that the condition either occur from that point or simply has the highest or longest duration of intensity, according to Rhinoceros analysis made. Daylight Glare Probability (DGP) DGP is measured with the program “evalglare”. DGP represents “percent of people disturbed” and is based on human reactions to daylight-based glare (Andersen, 2009). DGP below 20 % is out of range for valued discomfort and considered neglect able (Wienold, 2013). DGP>0.45 = discomfort. DGP<0.35 = does not sufficiently indicate, that you have no problem (personal communication, October 3, 2014). View 2 and 3 evaluating visual comfort in this thesis (Atrium Study) lacks of metrics for use of DGP according to Jan Wienold (personal communication, October 3, 2014) and will therefore not be used for these. DGP values for all other scenes and situations except View 1 is considered unreliable according to Jan Wienold (personal communication, October 3, 2014) due to the fact that these situations deviates from the standard task to surrounding ratio difference. DGP will still be used for these, but only as an indication that either confirms the luminance ratio or not. Luminance ratio will be the defining toll for determining visual comfort. DGP is instead included as a measurement for speculative reasons.
Ludde Gölén
Analysis & Results
30
Luminance ratio Luminance is the objective measurement of brightness calculated in candela per square metre. Luminance ratio is then the simple comparison between the measured brightness of an object in the field of view and surrounding objects (Wilson, 2011). Generally the focal point should be the brightest item in the field of view. Items that is substantially brighter than the focal point will probably be distracting and may cause visual discomfort. To limit discomfort glare these standard luminance ratios should not be exceeded:
1:3 between the task and immediate surroundings.
1:10 between the task and general background.
1:20 between any points within the field of view.
(Araji, 2008).
However, results in the blind selection study will include luminance ratios down to a much lower ratio below the standards mentioned above. This is due to the large quantity of glazing behind the screen (focal point) but mainly to provide a wider range of scenes to the client to choose among. Higher focus lay in providing a suitable design condition according to client needs.
The left side number in the ratio value will always represent the focal point, whereas the right hand number then represents the surrounding object the focal point is being compared to. A worst case, measured bright object (not in the periphery view) around the focal point will always be chosen in the image that is being analysed and will therefore cover the overall measured brightness for the image created. A comparison between sunny and cloudy sky under the same circumstances (meaning for example same blind properties) will inform how well one can sense the time of day and perceive either good or bad connectivity to the outside. A bad connectivity to the outside is if the contrasts between the skies are equal. But if the contrast between them is high (1:10), good connectivity will most likely be perceived and clouds passing by will be noticeable. A standard LCD TV has a brightness of approximately 500 cd/m2 (Hayashi, 2006).
Ludde Gölén
Analysis & Results
31
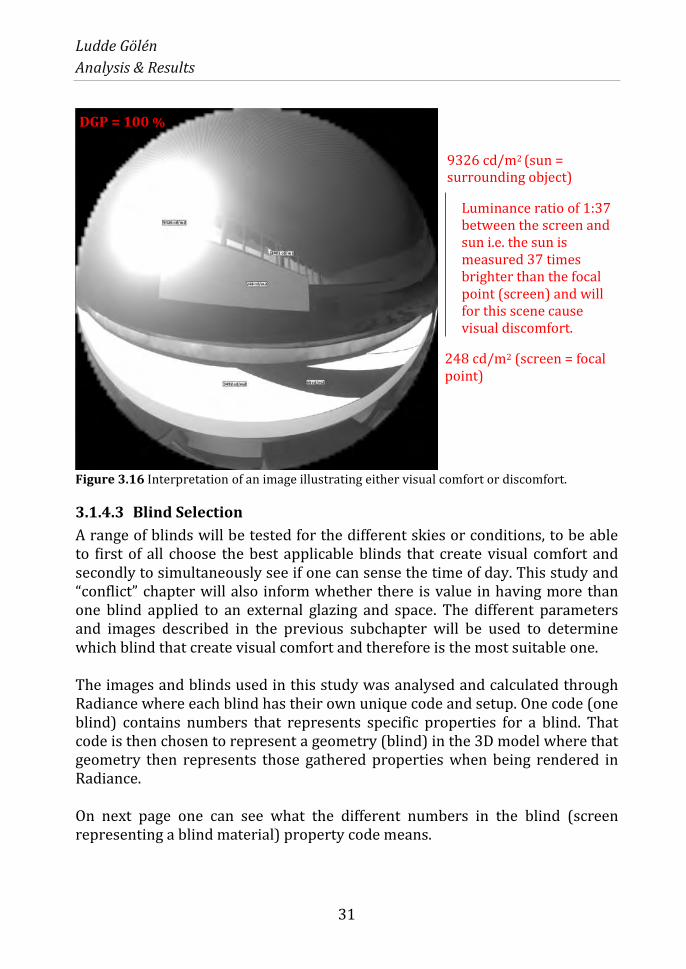
Figure 3.16 Interpretation of an image illustrating either visual comfort or discomfort.
3.1.4.3 Blind Selection
A range of blinds will be tested for the different skies or conditions, to be able to first of all choose the best applicable blinds that create visual comfort and secondly to simultaneously see if one can sense the time of day. This study and “conflict” chapter will also inform whether there is value in having more than one blind applied to an external glazing and space. The different parameters and images described in the previous subchapter will be used to determine which blind that create visual comfort and therefore is the most suitable one. The images and blinds used in this study was analysed and calculated through Radiance where each blind has their own unique code and setup. One code (one blind) contains numbers that represents specific properties for a blind. That code is then chosen to represent a geometry (blind) in the 3D model where that geometry then represents those gathered properties when being rendered in Radiance. On next page one can see what the different numbers in the blind (screen representing a blind material) property code means.
9326 cd/m2 (sun = surrounding object)
248 cd/m2 (screen = focal point)
Luminance ratio of 1:37 between the screen and sun i.e. the sun is measured 37 times brighter than the focal point (screen) and will for this scene cause visual discomfort.
DGP = 100 %
Ludde Gölén
Analysis & Results
32
For example a translucent blind with 50 % visual transmittance and 10 % reflectance will look like: 7 0.6 0.6 0.6 0 0 0.83 0.166.
7: what kind of material the geometry is, in this case translucent
material. 5 is equal to plastic material.
0.6: 60 % of the solar insolation is not absorbed in the blind but instead
goes through. The three 0.6 values also represent a certain colour from
Red, Green and Blue.
0 0: roughness and specularity.
0.83: a value that represents how much light that is being reflected on
the blinds, in this case 10 % which leads to 0.5/0.6 = 0.83.
0.166: the fraction of pervading light not diffusely scattered.
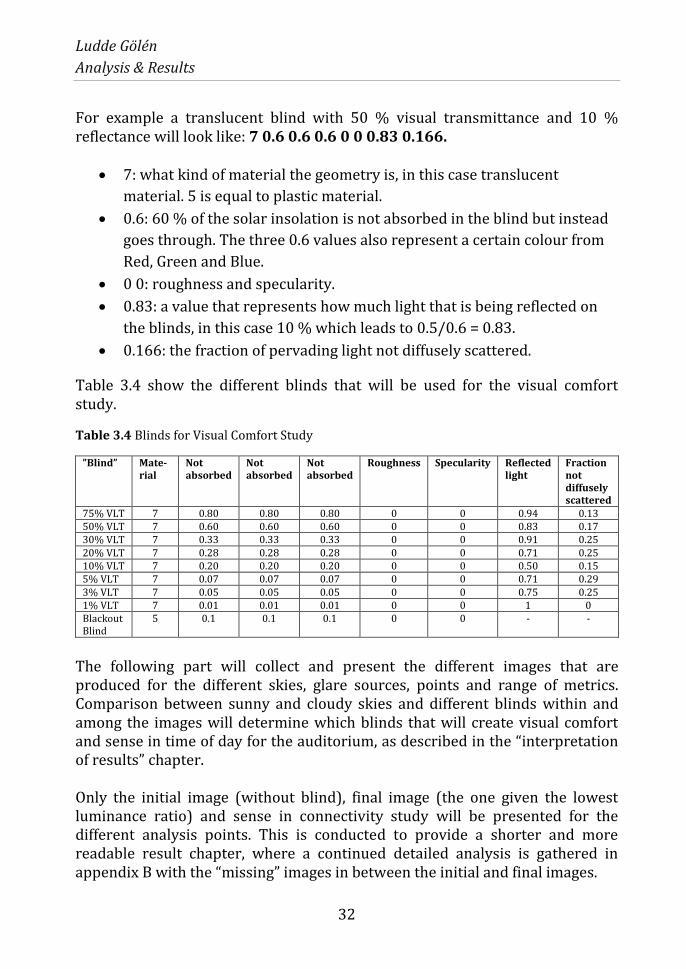
Table 3.4 show the different blinds that will be used for the visual comfort study.
Table 3.4 Blinds for Visual Comfort Study
”Blind” Mate- rial
Not absorbed
Not absorbed
Not absorbed
Roughness Specularity Reflected light
Fraction not diffusely scattered
75% VLT 7 0.80 0.80 0.80 0 0 0.94 0.13 50% VLT 7 0.60 0.60 0.60 0 0 0.83 0.17 30% VLT 7 0.33 0.33 0.33 0 0 0.91 0.25 20% VLT 7 0.28 0.28 0.28 0 0 0.71 0.25 10% VLT 7 0.20 0.20 0.20 0 0 0.50 0.15 5% VLT 7 0.07 0.07 0.07 0 0 0.71 0.29 3% VLT 7 0.05 0.05 0.05 0 0 0.75 0.25 1% VLT 7 0.01 0.01 0.01 0 0 1 0 Blackout Blind
5 0.1 0.1 0.1 0 0 - -
The following part will collect and present the different images that are produced for the different skies, glare sources, points and range of metrics. Comparison between sunny and cloudy skies and different blinds within and among the images will determine which blinds that will create visual comfort and sense in time of day for the auditorium, as described in the “interpretation of results” chapter. Only the initial image (without blind), final image (the one given the lowest luminance ratio) and sense in connectivity study will be presented for the different analysis points. This is conducted to provide a shorter and more readable result chapter, where a continued detailed analysis is gathered in appendix B with the “missing” images in between the initial and final images.
Ludde Gölén
Analysis & Results
33
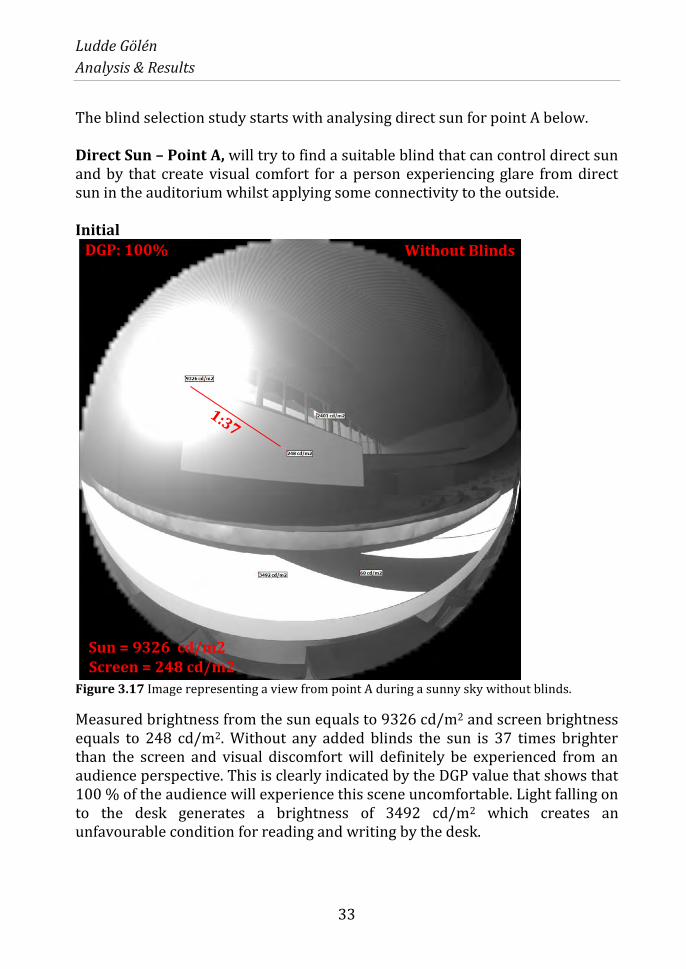
The blind selection study starts with analysing direct sun for point A below. Direct Sun – Point A, will try to find a suitable blind that can control direct sun and by that create visual comfort for a person experiencing glare from direct sun in the auditorium whilst applying some connectivity to the outside. Initial
Figure 3.17 Image representing a view from point A during a sunny sky without blinds.
Measured brightness from the sun equals to 9326 cd/m2 and screen brightness equals to 248 cd/m2. Without any added blinds the sun is 37 times brighter than the screen and visual discomfort will definitely be experienced from an audience perspective. This is clearly indicated by the DGP value that shows that 100 % of the audience will experience this scene uncomfortable. Light falling on to the desk generates a brightness of 3492 cd/m2 which creates an unfavourable condition for reading and writing by the desk.
DGP: 100% Without Blinds
Sun = 9326 cd/m2 Screen = 248 cd/m2
Ludde Gölén
Analysis & Results
34
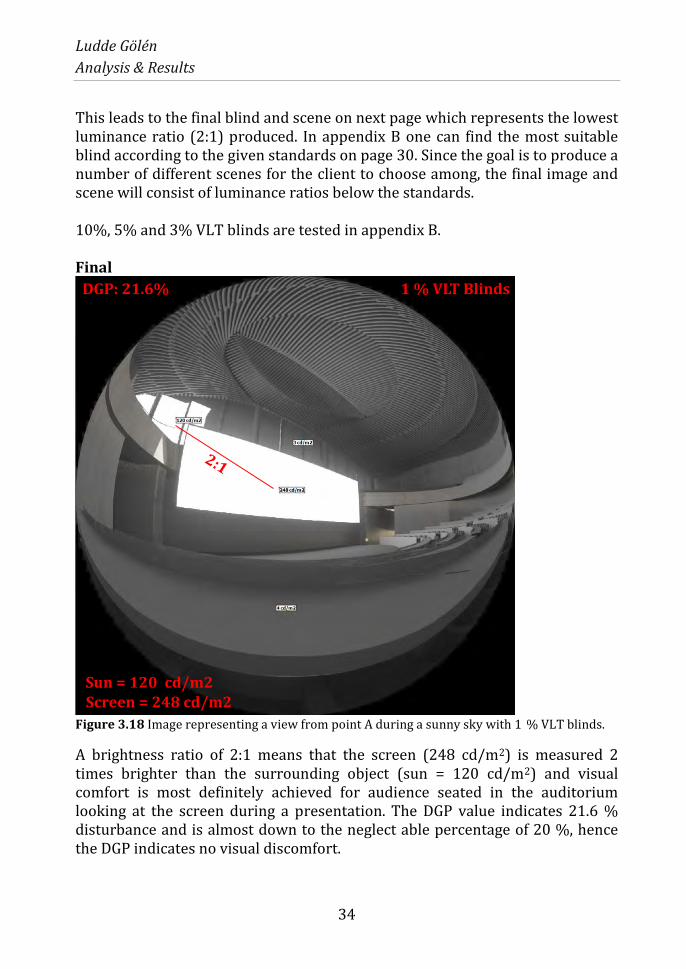
This leads to the final blind and scene on next page which represents the lowest luminance ratio (2:1) produced. In appendix B one can find the most suitable blind according to the given standards on page 30. Since the goal is to produce a number of different scenes for the client to choose among, the final image and scene will consist of luminance ratios below the standards. 10%, 5% and 3% VLT blinds are tested in appendix B. Final
Figure 3.18 Image representing a view from point A during a sunny sky with 1 % VLT blinds.
A brightness ratio of 2:1 means that the screen (248 cd/m2) is measured 2 times brighter than the surrounding object (sun = 120 cd/m2) and visual comfort is most definitely achieved for audience seated in the auditorium looking at the screen during a presentation. The DGP value indicates 21.6 % disturbance and is almost down to the neglect able percentage of 20 %, hence the DGP indicates no visual discomfort.
DGP: 21.6% 1 % VLT Blinds
Sun = 120 cd/m2 Screen = 248 cd/m2
Ludde Gölén
Analysis & Results
35
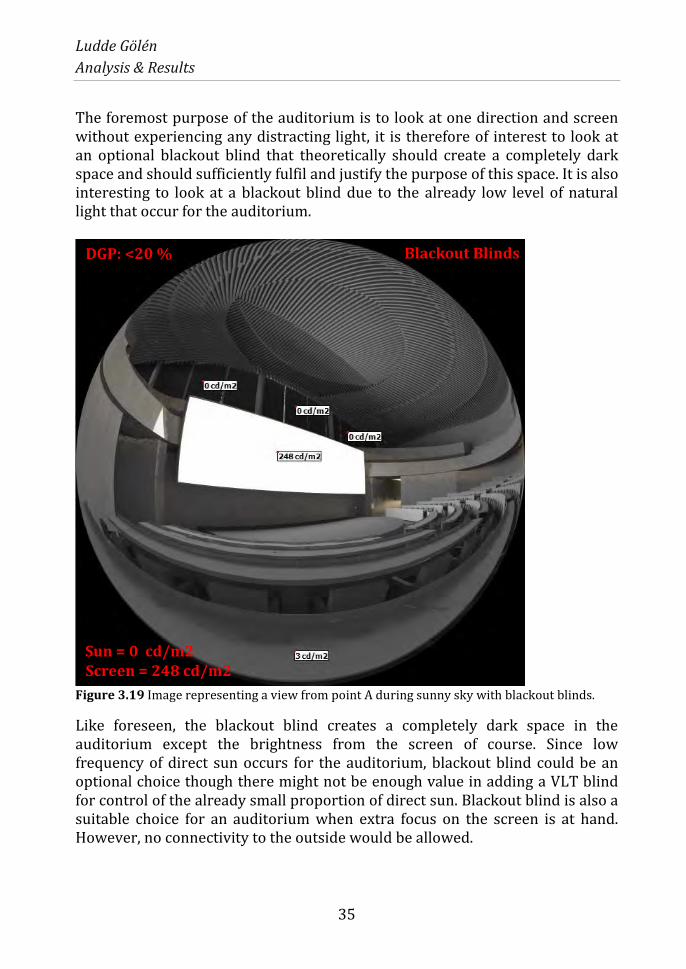
The foremost purpose of the auditorium is to look at one direction and screen without experiencing any distracting light, it is therefore of interest to look at an optional blackout blind that theoretically should create a completely dark space and should sufficiently fulfil and justify the purpose of this space. It is also interesting to look at a blackout blind due to the already low level of natural light that occur for the auditorium.
Figure 3.19 Image representing a view from point A during sunny sky with blackout blinds.
Like foreseen, the blackout blind creates a completely dark space in the auditorium except the brightness from the screen of course. Since low frequency of direct sun occurs for the auditorium, blackout blind could be an optional choice though there might not be enough value in adding a VLT blind for control of the already small proportion of direct sun. Blackout blind is also a suitable choice for an auditorium when extra focus on the screen is at hand. However, no connectivity to the outside would be allowed.
DGP: <20 % Blackout Blinds
Sun = 0 cd/m2 Screen = 248 cd/m2
Ludde Gölén
Analysis & Results
36
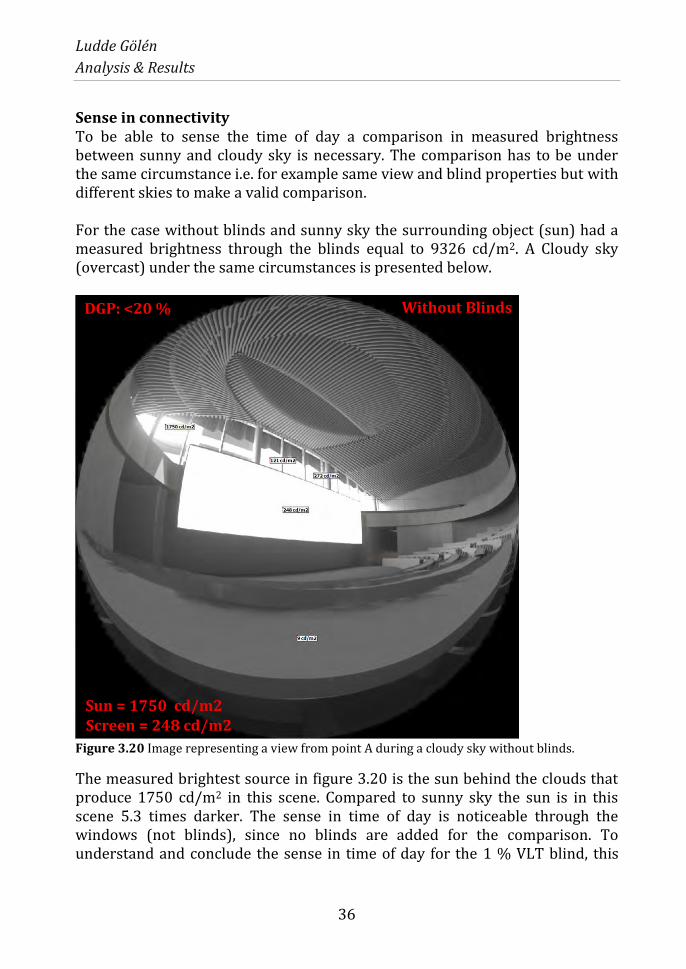
Sense in connectivity To be able to sense the time of day a comparison in measured brightness between sunny and cloudy sky is necessary. The comparison has to be under the same circumstance i.e. for example same view and blind properties but with different skies to make a valid comparison. For the case without blinds and sunny sky the surrounding object (sun) had a measured brightness through the blinds equal to 9326 cd/m2. A Cloudy sky (overcast) under the same circumstances is presented below.
Figure 3.20 Image representing a view from point A during a cloudy sky without blinds.
The measured brightest source in figure 3.20 is the sun behind the clouds that produce 1750 cd/m2 in this scene. Compared to sunny sky the sun is in this scene 5.3 times darker. The sense in time of day is noticeable through the windows (not blinds), since no blinds are added for the comparison. To understand and conclude the sense in time of day for the 1 % VLT blind, this
DGP: <20 % Without Blinds
Sun = 1750 cd/m2 Screen = 248 cd/m2
Ludde Gölén
Analysis & Results
37
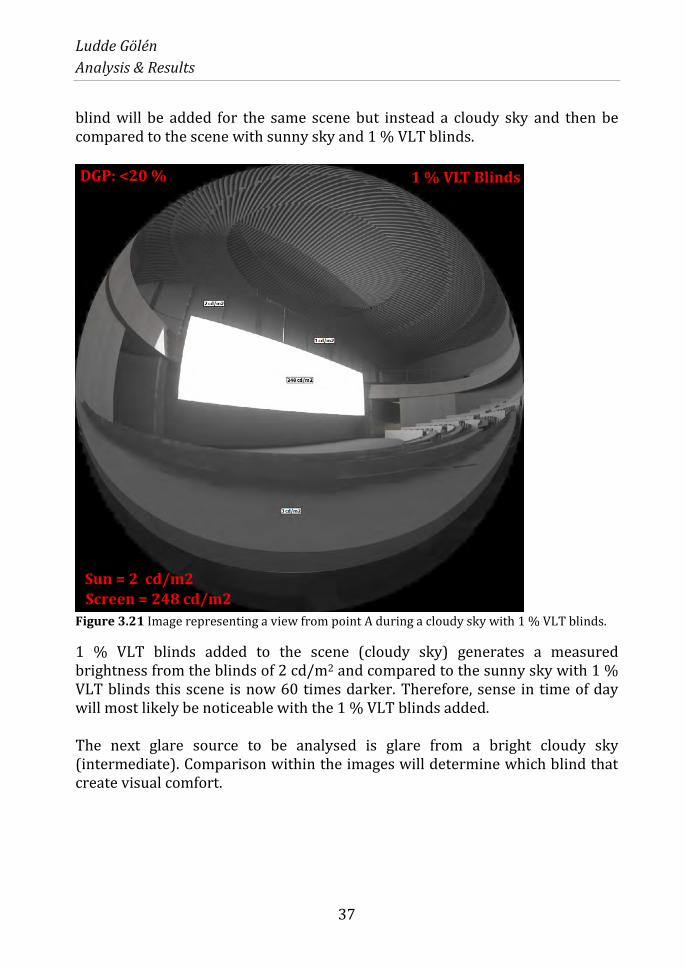
blind will be added for the same scene but instead a cloudy sky and then be compared to the scene with sunny sky and 1 % VLT blinds.
Figure 3.21 Image representing a view from point A during a cloudy sky with 1 % VLT blinds.
1 % VLT blinds added to the scene (cloudy sky) generates a measured brightness from the blinds of 2 cd/m2 and compared to the sunny sky with 1 % VLT blinds this scene is now 60 times darker. Therefore, sense in time of day will most likely be noticeable with the 1 % VLT blinds added. The next glare source to be analysed is glare from a bright cloudy sky (intermediate). Comparison within the images will determine which blind that create visual comfort.
DGP: <20 % 1 % VLT Blinds
Sun = 2 cd/m2 Screen = 248 cd/m2

Ludde Gölén
Analysis & Results
38
Bright Cloudy Sky - Point B, will try to find a suitable blind that can control bright light from the sky perceived by audience in the auditorium whilst keeping connectivity to the outside. First an initial scene without blinds will be presented. Initial
Figure 3.22 Image representing a view from point B during a bright cloudy sky without blinds.
The surrounding object (sky) is measured 12 times brighter than the focal point (screen) and visual comfort will most likely be perceived due to the fact that the luminance ratio between them is considered okay according to the luminance ratio standard 1:20 (between any points within the field of view). The DGP confirms this and indicates that no visual distraction will be perceived. Even though visual comfort is achieved without blinds a final blind and scene is presented on next page representing the lowest luminance ratio for point B and therefore giving the client various conditions (scenes) to choose among (see appendix B testing 75 % VLT blinds).
DGP: <20 % Without Blinds
Sky = 3041 cd/m2 Screen = 248 cd/m2
Ludde Gölén
Analysis & Results
39
Final
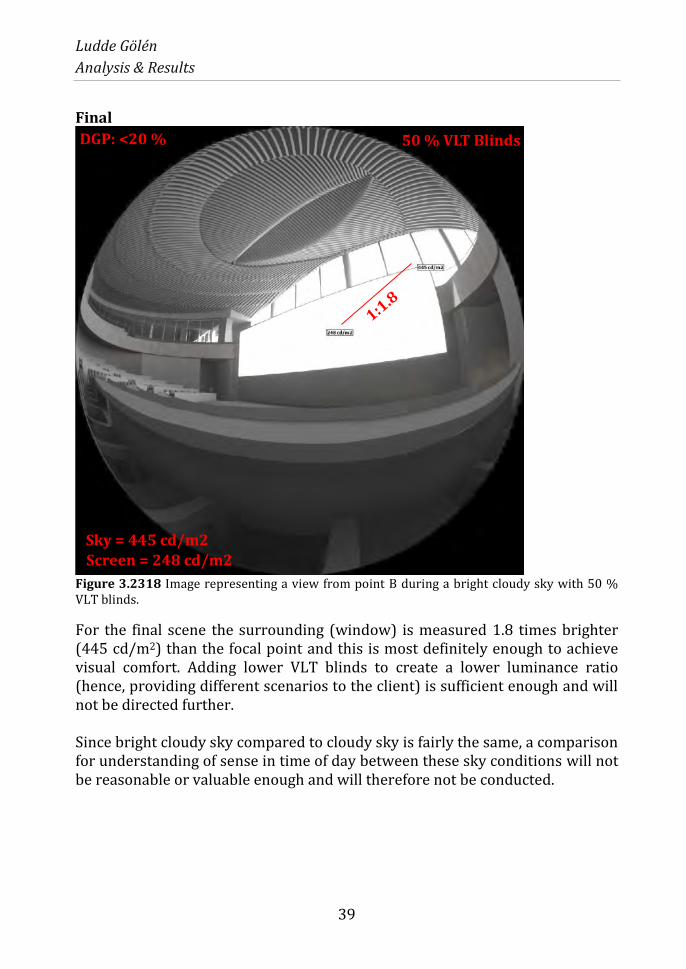
Figure 3.2318 Image representing a view from point B during a bright cloudy sky with 50 % VLT blinds.
For the final scene the surrounding (window) is measured 1.8 times brighter (445 cd/m2) than the focal point and this is most definitely enough to achieve visual comfort. Adding lower VLT blinds to create a lower luminance ratio (hence, providing different scenarios to the client) is sufficient enough and will not be directed further. Since bright cloudy sky compared to cloudy sky is fairly the same, a comparison for understanding of sense in time of day between these sky conditions will not be reasonable or valuable enough and will therefore not be conducted.
DGP: <20 % 50 % VLT Blinds
Sky = 445 cd/m2 Screen = 248 cd/m2
Ludde Gölén
Analysis & Results
40
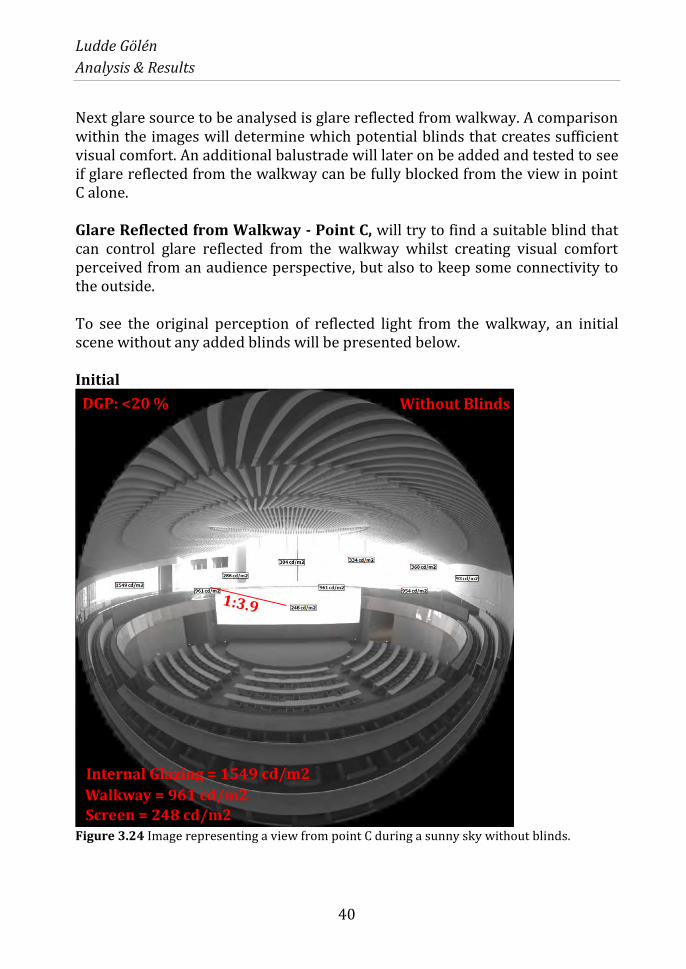
Next glare source to be analysed is glare reflected from walkway. A comparison within the images will determine which potential blinds that creates sufficient visual comfort. An additional balustrade will later on be added and tested to see if glare reflected from the walkway can be fully blocked from the view in point C alone. Glare Reflected from Walkway - Point C, will try to find a suitable blind that can control glare reflected from the walkway whilst creating visual comfort perceived from an audience perspective, but also to keep some connectivity to the outside. To see the original perception of reflected light from the walkway, an initial scene without any added blinds will be presented below. Initial
Figure 3.24 Image representing a view from point C during a sunny sky without blinds.
DGP: <20 % Without Blinds
Walkway = 961 cd/m2 Screen = 248 cd/m2
Internal Glazing = 1549 cd/m2
Ludde Gölén
Analysis & Results
41
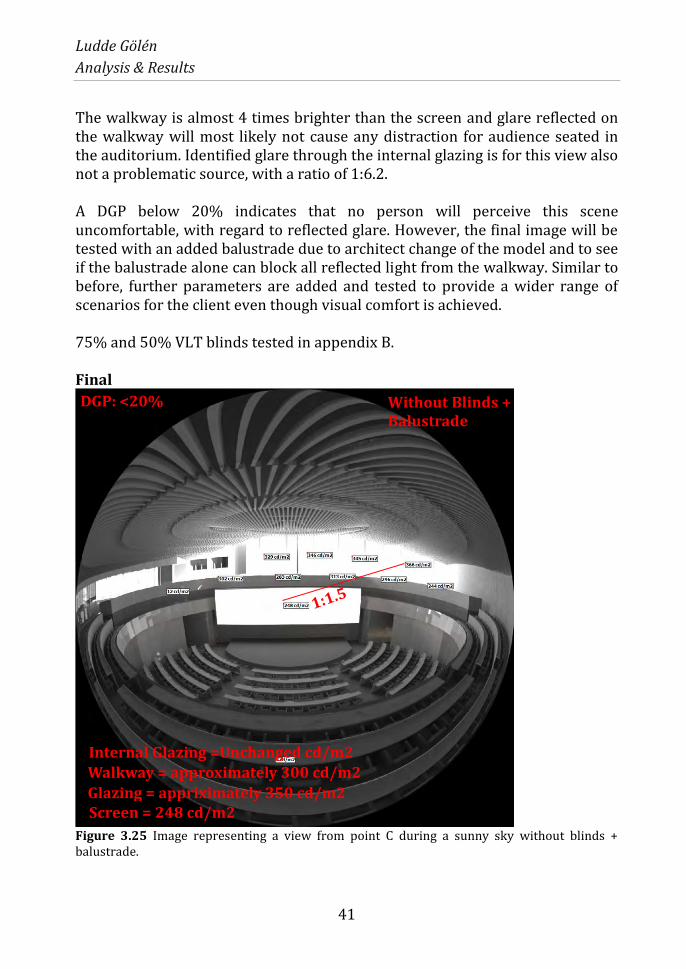
The walkway is almost 4 times brighter than the screen and glare reflected on the walkway will most likely not cause any distraction for audience seated in the auditorium. Identified glare through the internal glazing is for this view also not a problematic source, with a ratio of 1:6.2. A DGP below 20% indicates that no person will perceive this scene uncomfortable, with regard to reflected glare. However, the final image will be tested with an added balustrade due to architect change of the model and to see if the balustrade alone can block all reflected light from the walkway. Similar to before, further parameters are added and tested to provide a wider range of scenarios for the client even though visual comfort is achieved. 75% and 50% VLT blinds tested in appendix B. Final
Figure 3.25 Image representing a view from point C during a sunny sky without blinds + balustrade.
DGP: <20% Without Blinds + Balustrade
Glazing = appriximately 350 cd/m2 Screen = 248 cd/m2
Walkway = approximately 300 cd/m2 Internal Glazing =Unchanged cd/m2
Ludde Gölén
Analysis & Results
42
The balustrade certainly lowers the brightness level at the walkway, from approximately 1000 cd/m2 to around 300cd/m2 (on top of balustrade) and if only looking at glare coming from the walkway the balustrade can control this glare alone. Comparing the initial and final images one can see that the screen with the balustrade added provides a more suitable contrast (upper level) and is now easier to focus on, without any potential discomfort at all. The balustrade will therefore replace the existing metal railing in the auditorium. Obviously no blinds are needed for the case “reflected glare from walkway” and a much higher connectivity can therefore be perceived by the audience. The next glare source to be analysed is glare reflected from surrounding buildings. Analysis & comparison within the images will determine which blinds that create sufficient visual comfort with regard to glare reflected from buildings. To be able to sense the time of day a comparison in measured brightness between sunny and cloudy sky will be provided.
Ludde Gölén
Analysis & Results
43
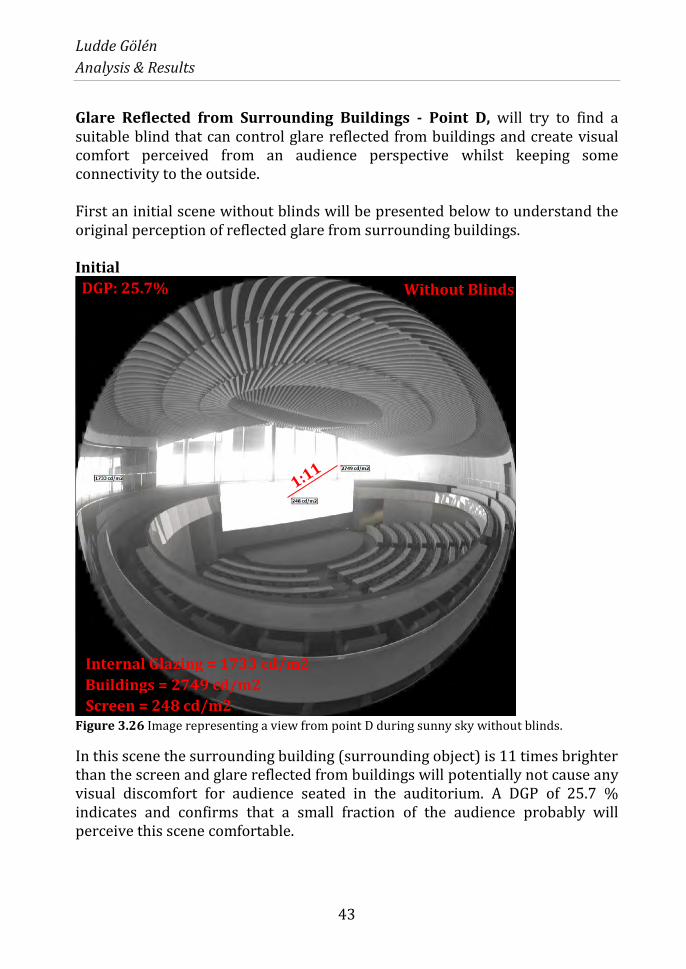
Glare Reflected from Surrounding Buildings - Point D, will try to find a suitable blind that can control glare reflected from buildings and create visual comfort perceived from an audience perspective whilst keeping some connectivity to the outside. First an initial scene without blinds will be presented below to understand the original perception of reflected glare from surrounding buildings. Initial
Figure 3.26 Image representing a view from point D during sunny sky without blinds.
In this scene the surrounding building (surrounding object) is 11 times brighter than the screen and glare reflected from buildings will potentially not cause any visual discomfort for audience seated in the auditorium. A DGP of 25.7 % indicates and confirms that a small fraction of the audience probably will perceive this scene comfortable.
DGP: 25.7% Without Blinds
Buildings = 2749 cd/m2 Screen = 248 cd/m2
Internal Glazing = 1733 cd/m2
Ludde Gölén
Analysis & Results
44
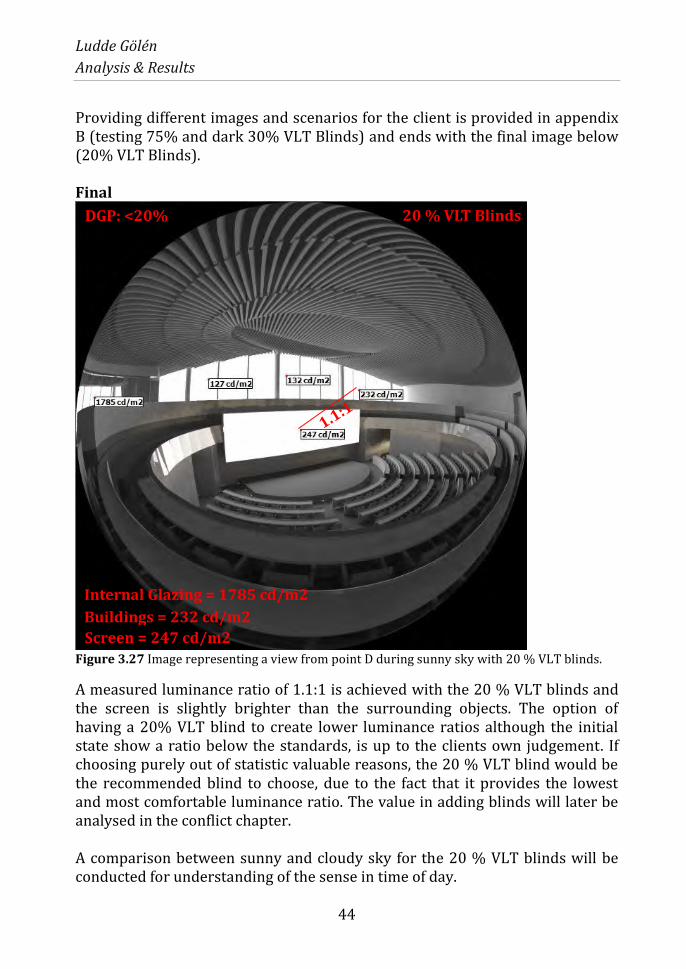
Providing different images and scenarios for the client is provided in appendix B (testing 75% and dark 30% VLT Blinds) and ends with the final image below (20% VLT Blinds). Final
Figure 3.27 Image representing a view from point D during sunny sky with 20 % VLT blinds.
A measured luminance ratio of 1.1:1 is achieved with the 20 % VLT blinds and the screen is slightly brighter than the surrounding objects. The option of having a 20% VLT blind to create lower luminance ratios although the initial state show a ratio below the standards, is up to the clients own judgement. If choosing purely out of statistic valuable reasons, the 20 % VLT blind would be the recommended blind to choose, due to the fact that it provides the lowest and most comfortable luminance ratio. The value in adding blinds will later be analysed in the conflict chapter. A comparison between sunny and cloudy sky for the 20 % VLT blinds will be conducted for understanding of the sense in time of day.
DGP: <20% 20 % VLT Blinds
Buildings = 232 cd/m2 Screen = 247 cd/m2
Internal Glazing = 1785 cd/m2
Ludde Gölén
Analysis & Results
45
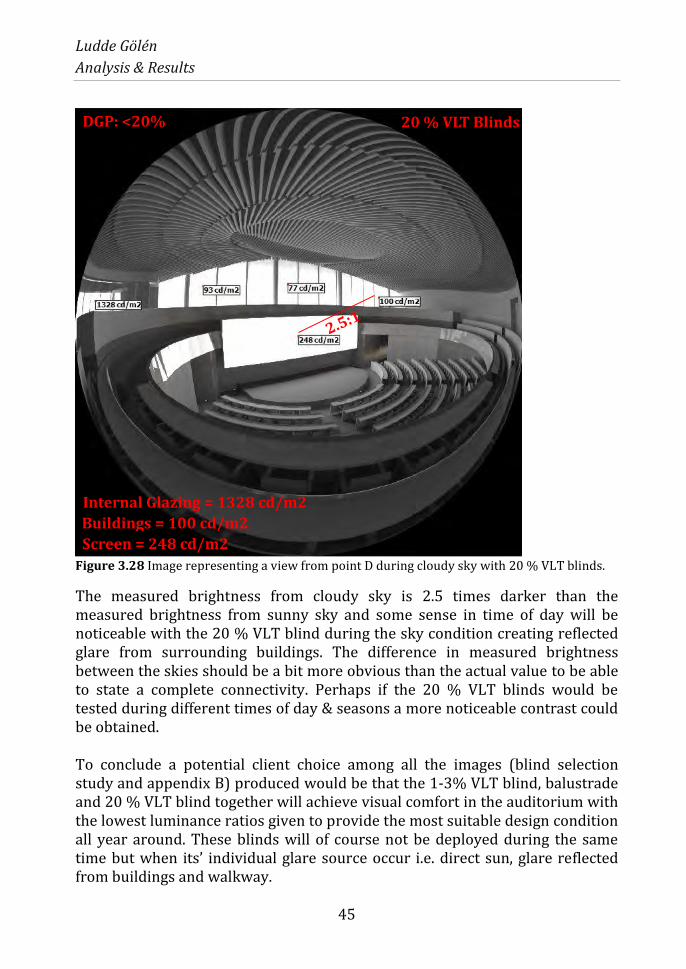
Figure 3.28 Image representing a view from point D during cloudy sky with 20 % VLT blinds.
The measured brightness from cloudy sky is 2.5 times darker than the measured brightness from sunny sky and some sense in time of day will be noticeable with the 20 % VLT blind during the sky condition creating reflected glare from surrounding buildings. The difference in measured brightness between the skies should be a bit more obvious than the actual value to be able to state a complete connectivity. Perhaps if the 20 % VLT blinds would be tested during different times of day & seasons a more noticeable contrast could be obtained. To conclude a potential client choice among all the images (blind selection study and appendix B) produced would be that the 1-3% VLT blind, balustrade and 20 % VLT blind together will achieve visual comfort in the auditorium with the lowest luminance ratios given to provide the most suitable design condition all year around. These blinds will of course not be deployed during the same time but when its’ individual glare source occur i.e. direct sun, glare reflected from buildings and walkway.
DGP: <20% 20 % VLT Blinds
Buildings = 100 cd/m2 Screen = 248 cd/m2
Internal Glazing = 1328 cd/m2
Ludde Gölén
Analysis & Results
46
The choice of these particular blinds and parameters being the most suitable design condition is that they provide a luminance ratio far below 1:20 (between points in the field of view) and should therefore provide a safer condition with regard to visual comfort. This may not be the smartest or cheapest choice (compared to standards) but the goal was to deliver a range of options that consider the client’s criteria, which the lower VLT blinds analysis provide. The daylight autonomy study concluded that visual comfort was evidently the highest focus of the client criteria. Perhaps there is a more balanced choice between the different blinds and images, creating a bit higher luminance ratio and therefore also a higher connectivity to the outside (due to higher VLT blinds). This will be discussed in the conflict chapter below, compared to other interesting factors.
3.1.5 Conflicts between value-based decisions for the Auditorium
This chapter discuss and inform the reader upon various conflicts that may occur for the auditorium space with regard to the previous studies made and the goal of the client’s brief. This chapter is used for speculative reasons and rough estimations are assumed for the different parts discussed. The different targets or goals the client requested for the auditorium was to be able to sense change in time of day i.e. clouds passing by, weather changes etc. Sufficient levels of natural light to be able to reduce electrical lighting demands i.e. use of daylight-linked dimming control. Last but not least was to procure safe levels of measured brightness to create visual comfort. All of them except sufficient levels of natural light can be achieved for the auditorium. The walkway however have high levels of natural light throughout the year and daylight-linked dimming control (DLDC) could be utilized for reduction in electrical lighting demands. Different potential conflicts for the auditorium:
Daylight autonomy vs. visual comfort i.e. added blinds that create
visual comfort will automatically block direct sun and other glare
sources, and therefore also reduce available sunlight and daylight from
entering the space.
Connectivity vs. visual comfort i.e. having lower VLT blinds reduces
the risk of visual discomfort but decreases the connectivity to the
outside due to low visual light transmittance through the blinds.
Regardless that the blinds create some connectivity to the outside.

Ludde Gölén
Analysis & Results
47
Energy cost for lighting vs. visual comfort i.e. added blinds that
achieve visual comfort will generally create an overall darker space and
higher lighting demands are automatically created to keep wanted light
levels.
Costs vs. visual comfort i.e. blinds can be relatively expensive and the
client might not see value in purchase of blinds to achieve something as
important like visual comfort. But if comparing to other costs (e.g.
salary), justified conclusions can be made to reach certainty of the value
in added blinds.
The works throughout this thesis was to analyse different spaces and come to conclusions given as options for the client. Where there is no right or wrong compared to any fixed thresholds but instead right or wrong with regard to client perspective and value-based decisions. The client could easily choose higher VLT blinds than given from the consultant for that simple reason that high connectivity is a higher priority even though the lower VLT blinds achieve better visual comfort. Hence, visual comfort was sacrificed to some extent. The decision previously made in the blind selection study was to apply two optional blinds for the auditorium space with an additional balustrade. This enables the user too constantly and throughout the year experience visual comfort whilst keeping connectivity to the outside. Meanwhile visual comfort is achieved there are no surrounding objects being much brighter than the screen, and clients goal is attained. This result in good performance level among users and anticipated increased productivity for the business as a whole. When the optional two blinds are applied throughout the year and visual comfort is achieved, how is consequently the daylight availability affected with its already low levels of light? What happens with the connectivity and sense in time of day? Is there actual value in having two blinds applied for one singular space and goal (i.e. achieving visual comfort) at all? What sacrifices does one have to make when aiming for high performance of all outcomes? Etc. Daylight Autonomy and DLDC vs Visual Comfort Low levels of natural light turned out to be the case for the auditorium except on the walkway where high levels of natural light were achieved (without blinds). Imagine a scenario where interior lighting was turned ON 100 % of occupied hours over the year, due to blinds being deployed and overall low levels of
Ludde Gölén
Analysis & Results
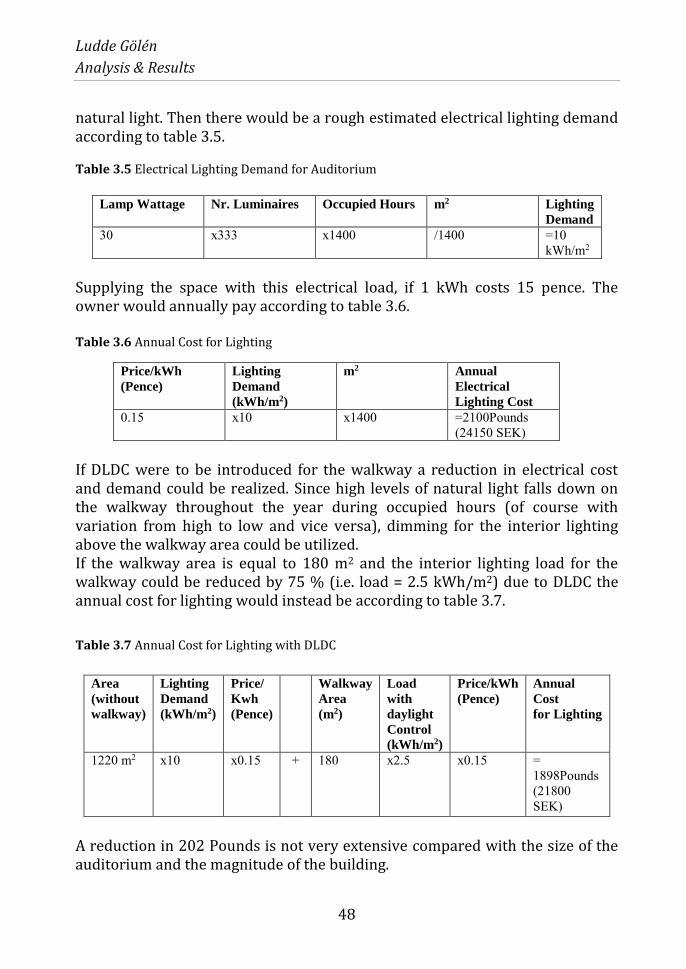
48
natural light. Then there would be a rough estimated electrical lighting demand according to table 3.5. Table 3.5 Electrical Lighting Demand for Auditorium
Supplying the space with this electrical load, if 1 kWh costs 15 pence. The owner would annually pay according to table 3.6. Table 3.6 Annual Cost for Lighting
Price/kWh
(Pence)
Lighting
Demand
(kWh/m2)
m2 Annual
Electrical
Lighting Cost
0.15 x10 x1400 =2100Pounds (24150 SEK)
If DLDC were to be introduced for the walkway a reduction in electrical cost and demand could be realized. Since high levels of natural light falls down on the walkway throughout the year during occupied hours (of course with variation from high to low and vice versa), dimming for the interior lighting above the walkway area could be utilized. If the walkway area is equal to 180 m2 and the interior lighting load for the walkway could be reduced by 75 % (i.e. load = 2.5 kWh/m2) due to DLDC the annual cost for lighting would instead be according to table 3.7.
Table 3.7 Annual Cost for Lighting with DLDC
A reduction in 202 Pounds is not very extensive compared with the size of the auditorium and the magnitude of the building.
Lamp Wattage Nr. Luminaires Occupied Hours m2 Lighting
Demand
30 x333 x1400 /1400 =10 kWh/m2
Area
(without
walkway)
Lighting
Demand
(kWh/m2)
Price/
Kwh
(Pence)
Walkway
Area
(m2)
Load
with
daylight
Control
(kWh/m2)
Price/kWh
(Pence)
Annual
Cost
for Lighting
1220 m2 x10 x0.15 + 180 x2.5 x0.15 = 1898Pounds (21800 SEK)

Ludde Gölén
Analysis & Results
49
The purpose of this is to show the value in adding DLDC and the value of perhaps having fewer blinds for the glazing and let more daylight enter the building. Though adding blinds will not benefit the smaller reduction but instead make it smaller, due to partially blocking the sun. The conclusion is that there is minor value in adding DLDC for the walkway lighting and no value in removing any of the chosen blinds for the auditorium, as there are really no meaningful ways of improving daylight availability and the reduction in cost for lighting loads will not be substantial enough by doing so. The visual comfort criterion is evidently therefore a higher and more beneficial priority for the space. Costs vs Visual Comfort The main focus of this space is to achieve a comfortable and pleasant space for presentations, lecturers, meetings and task related work. Whilst keeping connectivity to the outside by sensing change in time of day i.e. clouds passing by, sunset – sunrise etc. To do this, two blinds was chosen to create this atmosphere and perception. The total cost of two blinds for the auditorium external glazing area of 252 m2 (i.e. total blind area: (252 x 2) = 504 m2) will be fairly substantial. But is it really that substantial compared to what the owner has to pay for salary over a year? Do the owner value this higher capital cost for realization of increased productivity for the business as a whole? Once again, imagine the scenario where two blinds were applied for the external glazing (=504m2). Let’s say 1 m2 blind costs 30 pound. Table 3.8 Total Cost for blinds per m2 floor area
Total blind area (m2) Price/m2 (Pounds) Floor Area (m2) Total Cost/m2
504 x30 /1400 10.8 = Pounds/m2 This is just the cost of blinds for the auditorium and a much higher total capital cost for blinds covering the whole building is expected. Imagine then that the owner pays salary for half the amount of people that the auditorium can hold i.e. 200 people. Each employee makes estimated 35000 pounds a year. Table 3.9 Total Cost for salary per m2 floor area
Annual Salary (Pounds) Nr. People Floor Area Total Cost/m2
30000 x200 /1400 =4286 Pounds/m2

Ludde Gölén
Analysis & Results
50
10.8 /4286 = 0.0025 i.e. adding three blinds cost 0.25 % of the total cost for salaries over a year. The point is to show that there is an absolute value in adding blinds to achieve visual comfort when analysing and speculating from this angle. Or one could say that the key factor in choosing blinds should not be based on monetary factors. The only finalization in blind selection is what the client value the most either visual comfort or connectivity to the outside, perhaps both. This thesis can only recommend and prefer options before others. Overall Conclusions There will always be conflicts with choosing one or the other, but thoughtful weighting between all parameters is always possible and necessary. Example for the auditorium which already had low levels of natural light and evidently no meaningful ways of improving availability, this became the bottom priority for the space. To somehow balance the very low levels of light, blind control could be introduced so that only blinds are deployed when there is an actual glare source in the auditorium. If manually controlled, blinds would unfortunately be frequently deployed due to lack of energy of pulling them up and down when needed. It was concluded that no value in removing any of the chosen blinds for better use of DLDC to reduce electrical lighting loads could be utilized. To justify some kind of meaningful reduction, occupancy sensors could be utilized so that interior lighting is only turned on when the room is occupied. Two blinds were chosen, which creates both good visual comfort and keeps some connectivity to the outside. The weighing between visual comfort and connectivity was basically to choose blinds that achieve both i.e. translucent blinds with different visual light transmittance for various glare sources. But the client still has the final decision on which blinds to apply or not. The discussed topics in this chapter once again concludes that there is absolute value in adding two blinds for this space and evidently that the previous criteria’s have been reprioritized as followed.
1. Visual Comfort.
2. Sense in time of day (connectivity to the outside).
3. Daylight-linked Dimming Control.
4. Costs.
5. Daylight Autonomy.
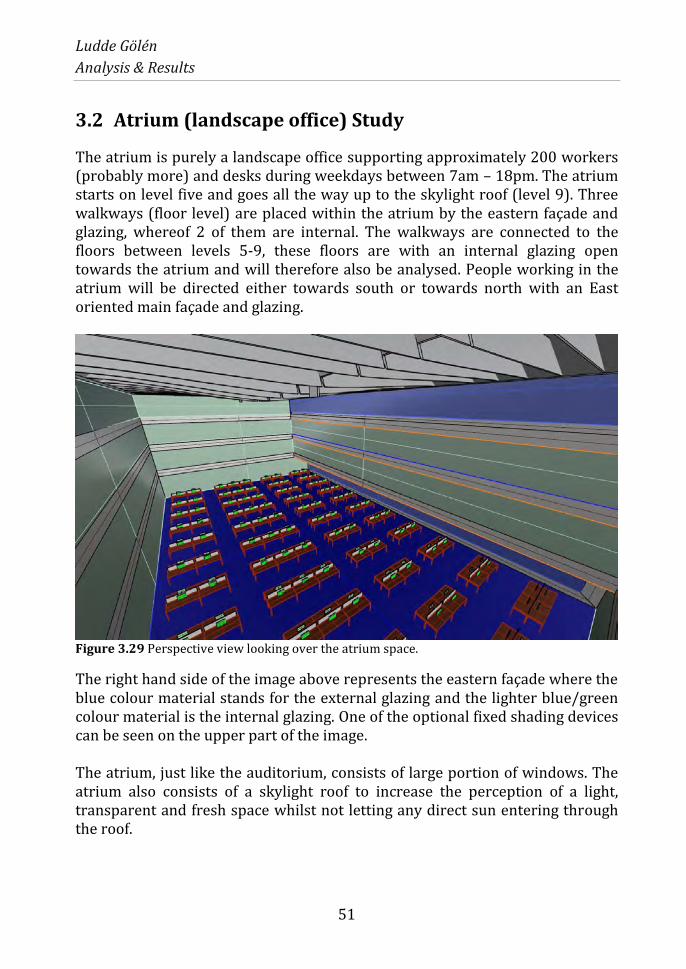
Ludde Gölén
Analysis & Results
51
3.2 Atrium (landscape office) Study
The atrium is purely a landscape office supporting approximately 200 workers (probably more) and desks during weekdays between 7am – 18pm. The atrium starts on level five and goes all the way up to the skylight roof (level 9). Three walkways (floor level) are placed within the atrium by the eastern façade and glazing, whereof 2 of them are internal. The walkways are connected to the floors between levels 5-9, these floors are with an internal glazing open towards the atrium and will therefore also be analysed. People working in the atrium will be directed either towards south or towards north with an East oriented main façade and glazing.
Figure 3.29 Perspective view looking over the atrium space.
The right hand side of the image above represents the eastern façade where the blue colour material stands for the external glazing and the lighter blue/green colour material is the internal glazing. One of the optional fixed shading devices can be seen on the upper part of the image. The atrium, just like the auditorium, consists of large portion of windows. The atrium also consists of a skylight roof to increase the perception of a light, transparent and fresh space whilst not letting any direct sun entering through the roof.

Ludde Gölén
Analysis & Results
52
Geometry Table 3.10 Geometry for Atrium space
Total floor area 1254 m2 Ceiling height, ground floor 16.7 m Total external glazing area (exl. Skylight roof) 556 m2 Total internal glazing area 1493 m2
The atrium has a 44 % ratio between external windows to floor plate (excluded skylight window) and high levels of natural light are expected.
Figure 3.30 Low rendered perspective view from 6th floor looking over the atrium space.
The image above illustrates how open, translucent and bright the atrium space will be perceived. The image does not consist of any blinds and will be perceived darker once blinds are deployed. Reflectance & Transmittance Values Specific guidelines have not been given from the architect for the atrium and Rhino default values have been chosen for representation of materials for the daylight analysis. The values are flexible, meaning, there might be value in changing properties of the materials along the analysis progress due to early stage design and fixed values are not yet decided.

Ludde Gölén
Analysis & Results
53
Table 3.11 Summarized reflectance values for Atrium space
Interior walls 50 % Carpet floor 20 % Exterior walls (incl. surrounding buildings) 35 % Exterior pathway 20 % Desks 20 % Shading baffles To be decided Computer screen Generates approximately 250 cd/m2 (turned ON) Exterior glazing, double pane 65 % transmittance Internal glazing, single pane 88 % transmittance
3.2.1 Clients’ Brief
A client’s brief is a platform to communicate important benchmarks and information among participants. The client’s brief was in this case also created in an early stage meeting where criteria’s, targets and way of measurements with regard to daylight and the atrium space was decided. Criteria The Client’s request regarding the atrium:
Prevent all direct sun on the working plane and at eye level for all
occupied areas i.e. create visual comfort.
The space should be naturally lit as often as possible.
Create a sense of connectivity to the outside.
Target What to look for:
Clouds passing in front of the sun should be noticeable. Natural light
conditions should vary based on time of day.
Achieve levels of natural light in the space that can enable reductions in
electric lighting.
Glazing brightness should not be kept substantially brighter than the
primary focus on stage.
Way of measurement Achieve substantial change in brightness level measured on vertical
surfaces (glazing) between sunny and cloudy sky.
Compare the frequency (% time, Daylight Autonomy) that key
illuminance level thresholds (eg 500 lux) are achieved on the horizontal
plane (ground floor and desk level) for different options.

Ludde Gölén
Analysis & Results
54
Daylight renderings with viewpoints from the audience comparing
luminance on glazing and presenter/screen.
These ways of measurements will be used throughout the different studies in this chapter to derive towards the goals and criteria’s in the client’s brief.
3.2.2 Sun Path Diagram
Sun path diagrams are used for understanding of when direct sun occurs for a space or surface. With help from Ecotect software, points have been distributed over the atrium space to represent certain sun path diagrams. Interpretation of the diagrams follows as described in the auditorium chapter. The atrium differs a bit from the auditorium due to located at a higher level and predicted higher frequency of direct sun is expected. Same orientation i.e. 9 degrees above east occur for the atrium. The atrium also consists of a skylight roof and high angle sun is most likely to create an uncomfortable direct sun when penetrating the envelope through this skylight. Because the atrium and auditorium have the same orientation and it was concluded that the auditorium had low frequency of direct sun due to surrounding eastern buildings blocking the sun. It can therefore be assumed that the atrium will have high frequency of direct sun due to less surrounding buildings blocking the sun and higher proportion of windows. Sun path diagrams for the eastern façade will therefore not be conducted and potential glare through the eastern façade will instead be analysed in the visual comfort study. That leads us to the study of the skylight roof where the goal is to have a fixed shading device to prevent all direct sun from entering through the roof and cause visual discomfort. The existing skylight roof will, however, be presented first to show the actual impact of direct sun where a horizontal blind is integrated to be deployed for lux values above 2000 lux which is debated to create unwanted potential glare or overheating (Frankel, 2014). Three points have been chosen as the most critical points for direct sun causing visual distraction when entering through the skylight roof. See figure 3.31.
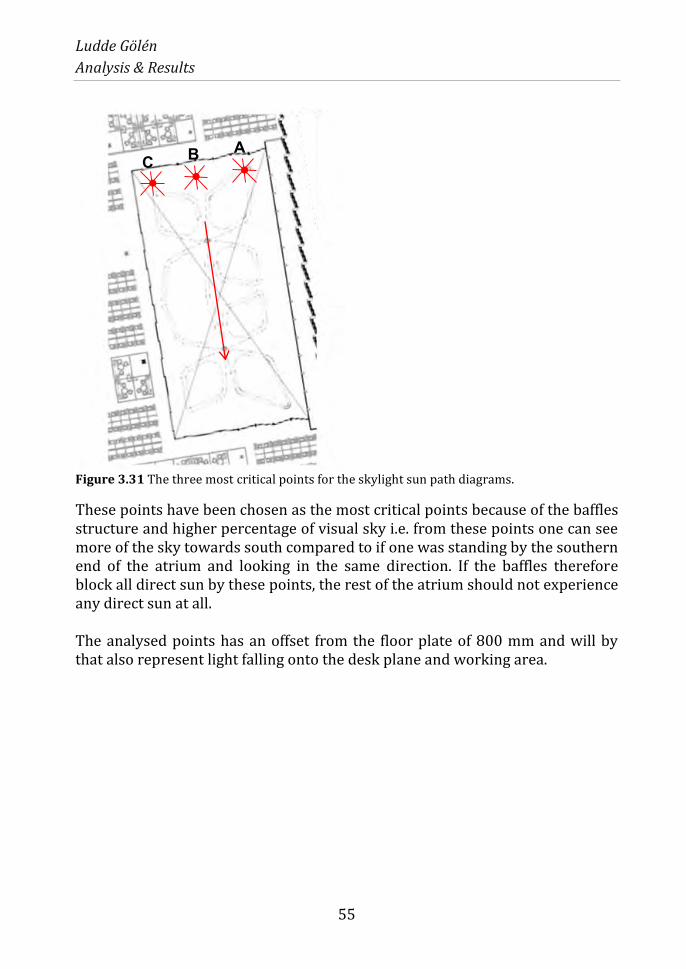
Ludde Gölén
Analysis & Results
55
Figure 3.31 The three most critical points for the skylight sun path diagrams.
These points have been chosen as the most critical points because of the baffles structure and higher percentage of visual sky i.e. from these points one can see more of the sky towards south compared to if one was standing by the southern end of the atrium and looking in the same direction. If the baffles therefore block all direct sun by these points, the rest of the atrium should not experience any direct sun at all. The analysed points has an offset from the floor plate of 800 mm and will by that also represent light falling onto the desk plane and working area.
A B C

Ludde Gölén
Analysis & Results
56
Figure 3.32 Internal view with original skylight option i.e. without fixed shading device.
Point A
Figure 3.33 sun path diagram for the original skylight option from Point A.

Ludde Gölén
Analysis & Results
57
Point B
Figure 3.34 sun path diagram for the original skylight option from Point B.
Point C Similar to point A and B except that direct sun falls on to the desk and working area earlier in the morning and closer to the window. With the original skylight option, direct sun will hit the working area all year around as long as there is sun coming in through the roof and further shading for control of direct sun is needed to prevent direct sun from causing irritation, unproductivity and overall lower performance level among workers.

Ludde Gölén
Analysis & Results
58
Two different “fixed” shading devices will be tested to prevent direct sun from entering through the roof. These have not been modified and designed by WSP but instead received as a fixed geometry from the architect. Point A, B and C will still be analysed as the worst case points in the atrium. Fixed shading device option 1 is presented below. Shading Device, Option 1
Figure 3.19 Fixed shading device, option 1.
The idea and goal for the shading device is to block all direct sun throughout the year. The idea behind a fixed shading device rather than a horizontal blind (initial idea) is that it results in less maintenance and ideally a cheaper cost in the long run. A fixed shading device also benefit the connectivity and sense in time of day whereof clouds passing by and view of the sky is more noticeable and a brighter space can be perceived.
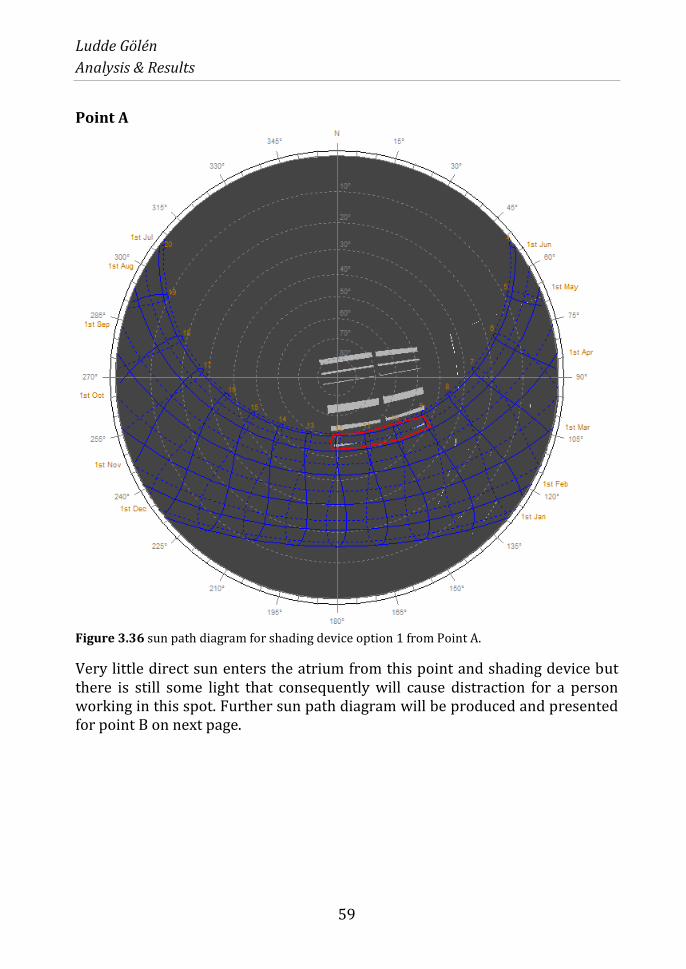
Ludde Gölén
Analysis & Results
59
Point A
Figure 3.36 sun path diagram for shading device option 1 from Point A.
Very little direct sun enters the atrium from this point and shading device but there is still some light that consequently will cause distraction for a person working in this spot. Further sun path diagram will be produced and presented for point B on next page.
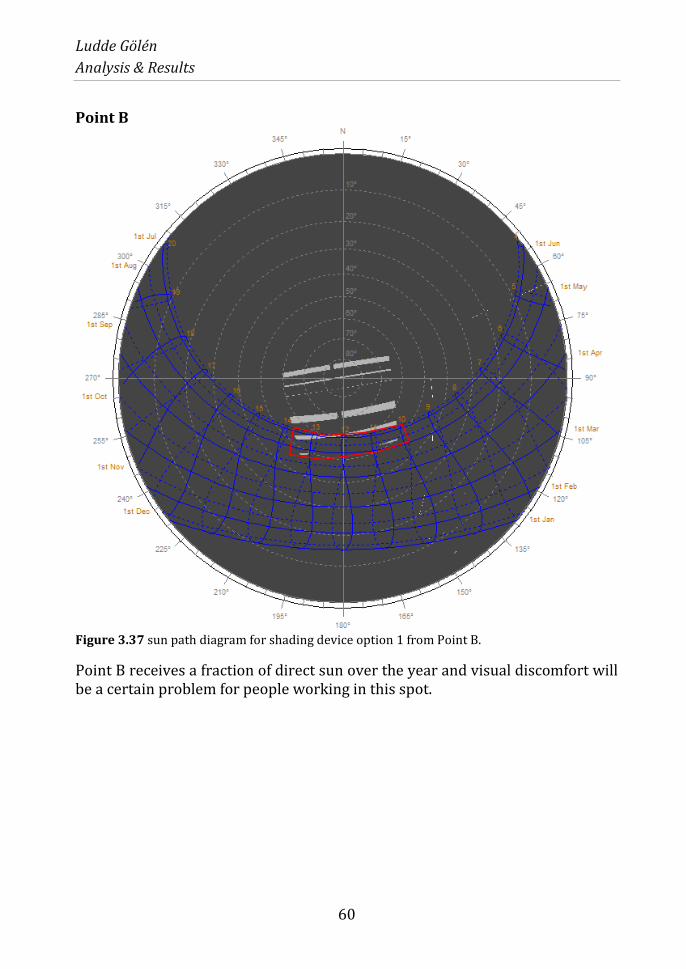
Ludde Gölén
Analysis & Results
60
Point B
Figure 3.37 sun path diagram for shading device option 1 from Point B.
Point B receives a fraction of direct sun over the year and visual discomfort will be a certain problem for people working in this spot.

Ludde Gölén
Analysis & Results
61
Point C
Figure 3.38 sun path diagram for shading device option 1 from Point C.
Point C is the most critical point in the atrium and receives slightly more direct sun than point A & B. Other optional shading devices will have to be tested for absolute certainty of blocking all direct sun, all year around. Next is shading device option 2, see page 73.
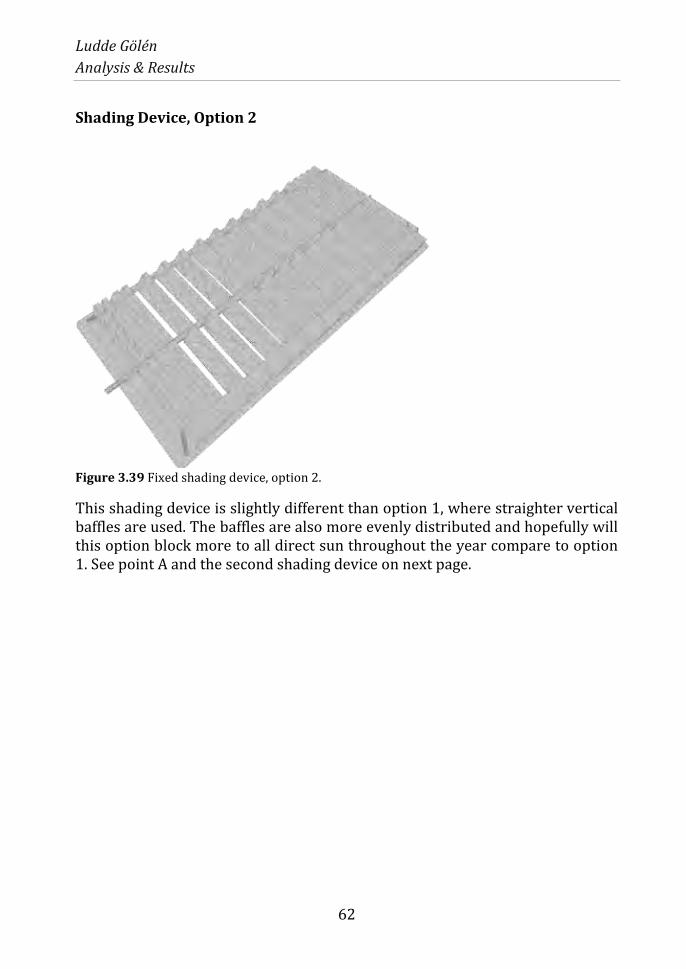
Ludde Gölén
Analysis & Results
62
Shading Device, Option 2
Figure 3.39 Fixed shading device, option 2.
This shading device is slightly different than option 1, where straighter vertical baffles are used. The baffles are also more evenly distributed and hopefully will this option block more to all direct sun throughout the year compare to option 1. See point A and the second shading device on next page.
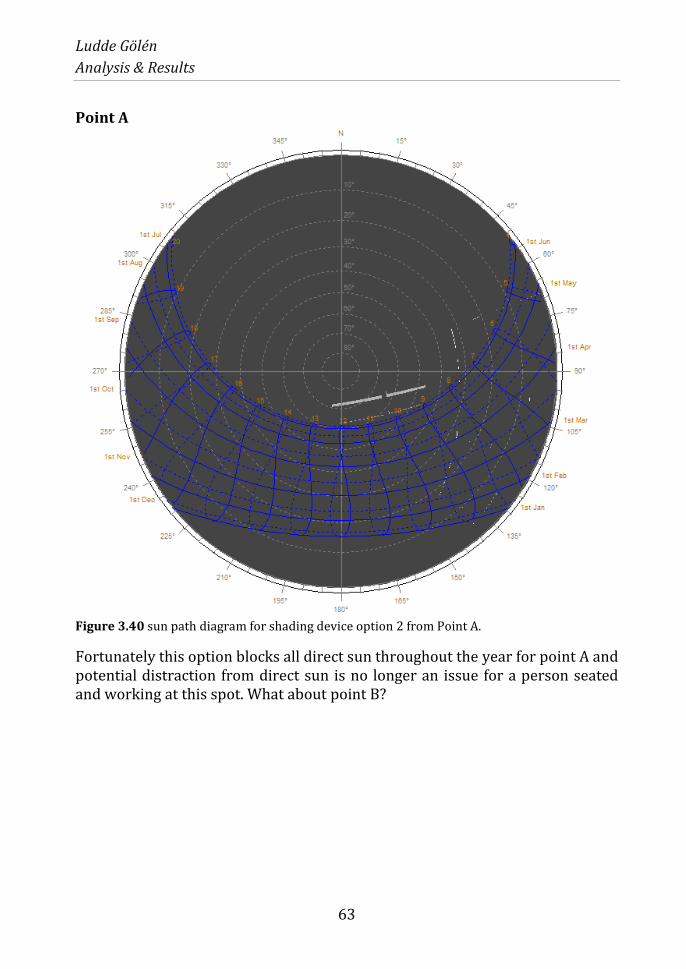
Ludde Gölén
Analysis & Results
63
Point A
Figure 3.40 sun path diagram for shading device option 2 from Point A.
Fortunately this option blocks all direct sun throughout the year for point A and potential distraction from direct sun is no longer an issue for a person seated and working at this spot. What about point B?
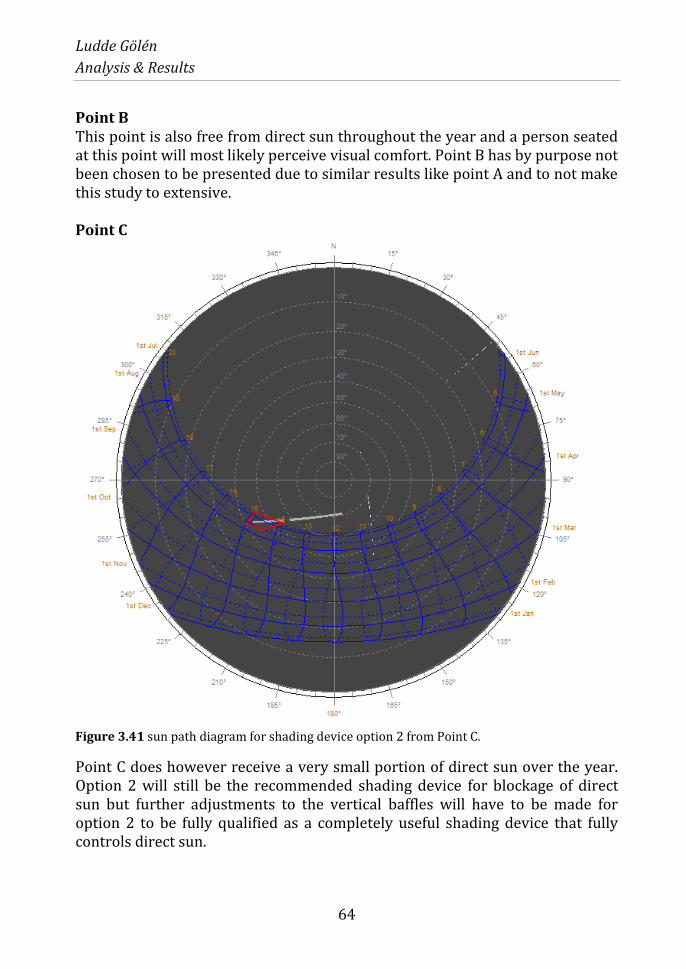
Ludde Gölén
Analysis & Results
64
Point B This point is also free from direct sun throughout the year and a person seated at this point will most likely perceive visual comfort. Point B has by purpose not been chosen to be presented due to similar results like point A and to not make this study to extensive. Point C
Figure 3.41 sun path diagram for shading device option 2 from Point C.
Point C does however receive a very small portion of direct sun over the year. Option 2 will still be the recommended shading device for blockage of direct sun but further adjustments to the vertical baffles will have to be made for option 2 to be fully qualified as a completely useful shading device that fully controls direct sun.

Ludde Gölén
Analysis & Results
65
3.2.3 Daylight Autonomy
Daylight autonomy is analysed to understand and procure a satisfactory level of natural light in the atrium space. This is not only to see how much natural light that enters the space, it also informs whether there is value in varying blind and finish properties to improve natural light levels for the atrium and if daylight control can be utilized to reduce electrical lighting demands. Target light levels: These targets have been set by consultants participating in this study.
500 Lux – Task Lighting (Office).
350 Lux – Minimum threshold for the atrium.
Daylight autonomy is in this case defined as “percentage of occupied hours per year when the targeted illuminance level can be maintained by daylight alone”. Spatial Daylight autonomy (sDA350-500, 50%) above 350 and 500 lux of occupied hours over the year will be aimed for in this study i.e. the analysed area should be day lit with 350 or 500 lux 50 % of the occupied hours which then is considered sufficient amount of light (Horst, 2013). Daylight autonomy for the atrium is calculated with an occupancy schedule between 09:00 a.m. – 17:00 p.m. during weekdays only (1876 hours). Since high values of natural light are expected in the atrium and occasional light levels above 2000 lux may occur in the space, sensors controlling blinds will therefore be applied. The sensors work under a schedule that operates automated roller blinds which deploy the blinds if the sensors exceed light levels above 2000 lux. Horizontal blinds will only be applied and used for the skylight roof without fixed shading device. The blinds have a visual light transmittance of 20 %. Daylight Autonomy is calculated on desk level i.e. 800 mm above floor plate. First to be analysed is the minimum threshold of 350 lux for the option without a fixed shading device.
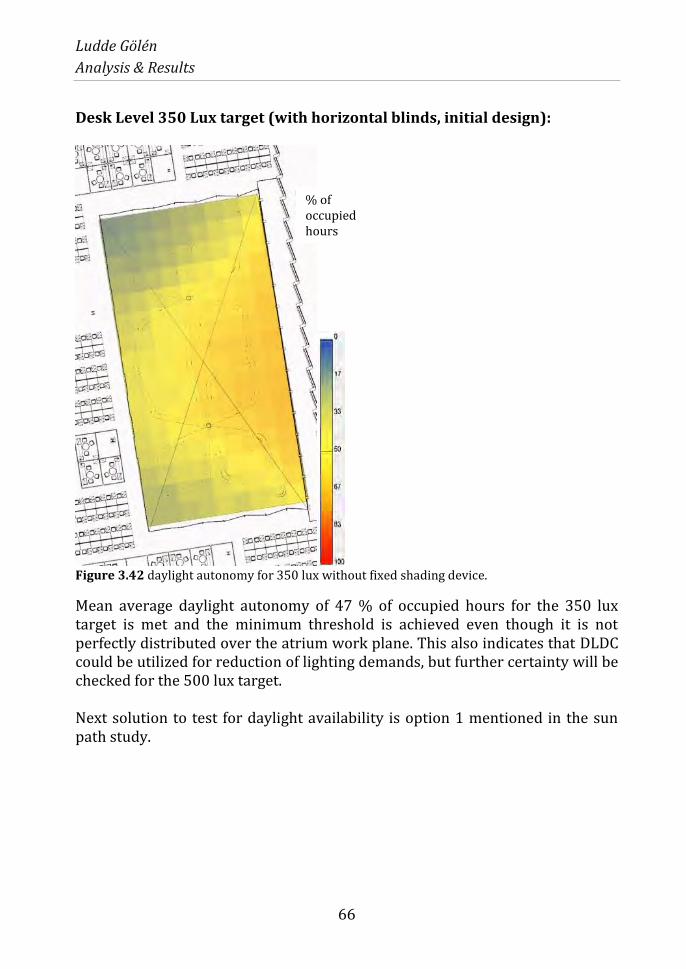
Ludde Gölén
Analysis & Results
66
Desk Level 350 Lux target (with horizontal blinds, initial design):
Figure 3.42 daylight autonomy for 350 lux without fixed shading device.
Mean average daylight autonomy of 47 % of occupied hours for the 350 lux target is met and the minimum threshold is achieved even though it is not perfectly distributed over the atrium work plane. This also indicates that DLDC could be utilized for reduction of lighting demands, but further certainty will be checked for the 500 lux target. Next solution to test for daylight availability is option 1 mentioned in the sun path study.
% of occupied hours
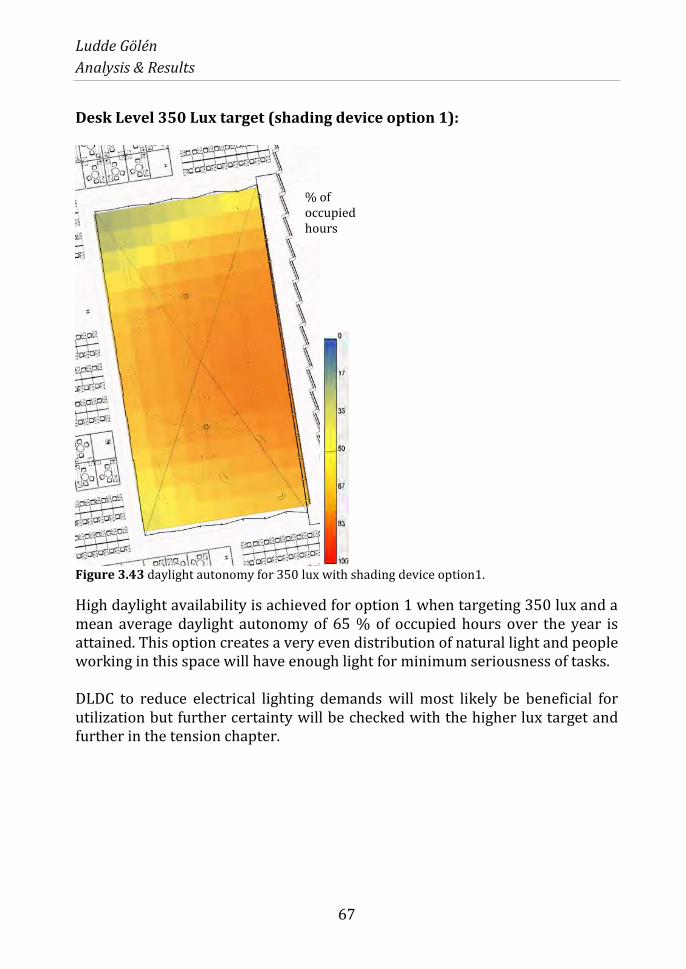
Ludde Gölén
Analysis & Results
67
Desk Level 350 Lux target (shading device option 1):
Figure 3.43 daylight autonomy for 350 lux with shading device option1.
High daylight availability is achieved for option 1 when targeting 350 lux and a mean average daylight autonomy of 65 % of occupied hours over the year is attained. This option creates a very even distribution of natural light and people working in this space will have enough light for minimum seriousness of tasks. DLDC to reduce electrical lighting demands will most likely be beneficial for utilization but further certainty will be checked with the higher lux target and further in the tension chapter.
% of occupied hours

Ludde Gölén
Analysis & Results
68
Desk Level 350 target (shading device option 2)
Figure 3.44 daylight autonomy for 350 lux with shading device option2.
Option 2 achieve a mean average daylight autonomy of 56 % of occupied hours of the year and is not as high as option 1 but still high enough to say that the target is met. The distribution is slightly worse than option 1 where the north-west corner will need additional artificial lighting to sufficiently meet the minimum threshold of 350 lux. DA is higher for option 1 and 2 compared to the initial design due to the fact that the initial design has a horizontal blind being deployed over lux values above 2000 lux, whereas option 1 and 2 is designed with a fixed shading device and consequently let more daylight enter the space, hence higher DA values.
% of occupied hours
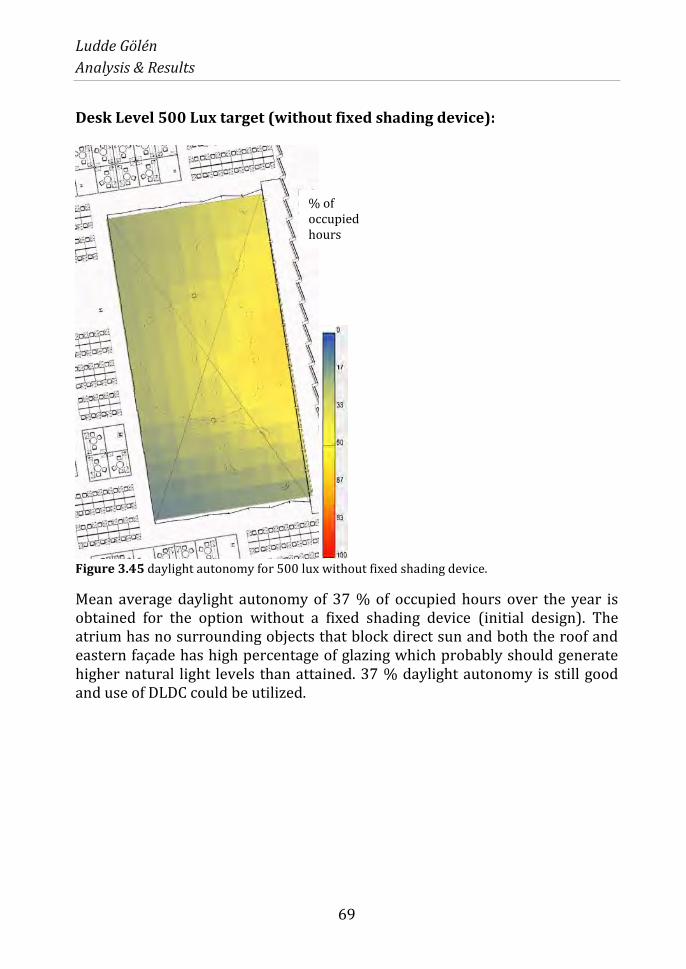
Ludde Gölén
Analysis & Results
69
Desk Level 500 Lux target (without fixed shading device):
Figure 3.45 daylight autonomy for 500 lux without fixed shading device.
Mean average daylight autonomy of 37 % of occupied hours over the year is obtained for the option without a fixed shading device (initial design). The atrium has no surrounding objects that block direct sun and both the roof and eastern façade has high percentage of glazing which probably should generate higher natural light levels than attained. 37 % daylight autonomy is still good and use of DLDC could be utilized.
% of occupied hours

Ludde Gölén
Analysis & Results
70
Desk Level 500 target (shading device option 1)
Figure 3.46 daylight autonomy for 500 lux with shading device option1.
Mean average daylight autonomy of 48 % of occupied hours over the year is obtained at desk level with shading device option 1 applied. The right hand centre of the atrium almost has all the occupied hours obtained with daylight alone (350 lux target). The north-west and south-west corners experience low levels of natural light and extra artificial lighting will be needed here to achieve sufficient levels of task light. Whether DLDC will be beneficial or not will be discussed in the conflict chapter.
% of occupied hours
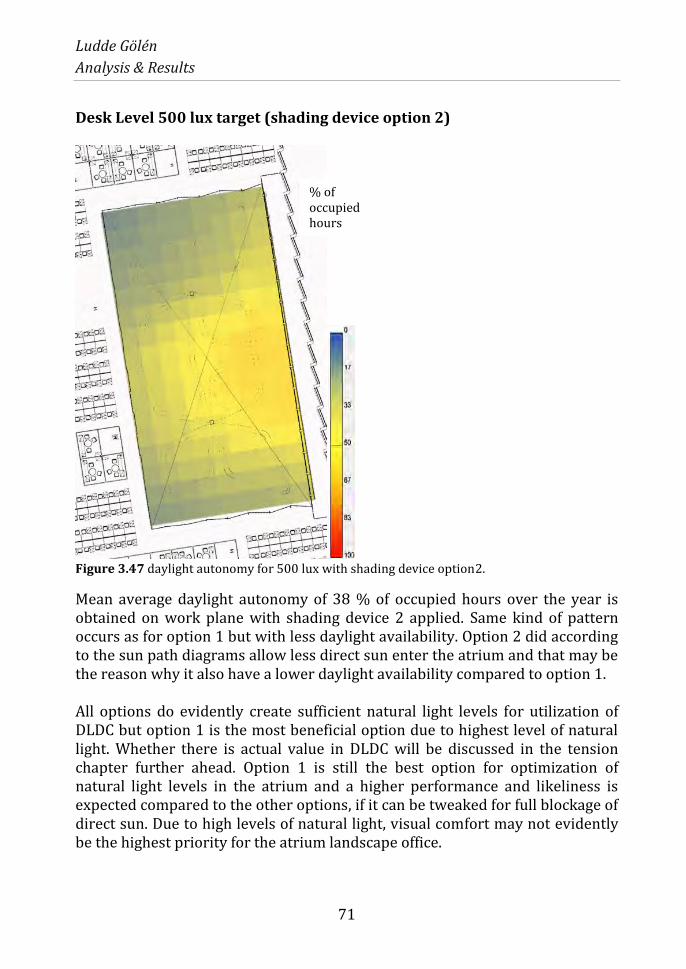
Ludde Gölén
Analysis & Results
71
Desk Level 500 lux target (shading device option 2)
Figure 3.47 daylight autonomy for 500 lux with shading device option2.
Mean average daylight autonomy of 38 % of occupied hours over the year is obtained on work plane with shading device 2 applied. Same kind of pattern occurs as for option 1 but with less daylight availability. Option 2 did according to the sun path diagrams allow less direct sun enter the atrium and that may be the reason why it also have a lower daylight availability compared to option 1. All options do evidently create sufficient natural light levels for utilization of DLDC but option 1 is the most beneficial option due to highest level of natural light. Whether there is actual value in DLDC will be discussed in the tension chapter further ahead. Option 1 is still the best option for optimization of natural light levels in the atrium and a higher performance and likeliness is expected compared to the other options, if it can be tweaked for full blockage of direct sun. Due to high levels of natural light, visual comfort may not evidently be the highest priority for the atrium landscape office.
% of occupied hours

Ludde Gölén
Analysis & Results
72
3.2.4 Visual Comfort Study
The objective of this study is to report on the visual comfort and sense in time of day. It informs and outlines what kind of blinds to choose along with a better understanding of how to achieve high performance with regard to visual comfort in the atrium. In the “conflict” chapter, the value in applying a blind for a space is discussed and, if applied, is there value in having more than one blind added to a glazing and space ( depending on different glare sources) etc. Results in this study is just like for the auditorium built on a set of images and on comparison of options based on a range of metrics such as different blind properties, difference in daylight glare probability and difference in luminance ratio among objects in the field of view etc. Interpretation of results will not be given in this chapter due to previous explanations in the auditorium chapter. For updated understanding of how to interpret the results see chapter 3.1.4.2.
3.2.4.1 Glare Sources & Analysis Platform
To understand the effects of different light in the atrium, certain glare sources will be identified as risks to analyse and work against in the blind selection.
Figure 3.48 Section view showing potential sources of glare.
SUN CAUSING
REFLECTED GLARE
FROM BAFFLES BRIGHT CLOUDY SKY
SUN CAUSING
REFLECTED GLARE
FROM BUILDINGS
DIRECT SUN SEEN BY
AUDIENCE
1
2&3
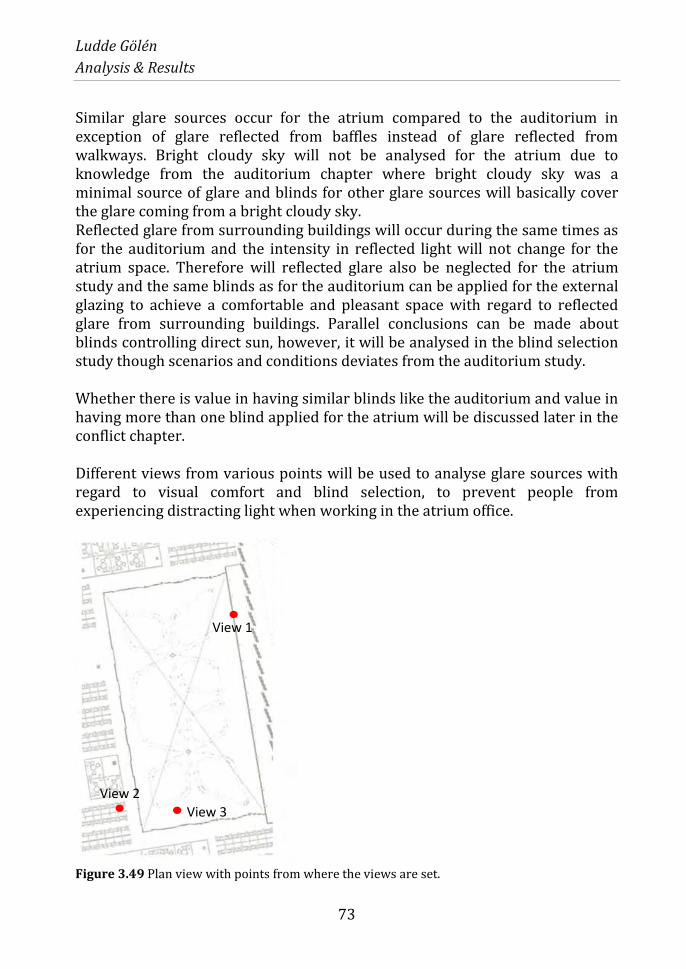
Ludde Gölén
Analysis & Results
73
Similar glare sources occur for the atrium compared to the auditorium in exception of glare reflected from baffles instead of glare reflected from walkways. Bright cloudy sky will not be analysed for the atrium due to knowledge from the auditorium chapter where bright cloudy sky was a minimal source of glare and blinds for other glare sources will basically cover the glare coming from a bright cloudy sky. Reflected glare from surrounding buildings will occur during the same times as for the auditorium and the intensity in reflected light will not change for the atrium space. Therefore will reflected glare also be neglected for the atrium study and the same blinds as for the auditorium can be applied for the external glazing to achieve a comfortable and pleasant space with regard to reflected glare from surrounding buildings. Parallel conclusions can be made about blinds controlling direct sun, however, it will be analysed in the blind selection study though scenarios and conditions deviates from the auditorium study. Whether there is value in having similar blinds like the auditorium and value in having more than one blind applied for the atrium will be discussed later in the conflict chapter. Different views from various points will be used to analyse glare sources with regard to visual comfort and blind selection, to prevent people from experiencing distracting light when working in the atrium office.
Figure 3.49 Plan view with points from where the views are set.
View 1
View 2 View 3
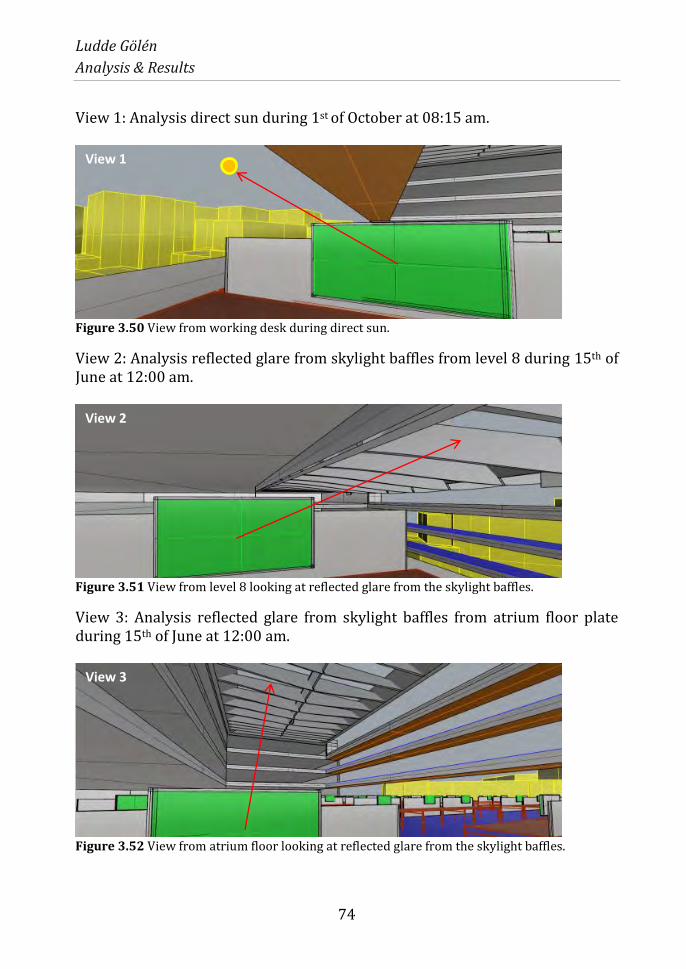
Ludde Gölén
Analysis & Results
74
View 1: Analysis direct sun during 1st of October at 08:15 am.
Figure 3.50 View from working desk during direct sun.
View 2: Analysis reflected glare from skylight baffles from level 8 during 15th of June at 12:00 am.
Figure 3.51 View from level 8 looking at reflected glare from the skylight baffles.
View 3: Analysis reflected glare from skylight baffles from atrium floor plate during 15th of June at 12:00 am.
Figure 3.52 View from atrium floor looking at reflected glare from the skylight baffles.
View 1
View 2
View 3

Ludde Gölén
Analysis & Results
75
3.2.4.2 Blind Selection
Once again a range of blinds will be tested for the different glare sources, to be able to first of all choose the best applicable blinds that create visual comfort and secondly too simultaneously see if one can sense the time of day. The different parameters and images described in the “interpretation of results” chapter will be used to determine which blinds that create visual comfort and therefore is the most suitable for the atrium. Similar blinds will be tested for the atrium like the ones tested for the auditorium and the list of different blinds can be found in the beginning of chapter 3.1.4.3. Comparison between sunny and cloudy sky for understanding of the connectivity or sense in time for day for different blinds will not be conducted for the atrium since already concluded for the blinds in the auditorium study. The blind selection study starts with analysing direct sun for view 1. Only the initial image (without blind), final image (the one given the lowest luminance ratio) and sense in connectivity study will be presented for the different views. This is conducted to provide a shorter and more readable result chapter, where a continued detailed analysis is gathered in appendix C with the “missing” images in between the initial and final images. DGP will not be used for view two and three though these scenarios and images lack of metrics for use of proper measurement and interpretation according to Jan Wienold (personal communication, October 3, 2014).

Ludde Gölén
Analysis & Results
76
Direct Sun – View 1, will try to find a suitable blind that can control direct sun whilst keeping some connectivity to the outside in the atrium office. Initial
Figure 3.53 Image representing view 1 during a sunny sky without blinds.
The intensity of direct sun for this scene without blinds will cause a high risk of visual discomfort. The sun is measured 37 times brighter than the screen and a DGP of 100 % indicates that no person could work under these conditions whilst experiencing visual comfort and performing efficiently. Further blinds (5% VLT blinds in appendix C) will be tested to lower the luminance ratio as well as to provide with a range of different scenarios for the client to choose among.
Sun = 9405 cd/m2
DGP=100% Without Blinds
Screen = 248 cd/m2
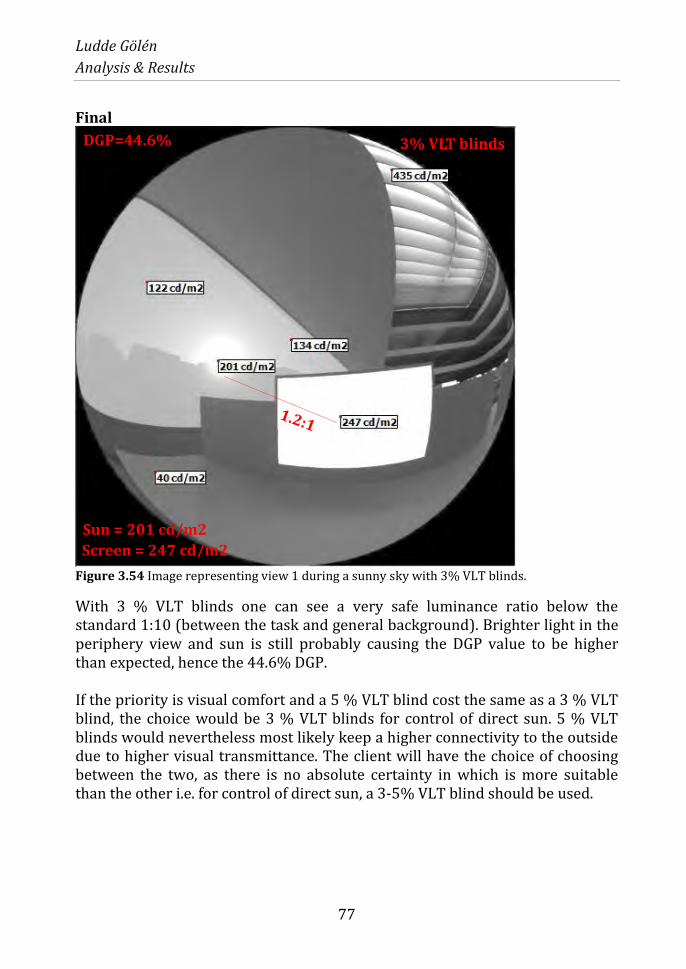
Ludde Gölén
Analysis & Results
77
Final
Figure 3.54 Image representing view 1 during a sunny sky with 3% VLT blinds.
With 3 % VLT blinds one can see a very safe luminance ratio below the standard 1:10 (between the task and general background). Brighter light in the periphery view and sun is still probably causing the DGP value to be higher than expected, hence the 44.6% DGP. If the priority is visual comfort and a 5 % VLT blind cost the same as a 3 % VLT blind, the choice would be 3 % VLT blinds for control of direct sun. 5 % VLT blinds would nevertheless most likely keep a higher connectivity to the outside due to higher visual transmittance. The client will have the choice of choosing between the two, as there is no absolute certainty in which is more suitable than the other i.e. for control of direct sun, a 3-5% VLT blind should be used.
DGP=44.6% 3% VLT blinds
Sun = 201 cd/m2
Screen = 247 cd/m2

Ludde Gölén
Analysis & Results
78
Reflected Glare from Skylight Baffles – View 2, will try to find a suitable blind for the internal glazing for people working in the upper floor (level 8) close to the atrium. This is to prevent glare reflected from baffles causing visual distraction when under direct sun. It also looks at the connectivity to the outside through the blind controlling reflected glare. First to be analysed is the case without blinds, to get a better understanding of actual reflected glare. 50% VLT blinds tested in appendix C. Initial
Figure 3.55 Image representing view 2 during a sunny sky without blinds.
The baffles during direct sun create a brightness measured 35 times brighter than the screen and a person seated next to the window will most likely sense visual discomfort though the luminance ratio has far exceeded the 1:10 ratio. Further blinds will be added, ending with 10% VLT blinds as the final image for this view.
Without Blinds
Baffles = 8659 cd/m2
Screen = 248 cd/m2
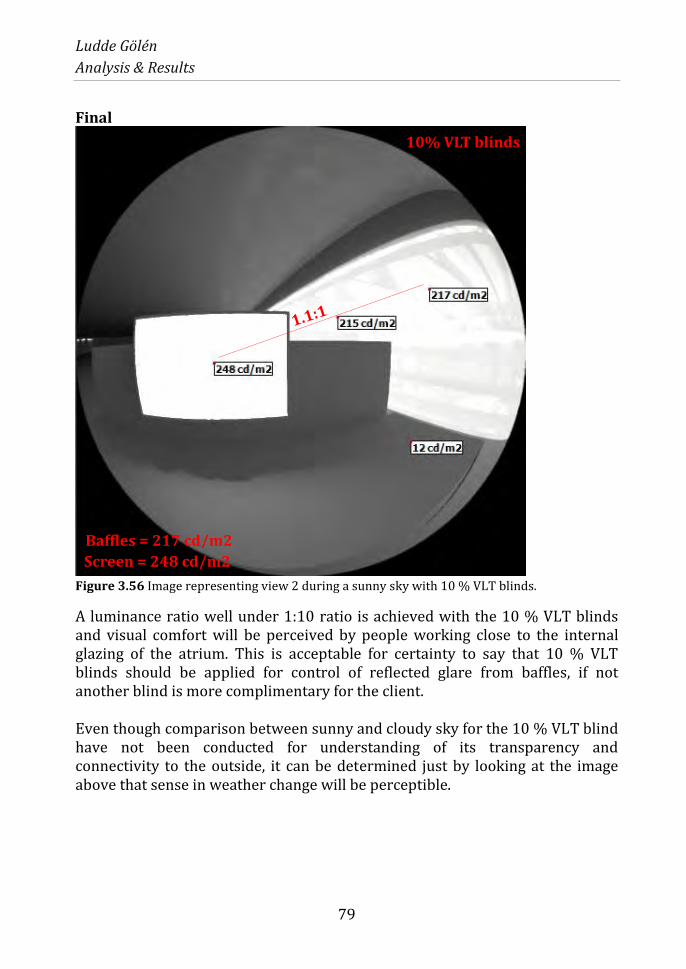
Ludde Gölén
Analysis & Results
79
Final
Figure 3.56 Image representing view 2 during a sunny sky with 10 % VLT blinds.
A luminance ratio well under 1:10 ratio is achieved with the 10 % VLT blinds and visual comfort will be perceived by people working close to the internal glazing of the atrium. This is acceptable for certainty to say that 10 % VLT blinds should be applied for control of reflected glare from baffles, if not another blind is more complimentary for the client. Even though comparison between sunny and cloudy sky for the 10 % VLT blind have not been conducted for understanding of its transparency and connectivity to the outside, it can be determined just by looking at the image above that sense in weather change will be perceptible.
10% VLT blinds
Baffles = 217 cd/m2
Screen = 248 cd/m2

Ludde Gölén
Analysis & Results
80
Reflected Glare from Skylight Baffles – View 3, will instead of finding a suitable blind, try to define a suitable reflectance value for the baffles so that reflected glare can be reduced to a comfortable level. First to be tested is a higher value of 70% reflectance. initial
Figure 3.57 Image representing view 3 during a sunny sky with 70 % reflectance for skylight baffles.
High values can be seen where reflected glare from baffles in this scene create a measured brightness of almost 9000 cd/m2 and visual discomfort is a high risk for people working in this condition. Approximately 1:36 in luminance ratio between screen and skylight baffles is considered to high even though the source of glare is more towards the periphery view than “immediate surrounding”. 60 % Reflectance tested in appendix C.
70% Reflectance
Baffles = 8967 cd/m2
Screen = 248 cd/m2
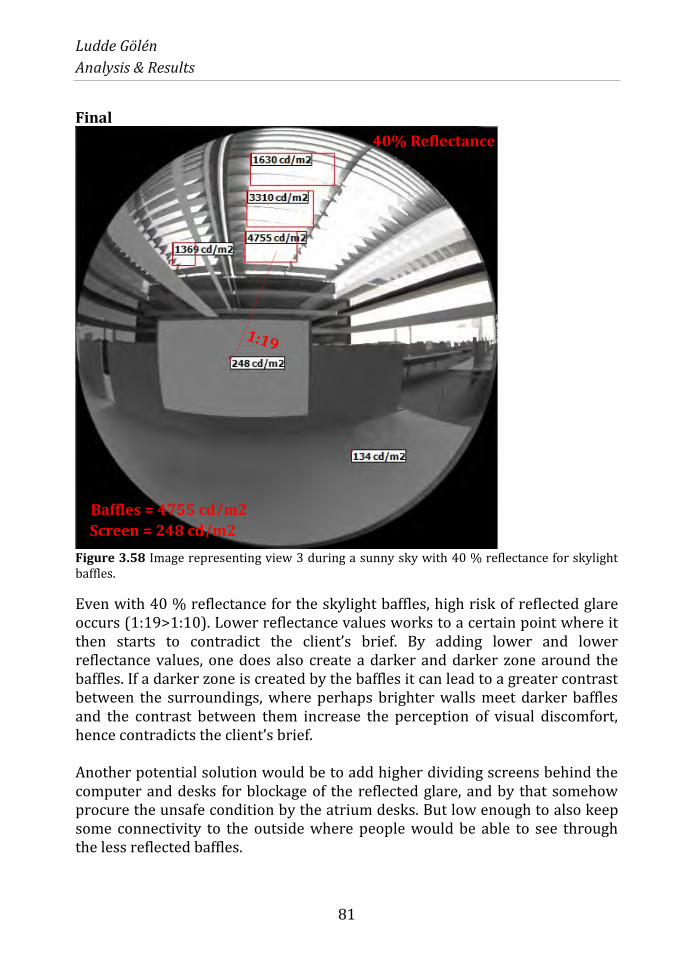
Ludde Gölén
Analysis & Results
81
Final
Figure 3.58 Image representing view 3 during a sunny sky with 40 % reflectance for skylight baffles.
Even with 40 % reflectance for the skylight baffles, high risk of reflected glare occurs (1:19>1:10). Lower reflectance values works to a certain point where it then starts to contradict the client’s brief. By adding lower and lower reflectance values, one does also create a darker and darker zone around the baffles. If a darker zone is created by the baffles it can lead to a greater contrast between the surroundings, where perhaps brighter walls meet darker baffles and the contrast between them increase the perception of visual discomfort, hence contradicts the client’s brief. Another potential solution would be to add higher dividing screens behind the computer and desks for blockage of the reflected glare, and by that somehow procure the unsafe condition by the atrium desks. But low enough to also keep some connectivity to the outside where people would be able to see through the less reflected baffles.
40% Reflectance
Baffles = 4755 cd/m2
Screen = 248 cd/m2

Ludde Gölén
Analysis & Results
82
Changing reflectance values should not be a key factor for reduction of reflected glare from baffles as there are no meaningful ways of doing so. To conclude a potential client choice among all these images is that a 3-5% VLT blind, a 20 % VLT blind, a 10 % VLT for internal glazing and a fixed roof shading device together will achieve visual comfort in the atrium all year around. These blinds will of course not be deployed during the same time but when its’ individual glare source occur i.e. direct sun, glare reflected from buildings and baffles. The 20 % VLT blinds will be applied for control of reflected glare from buildings that will occur during the same times as for the auditorium. Even though it was not analysed for the atrium, it will still be a source of glare though people can see the surrounding buildings when seated close to the eastern façade, hence it will be applied. The choice of these particular blinds and parameters being the most suitable design condition is that they provide a luminance ratio below 1:10 (between task and general background) and should therefore provide a safer condition with regard to visual comfort. This may once again not be the smartest or cheapest choice (compared to standards) but the goal was to deliver a range of options that consider the client’s criteria, which the lower VLT blinds analysis provide. The daylight autonomy study concluded that visual comfort may not evidently be the highest focus of the client criteria due to high levels of natural light. Perhaps there is a more balanced choice between the different blinds and images, creating a bit higher luminance ratio and therefore also a higher connectivity to the outside (due to higher VLT blinds). Like for the auditorium chapter this will be discussed in the conflict chapter below, compared to other interesting factors.
3.2.5 Conflicts between value-based decisions for the Atrium
This chapter will discuss and inform the reader upon various conflicts that may occur for the atrium space with regard to the previous studies made and the goal of the client’s brief. This chapter is used for speculative reasons and rough estimations will be assumed for the different parts discussed. The different targets or goals the client requested for the atrium was to be able to sense change in time of day i.e. clouds passing by, weather changes etc. Sufficient levels of natural light to be able to reduce electrical lighting demands

Ludde Gölén
Analysis & Results
83
i.e. use of DLDC. Last but not least was to procure favourable levels of brightness (visual comfort) where the glazing should not be measured substantially brighter than the primary focus on the stage. All of them were adequately achieved for the atrium space. High levels of natural light falls on to the atrium desk plane, mainly because of an additional roof skylight but also because the atrium compared to the auditorium has less surrounding buildings blocking any useful sunlight. Whilst high levels of natural light occur in the atrium, visual comfort can be achieved by adding blinds to the external and internal glazing and various glare issues will be controlled. At the same time as visual comfort is achieved, the blinds have such a material property that connectivity to the outside and sense in time of day is highly noticeable. Since high levels of natural light are achieved for the atrium space, even when blinds (20 % VLT) were deployed for sunlight over 2000 lux, no specific conflict between daylight availability and energy cost for lighting vs. visual comfort is created and will be neglected in this chapter. It is instead of more interest to see how beneficial DLDC for reduction in electrical lighting can be utilized for the space. Nonetheless, other similar conflicts occur for the atrium as for the auditorium but with different magnitudes and outcomes due to differences in geometry, natural light levels and location. Other similar conflicts for the atrium as for the auditorium:
Connectivity vs. visual comfort i.e. having lower VLT blinds reduces
the risk of visual discomfort but decreases the connectivity to the
outside due to low visual light transmittance through the blinds.
Regardless that the blinds create some connectivity to the outside.
Costs vs. visual comfort i.e. blinds can be relatively expensive and the
client might not see value in purchase of blinds to achieve something as
important like visual comfort. But if comparing to other costs (e.g.
salary), justified conclusions can be made to reach certainty of the value
in added blinds.
In the blind selection study it was concluded that three blinds needs to be applied to achieve visual comfort throughout the year. First a blind for control of direct sun (3-5% VLT), secondly a blind for control of glare reflected from buildings (20% VLT) and thirdly a blind for control of glare reflected on the skylight baffles (10% VLT). This enables the user to constantly and throughout the year experience visual comfort whilst keeping some connectivity to the
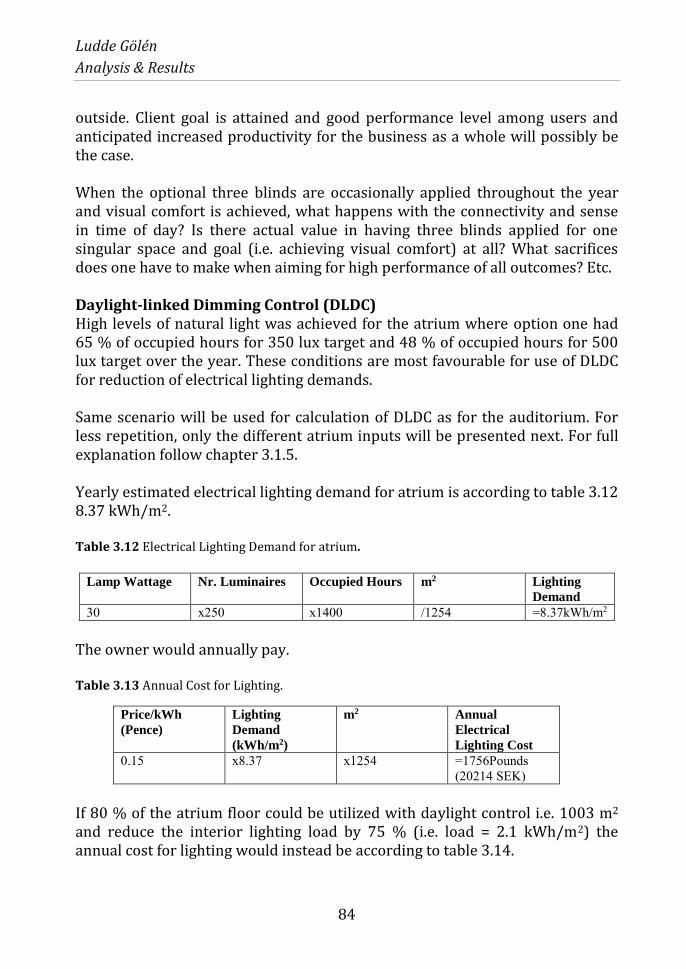
Ludde Gölén
Analysis & Results
84
outside. Client goal is attained and good performance level among users and anticipated increased productivity for the business as a whole will possibly be the case. When the optional three blinds are occasionally applied throughout the year and visual comfort is achieved, what happens with the connectivity and sense in time of day? Is there actual value in having three blinds applied for one singular space and goal (i.e. achieving visual comfort) at all? What sacrifices does one have to make when aiming for high performance of all outcomes? Etc. Daylight-linked Dimming Control (DLDC) High levels of natural light was achieved for the atrium where option one had 65 % of occupied hours for 350 lux target and 48 % of occupied hours for 500 lux target over the year. These conditions are most favourable for use of DLDC for reduction of electrical lighting demands. Same scenario will be used for calculation of DLDC as for the auditorium. For less repetition, only the different atrium inputs will be presented next. For full explanation follow chapter 3.1.5. Yearly estimated electrical lighting demand for atrium is according to table 3.12 8.37 kWh/m2. Table 3.12 Electrical Lighting Demand for atrium.
The owner would annually pay. Table 3.13 Annual Cost for Lighting.
Price/kWh
(Pence)
Lighting
Demand
(kWh/m2)
m2 Annual
Electrical
Lighting Cost
0.15 x8.37 x1254 =1756Pounds (20214 SEK)
If 80 % of the atrium floor could be utilized with daylight control i.e. 1003 m2 and reduce the interior lighting load by 75 % (i.e. load = 2.1 kWh/m2) the annual cost for lighting would instead be according to table 3.14.
Lamp Wattage Nr. Luminaires Occupied Hours m2 Lighting
Demand
30 x250 x1400 /1254 =8.37kWh/m2
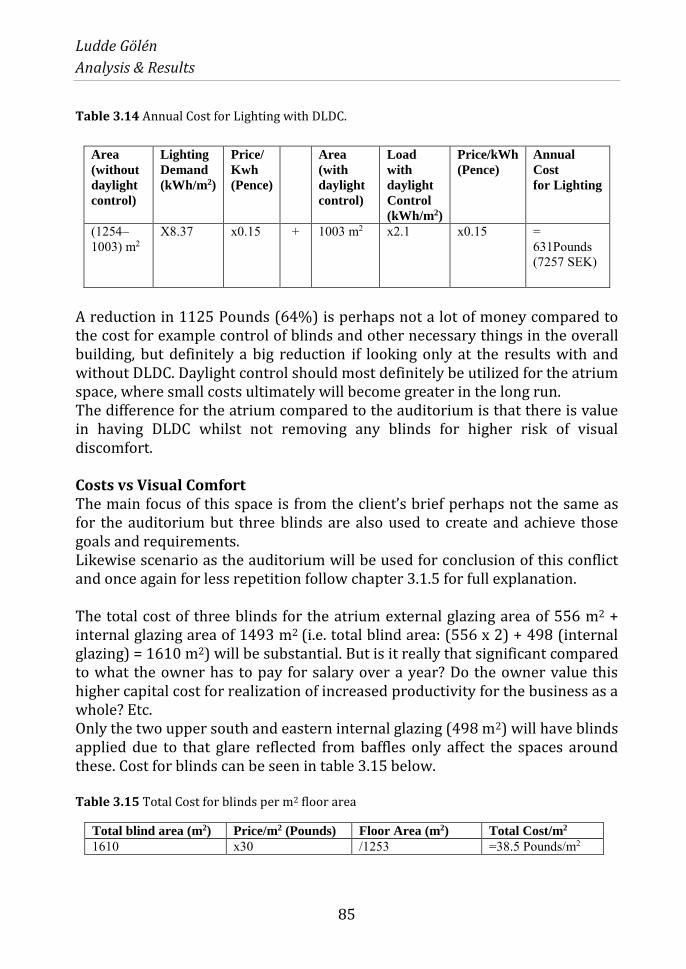
Ludde Gölén
Analysis & Results
85
Table 3.14 Annual Cost for Lighting with DLDC.
A reduction in 1125 Pounds (64%) is perhaps not a lot of money compared to the cost for example control of blinds and other necessary things in the overall building, but definitely a big reduction if looking only at the results with and without DLDC. Daylight control should most definitely be utilized for the atrium space, where small costs ultimately will become greater in the long run. The difference for the atrium compared to the auditorium is that there is value in having DLDC whilst not removing any blinds for higher risk of visual discomfort. Costs vs Visual Comfort The main focus of this space is from the client’s brief perhaps not the same as for the auditorium but three blinds are also used to create and achieve those goals and requirements. Likewise scenario as the auditorium will be used for conclusion of this conflict and once again for less repetition follow chapter 3.1.5 for full explanation. The total cost of three blinds for the atrium external glazing area of 556 m2 + internal glazing area of 1493 m2 (i.e. total blind area: (556 x 2) + 498 (internal glazing) = 1610 m2) will be substantial. But is it really that significant compared to what the owner has to pay for salary over a year? Do the owner value this higher capital cost for realization of increased productivity for the business as a whole? Etc. Only the two upper south and eastern internal glazing (498 m2) will have blinds applied due to that glare reflected from baffles only affect the spaces around these. Cost for blinds can be seen in table 3.15 below. Table 3.15 Total Cost for blinds per m2 floor area
Total blind area (m2) Price/m2 (Pounds) Floor Area (m2) Total Cost/m2
1610 x30 /1253 =38.5 Pounds/m2
Area
(without
daylight
control)
Lighting
Demand
(kWh/m2)
Price/
Kwh
(Pence)
Area
(with
daylight
control)
Load
with
daylight
Control
(kWh/m2)
Price/kWh
(Pence)
Annual
Cost
for Lighting
(1254– 1003) m2
X8.37 x0.15 + 1003 m2 x2.1 x0.15 = 631Pounds (7257 SEK)
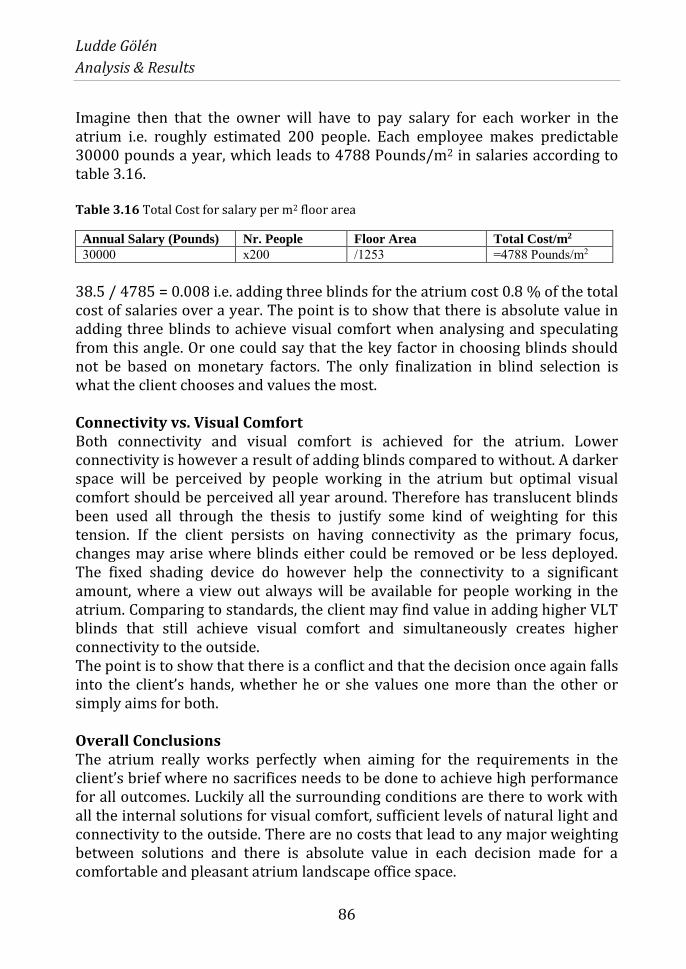
Ludde Gölén
Analysis & Results
86
Imagine then that the owner will have to pay salary for each worker in the atrium i.e. roughly estimated 200 people. Each employee makes predictable 30000 pounds a year, which leads to 4788 Pounds/m2 in salaries according to table 3.16. Table 3.16 Total Cost for salary per m2 floor area
Annual Salary (Pounds) Nr. People Floor Area Total Cost/m2
30000 x200 /1253 =4788 Pounds/m2 38.5 / 4785 = 0.008 i.e. adding three blinds for the atrium cost 0.8 % of the total cost of salaries over a year. The point is to show that there is absolute value in adding three blinds to achieve visual comfort when analysing and speculating from this angle. Or one could say that the key factor in choosing blinds should not be based on monetary factors. The only finalization in blind selection is what the client chooses and values the most. Connectivity vs. Visual Comfort Both connectivity and visual comfort is achieved for the atrium. Lower connectivity is however a result of adding blinds compared to without. A darker space will be perceived by people working in the atrium but optimal visual comfort should be perceived all year around. Therefore has translucent blinds been used all through the thesis to justify some kind of weighting for this tension. If the client persists on having connectivity as the primary focus, changes may arise where blinds either could be removed or be less deployed. The fixed shading device do however help the connectivity to a significant amount, where a view out always will be available for people working in the atrium. Comparing to standards, the client may find value in adding higher VLT blinds that still achieve visual comfort and simultaneously creates higher connectivity to the outside. The point is to show that there is a conflict and that the decision once again falls into the client’s hands, whether he or she values one more than the other or simply aims for both. Overall Conclusions The atrium really works perfectly when aiming for the requirements in the client’s brief where no sacrifices needs to be done to achieve high performance for all outcomes. Luckily all the surrounding conditions are there to work with all the internal solutions for visual comfort, sufficient levels of natural light and connectivity to the outside. There are no costs that lead to any major weighting between solutions and there is absolute value in each decision made for a comfortable and pleasant atrium landscape office space.
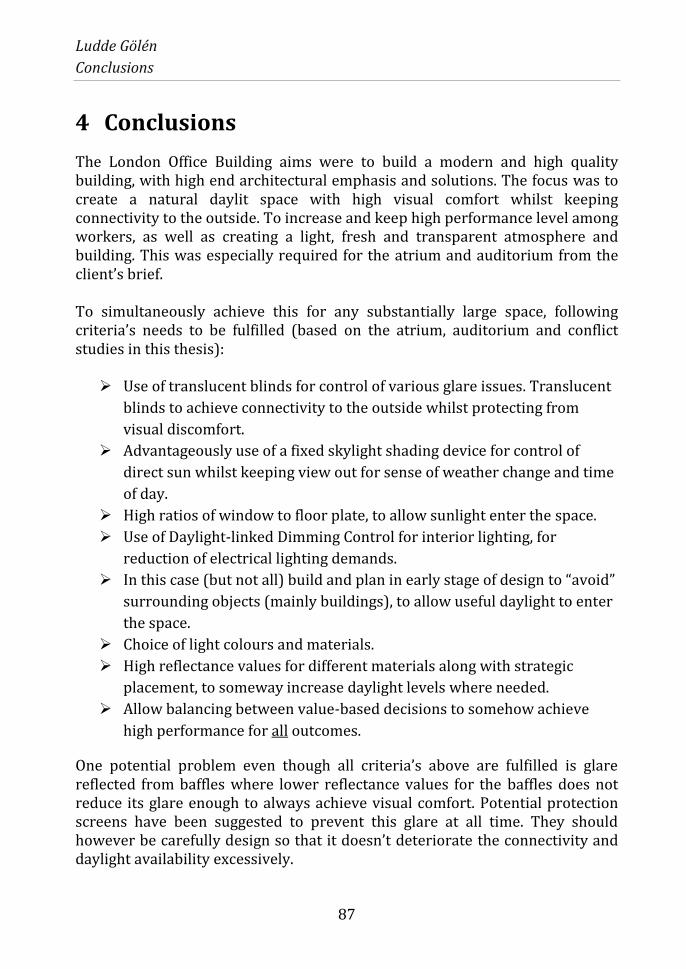
Ludde Gölén
Conclusions
87
4 Conclusions
The London Office Building aims were to build a modern and high quality building, with high end architectural emphasis and solutions. The focus was to create a natural daylit space with high visual comfort whilst keeping connectivity to the outside. To increase and keep high performance level among workers, as well as creating a light, fresh and transparent atmosphere and building. This was especially required for the atrium and auditorium from the client’s brief. To simultaneously achieve this for any substantially large space, following criteria’s needs to be fulfilled (based on the atrium, auditorium and conflict studies in this thesis):
Use of translucent blinds for control of various glare issues. Translucent
blinds to achieve connectivity to the outside whilst protecting from
visual discomfort.
Advantageously use of a fixed skylight shading device for control of
direct sun whilst keeping view out for sense of weather change and time
of day.
High ratios of window to floor plate, to allow sunlight enter the space.
Use of Daylight-linked Dimming Control for interior lighting, for
reduction of electrical lighting demands.
In this case (but not all) build and plan in early stage of design to “avoid”
surrounding objects (mainly buildings), to allow useful daylight to enter
the space.
Choice of light colours and materials.
High reflectance values for different materials along with strategic
placement, to someway increase daylight levels where needed.
Allow balancing between value-based decisions to somehow achieve
high performance for all outcomes.
One potential problem even though all criteria’s above are fulfilled is glare reflected from baffles where lower reflectance values for the baffles does not reduce its glare enough to always achieve visual comfort. Potential protection screens have been suggested to prevent this glare at all time. They should however be carefully design so that it doesn’t deteriorate the connectivity and daylight availability excessively.
Ludde Gölén
Conclusions
88
For optimization of the visual comfort in the space, controls for the blinds should be applied. Where the controls then only deploy the blinds when a potential glare issue is current and higher daylight availability and connectivity to the outside could be realized. Unexpected DGP values occurred for some of the situations which may be the result of some cases that did not fulfil the metrics criteria of the software “evalglare”. In some cases DGP was unreliable due to scenarios and conditions that deviated from the original task to surrounding situation. Comparing all the value-based decisions regarding the atrium and auditorium (i.e. adding blinds, utilization of DLDC, use of a fixed shading device etc.) to annual payments for salaries, one can see that there is absolute value in each value-based decision to achieve and overcome the client’s brief. Additional analysis and comparison for the different studies could be made for deeper diversity in this thesis. Due to the fact that this thesis has been written from a consultant’s perspective and studies have followed the client’s brief, it was not conducted. It has however still conducted necessary analysis and studies to come to valuable results and conclusions where the requirements from the client’s brief was clearly met. The objectives of this thesis were therefore also met.

Ludde Gölén
References
89
5 References
(2002). Retrieved March 2, 2014, from Radiance, Synthetic Imaging System: http://radsite.lbl.gov/radiance/framew.html
Agency, I. E. (2013). Solar Heating & Cooling Programme. Retrieved February 23, 2014, from http://task40.iea-shc.org/
Andersen, S. A. (2009). The Adaptation of Daylight Glare Probability to Dynamic Metrics in a computational Setting. Lux europa, (p. 8). Istanbul.
Araji, M. T. (2008). Balancing Human Visual Comfort and Psychological Wellbeing in Private Offices.
Autodesk. (2014). Retrieved March 2, 2014, from Autodesk Ecotect Analysis: http://usa.autodesk.com/ecotect-analysis/
Blomsterberg, Å. (2008). Möjligheter med Kontorsbyggnader i glas i Norden. Lund: KFS AB.
Cardy, A. (2013). Delivering good indoor air quality cost effectively. Modern Building Services, 48.
Division, I. E. (2000). Energy cost and IAQ performance of ventilation systems and control. Washington, D.C.: United States Environmental Protection Agency.
ECEEE, E. c. (2014). Retrieved February 23, 2014, from http://www.eceee.org/events/calendar/2014/IEECB14
Frankel, M. (2014). Retrieved from Advanced Buildings - Energy performance solutions from NBI: http://patternguide.advancedbuildings.net/using-this-guide/analysis-methods/useful-daylight-illuminance
Hayashi, T. (2006). http://www.eizo.com.tw/support/wp/pdf/wp_06-001A.pdf. Retrieved 2014, from http://www.eizo.com.tw/support/wp/pdf/wp_06-001A.pdf
Horst, S. (2013). Daylighting and LEED v4: What this means for design and allied professionals. Greenbuild International Conference and Expo 2013.
Lagios, K. (2012). Retrieved March 2, 2014, from DIVA for Rhino environmental analysis for buildings: http://diva4rhino.com/
METREL. (2002). The Illuminance Handbook. Royal Institute of British Architects, R. I. (2013). RIBA plan of work. Retrieved
March 9, 2014, from http://www.ribaplanofwork.com/ VisualARC. (n.d.). VisualARC architectural tools for Rhino. Retrieved March 2,
2014, from http://www.visualarq.com/info/what-is-rhino/ Voll, H. (2008). Cooling Demand and Daylight in Commercial Buildings The
Influence of Window Design. Gothenburg: Chalmers University of Technology.
Wienold, J. (2013). Glare analysis and metrics. Retrieved from http://api.ning.com/files/NTojadR4gpPh1Uczg9jxV6iVSmuqJsJilwM9yC
Ludde Gölén
90
wqg-lM80D-WJygRZVJTjW7yrkHTcAn3suo359lBwxSpYqv7wVXkosalpbI/documentation_v1.08.pdf.
Wilson, P. t. (2011). Daylighting. Routledge.

Ludde Gölén
Appendix A
91
Appendix A
Sun Path Diagrams, Auditorium: The following points will be presented with only a text and not with a following figure:
Point E is exposed to direct sunlight for approximately one hour of the
morning during the period between March and September.
Point F receives direct sunlight for approximately one morning hour
during all but winter months.
Point G experiences direct sunlight for approximately an hour and a half
during summer mornings.
Point H receives direct sunlight for approximately an hour and a half on
mornings from April to September.
Point I receives direct sunlight for approximately an hour and half
during spring and summer months.
Point J experiences direct sunlight for approximately an hour on very
early summer mornings.
Point K receives direct sunlight for approximately an hour on very early
mornings from May to August.
Point L receives direct sunlight for approximately an hour and a half for
a brief period in April and September.
Point M experiences direct sunlight only during very early mornings
between May and August.
Point N experiences direct sunlight for only a few minutes during a brief
morning period in the spring and summer.
Point O experiences a similar condition like point N.
There is not much direct sun coming in to the auditorium space but like mentioned before it is still direct sun and will cause visual discomfort for people seated at these points and time.
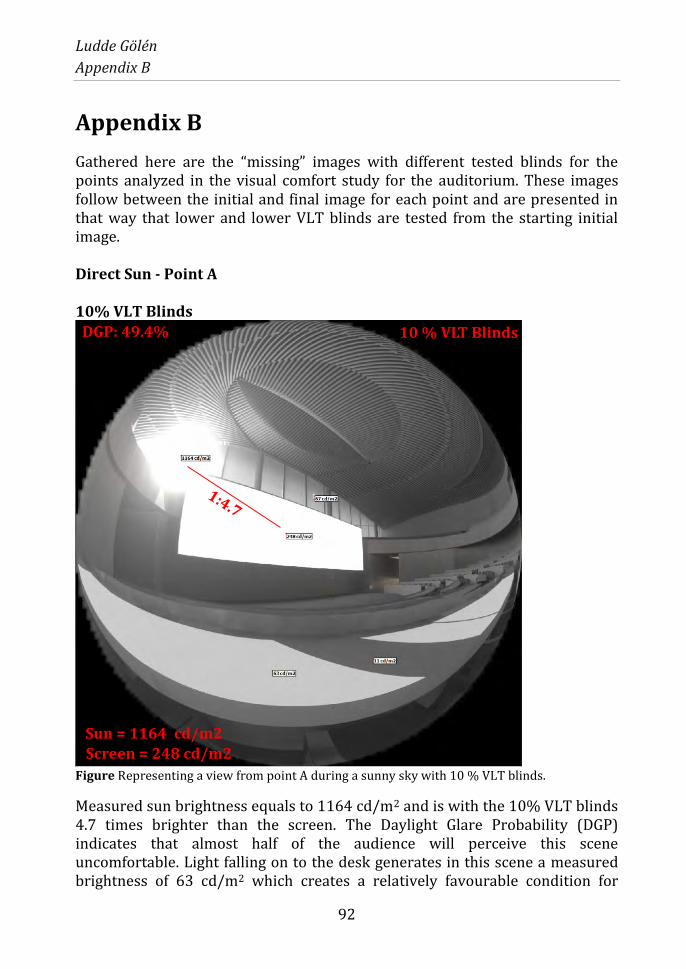
Ludde Gölén
Appendix B
92
Appendix B
Gathered here are the “missing” images with different tested blinds for the points analyzed in the visual comfort study for the auditorium. These images follow between the initial and final image for each point and are presented in that way that lower and lower VLT blinds are tested from the starting initial image. Direct Sun - Point A 10% VLT Blinds
Figure Representing a view from point A during a sunny sky with 10 % VLT blinds.
Measured sun brightness equals to 1164 cd/m2 and is with the 10% VLT blinds 4.7 times brighter than the screen. The Daylight Glare Probability (DGP) indicates that almost half of the audience will perceive this scene uncomfortable. Light falling on to the desk generates in this scene a measured brightness of 63 cd/m2 which creates a relatively favourable condition for
DGP: 49.4% 10 % VLT Blinds
Sun = 1164 cd/m2 Screen = 248 cd/m2

Ludde Gölén
Appendix B
93
performing various tasks without disturbing glare. A luminance ratio of 1:4.7 is below 1:20 and should therefore not create any visual discomfort even though the DGP indicates the opposite. This is case/scenario where DGP might not be absolute accurate but still gives an indication to consider. 5 % VLT Blinds
Figure Representing a view from point A during a sunny sky with 5 % VLT blinds.
Sun brightness is reduced to 551 cd/m2 and is in this case measured 2.2 times brighter than the screen (focal point). Visual comfort is certainly a fact. DGP is considered to be interpreted as previous blind. Further blinds will be tested to produce a wider range of design scenarios and conditions for the client.
DGP: 49.3% 5 % VLT Blinds
Sun = 551 cd/m2 Screen = 248 cd/m2

Ludde Gölén
Appendix B
94
3 % VLT Blinds
Figure Representing a view from point A during a sunny sky with 3 % VLT blinds.
The sun (437 cd/m2) is with the 3 % VLT blinds measured 1.8 times brighter than the screen and visual discomfort will not be perceived by the audience. The DGP is basically unchanged from the 10 % VLT blinds and indicates that almost 50 % would be distracted under these circumstances. Why the DGP indicates such a high value is explained under DGP in the interpretation chapter.
DGP: 47.8% 3 % VLT Blinds
Sun = 437 cd/m2 Screen = 248 cd/m2
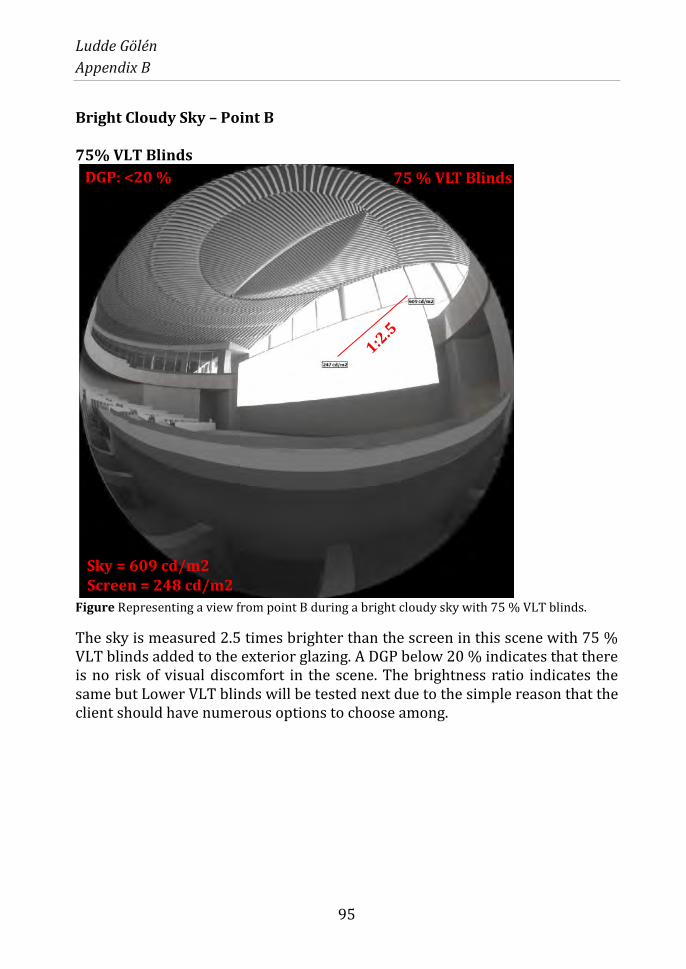
Ludde Gölén
Appendix B
95
Bright Cloudy Sky – Point B 75% VLT Blinds
Figure Representing a view from point B during a bright cloudy sky with 75 % VLT blinds.
The sky is measured 2.5 times brighter than the screen in this scene with 75 % VLT blinds added to the exterior glazing. A DGP below 20 % indicates that there is no risk of visual discomfort in the scene. The brightness ratio indicates the same but Lower VLT blinds will be tested next due to the simple reason that the client should have numerous options to choose among.
DGP: <20 % 75 % VLT Blinds
Sky = 609 cd/m2 Screen = 248 cd/m2
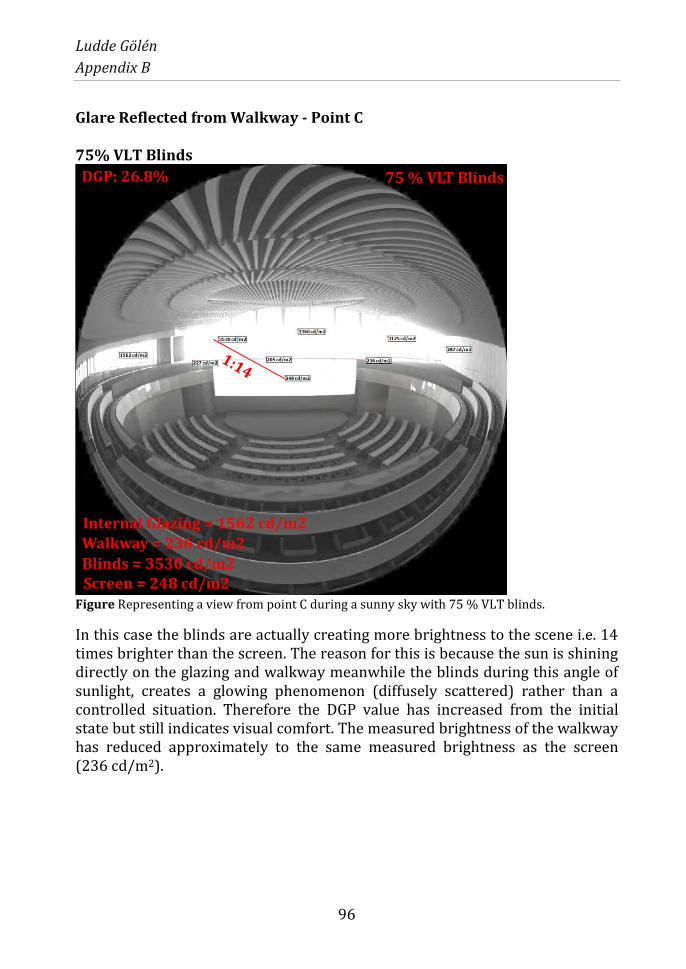
Ludde Gölén
Appendix B
96
Glare Reflected from Walkway - Point C 75% VLT Blinds
Figure Representing a view from point C during a sunny sky with 75 % VLT blinds.
In this case the blinds are actually creating more brightness to the scene i.e. 14 times brighter than the screen. The reason for this is because the sun is shining directly on the glazing and walkway meanwhile the blinds during this angle of sunlight, creates a glowing phenomenon (diffusely scattered) rather than a controlled situation. Therefore the DGP value has increased from the initial state but still indicates visual comfort. The measured brightness of the walkway has reduced approximately to the same measured brightness as the screen (236 cd/m2).
DGP: 26.8% 75 % VLT Blinds
Blinds = 3530 cd/m2 Screen = 248 cd/m2
Internal Glazing = 1562 cd/m2 Walkway = 236 cd/m2

Ludde Gölén
Appendix B
97
50% VLT Blinds
Figure Representing a view from point C during a sunny sky with 50 % VLT blinds.
With 50 % VLT blinds there is a small reduction in measured brightness where the blinds are measured 9 times brighter than the screen. The measured brightness of the walkway is barely unchanged and is still the same as the screen and will not be perceived as a distracting source of glare. Adding blinds is evidently not the way forward for this point. The architect has introduced a new model for the auditorium where an additional balustrade is thought to reduce sources of glare but also work to enclose the space and make it more useful for its purpose which is conducted in the final image of point C.
DGP: 25.4% 50 % VLT Blinds
Blinds = 2286 cd/m2 Screen = 248 cd/m2
Internal Glazing = 1557 cd/m2 Walkway = 221 cd/m2

Ludde Gölén
Appendix B
98
Glare Reflected from Surrounding Buildings – Point D 75% VLT Blinds
Figure Representing a view from point D during sunny sky with 75 % VLT blinds.
The surrounding buildings generate a measured brightness of 911 cd/m2 and are 3.7 times brighter than the screen (below 1:20). The DGP value is below 20 % and indicates that this scene is perceived comfortable and lower VLT blinds will not necessarily have to be added. But for the same reason as before lower VLT blinds will be tested.
DGP: <20% 75 % VLT Blinds
Buildings = 911 cd/m2 Screen = 248 cd/m2
Internal Glazing = 1747 cd/m2

Ludde Gölén
Appendix B
99
Dark 30% VLT Blinds
Figure Representing a view from point D during sunny sky with dark 30 % VLT blinds.
Dark Translucent 30 % VLT blinds creates sufficient contrast between glare reflected from buildings and screen, just like previous blinds. The opposite buildings create a measured brightness almost double the screen and visual discomfort will still not be perceived from an audience perspective. A DGP below 20 % indicates that no visual distraction will be perceived with a dark 30 % VLT blind. Since brightness ratio is the defining tool for determining visual comfort and the client should have a wide range of different settings and light conditions to choose from, a 20 % VLT blind has also been tested (final image).
DGP: <20% 30 % VLT Blinds
Buildings = 418 cd/m2 Screen = 248 cd/m2
Internal Glazing = 1749 cd/m2
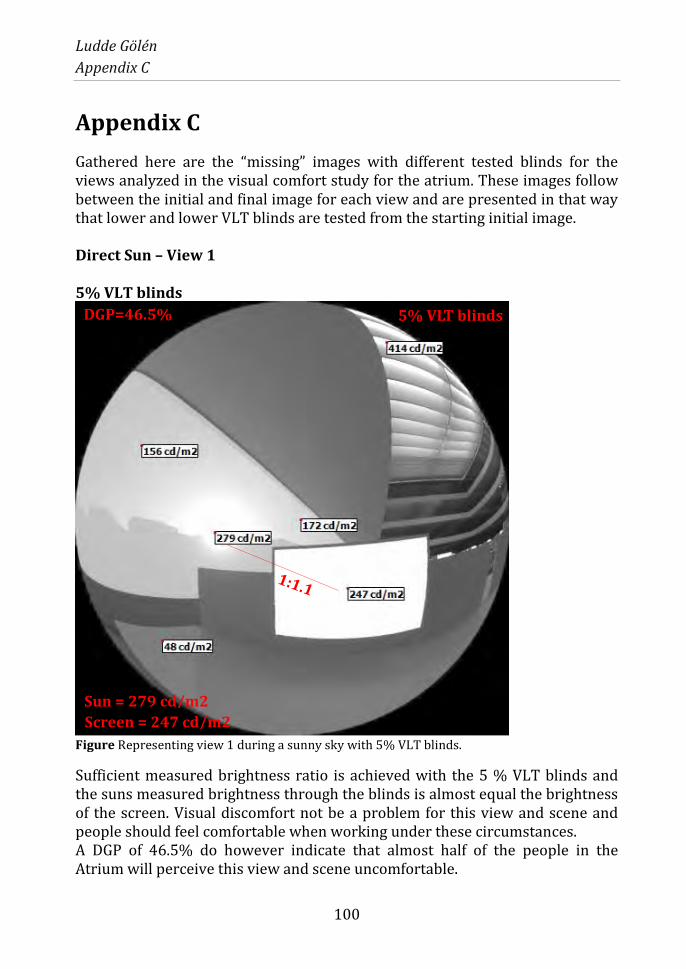
Ludde Gölén
Appendix C
100
Appendix C
Gathered here are the “missing” images with different tested blinds for the views analyzed in the visual comfort study for the atrium. These images follow between the initial and final image for each view and are presented in that way that lower and lower VLT blinds are tested from the starting initial image. Direct Sun – View 1 5% VLT blinds
Figure Representing view 1 during a sunny sky with 5% VLT blinds.
Sufficient measured brightness ratio is achieved with the 5 % VLT blinds and the suns measured brightness through the blinds is almost equal the brightness of the screen. Visual discomfort not be a problem for this view and scene and people should feel comfortable when working under these circumstances. A DGP of 46.5% do however indicate that almost half of the people in the Atrium will perceive this view and scene uncomfortable.
DGP=46.5% 5% VLT blinds
Sun = 279 cd/m2
Screen = 247 cd/m2

Ludde Gölén
Appendix C
101
In the upper right part of the image above, there is brighter light coming through the skylight baffles. This light is in the periphery view and therefore not considered as high risk. This brighter light might be the reason why a higher DGP value than expected occurs. Like mention for the auditorium the sun might also affect the DGP value negatively due to that it is still included in view, even though it is shaded from the blinds. Reflected Glare from Skylight Baffles – View 2 50% VLT Blinds
Figure Representing view 2 during a sunny sky with 50 % VLT blinds.
A fairly low luminance ratio and DGP value just above 20 % indicates that a person being seated at this desk will not perceive this scene uncomfortable with regard to visual glare.
50 % VLT blinds
Baffles = 1157 cd/m2
Screen = 248 cd/m2
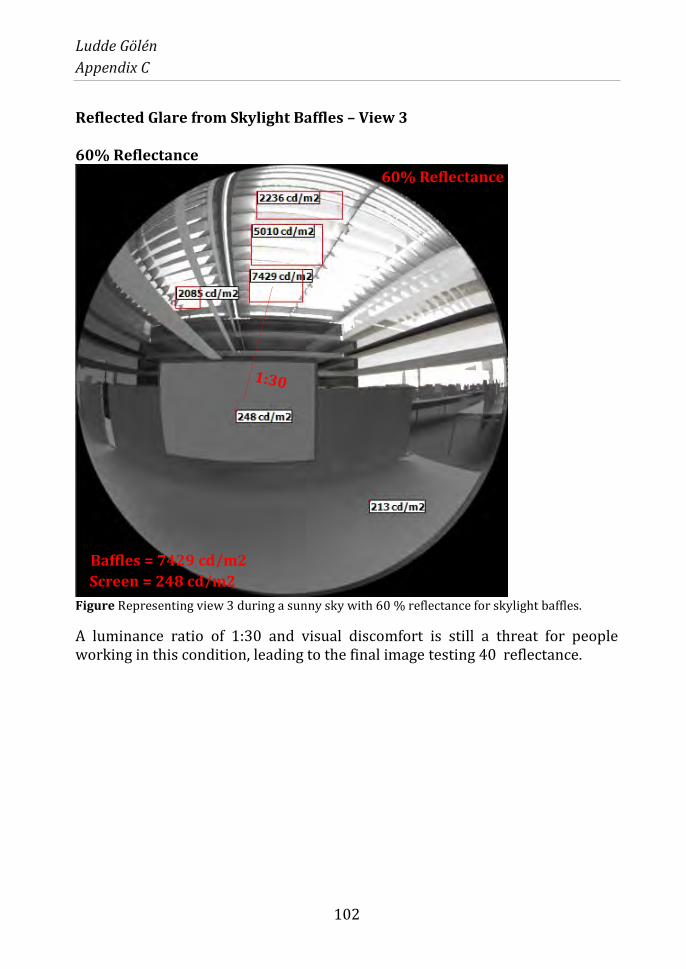
Ludde Gölén
Appendix C
102
Reflected Glare from Skylight Baffles – View 3 60% Reflectance
Figure Representing view 3 during a sunny sky with 60 % reflectance for skylight baffles.
A luminance ratio of 1:30 and visual discomfort is still a threat for people working in this condition, leading to the final image testing 40 reflectance.
60% Reflectance
Baffles = 7429 cd/m2
Screen = 248 cd/m2

Dept of Architecture and Built Environment: Division of Energy and Building DesignDept of Building and Environmental Technology: Divisions of Building Physics and Building Services