dawood hercules
TRANSCRIPT

Institute of Business Management, Karachi
Financial Statement’s AnalysisAnalysis of “Dawood Hercules Chemicals Ltd.” In Comparison with Fertilizer Sector

Dear Sir
Attached is the term Report on Financial Statement Analysis of Dawood Hercules Chemicals Ltd. Along with the industry analysis of fertilizer sector. This report has been prepared as a course requirement for “Analysis of Financial Statement”. I have tried to meet your requirements and I hope you will find this report satisfactory.
As mentioned in the report, I have done the internal and external analysis of Dawood Hercules, with the help of financial ratio and various techniques we have learned throughout the course.
All financial data used is authentic, obtained from the website of the subject organization, financial statements are also attached.
Yours Sincerely
Contents
2

Fertilizer Sector Outlook.....................................................................................................................................................................5
Agriculture Sector............................................................................................................................................................................5
Types Of Fertilizer...........................................................................................................................................................................6
Global Scenario...............................................................................................................................................................................6
Pricing..............................................................................................................................................................................................9
Local Arena.................................................................................................................................................................................9
International versus Local..............................................................................................................................................................10
Urea Prices.................................................................................................................................................................................10
DAP Prices.....................................................................................................................................................................................11
Demand & Supply.........................................................................................................................................................................12
Taxes..............................................................................................................................................................................................13
The Dawood Group...........................................................................................................................................................................14
Dawood Hercules...............................................................................................................................................................................15
Vision & Mission...........................................................................................................................................................................15
Product Line...................................................................................................................................................................................16
Production Facilities......................................................................................................................................................................17
Technical Data...............................................................................................................................................................................17
Ratio Analysis (Internal & External Comparison)............................................................................................................................18
Financial Ratios of Dawood Hercules (2001-08)..........................................................................................................................18
Average of Financial Ratios of Fertilizer Sector...........................................................................................................................19
Analysis.....................................................................................................................................................................................20
Horizontal Indexed Income Statement (2001-08).........................................................................................................................23
Analysis.....................................................................................................................................................................................24
Horizontal Indexed Balance Sheet (2001-08)................................................................................................................................25
Analysis.....................................................................................................................................................................................27
Vertical Common Sized Income Statement (2001-08)..................................................................................................................28
Vertical Common Sized Balance Sheet (2001-08)........................................................................................................................29
Analysis.....................................................................................................................................................................................31
Horizontal YoY Rs. and % Analysis (2001-08)................................................................................................................................32
Horizontal YoY Income Statement Rs. Change (2001-08)...........................................................................................................32
Horizontal YoY Balance Sheet Rs. Change (2001-08).................................................................................................................33
Horizontal YoY Income Statement % Change (2001-08).............................................................................................................35
3

Horizontal YoY Balance Sheet % Change (2001-08)...................................................................................................................36
DuPont Return on Equity...................................................................................................................................................................38
Five Component Disaggregation...................................................................................................................................................38
Analysis.....................................................................................................................................................................................39
Conclusion and Recommendations....................................................................................................................................................40
Future Outlook & Insight for Investors.............................................................................................................................................40
References..........................................................................................................................................................................................41
Appendix............................................................................................................................................................................................42
PROFIT AND LOSS ACCOUNT (PKR).....................................................................................................................................42
BALANCE SHEET (PKR)............................................................................................................................................................43
4

Fertilizer Sector Outlook
Agriculture Sector
The undeniable importance of the agriculture sector to the economy of Pakistan is reflected in its
contribution to national output, employment and export earnings. This sector contributes 22% to
the country's Gross Domestic Product (GDP) and employs 43% of total labor force. Growth in
this area of Economy is vital for poverty alleviation, as about 66 percent of rural population is
directly or indirectly dependent on the agriculture sector for sustenance. Pakistan’s major source
of foreign exchange earnings is the textile sector which also relies on agricultural performance.
The major crops of Pakistan are wheat, cotton, rice and sugarcane, which make up 7% of the
country’s GDP.
Fertilizer has a significant contribution in increasing crop yields and productivity. Proper
application of nutrients helps in efficient utilization of limited natural resources such as land and
water. Fertilizers improve crop yield by removing the deficiency of chemical elements taken
from the soil by harvesting, grazing, leaching or erosion. Coupled with improved seeds, better
insecticides and more effective fungicides, chemical fertilizers play a vital role in boosting
agricultural output. With proper farmer education and increased awareness, the fertilizer off-take
can improve substantially. Nutrient application in suitable quantities can further improve farm
productivity, thereby helping in eradicating poverty.
5

Types Of Fertilizer
Urea, which represents 65% of total fertilizer consumed and di-ammonium phosphate (DAP),
which accounts for 18%, are the main types of fertilizer used in Pakistan, but there is a total of
eight different fertilizer products which fall into three categories.
Urea, along with calcium ammonium nitrate (CAN) and ammonium sulphate (AS) together make
up almost three fourths of total fertilizer consumption and come under the nitrogenous category.
Under the phosphatic category which makes up about 27%, is DAP, triple super phosphate
(TSP), single super phosphate (SSP) and nitro phosphate (NP). And under the last category,
potassic is sulphate of potash which makes up only 1%. Since the soil in Pakistan generally
tends to be deficient in nitrogen, urea is the most used fertilizer. DAP is used, as most phosphatic
fertilizers are to counter the effect of the acidic urea and maintain levels of fertility in the soil.
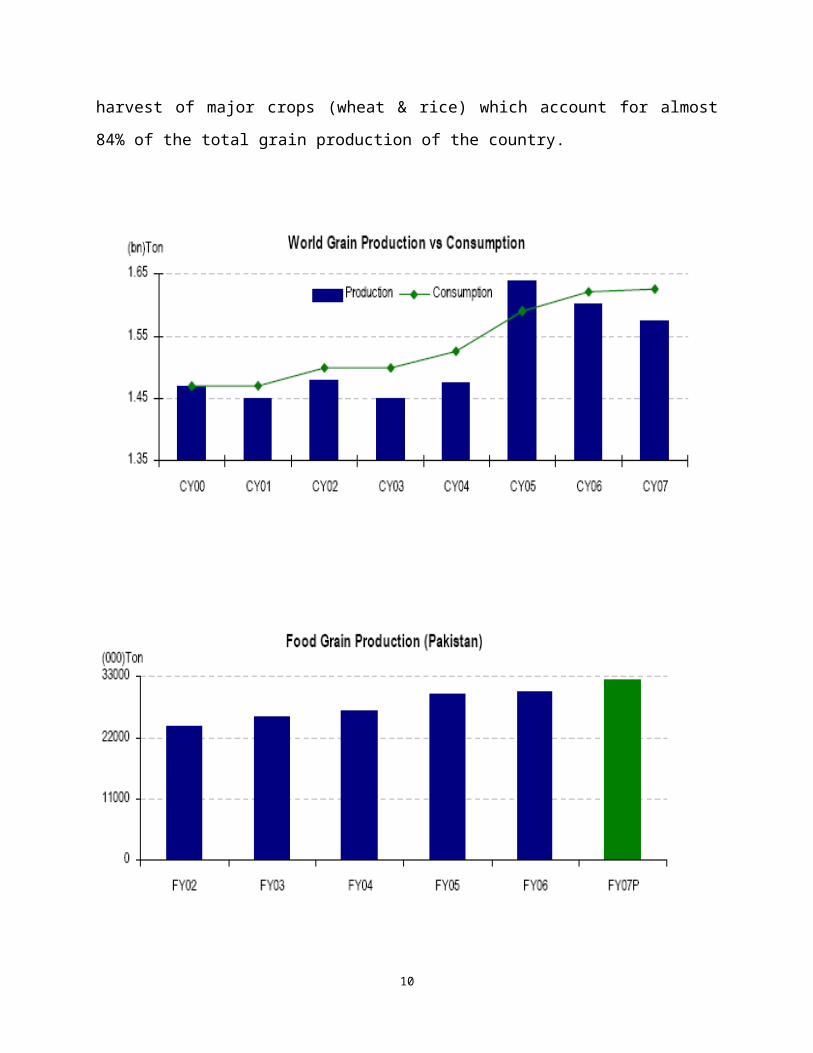
Global Scenario
The world grain consumption has outpaced production in six of the last seven years, with 2005
being the only exception, in which production superseded supply due to favorable weather in
almost all the major grain producing countries. With the growing demand of food and rapid
increase in demand for biofuels, the grain consumption growth has witnessed an increase of 2%
in 2007 from the historical average rate of 1.2% p.a. This has led to a widening gap between
consumption and production resulting in sharp increase in food prices in the global market.
During 2007, total global production of grains was recorded at 2.3bn tons, up 4% YoY. Despite,
the increase in production the global commodity prices have climbed significantly during the
past twelve months on the back of rising demand from emerging economies. Corn, wheat, and
rice account for about 85% of the global grain harvest (in terms of weight), while sorghum,
millet, barley, oats, and other less common grains make up the rest. China, India, and the United
6

States alone account for 46% of global grain production; Europe, including the former Soviet
states, grow another 21%.
In 2007, a 200mn ton jump in the global coarse grain harvest was responsible for nearly all of the
increase in the total grain harvest. Production of coarse grains a group that includes corn, barley,
sorghum, and other grains fed mainly to animals increased 10% from 985mn tons in 2006 to
1,080mn tons in 2007. During 2007, a significant amount of global corn production was used in
producing biofuels, the use of which is being promoted in developed countries (mainly EU and
USA). Governments in developed countries have been encouraging the use of biofuels primarily
due to (1) Increasing price of international crude oil and (2) Bio-fuels are environment friendly.
Out of a total of 784mn tons of corn harvested during 2007, about 255mn tons or 32.5% was
used in extracting biofuels which has resulted in sharp increase in price of the commodity.
Higher corn prices prompted many a farmers in various countries (China, Brazil and the United
States) to switch to corn harvesting. Another major consumer of grains is the livestock sector,
which accounted for approximately 627mn tons (27%) in the form of feed for the cattle. Demand
of grains from this sector has grown rapidly over the past few years on account of higher
consumption of dairy products and meat by the developing countries especially China, India and
Brazil.
The amount of grain stored by governments, a good measure of the global cushion against poor
harvests and rising prices continues to decline. Global cereal stocks were expected to stand at
318mn tons by the close of the 2007 season, equivalent to about 14 percent of annual
consumption, lowest since many years. In comparison to the global scenario, Pakistan’s food
grain production has witnessed a rising trend over the years registering a 4-year CAGR (FY02-
06) of 5.7% on the back of good harvest of major crops (wheat & rice) which account for almost
84% of the total grain production of the country.
7

8

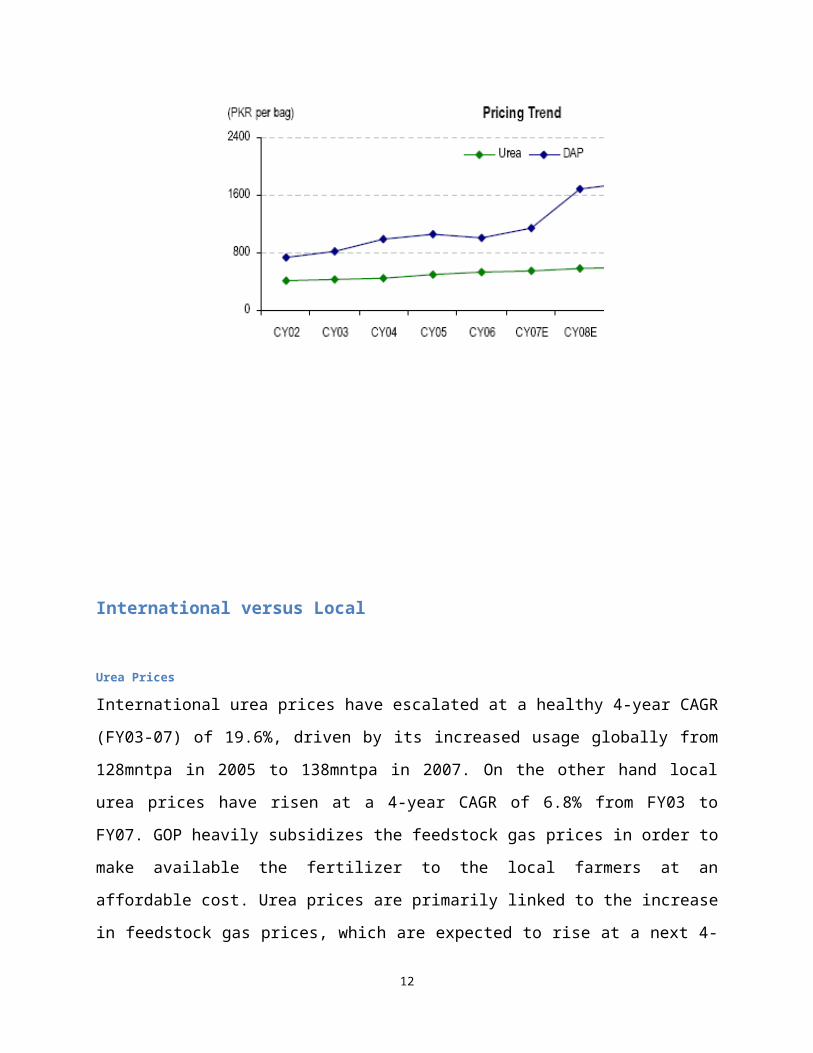
Pricing
Local Arena
Urea prices have shown a positive trend over the last few years on the back of step-wise increase
in feedstock gas prices, the primary raw-material for urea manufacturing. Government heavily
subsidizes feedstock prices in Pakistan, to keep the urea prices within affordable limits of the
farmers. A 50kg bag of urea is sold at PKR 558-565 (prices were revised upwards in Dec’07)
versus a price of approximately PKR 1000 per bag in the international market. DAP prices on the
other hand have undergone a radical increase during 2007, due to record high phosphoric acid
prices in the international market (a major raw material). Local prices of DAP are highly
correlated with their global rates since over 70% of the commodity used in the country is
imported. As a result, domestic DAP prices have surged during CY07, rising from PKR 800 per
bag at the start of the year to touch PKR 1,680 by Dec’07.
9
International versus Local
Urea Prices
International urea prices have escalated at a healthy 4-year CAGR (FY03-07) of 19.6%, driven
by its increased usage globally from 128mntpa in 2005 to 138mntpa in 2007. On the other hand
local urea prices have risen at a 4-year CAGR of 6.8% from FY03 to FY07. GOP heavily
subsidizes the feedstock gas prices in order to make available the fertilizer to the local farmers at
an affordable cost. Urea prices are primarily linked to the increase in feedstock gas prices, which
are expected to rise at a next 4-year CAGR of 11% going forward. Consequently we expect local
urea prices to increase at a 4-year CAGR of 5.5% for the period FY07-FY11.
10

DAP Prices
International DAP prices have risen sharply during 2007 (+143% YoY) on the back of rising
demand for the phosphatic fertilizer for harvesting of crops used in production of biofuels. In the
local market, price of DAP fertilizer too has followed suit and has gone up from PKR 873 per
50kg bag at the start of 2007 to around PKR 1,680 per bag at present. Despite the PKR 470 per
bag subsidy by the GOP, the hefty rise in DAP prices has caused its off-take to drop significantly
during the past few months with many farmers reverting to the use of urea. FFBL the only
producer of DAP and caters to only 31% of the DAP demand of Pakistan while the rest of the
demand is met through imports. Since the local prices are highly correlated to global prices we
estimate DAP prices to increase at a 4-year CAGR (CY07-11E) of 6.3%.
11
Demand & Supply
There are nine fertilizer plants in Pakistan with a total installed capacity of 4.35mn tons
including urea, Di-ammonium phosphate (DAP), single super phosphate (SSP), calcium
ammonium nitrate (CAN), nitro phosphate (NP) and ammonium sulfate (AS). Total demand of
these fertilizers is estimated to grow at an average of 4% per annum in the medium term. The
shortfall of approximately 1.1mntpa is met through import on which GOP provides subsidies.
During FY08, the GOP allocated a sum of PKR 13.5bn for import of various fertilizers.
The graph above shows the demand trend of both major fertilizers, urea and DAP, which has
increased at a 4-year CAGR (CY02-06) of 4.6% and 7.7% respectively. Given the increase in
crop prices, low per acre usage of fertilizers, increasing awareness among the farming
community and vast cultivable land, we estimate demand growth of fertilizers to average over
4% per annum over the next 4 years.
12

Taxes
The government has privatized and deregulated fertilizer imports and prices. In 1986, all
subsidies on nitrogenous fertilizers were abolished followed by phosphates in 1993 and potash in
1997. Provincial quotas were abolished, provincial supply organizations in the public sector
abandoned and import controls were lifted. All imports are affected by the private sector. In
2001, the government imposed a 15 percent general sales tax on all fertilizer products. Farmers
have to pay international prices for imported products, apart from urea.
The share of the private sector in fertilizer marketing is 89 percent, compared to 11 percent for
the public sector. The private sector handles about 90 percent of the urea and 100 percent of the
DAP, the two major fertilizer products consumed in the country. A dealer network of about 8
000 retailers exists in the country. Fertilizer companies select and train the dealers. There is no
government intervention. However, under ‘Fertilizer Acts’ promulgated by provinces, fertilizer
quality is monitored by the provincial governments.
13

The Dawood Group
The Dawood Group, a distinguished and trusted name in Pakistan, traces its origins back to almost a century ago. The Group
owns companies ranging from fertilizer, textiles, business and finance. Through its diverse businesses, the Dawood Group of
Companies delivers some of the top brands and the highest quality services. Most of the Group Companies consistently rank
amongst the top 25 companies of KSE. The Group comprises of the following companies
Dawood Hercules Chemicals
Dawood Lawrencepur
Central Insurance Company
Inbox Business Technologies
Elixir Securities
14

Dawood Hercules
Dawood Hercules Chemicals Limited was incorporated as a public limited company on 17th April 1968, as a joint venture
between Dawood Group of Industries and Hercules Inc. USA. It was the first private sector venture in Pakistan to receive a loan
from the World Bank and was the largest ammonia/urea plant in country at that time. Initially the plant's capacity was 345,000
metric tons of urea per annum. The plant was revamped in 1989 / 1991 to enhance the capacity to 445,500 metric tons of urea per
annum. Also, it made the manufacturing facilities more energy efficient and environment friendly.
In recent years, Dawood Hercules has made a colossal investment to incorporate the latest technology; the most significant are
the construction of new Prilling tower in a record time; the tallest industrial structure in Pakistan, replacement of Primary Waste
Heat Exchanger. Primary Reformer Harps Assemblies and conventional instrumentation (with Distributed Control System).
Dawood Hercules has the privilege of becoming the first fertilizer manufacturing company to obtain ISO-9000:2000 certification.
Vision & Mission
• To excel in the fertilizer and allied business at national and international level by maintaining highest standards of product
quality thereby playing our role in the development of the country's economy and adding value to the shareholders' investment.
• To offer consistent dividends to the shareholders.
• To chalk out a plan to improve production techniques and quality standards.
• To provide career grooming opportunities to the talented professionals.
• To become a good corporate citizen.
• To develop long-term relationship with the employees.
• To create high performing Organizational Environment in which ideas are generated and nurtured.
15

• To inculcate honest and ethical behavior.
• To create safe, healthy environment and friendly atmosphere for the employees.
• To improve quality of life for the employees.
• To make the farmer community prosper.
16
Product Line
1. Product: Urea Fertilizer
Brand Name: “Bubber Sher”.
Product Chemical Name: Urea, Carbamide; Amide of Carbonic Acid
2. Product: Anhydrous Ammonia.Anhydrous Ammonia is provided for the manufacture of soda ash, fructose and other chemicals.
Product Chemical Name: Ammonia, Anhydrous Ammonia
Production Facilities
Dawood Hercules Plant is sited at the heart of the Punjab; the area of unparallel agricultural significance, surrounded by the belts
of rice, grain and wheat. Located near the historic city of Sheikhupura, about 28 Km from Lahore; Dawood Hercules Plant is the
biggest industry in terms of capital investment in the Lahore division.
The complex was constructed and commissioned on 13th November 1971. It was the third and the largest urea plant in the
Country at that time. Since then the manufacturing facilities have been frequently upgraded as per the need and demand of time.
17

In recent years, Dawood Hercules has made significant and rigorous investment which amounts to over $41 million in year 2006
alone to poise itself for the future challenges.
Technical Data
Ratio Analysis (Internal & External Comparison)
Financial Ratios of Dawood Hercules (2001-08)
2001 2002 2003 2004 2005 2006 2007 2008
LIQUIDITY
Current Ratio 2.79 8.71 4.37 4.46 3.81 1.28 3.15 3.19
Quick Ratio 2.61 8.48 4.33 4.44 3.76 1.24 2.90 3.13
Cash Flow Liquidity Ratio 2.31 8.62 2.92 2.55 2.20 1.11 2.50 3.10
Average Collection Period 22.93 6.92 74.15 78.85 44.70 28.09 35.82 3.55
Average Inventory Days 22.93 24.67 19.67 13.23 29.56 33.70 100.57 7.58
Average Payable Days 77.28 105.52 142.04112.0
7 122.22 93.77 88.38 68.89
TURNOVER/EFFICIENCY
Receivable Turnover 21.44 52.71 4.92 4.63 8.17 13.00 10.19 102.82
Inventory Turnover 12.96 12.96 12.96 12.96 12.96 12.96 12.96 12.96
Payable Turnover 4.72 3.46 2.57 3.26 2.99 3.89 4.13 5.30
18
Description Unit Design Specification
Plant Area Acres 228
Urea Production Metric Tons Per Day 1,350
Ammonia Production Metric Tons Per Day 815
Bagging Capacity Metric Tons per day 1,800
Urea Storage Capacity Metric Tons 100,000
Urea Bulk Storage Capacity Metric ton 5000
Ammonia Storage Capacity Metric Tons 4,000
Electricity Generation Mega Watts 15
Cooling Water Circulation Gallons per minute 75000
Natural Gas Consumption Million Cubic Feet per day 44.23

Fixed Asset Turnover 7.74 9.45 7.29 5.09 4.77 2.88 3.65 5.32
Total Asset Turnover 0.65 0.55 0.33 0.22 0.26 0.24 0.17 0.29
SOLVENCY/LEVERAGE
Debt Ratio 19% 12% 30% 36% 27% 43% 35% 32%Long Term Debt To Capitalization Ratio 0% 0% 0% 0% 0% 0% 26% 27%
Debt To Equity Ratio 1.24 1.13 1.43 1.57 1.37 1.74 1.55 1.47
COVERAGE
Times Interest Earned 41.09 966.14 25.44 7.89 4.10 1.94 2.08 -3.02
Cash Coverage Ratio 52.84 1027.40 66.54 8.38 4.33 2.12 1.35 3.84
Fixed Charge Coverage Ratio 41.09 966.14 25.44 7.89 4.10 1.94 2.08 -3.02
Cash Flow Adequacy Ratio 0.91 0.92 0.75 0.49 0.56 0.18 -0.08 2.94
PROFTABILITY
Gross Profit Margin 26% 36% 36% 30% 38% 34% 37% 42%
Operating Margin 21% 32% 30% 24% 32% 28% 31% 37%
Net Profit Margin 21% 28% 46% 46% 87% 53% 202% 41%
Cash Flow Margin 15% 24% 20% 13% 18% 6% -1% 23%
Return On Asset 14% 16% 15% 10% 22% 13% 35% 12%
Return On Equity 17% 18% 22% 16% 31% 22% 54% 18%
Cash Return On Asset 9% 13% 6% 3% 5% 1% 0% 7%
MARKET
Earnings Per Share 12.38 11.01 19.13 17.21 39.8 24.79 122.3 28
Price to Earning 5.9 12.17 9.18 11.42 7.4 11.9 4.25 7.87
Dividend Payout 80.78 86.29 52.26 61.01 24.56 32.27 3.24 8.93
Dividend Yield 13.7 7.09 5.69 5.34 3.32 2.71 0.76 1.13
Average of Financial Ratios of Fertilizer Sector
2001 2002 2003 2004 2005 2006 2007 2008
LIQUIDITYCurrent Ratio 1.62 2.94 2.09 2.15 1.99 1.27 2.09 1.91
Quick Ratio 1.45 2.72 1.90 2.01 1.67 1.08 1.81 1.59
Cash Flow Liquidity Ratio 1.28 2.67 1.71 1.76 1.50 0.88 1.49 1.09
Average Collection Period 25.37 26.73 40.54 32.76 17.97 14.21 21.71 4.28
Average Inventory Days 38.97 35.89 23.77 17.45 32.73 31.83 53.75 48.08
Average Payable Days 64.65 58.34 84.20 89.51 95.18 67.83 83.75 72.04
TURNOVER/EFFICIENCY
Receivables Turnover 16.36 23.00 11.28 17.97 33.15 39.33 23.67 88.76
Inventory Turnover 10.18 11.84 16.20 29.72 15.68 13.37 14.44 23.16
Payable Turnover 7.36 7.02 9.12 10.73 7.56 9.69 12.51 14.33
Fixed Asset Turnover 4.25 3.18 2.84 2.41 2.63 2.17 2.05 2.48
Total Asset Turnover 0.63 0.53 0.58 0.63 0.76 0.74 0.54 0.55
19

SOLVENCY/LEVERAGE
Debt Ratio 27.28% 54.00% 53.17% 51.83% 49.85% 51.48% 55.49% 58.25%
Long Term Debt To Capitalization 12.88% 30.01% 25.18% 24.76% 20.86% 16.89% 33.47% 36.16%
Debt To Equity Ratio 92.07% 135.56% 109.79% 91.43% 92.33% 79.42% 121.75% 129.36%
COVERAGE
Times Interest Earned 20.16 5.93 11.53 15.58 11.56 7.77 6.22 4.92
Cash Coverage Ratio 23.31 8.30 27.25 13.43 13.23 4.96 8.29 7.50
Fixed Charge Coverage Ratio 23.88 486.61 14.67 14.10 11.52 0.57 5.24 4.36
Cash Flow Adequacy Ratio 0.76 1.12 0.76 1.52 1.05 0.25 0.25 1.22
PROFTABILITY
Gross Profit Margin 30.10% 33.64% 31.16% 30.43% 31.85% 30.53% 33.34% 34.90%
Operating Margin 17.53% 23.85% 21.69% 22.53% 23.84% 22.02% 25.54% 27.78%
Net Profit Margin 2.25% 21.39% 24.30% 23.39% 34.07% 24.87% 63.86% 22.90%
Cash Flow Margin 12.19% 15.65% 19.96% 21.88% 19.88% 6.86% 14.07% 3.42%
Return On Asset 9.49% 12.49% 12.81% 12.91% 17.65% 15.30% 19.17% 13.68%
Return On Equity 17.71% 24.30% 24.10% 24.62% 33.29% 28.44% 36.50% 29.20%
Cash Return On Asset 8.50% 8.36% 10.39% 8.88% 8.31% 8.98% 7.30% -2.89%
MARKET
Earnings Per Share 11.46 14.87 18.36 17.36 28.25 24.67 51.14 31.58
Price to Earning 4.12 7.00 9.24 10.60 8.46 8.69 7.58 4.86
Dividend Payout 82.48% 85.94% 65.29% 64.24% 64.04% 61.82% 44.99% 43.37%
Dividend Yield 12.75% 7.30% 7.10% 29.97% 5.01% 16.19% 1.68% 3.60%
Analysis
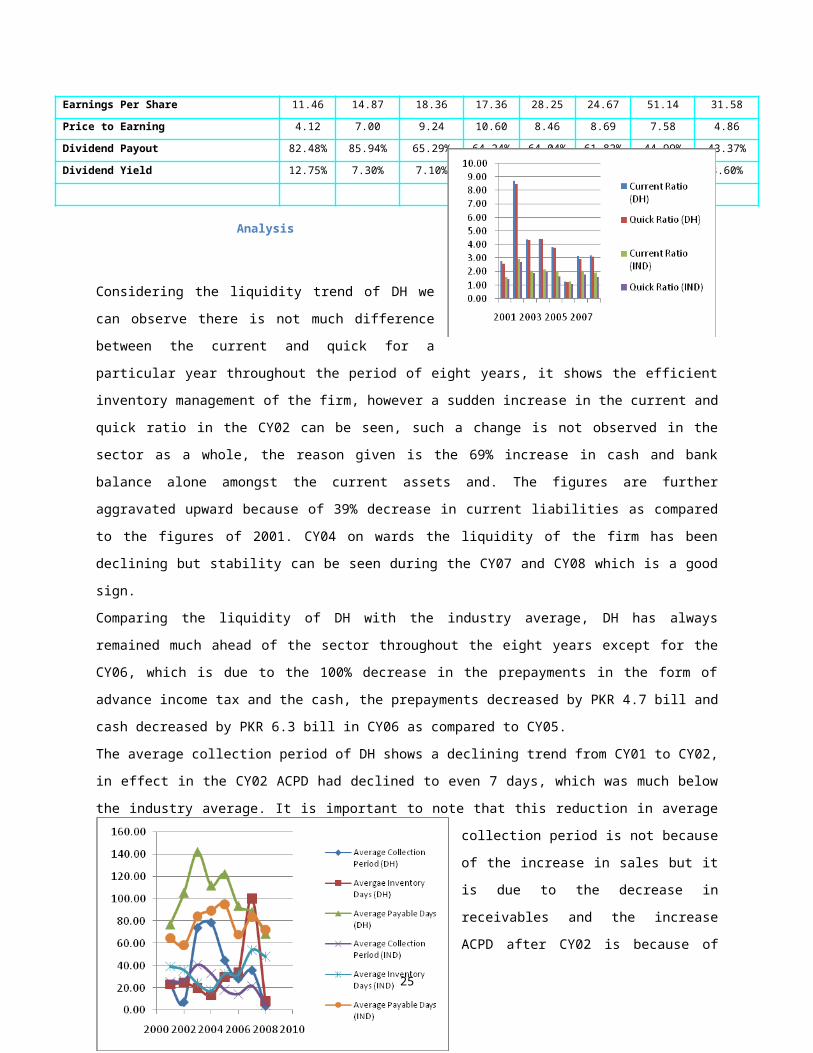
Considering the liquidity trend of DH we can observe there is not much difference between the current and quick for
a particular year throughout the period of eight years, it shows the efficient inventory management of the firm,
however a sudden increase in the current and quick ratio in the CY02 can be seen, such a change is not observed in
the sector as a whole, the reason given is the 69% increase in cash and bank balance alone amongst the current
assets and. The figures are further aggravated upward because of 39% decrease in current liabilities as compared to
the figures of 2001. CY04 on wards the liquidity of the firm has been declining but stability can be seen during the
CY07 and CY08 which is a good sign.
Comparing the liquidity of DH with the industry average, DH has always remained much ahead of the sector
throughout the eight years except for the CY06, which is due to the 100% decrease in the prepayments in the form
of advance income tax and the cash, the prepayments decreased by PKR 4.7 bill and cash decreased by PKR 6.3 bill
in CY06 as compared to CY05.
20

The average collection period of DH shows a declining trend from CY01 to CY02, in effect in the CY02 ACPD had
declined to even 7 days, which was much below the industry average. It is important to note that this reduction in
average collection period is not because of the increase in sales but it is due to the decrease in receivables and the
increase ACPD after CY02 is because of the
credit sales which has increased by 6% in CY03
compared to that of CY02. During the CY03
and CY04 the ACPD remained between 74 to
80 days, however due to efficient credit
recovery policy then followed by the
organization resulted in substantial decrease in
the collection period but still the figure
remained well above the industry average. In
the CY08 DH, following its efficient credit
recovery policy managed to decrease its
collection period to the industry level, that is 5 days. It is evident from the graph above that managing inventory had
never been a problem for DH as compared to the industry throughout CY01 to CY08 except for the CY07 when
AID of DH reached up to 100 days, it was majorly because of increase in stocks by more then twice, but the sales
and cost of goods has not increased by such proportion. Average payable days of DH has also been high as
compared to the industry average from CY01 to CY07 but during the CY08 payable in days became almost at par
with industry which is an alarming sign.
Fixed asset turnover has been of DH has been the highest
with in the industry, we can observe an abnormal increase
in FATO in CY02 this is basically due to a 19 % decrease
in FA of the firm , however since then the firm’s FA has
been increasing compared to each preceding year. In
CY06 the FATO remained the lowest of all the eight
years, it is because of the 95% increase in the FA of the
firm. For the CY 01 and CY02 the TATO of DH
remained at par with the industry average, however due to
good liquidity status of the firm it remained below the
industry average from CY05 to CY08.
The solvency ratio of DH indicates that firms capital
structure is not inclined towards debt as much as that of the
industry, the debt ratio of the industry has always been more
that the debt ratio of DH. However debt to equity ratio of
DH has been greater than the debt-equity ratio of the
industry, we can observe that in CY06 the debt ratio of DH
reached the highest it is because of the 1888% increase in
21

long term borrowing, also we should keep in mind that this is the year when company initiated a BMR project to enhance its
capacity so that it can meet the arising challenges, it is well reflected by the fact that the debt ratio declines afterwards. The debt
ratio of the industry appears to be rising from CY06 to CY08; it means that the need for expansion is taken by the industry after
the initiative of DH.
The return on asset of DH has been greater then the return on asset of the industry from CY01- CY03 but we seen decline in the
ROA of DH during the CY04, it is because of the sharp
increase in receivables and a slight decline in sales. The firm
quickly responded the situation and we see an opposite
situation altogether in the CY05 and CY07.
DH’s return on equity had never been fascinating as
compared to the industry average except for the CY07 which
is because of the 393% increase in net income during that
year. However the situation could not remain likewise during
the CY08 and the reason for that were 70% decrease in net
income and 900% dilution in share holder’s equity- that is
the firm issued further 9000 shares of common stock in
CY08.
Operating and Net Profit Margins has kept on fluctuating
throughout the analysis horizon. The potential reasons being the
economic cycle, input prices and the demand for the product. A
clear trend can be observed is of relatively stable operating margin
while ups and downs in the NPM. This could be the effect of
fluctuating finance costs while applicability of different tax
deductible policies adopted by the firm during the different years.
However the OM is following the upward trend for the past three
years. OM is generally being improved during the eight years as
was observed 21% in CY01. Although during CY04, 24% is aloof
from the trend. NPM is also following the improving trend during the years. When compared with industry average, DH is far
ahead from the trend on both the aspects. This shows better efficiency and productivity of the firm.
When seeing towards cash flow ratios, we see that cash coverage ratio was better at the start of the decade but declined severely
during the years but has adopted a stable trend during the recent years. While fixed charge ratios for the company is on the same
trend. In fact during CY08, it went negative, which is not good for the company. Cash flow adequacy ratio too has been declining
and even went negative during the years but was adequate in 2008. The analysis of cash flows show a problem on the cash flow
health of the firm and indicate that firm is not generating the required cash to finance its liabilities.
22

EPS has been somewhat stable during the analysis
horizon except in CY07. The relative fluctuation is due
to the different operating performances of the firm
during the different years. P/E ratios too have been
following the same trend b/c of fluctuating EPS and
stock market trends during the era. However EPS has
generally improved during the years and P/E too. This
shows the confidence of investors on the DH stock.
When compared with the industry average, DH is again
far ahead with the trend in EPS aspect. While P/E ratio
of the industry at first rises till CY04 and then declines
thereafter. Such a trend is not observed in DH ratios.
As far as payout ratio is concerned, DH is retaining its earnings
more than previous years, i.e., its payout ratio is on the declining
trend. The potential causes would be the retention for further
expansions, BMR requirements ahead, etc. While the industry is
paying its shareholders at a stable trend. In other words, industry is
better in paying off its shareholders.
23

Horizontal Indexed Income Statement (2001-08)
24
PROFIT AND LOSS ACCOUNT
2001 2002 2003 2004 2005 2006 2007 2008
Sales 100% 99% 105% 95% 115% 115% 176% 261%
Cost of Goods Sold 100% 85% 91% 89% 96% 96% 150% 205%
Gross Profit 100% 135% 142% 110% 169% 169% 250% 418%
Selling and Administrative Expenses 100% 88% 122% 117% 144% 144% 207% -277%
Operating Profit 100% 147% 147% 108% 175% 175% 260% 451%
Financial ChargesRealized gain on disposal of investment in associate
Other Income 100% 109% 315% 199% 627% 627% 140% 180%
Profit For The Year 100% 135% 197% 128% 290% 290% 1111% 263%Impairment on available for sale investments
Other Charges 100% 99% 92% 61% 86% 86% 114% -282%
Profit before Taxation 100% 138% 205% 210% 434% 434% 1352% 249%
Provision for Taxation 100% 148% 135% 98% 146% 146% 435% -367%
Profit after Taxation 100% 133% 232% 209% 482% 482% 1704% 515%
Earnings Per Share 100% 89% 155% 139% 321% 321% 988% 226%
Analysis
Over the years, it has been seen that till CY04 a constant trend is seen. Then the revenues are on the rising trend with more than
doubled in 2008 – the most successful year for the company. Compared with COGS, revenues are on the rising trend relative to
the cost of sales. That’s why GP increased at a higher trend than COGS.
Selling and admin expenses have increased but have not deteriorated the operating profits for the company. OP are too rising at a
higher trend. Then PBT was on the rising trend till 2007 then declined suddenly in 2008 but this seem adequate because a rising
trend cannot be continued forever. Due to the increase in earnings, the company has to pay higher taxes too. But the company has
opted such policies for taxation so that there would be less deteriorating effect on EAT. Lastly, EPS has kept on fluctuating as the
trend for EAT.
25

Horizontal Indexed Balance Sheet (2001-08)
26
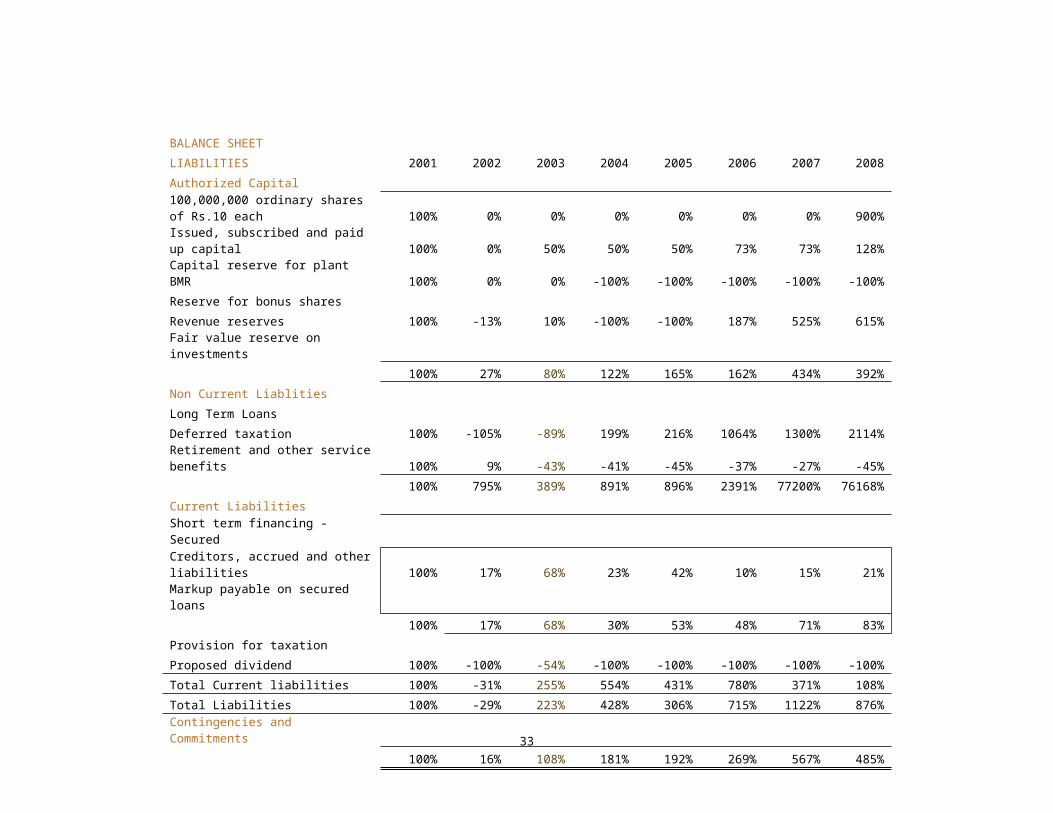
BALANCE SHEET
LIABILITIES 2001 2002 2003 2004 2005 2006 2007 2008
Authorized Capital100,000,000 ordinary shares of Rs.10 each 100% 0% 0% 0% 0% 0% 0% 900%
Issued, subscribed and paid up capital 100% 0% 50% 50% 50% 73% 73% 128%
Capital reserve for plant BMR 100% 0% 0% -100% -100% -100% -100% -100%
Reserve for bonus shares
Revenue reserves 100% -13% 10% -100% -100% 187% 525% 615%
Fair value reserve on investments
100% 27% 80% 122% 165% 162% 434% 392%
Non Current Liablities
Long Term Loans
Deferred taxation 100% -105% -89% 199% 216% 1064% 1300% 2114%
Retirement and other service benefits 100% 9% -43% -41% -45% -37% -27% -45%
100% 795% 389% 891% 896% 2391% 77200% 76168%
Current Liabilities
Short term financing - Secured
Creditors, accrued and other liabilities 100% 17% 68% 23% 42% 10% 15% 21%
Markup payable on secured loans
100% 17% 68% 30% 53% 48% 71% 83%
Provision for taxation
Proposed dividend 100% -100% -54% -100% -100% -100% -100% -100%
Total Current liabilities 100% -31% 255% 554% 431% 780% 371% 108%
Total Liabilities 100% -29% 223% 428% 306% 715% 1122% 876%
Contingencies and Commitments
100% 16% 108% 181% 192% 269% 567% 485%

27
ASSETS 2001 2002 2003 2004 2005 2006 2007 2008
Fixed Assets
At cost less accumulated depreciation 100% -19% -32% 39% 25% 245% 223% 261%
Capital work in progress
100% -19% 11% 44% 87% 266% 273% 279%
Long Term Investments 100% -87% -85% -89% -70% -67% -12% 2%
Long Term Loans and Advances 100% 20% 44% 1656% -3% 1825% 67% -100%
Deferred taxation
Deferred Costs 100% 18% 73% -100% -100% -100% -100% -100%
Current Assets
Stores, spares and loose tools 100% 7% 31% 13% 30% 52% 79% 106%
Stocks 100% -8% -22% -48% 24% 79% 556% -32%
Trade debtors 100% -7% -27% 23% -49% -67% -37% 17%Loans, advances, prepayments and other rec. 100% -60% 127% 339% 203% 125% 270% -46%
Advance income tax
Short term investments
Cash and bank balances 100% 69% 338% 628% 375% -96% -18% -30%
Total Current Assets 100% 115% 457% 824% 503% 303% 432% 138%
Total Assets 100% 16% 108% 181% 192% 269% 567% 485%

Analysis
SHE has following a rising trend but the prime factor behind that is revenue reserve. Issued and paid-up capital at first has risen
but then declined because of the purchase of treasury stock. BMR reserve has been finished after the restructuring of the plant in
2005.
The company has financed primarily on long term debt during the recent years due to the tax advantage and unstable stock
market conditions. Deferred taxation has been excessive during the current years which too added on the non-current liabilities
section of the balance sheet. Current liabilities have been very stable during the years.
When looking at the left side of the balance sheet, the firm has kept on increasing its fixed assets. The company has ended its
long term investments, long term loans and advances and deferred costs while focusing more on current assets to avoid
redundancy. Receivables and inventory has been properly managed while cash balances were also declining for the firm , which
is alarming as discussed previously.
28

29

Vertical Common Sized Income Statement (2001-08)
30
PROFIT AND LOSS ACCOUNT 2001 2002 2003 2004 2005 2006 2007 2008
Sales 100.00% 100.00% 100.00% 100.00% 100.00% 100.00% 100.00% 100.00%
Cost of Goods Sold 73.85% 64.06% 64.47% 69.70% 61.71% 66.21% 62.83% 58.05%
Gross Profit 26.15% 35.94% 35.53% 30.30% 38.29% 33.79% 37.17% 41.95%
Selling and Administrative Expenses 4.93% 4.38% 5.76% 6.11% 6.15% 6.08% 5.80% 234.02%
Operating Profit 21.22% 31.56% 29.78% 24.18% 32.14% 27.70% 31.36% 36.70%
Financial Charges 0.03% 1.17% 3.07% 7.84% 14.31% 15.08% 12.13%Realized gain on disposal of investment in associate 172.79%
Other Income 9.93% 34.94% 100.46% 86.35% 167.93% 97.39% 25.15% 18.69%
Profit For The Year 31.15% 42.56% 58.52% 42.00% 78.26% 40.37% 196.96% 31.43%
Impairment on available for sale investments 1.35%
Other Charges 23.07% 20.84% 6.73% 7.08% 3.18% 6.73% 18.82% -36.09%
Profit before Taxation 28.86% 40.26% 56.51% 63.95% 108.43% 66.71% 222.03% 27.60%
Provision for Taxation 8.00% 12.03% 10.29% 8.28% 10.11% 13.79% 19.79% -11.28%
Profit after Taxation 20.86% 28.23% 46.22% 45.95% 87.16% 52.92% 202.24% 41.23%
Earnings Per Share

Vertical Common Sized Balance Sheet (2001-08)
BALANCE SHEET
LIABILITIES 2001 2002 2003 2004 2005 2006 2007 2008
Authorized Capital
100,000,000 ordinary shares of Rs.10 each 22.83% 19.65% 10.99% 8.13% 7.82% 6.19% 3.42% 39.02%
Issued, subscribed and paid up capital 10.97% 9.44% 7.92% 5.86% 5.64% 5.13% 2.84% 4.27%
Capital reserve for plant BMR 4.57% 3.93% 2.20%
Reserve for bonus shares 4.72% 37.54% 52.62%
Revenue reserves 65.17% 48.75% 34.50% 50.76% 61.05% 79.65%
Fair value reserve on investments 21.40% 25.35% 20.30% 14.91% 1.49% 0.75% -16.10%
80.70% 88.24% 69.97% 63.69% 73.16% 57.37% 64.64% 67.82%
Non Current Liabilities
Long Term Loans 22.24% 24.59%
Deferred taxation 0.34% -0.01% 0.02% 0.36% 0.37% 1.07% 0.71% 1.28%
Retirement and other service benefits 1.66% 1.55% 0.45% 0.35% 0.32% 0.28% 0.18% 0.16%
0.20% 1.54% 0.47% 0.70% 0.68% 1.35% 23.13% 26.03%
Short term financing - Secured 19.75% 29.44% 18.26% 36.66% 7.81% 0.27%
Creditors, accrued and other liabilities 10.18% 10.23% 8.23% 4.47% 4.94% 3.03% 1.76% 2.10%
Markup payable on secured loans 0.23% 0.38% 1.05% 0.85% 1.08%
10.18% 10.23% 8.23% 4.70% 5.32% 4.09% 2.61% 3.18%
Provision for taxation 0.00% 0.00% 0.00% 1.47% 2.58% 0.54% 1.81% 2.70%
Proposed dividend 7.13% 0.00% 1.58%
Total Current liabilities 17.30% 10.23% 29.56% 40.30% 31.47% 41.28% 12.23% 6.15%
Total Liabilities 19.30% 11.76% 30.03% 36.31% 26.84% 42.63% 35.36% 32.18%
Liabilities & SHE 100.00% 100.00% 100.00% 100.00% 100.00% 100.00% 100.00% 100.00%
31
ASSETS2001 2002 2003 2004 2005 2006 2007 2008
Fixed Assets 8.41% 5.83% 2.74% 4.17% 3.61% 7.87% 4.07% 5.18%
At cost less accumulated depreciation 0.00% 0.01% 1.76% 0.14% 1.78% 0.47% 0.63% 0.26%
Capital work in progress 8.41% 5.84% 4.50% 4.31% 5.40% 8.34% 4.70% 5.45%
430.78% 48.87% 30.31% 16.27% 44.83% 38.93% 56.84% 74.93%
Long Term Investments 0.02% 0.02% 0.01% 0.09% 0.01% 0.08%
Long Term Loans and Advances 0.01%
deferred taxation 0.71% 0.72% 0.59%
Deferred CostsCurrent Assets 11.38% 10.50% 7.15% 4.59% 5.06% 4.70% 3.06% 4.00%
Stores, spares and loose tools 3.02% 2.39% 1.14% 0.55% 1.29% 1.47% 2.97% 0.35%
Stocks 0.17% 0.14% 0.06% 0.08% 0.03% 0.02% 0.02% 0.03%
Trade debtors 3.04% 1.05% 3.31% 4.74% 3.15% 1.85% 1.68% 0.28%Loans, advances, prepayments and other rec. 37.69% 60.64% 37.12% 2.59%
Advance income tax 30.47% 15.23% 8.72% 3.12% 44.27% 26.97% 8.71%
Short term investments 30.59% 44.55% 64.58% 79.32% 49.77% 0.35% 3.76% 3.64%
Cash and bank balances 48.20% 89.09% 129.16% 158.65% 99.53% 52.65% 38.45% 19.61%
Total Current Assets 100.00% 100.00% 100.00% 100.00% 100.00% 100.00% 100.00% 100.00%
Total Assets
32
Analysis
Vertical analysis of income statement shows the clear picture of the firm. COGS have been declining and responsible for the
improvement of GP. It shows the operating efficiency for the firm. S & A expenses have risen slightly over the years. PBT has
been fluctuating due to the extraordinary items on the income statement. However, finance costs have increased substantially.
Taxation has been different during the different years and hence no conclusion can be deduced from the trend because of the
different policies opted by the firm to avoid as much as possible from this expense.
Vertical analysis of balance sheet depicts a declining trend of SHE on the balance sheet. Non-current liabilities have been
increased due to financing of the company’s operations by that door. Current liabilities show a declining trend as clear in the
decline in current assets section of the balance sheet.
Fixed assets have increased during the years while current assets have decreased on the other side. The company has restructures
itself during CY05.
33
Horizontal YoY Rs. and % Analysis (2001-08)
Horizontal YoY Income Statement Rs. Change (2001-08)
PROFIT AND LOSS ACCOUNT
2001 2002 2003 2004 2005 2006 2007 2008
Sales 2,850,669,632 -40,748,393 173,453,569 -284,239,502 591,412,036 591,202,353 1,129,252,554 4,578,033,247
Cost of Goods Sold 2,105,273,076-
305,292,725 123,316,720 -41,907,325 149,213,644 539,642,777 578,304,546 2,207,189,883
Gross Profit 745,396,556 264,544,332 50,136,849 -242,332,177 442,198,392 51,559,576 550,948,008 2,370,843,364
Selling and Administrative Expenses 140,519,364 -17,521,336 48,731,525 -6,729,884 37,523,200 33,606,214 54,750,792 -530,366,153
Operating Profit 604,877,192 282,065,668 1,405,324 -235,602,293 404,675,192 17,953,362 496,197,216 2,121,515,939
Financial Charges 0 918,028 34,002,787 47,855,235 175,283,166 297,410,063 200,371,381 -901,450,815Realized gain on disposal of investment in associate 0 0 0 0 0 0 8,658,697,711 0
Other Income 283,132,290 26,721,768 582,575,547 -328,791,383 1,212,139,142 -728,516,958 -652,019,488 226,459,135
Profit For The Year 888,009,482 307,869,408 549,978,084 -612,248,911 1,441,531,168-
1,007,973,659 8,302,504,058 1,446,524,259
Impairment on available for sale investments 0 0 0 0 0 0 0 -100,310,990
Other Charges 65,329,982 -749,915 -4,523,573 -20,168,074 16,612,623 14,007,215 3,862,533 -249,264,429
Profit before Taxation 822,679,500 308,619,323 554,501,657 40,191,600 1,841,972,306 -978,380,534 8,536,482,082 1,227,608,804
Provision for Taxation 228,000,000 110,000,000 -31,000,000 -83,400,000 109,000,000 202,777,058 456,242,352-
1,065,800,000
Profit after Taxation 594,679,500 198,619,323 585,501,657 -138,665,555 1,627,810,030 -813,738,161 8,080,239,730 2,468,008,757
Earnings Per Share 12.38 -1.37 8.12 -1.92 22.59 -15.01 97.51 15.62
34

Horizontal YoY Balance Sheet Rs. Change (2001-08)
LIABILITIES 2001 2002 2003 2004 2005 2006 2007 2008
Authorized Capital100,000,000 ordinary shares of Rs.10 each 1,000,000,000 0 0 0 0 0 0 9,000,000,000
Issued, subscribed and paid up capital 480,384,000 0 240,192,000 0 0 108,086,400 0 613,450,360
Capital reserve for plant BMR 200000000 0 0 -200000000
Reserve for bonus shares 0 240192000 2111340155 0
Revenue reserves 2,854,329,257 -373,774,873 658,224,480 9,637,249,084 17,561,067,070
Fair value reserve on investments 0 1088826650 1217308742 190285118 -590182096 -1666126730 -21060857 -4126573941
3,534,713,257 955,243,777 1,875,533,222 1,468,591,339 1,521,158,059 -82,095,776 9,616,188,227 13,847,943,489
Non Current Liabilities
Long Term Loans 0 6302500000
Deferred taxation 14,800,000 -15,500,000 2,300,000 42,600,000 2,600,000 125,400,000 35,000,000 312,900,000
Retirement and other service benefits 72,655,897 6,285,603 -37,763,561 1,330,852 -2,209,712 5,394,003 7,660,725 -32,493,378
8,745,897 69,495,603 -35,463,561 43,930,852 390,288 130,794,003 6,542,660,725 6,661,616,622
Short term financing - Secured 0 1823401690 -1285684959 3589614296 -3643086456 70139213
Creditors, accrued and other liabilities 445,713,608 74,666,010 228,059,028 -198,583,338 81,835,934 -141,245,230 22,507,287 92,419,087
Markup payable on secured loans 0 0 0 27790383 20448897 121654229 79542572 275848576
445,713,608 74,666,010 228,059,028 -170,792,955 102,284,831 -19,591,001 102,049,859 368,267,663
Provision for taxation 0 0 0 181000000 149000000 -243200000 442200000 693000000
Proposed dividend 312,249,600 -312,249,600 144,115,200 -144,115,200 0 0 0 -312,249,600
Total Current liabilities 757,963,208 -237,583,590 2,169,357,766 2,267,139,226 -932,115,297 2,646,892,773 -3,098,836,597 819,157,276
Total Liabilities 845,419,105 -246,797,987 2,133,894,205 1,733,424,387 -1,034,009,840 3,457,617,298 3,443,824,128 7,402,063,898
4,380,132,362 708,445,790 4,009,427,427 3,202,015,726 487,148,219 3,375,521,522 13,060,012,355 21,250,007,387
35

ASSETS 2001 2002 2003 2004 2005 2006 2007 2008
Fixed Assets
At cost less accumulated depreciation 368381929 -71730472 -47302198 263435473 -50684878 809831955 -83267437 960398046
Capital work in progress 0 555008 159578666 -142470984 210536977 -152757223 109921817 67553966
368381929 -71175464 112276468 120964489 159852099 657074732 26654380 1027952012
Long Term Investments 18868700000 -16381690246 270990841 -757043985 3731646089 559784166 10317868658 336928008
Long Term Loans and Advances 665085 133290 156510 10724325 -11035400 12155805 -11686490 -665085
defered taxation 0 700000 -700000 0 0 0 0 1259750
Deferred Costs 31219029 5615225 17241579 -54075833 0 0 0 -31219029
Current Assets
Stores, spares and loose tools 498401954 35998676 116055005 -85547054 81601318 113442473 133301695 527362682
Stocks 132262395 -10625860 -17996780 -35460266 96252959 72862986 630215154 -42694179
Trade debtors 7569876 -521145 -1559654 3848459 -5487192 -1347495 2239634 1251391Loans, advances, prepayments and other rec. 132958546 -79647695 248066085 281689992 -180083261 -104276749 193044473 -60707125
Advance income tax 0 4030156849 -2711962850 -4746928000 0 663149343
Short term investments 0 1550332557 -164536628 -313241250 -673635543 6756459039 726845301 2233424979
Cash and bank balances 1339973548 926755756 3608762029 3881446730 -3393314569 -6307328929 1041529550 -406035360
Total Current Assets 2111166319 2422292289 7217524058 7762893460 -6786629138 -4217116675 2727175807 2915751731
Total Assets 4,380,132,362 708,445,790 4,009,427,427 3,202,015,726 487,148,219 3,375,521,522 13,060,012,355 21,250,007,387
36

Horizontal YoY Income Statement % Change (2001-08)
37
PROFIT AND LOSS ACCOUNT2001 2002 2003 2004 2005 2006 2007 2008
Sales 100% -1% 6% -10% 22% 18% 29% 48%
Cost of Goods Sold 100% -15% 7% -2% 8% 27% 22% 37%
Gross Profit 100% 35% 5% -23% 54% 4% 42% 67%
Selling and Administrative Expenses 100% -12% 40% -4% 23% 17% 23% 234%
Operating Profit 100% 47% 0% -27% 62% 2% 46% 73%
Financial Charges 3704% 137% 212% 115% 36% 219%Realized gain on disposal of investment in associate -100%
Other Income 100% 9% 188% -37% 215% -41% -62% 29%
Profit For The Year 100% 35% 46% -35% 127% -39% 530% -76%
Impairment on available for sale investments
Other Charges 100% -1% -7% -34% 42% 25% 5% 347%
Profit before Taxation 100% 38% 49% 2% 107% -27% 330% -82%
Provision for Taxation 100% 48% -9% -27% 49% 61% 85% -184%
Profit after Taxation 100% 33% 74% -10% 131% -28% 393% -70%
Earnings Per Share 100% -11% 74% -10% 131% -38% 393% -77%

Horizontal YoY Balance Sheet % Change (2001-08)
LIABILITIES 2001 2002 2003 2004 2005 2006 2007 2008Authorized Capital
100,000,000 ordinary shares of Rs.10 each 100% 0% 0% 0% 0% 0% 0% 900%
Issued, subscribed and paid up capital 100% 0% 50% 0% 0% 15% 0% 32%
Capital reserve for plant BMR 100% 0% 0%Reserve for bonus shares 46%
Revenue reserves 100% -13% 27% 117% 14%
Fair value reserve on investments 112% 8% -24% -87% -9% -1984%
100% 27% 42% 23% 19% -1% 104% -8%
Non Current Liabilities
Long Term Loans -3%Deferred taxation 100% -105% -329% 2663% 6% 268% 20% 58%
Retirement and other service benefits 100% 9% -48% 3% -5% 13% 17% -25%
100% 795% -45% 103% 0% 150% 3003% -1%
Short term financing - Secured 101% -36% 154% -61% -97%
Creditors, accrued and other liabilities 100% 17% 44% -27% 15% -22% 5% 5%
Markup payable on secured loans 74% 252% 47% 11%
100% 17% 44% -23% 18% -3% 15% 7%Provision for taxation 82% -74% 509% 31%
Proposed dividend 100% -100% -100% Total Current liabilities 100% -31% 417% 84% -19% 66% -46% -56%Total Liabilities 100% -29% 356% 63% -23% 101% 50% -20%
Liability & SHE 100% 16% 79% 35% 4% 26% 81% -12%
ASSETS 2001 2002 2003 2004 2005 2006 2007 2008
38

Fixed Assets
At cost less accumulated depreciation 100% -19% -16% 106% -10% 175% -7% 12%
Capital work in progress 28752% -89% 1192% -67% 146% -64%
100% -19% 38% 30% 30% 95% 2% 2%
Long Term Investments 100% -87% 11% -27% 186% 10% 164% 16%
Long Term Loans and Advances 100% 20% 20% 1123% -94% 1888% -91% -100%
deferred taxation -100%
Deferred Costs 100% 18% 47% -100%Current Assets
Stores, spares and loose tools 100% 7% 22% -13% 14% 18% 18% 15%
Stocks 100% -8% -15% -34% 141% 44% 266% -90%
Trade debtors 100% -7% -22% 70% -59% -35% 89% 86%
Loans, advances, prepayments and other rec. 100% -60% 465% 93% -31% -26% 65% -85%
Advance income tax 118% -36% -100%
Short term investments -11% -23% -63% 1694% 10% -72%
Cash and bank balances 100% 69% 159% 66% -35% -99% 1850% -15%
Total Current Assets 100% 115% 159% 66% -35% -33% 32% -55%
Total Assets 100% 16% 79% 35% 4% 26% 81% -12%
39

DuPont Return on Equity
Five Component Disaggregation
Profitability Turnover Solvency ROE
Taxes Financing Operations
N.I/EBT EBT/EBIT EBIT/Sales N.I/Sales Sales/Avg. T.A N.I/Avg. T.A Avg. T.A/Avg. S.E N.I/Avg. S.E
2001 0.722856835 1.360076906 21.22% 20.86% 0.6508181 13.58% 1.239176149 16.82%
2002 0.701228364 1.275503614 31.56% 28.23% 0.5522016 15.59% 1.133324465 17.67%
2003 0.817890668 1.897679885 29.78% 46.22% 0.3279153 15.15% 2.026301256 21.66%
2004 0.718505571 2.644202137 24.18% 45.95% 0.2194415 10.08% 1.570065509 15.83%
2005 0.803804255 3.374213398 32.14% 87.16% 0.257332 22.43% 1.366845746 30.66%
2006 0.793257493 2.408076428 27.70% 52.92% 0.2401673 12.71% 1.742957001 22.15%
2007 0.910874211 7.079579131 31.36% 202.24% 0.1714763 34.68% 1.547047997 53.65%
2008 0.59137454 0.752014917 36.70% 41.23% 0.2898425 11.95% 1.474466195 17.62%
40

Analysis
DuPont analysis of the company reveals that the effective tax rate for the company has been declining from around 30% to
merely 9% in 2007. However disregarding any special case the effective rate for the company is 20% in the current scenario.
Relative financing costs for the firm are on the declining trend although the firm has borrowed more in the recent years. This
shows that the company is successful on its operational aspect. OPM for the company also increased during the years from 21%
to 36%. Although NPM has been very fluctuating because of different tax reduction tactics.
A turnover ratio of the firm shows a deteriorating trend during the horizon. May be the company is building up capacity on rising
demands in the future but at this stage the results are not very impressive. NPM has been somewhat more stable, remaining on an
average in 10s.
The company has become more leveraged during the years due to the tax advantage of the debt and higher cost of raising capital
by equity in the current situation.
ROE has also been somewhat stable during the years except from CY05 to CY07 when the economic growth of the country was
impressive but wiped out after current economic and political turmoil.
41

Conclusion and Recommendations
After a thorough analysis of the financial statements of the said organization for last eight years it can be concluded the
organization has been performing quite well as far as the operating activity is concerned, firm’s financial managers and decision
makers also appear to be very efficient and well aware of the market environment. A phenomenal growth can be observed in the
firm’s ROE which further strengthens the investors’ faith in the organizations; however the area that seems to be lagging in the
organization after CY05 is the availability of fluent cash flows.
In order to make the cash flow of the firm better the managers must focus on the improvement of the cash cycle, they must
workout with their credit and procurement policies in order to compete with the industry. The managers of the firm should strive
to increase the figure of average payable days above the industry average and on the other hand they should also bring down the
average collection period.
Dawood Hercules is recently serving the fertilizer needs only in the provinces of NWFP and Punjab leaving behind the potential
market of Sind. A dealership of 3000 in numbers is on of the strength of the distribution channel of the organization; however it
should also try to establish an equivalent network in the southern region of the country so increase the market share. Also DH
should take advantage of the port city of Karachi for exporting its products across the globe; it can be made possible by setting up
a fertilizer plant in Sind. Plant in the Sheikhupura, near Lahore should be expanded in order to capture the market of Afghanistan
and Central Asian countries.
Future Outlook & Insight for Investors
Looking at the Stock holders’ equity side of the balance sheet where it is evident that the firm has issued further 9000 shares of
common stocks in CY08, also the decline in dividend payout ratio is indication towards the expansion and growth. In the view of
above mention scenario DH is an attractive organization for long term investments. Those who are willing to invest in the said
organization may receive valuable returns two to three years from now, furthermore by investing in fertilizer sector and specially
in DH, capital gain can also prove to be a valuable decision of investors in the years to come.
\
42

References
1. http://www.dawoodhercules.com.pk
2. http://www.ffc.com.pk/contents/annualrep.htm
3. http://www.google.com.pk
4. http://en.wikipedia.org/wiki/EPS
5. http://www.kse.com.pk
6. http://www.sbp.org.pk/
7. http://www.brecorder.com/
43

Appendix
PROFIT AND LOSS ACCOUNT (PKR)
2001 2002 2003 2004 2005 2006 2007 2,008.00
Sales 2,850,669,632 2,809,921,239 2,983,374,808 2,699,135,306 3,290,547,342 3,881,749,695 5,011,002,249 7,428,702,879.00
Cost of Goods Sold 2,105,273,076 1,799,980,351 1,923,297,071 1,881,389,746 2,030,603,390 2,570,246,167 3,148,550,713 4,312,462,959.00
Gross Profit 745,396,556 1,009,940,888 1,060,077,737 817,745,560 1,259,943,952 1,311,503,528 1,862,451,536 3,116,239,920.00
Selling and Administrative Expenses 140,519,364 122,998,028 171,729,553 164,999,669 202,522,869 236,129,083 290,879,875 389,846,789.00
Operating Profit 604,877,192 886,942,860 888,348,184 652,745,891 1,057,421,083 1,075,374,445 1,571,571,661 2,726,393,131.00
Financial Charges 918,028 34,920,815 82,776,050 258,059,216 555,469,279 755,840,660 901,450,815.00
Realized gain on disposal of investment in associate 0 0 0 0 0 0 8,658,697,711
-
Other Income 283,132,290 309,854,058 892,429,605 563,638,222 1,775,777,364 1,047,260,406 395,240,918 509,591,425.00
Profit For The Year 888,009,482 1,195,878,890 1,745,856,974 1,133,608,063 2,575,139,231 1,567,165,572 9,869,669,630 2,334,533,741.00
Impairment on available for sale investments 100,310,990.00
Other Charges 65,329,982 64,580,067 60,056,494 39,888,420 56,501,043 70,508,258 74,370,791 183,934,447.00
Profit before Taxation 822,679,500 1,131,298,823 1,685,800,480 1,725,992,080 3,567,964,386 2,589,583,852 11,126,065,934 2,050,288,304.00
Provision for Taxation 228,000,000 338,000,000 307,000,000 223,600,000 332,600,000 535,377,058 991,619,410 837,800,000.00
Profit after Taxation 594,679,500 793,298,823 1,378,800,480 1,240,134,925 2,867,944,955 2,054,206,794 10,134,446,524 3,062,688,257.00
Earnings Per Share 12.38 11.01 19.13 17.21 39.80 24.79 122.3 28.00
44

BALANCE SHEET (PKR)2001 2002 2003 2004 2005 2006 2007 2008
LIABILITIES
Authorized Capital
100,000,000 ordinary shares of Rs.10 each 1,000,000,000 1,000,000,000 1,000,000,000 1,000,000,000 1,000,000,000 1,000,000,000 1,000,000,000 10,000,000,000.00
Issued, subscribed and paid up capital 480,384,000 480,384,000 720,576,000 720,576,000 720,576,000 828,662,400 828,662,400 1,093,834,360.00
Capital reserve for plant BMR 200000000 200000000 200000000
Reserve for bonus shares 240,192,000 4,617,085,085 6,728,425,240
Revenue reserves 2,854,329,257 2,480,554,384 3,138,778,864 8,204,369,794 17,841,618,878 20,415,396,327.00
Fair value reserve on investments 1,088,826,650 2,306,135,392 2,496,420,510 1,906,238,414 240,111,684 219,050,827 (4,126,573,941.00)
3,534,713,257 4,489,957,034 6,365,490,256 7,834,081,595 9,355,239,654 9,273,143,878 18,889,332,105 17,382,656,746.00
Non Current Liabilities
Long Term Loans 6,500,000,000 6,302,500,000.00
Deferred taxation 14,800,000 (700,000) 1,600,000 44,200,000 46,800,000 172,200,000 207,200,000 327,700,000.00
Retirement and other service benefits 72,655,897 78,941,500 41,177,939 42,508,791 40,299,079 45,693,082 53,353,807 40,162,519.00
8,745,897 78,241,500 42,777,939 86,708,791 87,099,079 217,893,082 6,760,553,807 6,670,362,519.00
Short term financing - Secured 1,797,183,538 3,620,585,228 2,334,900,269 5,924,514,565 2,281,428,109 70,139,213.00
Creditors, accrued and other liabilities 445,713,608 520,379,618 748,438,646 549,855,308 631,691,242 490,446,012 512,953,299 538,132,695.00
Markup payable on secured loans 27,790,383 48,239,280 169,893,509 249,436,081 275,848,576.00
445,713,608 520,379,618 748,438,646 577,645,691 679,930,522 660,339,521 762,389,380 813,981,271.00
Provision for taxation 181,000,000 330,000,000 86,800,000 529,000,000 693,000,000.00
Proposed dividend 312,249,600 144,115,200
Total Current liabilities 757,963,208 520379618 2,689,737,384 4956876610 4024761313 6,671,654,086 3,572,817,489 1,577,120,484.00
Total Liabilities 845,419,105 598621118 2,732,515,323 4465939710 3431929870 6,889,547,168 10,333,371,296 8,247,483,003.00
4,380,132,362 5,088,578,152 9,098,005,579 12,300,021,305 12,787,169,524 16,162,691,046 29,222,703,401 25,630,139,749.00
45

ASSETS 2001 2002 2003 2004 2005 2006 2007 2008
Fixed Assets
At cost less accumulated depreciation 368381929 296,651,457 249,349,259 512,784,732 462,099,854 1,271,931,809 1,188,664,372 1,328,779,975.00
Capital work in progress 555,008 160,133,674 17,662,690 228,199,667 75,442,444 185,364,261 67,553,966.00
368381929 297,206,465 409,482,933 530,447,422 690,299,521 1,347,374,253 1,374,028,633 1,396,333,941.00
Long Term Investments 18868700000 2,487,009,754 2,758,000,595 2,000,956,610 5,732,602,699 6,292,386,865 16,610,255,523 19,205,628,008.00
Long Term Loans and Advances 665085 798,375 954,885 11,679,210 643,810 12,799,615 1,113,125
deferred taxation 700,000 1,259,750.00
Deferred Costs 31219029 36,834,254 54,075,833
Current Assets
Stores, spares and loose tools 498401954 534,400,630 650,455,635 564,908,581 646,509,899 759,952,372 893,254,067 1,025,764,636.00
Stocks 132262395 121,636,535 103,639,755 68,179,489 164,432,448 237,295,434 867,510,588 89,568,216.00
Trade debtors 7569876 7,048,731 5,489,077 9,337,536 3,850,344 2,502,849 4,742,483 8,821,267.00
Loans, advances, prepayments and other rec. 132958546 53,310,851 301,376,936 583,066,928 402,983,667 298,706,918 491,751,391 72,251,421.00
Advance income tax 3,428,734,001 7,458,890,850 4,746,928,000 663,149,343.00
Short term investments 1,550,332,557 1,385,795,929 1,072,554,679 398,919,136 7,155,378,175 7,882,223,476 2,233,424,979.00
Cash and bank balances 1339973548 2,266,729,304 5,875,491,333 9,756,938,063 6,363,623,494 56,294,565 1,097,824,115 933,938,188.00
Total Current Assets 2111166319 4533458608 11750982666 19513876126 12727246988 8510130313 11237306120 5,026,918,050.00
Total Assets 4,380,132,362 5,088,578,152 9,098,005,579 12,300,021,305 12,787,169,524 16,162,691,046 29,222,703,401 25,630,139,749.00
46