david vs. goliath - ifamadavid vs. goliath the revolution in africa's farm structure t.s....
TRANSCRIPT
DAVID VS. GOLIATH THE REVOLUTION IN AFRICA'S FARM STRUCTURE
T.S. Jayne, Lulama Traub, and F.H. Meyer
Milu Muyanga, T.S. Jayne, and J. Chamberlain
W. Anseeuw and Antoine Ducastel
Photo: Christiaensen and Demery (2007)
Presentation at IFAMA Agribusiness and Food World Forum Cape Town, South Africa,
June 17th, 2014
Stylized fact:
A stylized fact is often a broad generalization that
summarizes some complicated statistical
relationship, which although essentially true, may
have inaccuracies in the detail.
http://en.wikipedia.org/wiki/Stylized_fact

Outline: Drivers of Change
1. Megatrends
• Global
• Regional
2. David: natural resource allocation - land
• How much unused arable land actually remains available in Africa?
• Who is gaining access to this remaining land?
• What are the emerging land constraints among smallholder in Africa?
3. Goliath: Private sector investment
• Large-scale Land Aquisitions
• Changing investment patterns

Megatrends: Factors Shaping our Future
1. Global Drivers: Rising food and energy prices
• Underpinned by rising income and urbanization in BRICS
• Has resulted in a structural shift in global food demand and a new, higher equilibrium price.
• Question is: can the world’s agricultural sector feed the growing global population?
• All of this has resulted in global demand for Africa’s natural resources; i.e. land, water and food.
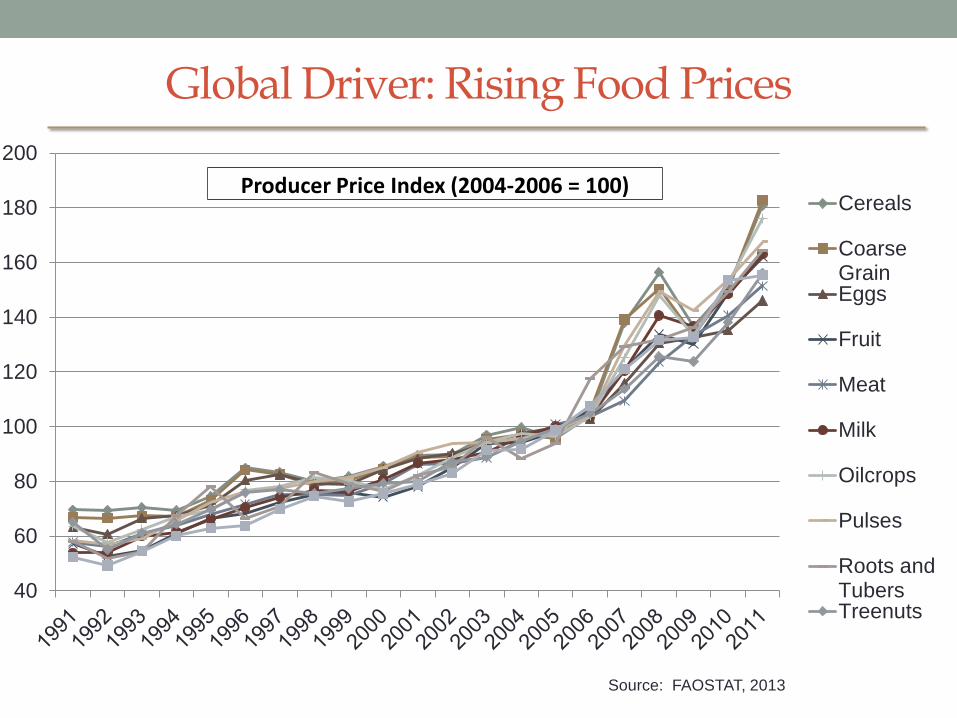
Global Driver: Rising Food Prices
40
60
80
100
120
140
160
180
200
Cereals
CoarseGrainEggs
Fruit
Meat
Milk
Oilcrops
Pulses
Roots andTubersTreenuts
Producer Price Index (2004-2006 = 100)
Source: FAOSTAT, 2013

Megatrends: Factors Shaping our Future
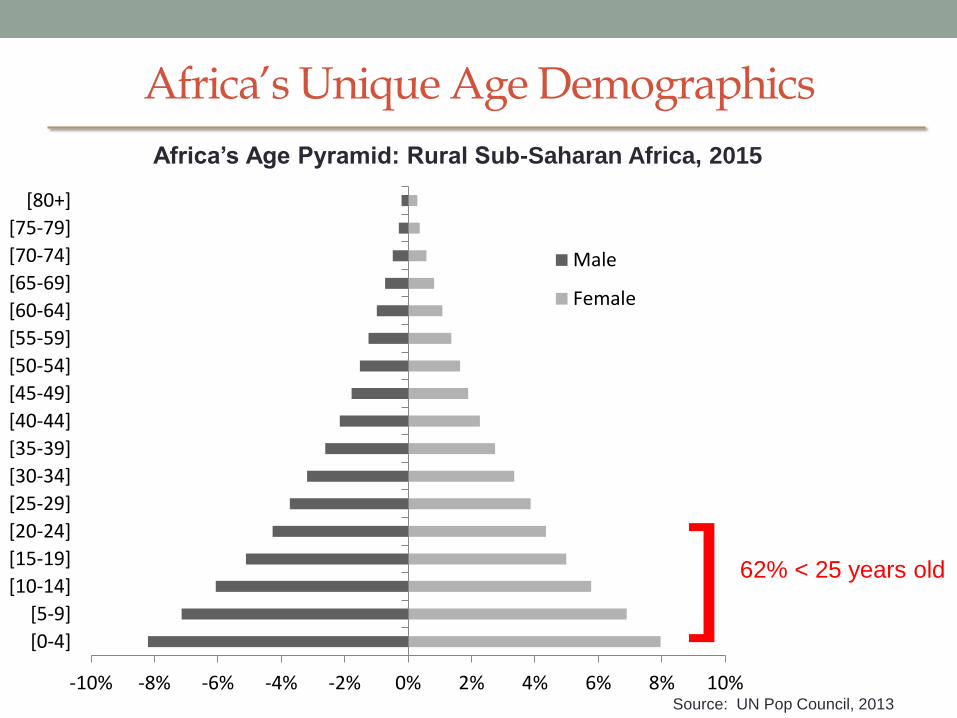
2. Regional Drivers: Unique age demographics
• 43% of the total Sub-Saharan population is below the age of 14.
• Implies that between now and 2025 over 330 million young Africans will be entering the labor force.
• Under the most favorable scenario, the urban and non-farm sectors will be able to absorb only 200 million of the youth into gainful wage employment.
• What will happen to the other 120 million young Africans?

Africa’s Unique Age Demographics
Source: UN Pop Council, 2013
43%
16% 19%
26%
0%
10%
20%
30%
40%
50%
60%
70%
80%
Sub-saharan Africa European Union North America World
Population ages 0-14 Population ages 15-64 Population ages 65 and above
Africa’s Unique Age Demographics
-10% -8% -6% -4% -2% 0% 2% 4% 6% 8% 10%
[0-4]
[5-9]
[10-14]
[15-19]
[20-24]
[25-29]
[30-34]
[35-39]
[40-44]
[45-49]
[50-54]
[55-59]
[60-64]
[65-69]
[70-74]
[75-79]
[80+]
Male
Female
Africa’s Age Pyramid: Rural Sub-Saharan Africa, 2015
Source: UN Pop Council, 2013
62% < 25 years old ]
Megatrends: Factors Shaping our Future
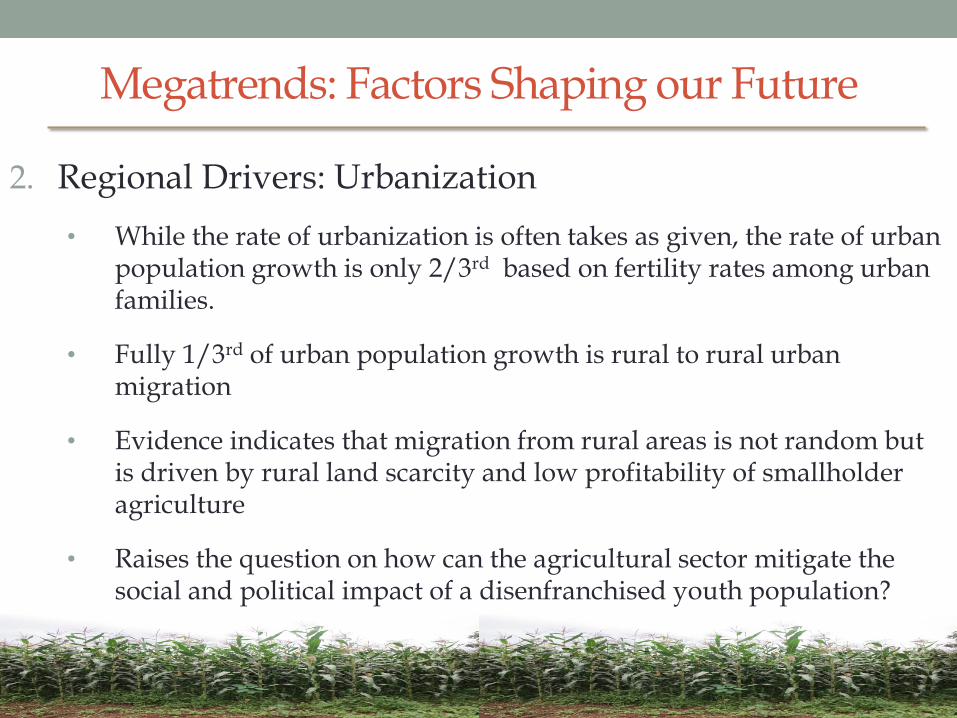
2. Regional Drivers: Urbanization
• While the rate of urbanization is often takes as given, the rate of urban population growth is only 2/3rd based on fertility rates among urban families.
• Fully 1/3rd of urban population growth is rural to rural urban migration
• Evidence indicates that migration from rural areas is not random but is driven by rural land scarcity and low profitability of smallholder agriculture
• Raises the question on how can the agricultural sector mitigate the social and political impact of a disenfranchised youth population?
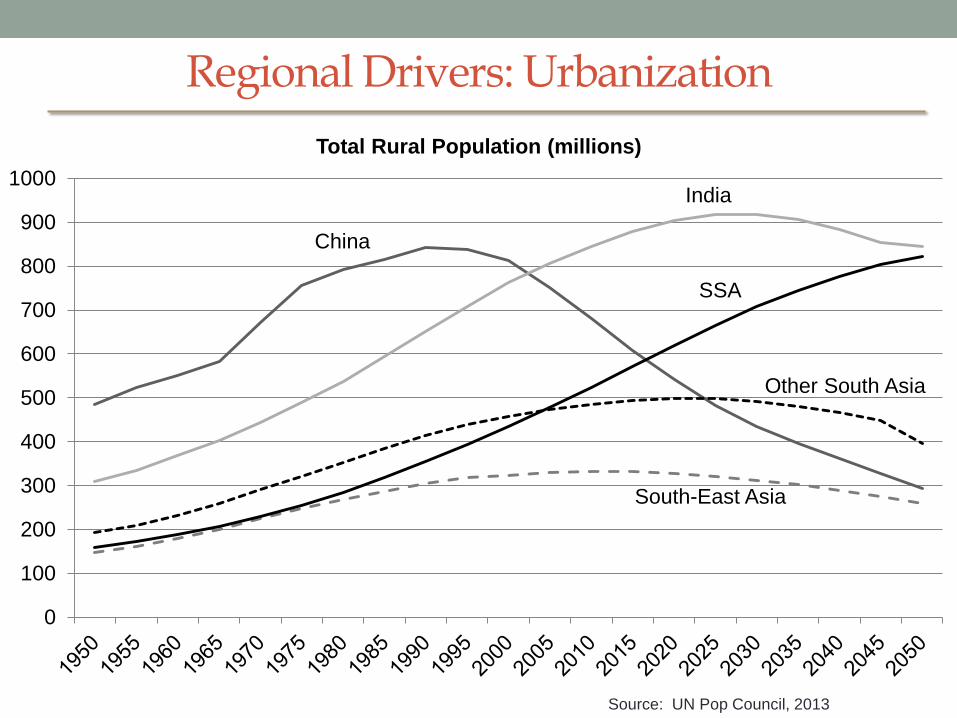
Source: UN Pop Council, 2013
Regional Drivers: Urbanization
China
India
Other South Asia
South-East Asia
SSA
0
100
200
300
400
500
600
700
800
900
1000
Total Rural Population (millions)

3. Regional Drivers: Income growth and distribution
• Income
• Rising income are taken as given but evidence suggests that there is increasing concentration of wealth into the hands of a few.
• Rising income has resulted in changing consumption patterns among the urban elite, moving away from staple commodities into high-value food items.
• However, this change in consumption is being largely met by imports from non-African markets.
Megatrends: Factors Shaping our Future

Regional Driver: income growth and distribution
0
200
400
600
800
1000
1200
1400
1600
1800
2000
2000 2001 2002 2003 2004 2005 2006 2007 2008 2009 2010 2011 2012
Congo, Dem.Rep.
Congo, Rep.
Ghana
Mozambique
Nigeria
Ethiopia
Zambia
GDP per capita (constant 2005 USD)
Source: World Bank Development Group, 2014

African Population by Income Class: excluding North Africa and South Africa
Source: Potts, 2012: calculated from the AfDB (2010)
80.6%
14.6%
4.8%
1980
Poor ($0 - $4)
Middle-class ($4 - $20)
Rich (>$20)

African Population by Income Class: excluding North Africa and South Africa
Source: Potts, 2012: calculated from the AfDB (2010)
81.8%
13.4%
4.8%
2010
Poor ($0 - $4)
Middle-class ($4 - $20)
Rich (>$20)
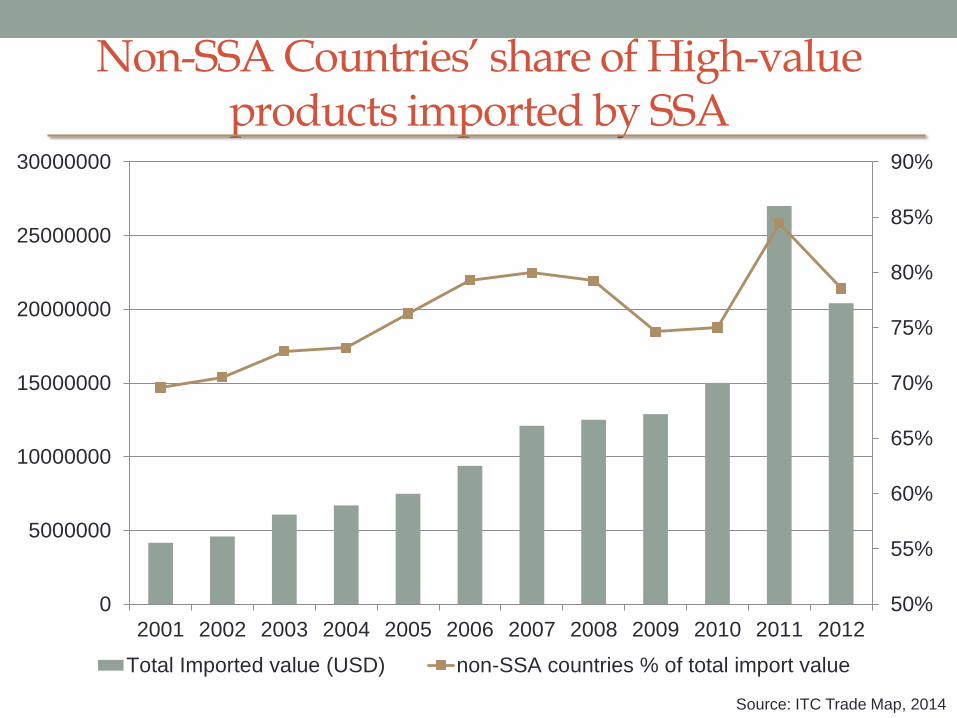
Non-SSA Countries’ share of High-value products imported by SSA
50%
55%
60%
65%
70%
75%
80%
85%
90%
0
5000000
10000000
15000000
20000000
25000000
30000000
2001 2002 2003 2004 2005 2006 2007 2008 2009 2010 2011 2012
Total Imported value (USD) non-SSA countries % of total import value
Source: ITC Trade Map, 2014

Recap
• Megatrends shaping Africa’s future
1. Global food and energy prices driving global demand for SSA’s natural resources
2. Unique population demographics implications for future unemployment
3. Income growth and distribution implications on private sector investments.
How much unused arable land actually
remains available in Africa?

Estimates of potentially available cropland
1. Potentially available cropland (PAC) estimates for Africa is about 200
million hectares
• As low as 80 or as high as 160 million hectares- depending on assumptions imposed
2. The region's underutilized land resources are concentrated in 6 countries
• Many of which are fragile states
3. Between one-half and two-thirds of the region's surplus land is currently
under forest cover
• Conversion of forests to cropland would entail major environmental costs
Estimates of potentially available cropland
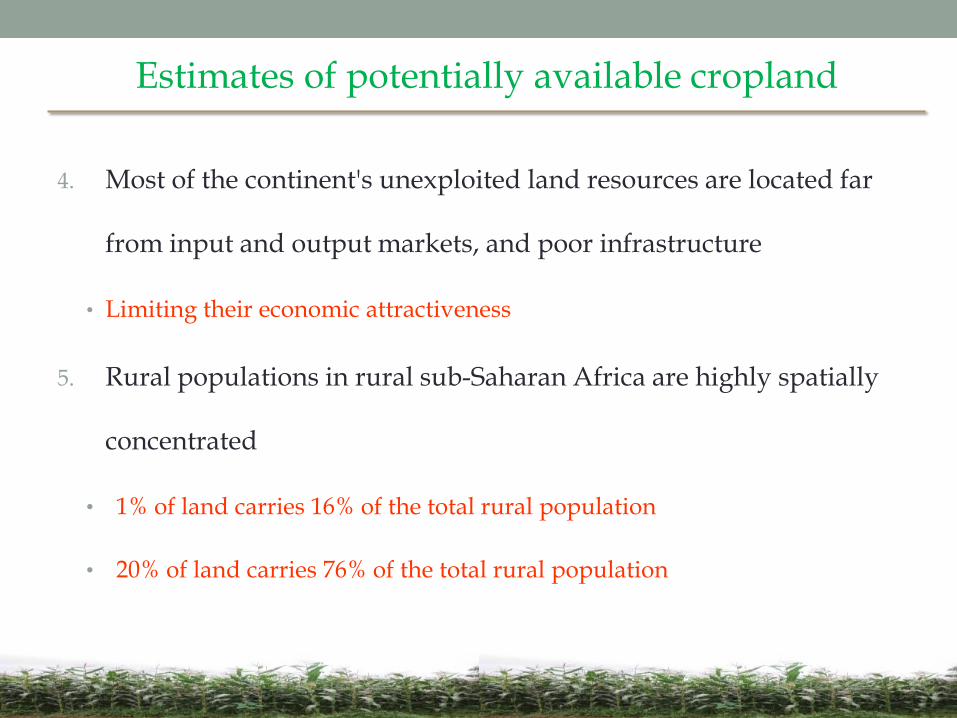
4. Most of the continent's unexploited land resources are located far
from input and output markets, and poor infrastructure
• Limiting their economic attractiveness
5. Rural populations in rural sub-Saharan Africa are highly spatially
concentrated
• 1% of land carries 16% of the total rural population
• 20% of land carries 76% of the total rural population

Clustering of rural populations: Zambia

Clustering of rural populations: Kenya

Who is gaining access to this remaining
land?
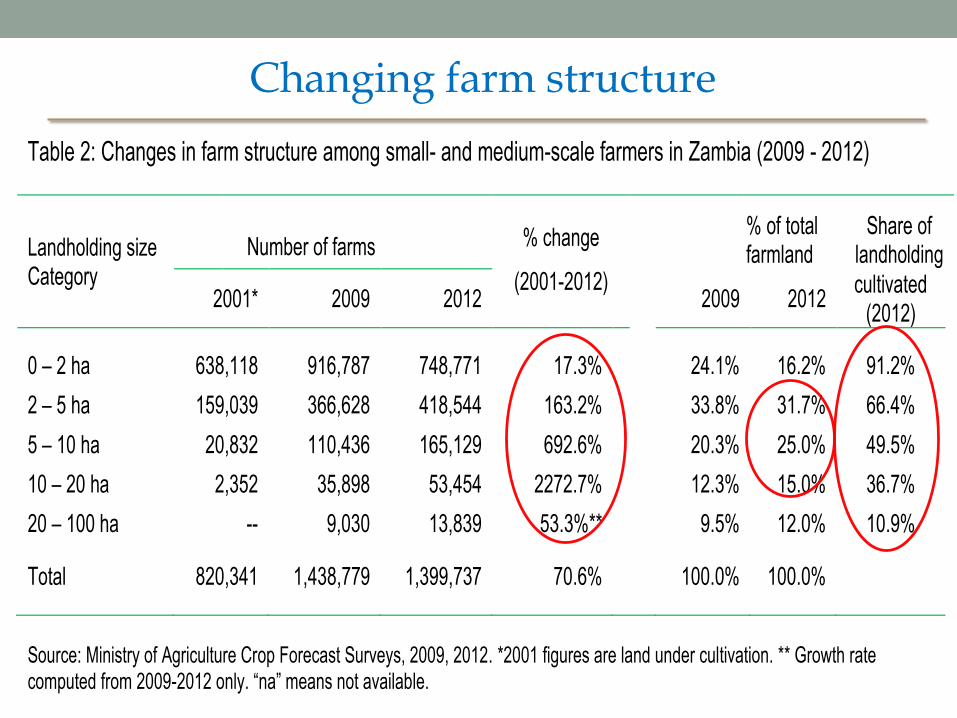
Table 2: Changes in farm structure among small- and medium-scale farmers in Zambia (2009 - 2012)
Landholding size Category
Number of farms % change
(2001-2012)
% of total farmland
Share of landholding
2001* 2009 2012
2009 2012 cultivated
(2012)
0 – 2 ha 638,118 916,787 748,771 17.3% 24.1% 16.2% 91.2%
2 – 5 ha 159,039 366,628 418,544 163.2% 33.8% 31.7% 66.4%
5 – 10 ha 20,832 110,436 165,129 692.6% 20.3% 25.0% 49.5%
10 – 20 ha 2,352 35,898 53,454 2272.7% 12.3% 15.0% 36.7%
20 – 100 ha -- 9,030 13,839 53.3%** 9.5% 12.0% 10.9%
Total 820,341 1,438,779 1,399,737 70.6% 100.0% 100.0%
Source: Ministry of Agriculture Crop Forecast Surveys, 2009, 2012. *2001 figures are land under cultivation. ** Growth rate computed from 2009-2012 only. “na” means not available.
Changing farm structure
Large scale
(foreign + domestic)
(>100ha)
Medium scale
(5-100 ha)
Million hectares
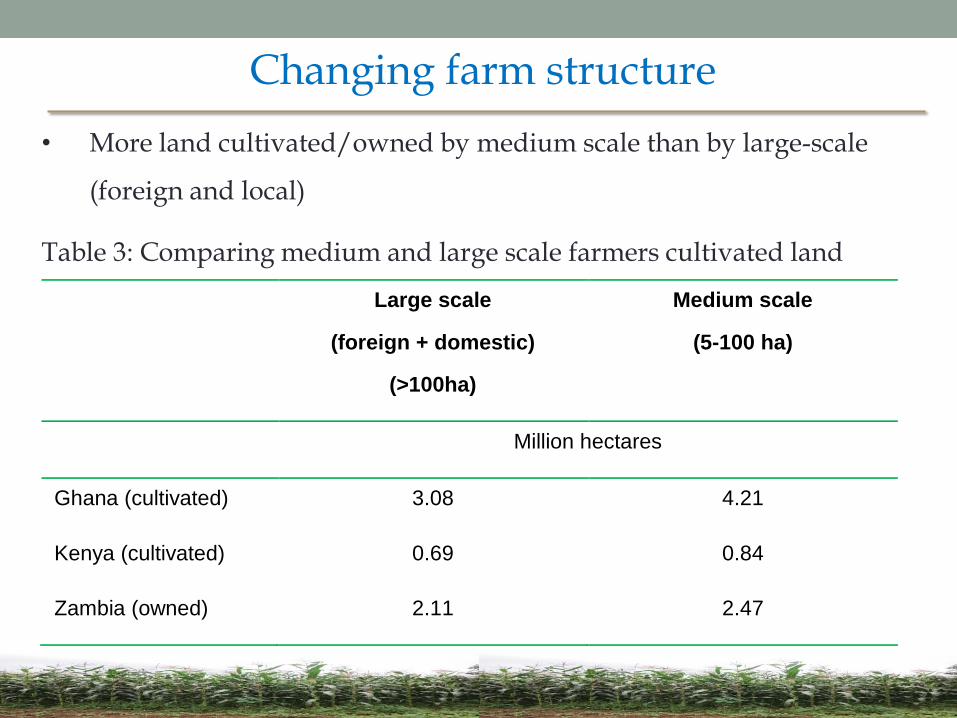
Ghana (cultivated) 3.08 4.21
Kenya (cultivated) 0.69 0.84
Zambia (owned) 2.11 2.47
Table 3: Comparing medium and large scale farmers cultivated land
Changing farm structure
• More land cultivated/owned by medium scale than by large-scale
(foreign and local)

Characteristics of the emergent famers characteristics

Kenya: Net value of crop production per hectare cultivated 1
502
002
503
003
50
'00
0K
Sh
/ha
cu
ltiva
ted
25%50% 75% 95%0 15 30 45
land -- cultivated (ha)
Net crop production per hectare cultivated
What are the emerging land constraints among the
smallholders in Africa?

Kenya: Newspaper headlines -- rising land conflicts
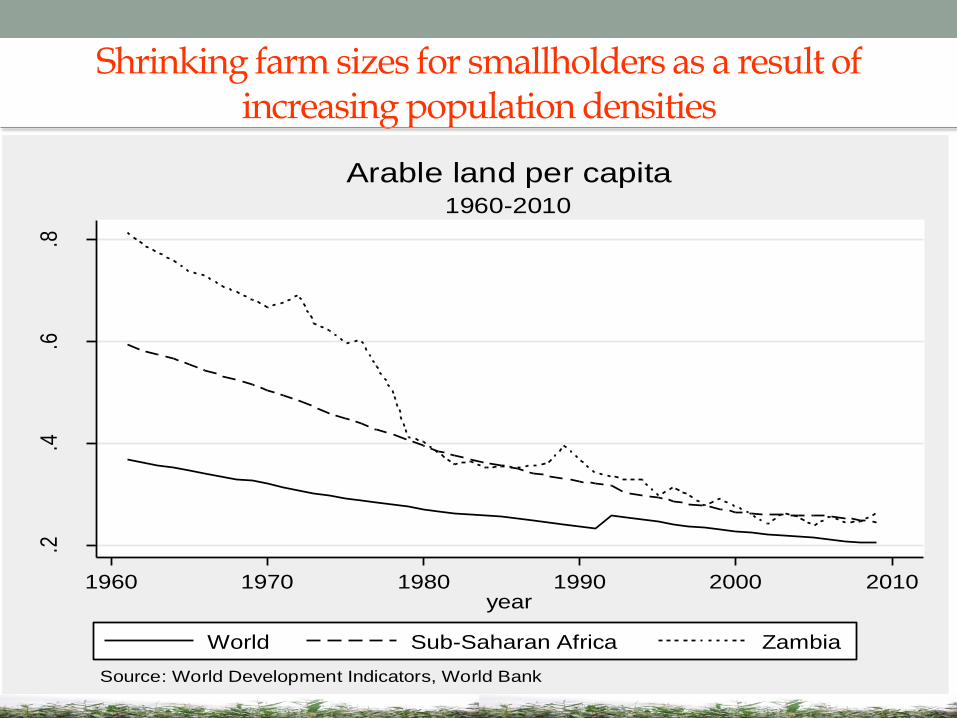
Shrinking farm sizes for smallholders as a result of increasing population densities
.2.4
.6.8
hect
ares
per
per
son
1960 1970 1980 1990 2000 2010year
World Sub-Saharan Africa Zambia
Source: World Development Indicators, World Bank
1960-2010
Arable land per capita
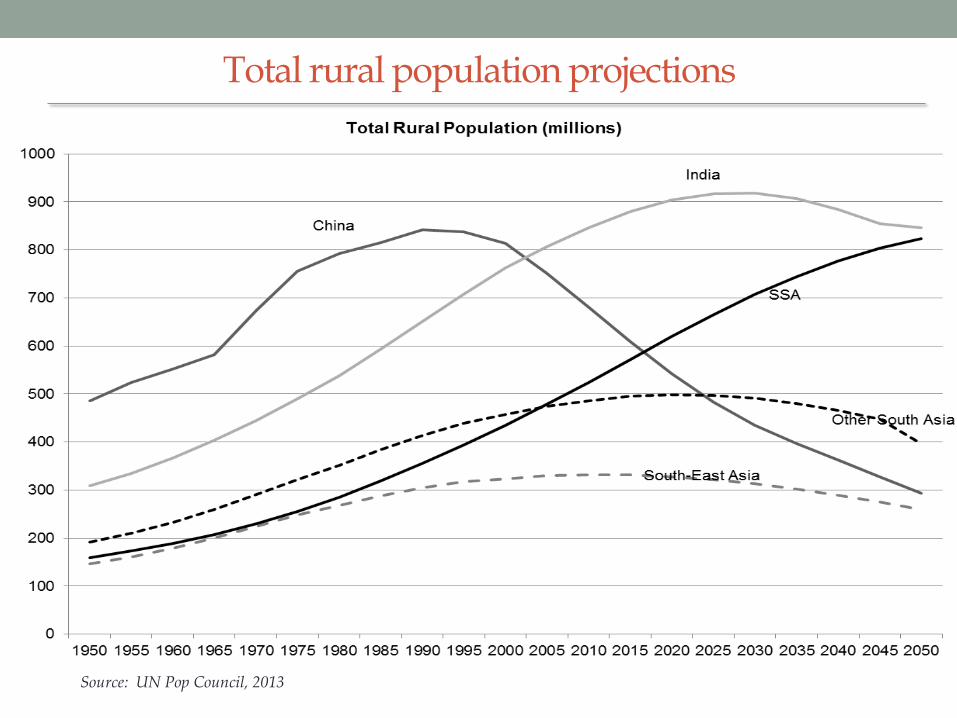
Total rural population projections
Source: UN Pop Council, 2013

Figure 4: Net crop income per hectare cultivated
2040
6080
'000
KS
h
25% 50% 75% 95%0 250 500 750 1000
persons/sq km
actual simulated
Response to increasing population densities: agricultural intensification

Large-Scale Land Acquisition Trends and
Investment Patterns

LSLA in (2000-2013) table 1: projects according to negotiation status
Oral agreement 66 3.7 1.1
Contract signed 804 50.8 30.6
concluded deals 870 54.5 31.8
Expression of interest 42 5.5 n.a.
Under negotiation 144 9.1 n.a.
Intended deals 186 14.6 n.a.
Negotiations failed 50 5.3 n.a.
Contract cancelled 24 1.6 1.5
Failed deals 74 6.9 1.5
# deals Intended ha
(millions) ha under contract
(millions)
Source: Land Matrix, 2013
Land deals in the database fulfill these criteria:
- Entails sale, lease or concession
- Area of 200 hectares or more
- In low and middle income countries
- For agricultural production, timber extraction, carbon trading, mineral extraction, industry, renewable
energy production, conservation, and tourism (focus in this presentation is on agriculture)

• Important concentration – top 20 countries, 74% deals,
80% size
• Top 20 – 9 African countries
African countries are among the most affected
0
1000000
2000000
3000000
4000000
5000000
6000000
7000000
0
20
40
60
80
100
120
# cases Size (ha)Source: Land Matrix, 2013

0
20
40
60
80
100
120
0
500000
1000000
1500000
2000000
2500000
3000000
3500000
4000000
4500000
5000000
So
uth
Su
dan
Mad
agas
car
Mo
zam
biq
ue
DR
C
Su
dan
Gu
inea
Eth
iop
ia
Sie
rra
Leo
ne
Lib
eria
Gh
ana
Ug
and
a
Tan
zan
ia
Co
ng
o
Mo
rocc
o
Cam
ero
on
Cô
te d
'Iv
oir
e
Ken
ya
Zam
bia
Sen
egal
Mal
i
Operational cases in Africa - top 20
Project not started Startup phase (no production) In operation (production)
Project abandoned Unknown # cases Source: Land Matrix, 2013
African countries – East Africa is the most affected

African countries are among the most affected
Source: Land Matrix, 2013

Who are the primary investors in Africa?
0
10
20
30
40
50
60
0
1000000
2000000
3000000
4000000
5000000
6000000
Size # Cases
North Africa West Africa Central Africa East Africa Southern Africa
Saudi Arabia UK USA Egypt South Korea
UAE India Malaysia UAE South Africa
South Africa Italy Canada USA UK
Japan Liberia Singapore Jordan Brazil
- France Belgium Saudi Arabia India
Source: Land Matrix, 2013

Global Land Use Patterns
0
50
100
150
200
250
300
350
0
2,000
4,000
6,000
8,000
10,000Concluded deals (In 1000 ha)
Source: Land Matrix, 2013
0
2
4
6
8
10
12
14
16
18
20
2004 2005 2006 2007 2008 2009 2010 2011 2012 2013
Concluded (#) Intended (#) Failed (#)
The Jatropha hype

Land Use Patterns: Africa
0
2000000
4000000
6000000
8000000
10000000
12000000
14000000
16000000
East West Southern Central North
Unknown
Tourism
Renewable Energy
Livestock
Industry
Forestry
Conservation
Agriculture
AFRICA
Source: Land Matrix, 2013
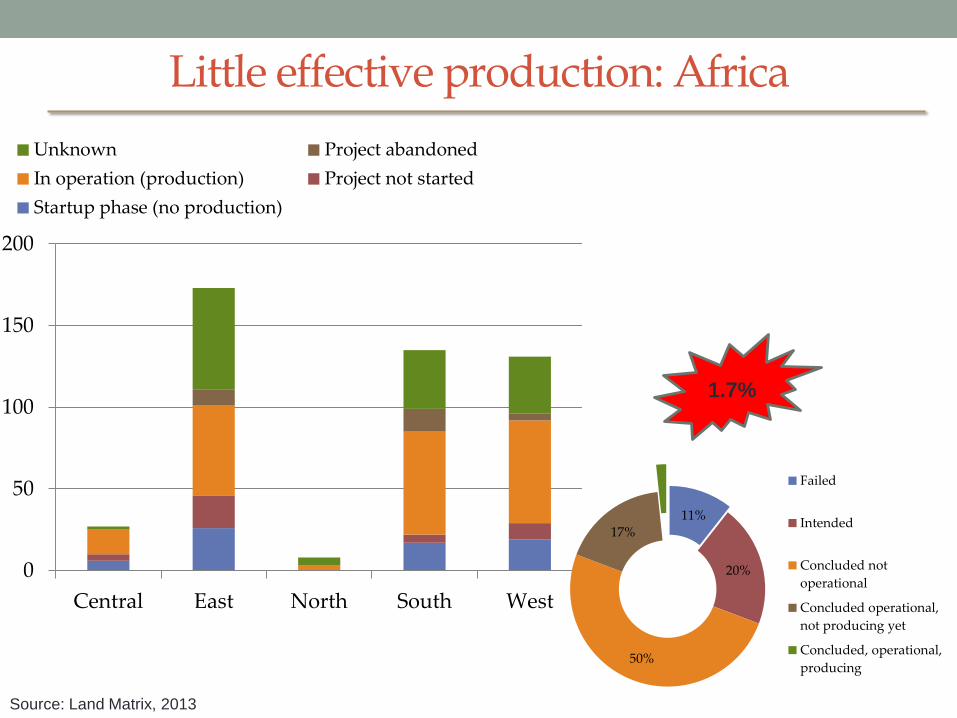
Little effective production: Africa
0
50
100
150
200
Central East North South West
Unknown Project abandoned
In operation (production) Project not started
Startup phase (no production)
11%
20%
50%
17%
Failed
Intended
Concluded not
operational
Concluded operational,
not producing yet
Concluded, operational,
producing
1.7%
Source: Land Matrix, 2013

Slowing Land Investments
0
10
20
30
40
50
60
70
80
90
100
2000 2001 2002 2003 2004 2005 2006 2007 2008 2009 2010 2011 2012
North
West
Central
East
Southern
Total Africa
Source: Land Matrix, 2013

Investment models and agrarian
change
Towards new opportunities for Africa?

Changing LSLA and Outcomes
• Uncertain institutional environments and the difficulty of doing
business
• Technicality of the projects
• The lack of markets
• Lack of financial services
• High settling and transaction costs
Independent farmer model
Associative farmer model
Cooperative farmer model
Speculative 1000-day
model
Asset management
and Investment
funds model
Nucleus estate model
Agribusiness Estate model
High failures
Source: Boche and Anseeuw, 2013

• Uncertain institutional environments and the difficulty of doing business
• Technicality of the projects
• The lack of markets
• Lack of financial services
• High settling and transaction costs
• To overcome high risks related to settlement in less developed agrarian economies
Independent farmer model
Associative farmer model
Cooperative farmer model
Speculative 1000-day model
Asset management and Investment funds model
Nucleus estate model
Agribusiness Estate model
High failures
Increased integration
Few inclusive models
Strategy
change
Source: Boche and Anseeuw, 2013
Changing LSLA and Outcomes
Implications for agrarian development and restructuration
• Corporization of agriculture
• Closed value-chains and foreign powers
• Concentration and dualization within the
agricultural sector
• Proletarization of the agricultural society

Concluding Thoughts
• Agrarian change in Africa? • Yes, probably
• Very little # - With very few ‘positive’ results
• Change not there where expected/announced, by the promotors of
LSLA
• But enduring model/paradigm – tipping point
• Lack of LT reflection, “alternative” development
trajectories • Inclusive of sectors and actors
• Roles of different actors

Stylized fact:
A stylized fact is often a broad generalization that
summarizes some complicated statistical
relationship, which although essentially true, may
have inaccuracies in the detail.
http://en.wikipedia.org/wiki/Stylized_fact