david thomas the globalization of science curricularesearch institutions and governmental research...
TRANSCRIPT
A Series of In-depth Analyses Based on Data of the International Association for the Evaluation of Educational Achievement (IEA)
IEA Research for Education
Oliver Stacey · Giulia De LazzariHilary Grayson · Hazel Griffin Emily Jones · Amanda TaylorDavid Thomas
The Globalization of Science Curricula

IEA Research for Education
A Series of In-depth Analyses Based on Dataof the International Association for the Evaluationof Educational Achievement (IEA)
Volume 3
Series editors
Dirk Hastedt, Executive Director of the International Association for the Evaluationof Educational Achievement (IEA),Seamus Hegarty, Chair of IEA Publications and Editorial Committee, University ofWarwick, UK
Editorial Board
John Ainley, Australian Council for Educational Research, AustraliaKadriye Ercikan, University of British Columbia, CanadaEckhard Klieme, German Institute for International Educational Research (DIPF),GermanyRainer Lehrmann, Humboldt University of Berlin, GermanyFou-Lai Lin, National Taiwan Normal University, Chinese TaipeiMarlene Lockheed, Princeton University, USAMichael Martin, TIMSS & PIRLS International Study Center,Boston College, USASarah Maughan, AlphaPlus Consultancy, UKIna V. S. Mullis, TIMSS & PIRLS International Study Center,Boston College, USACarina Omoeva, FHI 360, USAElena Papanastasiou, University of Nicosia, CyprusValena White Plisko, Independent Consultant, USAJonathan Plucker, John Hopkins University, USAFernando Reimers, Harvard Graduate School of Education, USADavid Rutkowski, University of Oslo, NorwayJouni Välijärvi, University of Jyväskylä, FinlandHans Wagemaker, Senior Advisor to IEA, New Zealand

The International Association for the Evaluation of Educational Achievement(IEA) is an independent nongovernmental nonprofit cooperative of nationalresearch institutions and governmental research agencies that originated inHamburg, Germany, in 1958. For nearly 60 years, IEA has developed andconducted high-quality, large-scale comparative studies in education to supportcountries’ efforts to engage in national strategies for educational monitoring andimprovement.
IEA continues to promote capacity building and knowledge sharing to fosterinnovation and quality in education, proudly uniting more than 60 memberinstitutions, with studies conducted in more than 100 countries worldwide.
IEA’s comprehensive data provide an unparalleled longitudinal resource forresearchers, and this series of in-depth thematic reports can be used to shed light oncritical questions concerning educational policies and educational research. Thegoal is to encourage international dialogue focusing on policy matters and technicalevaluation procedures. The resulting debate integrates powerful conceptualframeworks, comprehensive datasets and rigorous analysis, thus enhancingunderstanding of diverse education systems worldwide.
More information about this series at http://www.springer.com/series/14293

Oliver Stacey • Giulia De LazzariHilary Grayson • Hazel GriffinEmily Jones • Amanda TaylorDavid Thomas
The Globalization of ScienceCurricula

Oliver StaceyNational Foundation for Educational ResearchSlough, BerkshireUK
Giulia De LazzariNational Foundation for Educational ResearchSlough, BerkshireUK
Hilary GraysonNational Foundation for Educational ResearchSlough, BerkshireUK
Hazel GriffinNational Foundation for Educational ResearchSlough, BerkshireUK
Emily JonesNational Foundation for Educational ResearchSlough, BerkshireUK
Amanda TaylorNational Foundation for Educational ResearchSlough, BerkshireUK
David ThomasNational Foundation for Educational ResearchSlough, BerkshireUK
ISSN 2366-1631 ISSN 2366-164X (electronic)IEA Research for EducationISBN 978-3-319-71531-5 ISBN 978-3-319-71532-2 (eBook)https://doi.org/10.1007/978-3-319-71532-2
Library of Congress Control Number: 2017960914
© International Association for the Evaluation of Educational Achievement (IEA) 2018. This book is anopen access publication.Open Access This book is licensed under the terms of the Creative Commons Attribution-NonCommercial 4.0 International License (http://creativecommons.org/licenses/by-nc/4.0/), which per-mits any noncommercial use, sharing, adaptation, distribution and reproduction in any medium or format,as long as you give appropriate credit to the original author(s) and the source, provide a link to theCreative Commons license and indicate if changes were made.The images or other third party material in this book are included in the book’s Creative Commonslicense, unless indicated otherwise in a credit line to the material. If material is not included in the book’sCreative Commons license and your intended use is not permitted by statutory regulation or exceeds thepermitted use, you will need to obtain permission directly from the copyright holder.This work is subject to copyright. All commercial rights are reserved by the author(s), whether the wholeor part of the material is concerned, specifically the rights of translation, reprinting, reuse of illustrations,recitation, broadcasting, reproduction on microfilms or in any other physical way, and transmissionor information storage and retrieval, electronic adaptation, computer software, or by similar or dissimilarmethodology now known or hereafter developed. Regarding these commercial rights a non-exclusivelicense has been granted to the publisher.The use of general descriptive names, registered names, trademarks, service marks, etc. in this publicationdoes not imply, even in the absence of a specific statement, that such names are exempt from the relevantprotective laws and regulations and therefore free for general use.The publisher, the authors and the editors are safe to assume that the advice and information in thisbook are believed to be true and accurate at the date of publication. Neither the publisher nor theauthors or the editors give a warranty, express or implied, with respect to the material contained herein orfor any errors or omissions that may have been made. The publisher remains neutral with regard tojurisdictional claims in published maps and institutional affiliations.
Printed on acid-free paper
This Springer imprint is published by Springer NatureThe registered company is Springer International Publishing AGThe registered company address is: Gewerbestrasse 11, 6330 Cham, Switzerland

Foreword
IEA’s mission is to enhance knowledge about education systems worldwide and toprovide high-quality data that will support education reform and lead to betterteaching and learning in schools. In pursuit of this aim, it conducts, and reports on,major studies of student achievement in literacy, mathematics, science, citizenship,and digital literacy. These studies, most notably TIMSS, PIRLS, ICCS and ICILS,are well established and have set the benchmark for international comparativestudies in education.
The studies have generated vast datasets encompassing student achievement,disaggregated in a variety of ways, along with a wealth of contextual informationwhich contains considerable explanatory power. The numerous reports that haveemerged from them are a valuable contribution to the corpus of educationalresearch.
Valuable though these detailed reports are, IEA’s goal of supporting educationreform needs something more: deep understanding of education systems and themany factors that bear on student learning advances through in-depth analysis of theglobal datasets. IEA has long championed such analysis and facilitates scholars andpolicymakers in conducting secondary analysis of our datasets. So we providesoftware such as the International Database Analyzer to encourage the analysis ofour datasets, support numerous publications including a peer-reviewed journal—Large-scale Assessment in Education—dedicated to the science of large-scaleassessments and publishing articles that draw on large-scale assessment databases,and organize a biennial international research conference to nurture exchangesbetween researchers working with IEA data.
The IEA Research for Education series represents a further effort by IEA tocapitalize on our unique datasets, so as to provide powerful informationfor policymakers and researchers. Each report focuses on a specific topic and isproduced by a dedicated team of leading scholars on the theme in question. Teamsare selected on the basis of an open call for tenders. The intention is to have twosuch calls a year. Tenders are subject to a thorough review process, as are thereports produced. (Full details are available on the IEA website.)
v

The present report is concerned with science education and, specifically, theextent to which science curricula in schools are converging around the world. Thereare ongoing discussions about the extent to which international large-scaleassessments impact on national curricula and lead to curriculum convergence. Sofar, the underpinning evidence is largely unsystematic and anecdotal. IEA TIMSSdata on national curricula, gathered systematically over many years, are excellentresources to investigate what is actually happening and ground these discussions insolid evidence. The goal of this publication was to identify real changes in sciencecurricula and relate these to country contexts.
Conducted by researchers at the National Foundation for Educational Researchin England and Wales (NFER) in the United Kingdom, The Globalization ofScience Curricula draws on the TIMSS encyclopedias and questionnaires toidentify changes in science curricula over the past 20 years and elucidate theemergence of elements of a core international science curriculum. Given theinternationalization of science and the importance of science education in schools,this report will be a key resource for policymakers, curriculum designers, andteacher educators.
A forthcoming report in this series will deal with teaching tolerance in aglobalized world.
Seamus HegartyChair of IEA Publications and Editorial Committee
vi Foreword

Contents
1 Has Globalization Impacted Science Curricula? An Introduction . . . 11.1 Establishing a Framework . . . . . . . . . . . . . . . . . . . . . . . . . . . . . . 11.2 Overview of This Book . . . . . . . . . . . . . . . . . . . . . . . . . . . . . . . 3References . . . . . . . . . . . . . . . . . . . . . . . . . . . . . . . . . . . . . . . . . . . . . 4
2 A Review of the Existing Literature on Globalization of ScienceCurricula . . . . . . . . . . . . . . . . . . . . . . . . . . . . . . . . . . . . . . . . . . . . . 52.1 Introduction . . . . . . . . . . . . . . . . . . . . . . . . . . . . . . . . . . . . . . . . 52.2 Factors Contributing to the Globalization of Science Education
and Science Curricula . . . . . . . . . . . . . . . . . . . . . . . . . . . . . . . . . 72.2.1 Education as a Mechanism for Economic Growth . . . . . . . 72.2.2 Intergovernmental and Non-governmental
Organizations . . . . . . . . . . . . . . . . . . . . . . . . . . . . . . . . . 82.2.3 Information Technology and Multinational
Corporations . . . . . . . . . . . . . . . . . . . . . . . . . . . . . . . . . . 92.2.4 International Large-Scale Assessments . . . . . . . . . . . . . . . 92.2.5 Policy Borrowing and Standardization . . . . . . . . . . . . . . . 11
2.3 What Evidence is There for the Globalization of ScienceCurricula Over Time? . . . . . . . . . . . . . . . . . . . . . . . . . . . . . . . . . 122.3.1 How Different Countries Responded to TIMSS 1995 . . . . . 132.3.2 Case Study: Israel . . . . . . . . . . . . . . . . . . . . . . . . . . . . . . 142.3.3 Factors That Oppose the Globalization of Science
Curricula . . . . . . . . . . . . . . . . . . . . . . . . . . . . . . . . . . . . . 152.3.4 Conclusions . . . . . . . . . . . . . . . . . . . . . . . . . . . . . . . . . . . 16
2.4 What Methods Have Been Used Previously to InvestigateGlobalization of Curricula? . . . . . . . . . . . . . . . . . . . . . . . . . . . . . 17
References . . . . . . . . . . . . . . . . . . . . . . . . . . . . . . . . . . . . . . . . . . . . . 20
vii

3 Methodology: Examining the Globalization of Science CurriculaUsing TIMSS . . . . . . . . . . . . . . . . . . . . . . . . . . . . . . . . . . . . . . . . . . 233.1 Coding of Curriculum Questionnaire Data . . . . . . . . . . . . . . . . . . 243.2 Cluster Analysis and Discriminant Analysis . . . . . . . . . . . . . . . . . 273.3 Additional Analysis of a Sample of Countries . . . . . . . . . . . . . . . 333.4 Methodological Limitations . . . . . . . . . . . . . . . . . . . . . . . . . . . . . 35References . . . . . . . . . . . . . . . . . . . . . . . . . . . . . . . . . . . . . . . . . . . . . 37
4 Results: Evidence for the Globalization of Science Curriculafrom TIMSS . . . . . . . . . . . . . . . . . . . . . . . . . . . . . . . . . . . . . . . . . . . 394.1 Coding of Curriculum Questionnaire Data Results . . . . . . . . . . . . 40
4.1.1 The Extent of Change in Countries’ Science CurriculaOver Time . . . . . . . . . . . . . . . . . . . . . . . . . . . . . . . . . . . 40
4.1.2 The Nature of Change in Countries’ ScienceCurricula . . . . . . . . . . . . . . . . . . . . . . . . . . . . . . . . . . . . . 42
4.1.3 Changes to Science Curricula Between TIMSSCycles . . . . . . . . . . . . . . . . . . . . . . . . . . . . . . . . . . . . . . . 43
4.1.4 TIMSS Science Topics Included in Countries’Curricula . . . . . . . . . . . . . . . . . . . . . . . . . . . . . . . . . . . . . 44
4.1.5 Core and Non-core TIMSS Science Topics Includedin Science Curricula . . . . . . . . . . . . . . . . . . . . . . . . . . . . . 45
4.1.6 Comparison of TIMSS Topics Taught AcrossCountries . . . . . . . . . . . . . . . . . . . . . . . . . . . . . . . . . . . . 50
4.2 Cluster Analysis and Discriminant Analysis . . . . . . . . . . . . . . . . . 504.2.1 Grade 4 . . . . . . . . . . . . . . . . . . . . . . . . . . . . . . . . . . . . . . 504.2.2 Grade 8 . . . . . . . . . . . . . . . . . . . . . . . . . . . . . . . . . . . . . . 63
4.3 Further Analysis Using TIMSS Teacher Questionnaire andEncyclopedia Data . . . . . . . . . . . . . . . . . . . . . . . . . . . . . . . . . . . 71
Reference . . . . . . . . . . . . . . . . . . . . . . . . . . . . . . . . . . . . . . . . . . . . . . 72
5 The Globalization of Science Education and Science Curricula:Discussion and Conclusions . . . . . . . . . . . . . . . . . . . . . . . . . . . . . . . . 735.1 Have There Been Changes in Intended Science Curricula Over
the Last 20 Years? . . . . . . . . . . . . . . . . . . . . . . . . . . . . . . . . . . . 745.1.1 The Scope and Extent of Changes to Science Curricula as
Measured by the TIMSS Curriculum QuestionnaireDatasets . . . . . . . . . . . . . . . . . . . . . . . . . . . . . . . . . . . . . 74
5.1.2 Patterns of Curricular Changes Made by DifferentCountries as Measured by the TIMSS CurriculumQuestionnaire Datasets . . . . . . . . . . . . . . . . . . . . . . . . . . . 75
5.2 If Changes Do Exist, Do They Support the Hypothesis ThatScience Curricula Are Becoming Increasingly Similar AcrossCountries? . . . . . . . . . . . . . . . . . . . . . . . . . . . . . . . . . . . . . . . . . 805.2.1 Evidence That Science Curricula Are Becoming
Increasingly Similar . . . . . . . . . . . . . . . . . . . . . . . . . . . . . 80
viii Contents

5.2.2 Evidence That Suggests Science Curricula Are NotBecoming Increasingly Similar . . . . . . . . . . . . . . . . . . . . . 82
5.3 Are There Groups of Countries Where Curricula Are IncreasinglySimilar; Can the Basis of an International Core Curriculum BeIdentified? . . . . . . . . . . . . . . . . . . . . . . . . . . . . . . . . . . . . . . . . . 835.3.1 Are There Groups of Countries Where Science Curricula
Are Increasingly Similar? . . . . . . . . . . . . . . . . . . . . . . . . . 835.3.2 Can the Basis of an International Core Science
Curriculum Be Identified? . . . . . . . . . . . . . . . . . . . . . . . . 85References . . . . . . . . . . . . . . . . . . . . . . . . . . . . . . . . . . . . . . . . . . . . . 88
6 Future Directions and Topics for Further Research into theGlobalization of Science Curricula . . . . . . . . . . . . . . . . . . . . . . . . . . 89Reference . . . . . . . . . . . . . . . . . . . . . . . . . . . . . . . . . . . . . . . . . . . . . . 92
Appendix A: Literature Review Search Strategy . . . . . . . . . . . . . . . . . . . 93
Appendix B: Questions Included in Selection Log . . . . . . . . . . . . . . . . . . 97
Appendix C: Example Review Template . . . . . . . . . . . . . . . . . . . . . . . . . . 99
Contents ix

Chapter 1Has Globalization Impacted ScienceCurricula? An Introduction
Abstract Globalization is a powerful process that exerts an increasing influence onmany aspects of society. The impact of globalization on education, and moreparticularly its impact on the curriculum, is an interesting topic for research, butdepends on acquiring comparable data on school curricula from sufficient numbersof countries. The IEA’s Trends in Mathematics and Science Study (TIMSS) hascollected data on the mathematics and science curricula of participating countriessince the 1990s that enables investigation of the national content of science andmathematics curricula over time. Because existing research has tended to focus onmathematics curricula, this study focuses on the evolution of science curricula.TIMSS asks specific questions about the intended curricula, and while the intendedcurriculum is not necessarily what was implemented or achieved, it has a stronginfluence on the implemented and achieved curricula of an education system. Manyother factors, including local cultural influences, may also contribute; the influenceof the international large-scale assessments themselves may lead to countriesadopting education reforms and policies that have been successfully implementedby high-performing jurisdictions. Understanding whether and why there have beenidentifiable global changes resulting in a putative international core curriculum mayreveal which strategies and topics countries have recognized as supporting futureskills and knowledge.
Keywords Globalization � Science education � Science curriculumTrends in Mathematics and Science Study (TIMSS)
1.1 Establishing a Framework
Globalization is a topic that is frequently in the news, with the economic andsociopolitical impacts of globalization often receiving a considerable mediacoverage. By contrast the effects of globalization on education and curricula receivefar less attention. Nonetheless, the potential impacts of globalization on education areof international interest, and some have argued that competition between countries
© International Association for the Evaluation of Educational Achievement (IEA) 2018O. Stacey et al., The Globalization of Science Curricula, IEA Researchfor Education 3, https://doi.org/10.1007/978-3-319-71532-2_1
1

for labor force, the mobility of people, and the influence of intergovernmentalagencies, such as the Organisation for Economic Cooperation and Development(OECD) or the European Union, are promoting increasing similarities amongcountries’ education systems and curricula. Supranational organizations, such as theWorld Bank, may also exert their influence on educational systems, particularly indeveloping countries.
But is education around the world really becoming increasingly similar? Doesevidence exist to support the notion that the curricula developed by ministries ofeducation and educational practice in schools are increasingly conforming to a setof “international standards” and, if so, is it possible to identify these benchmarks?
Where research studies on the globalization of curricula do exist, they havetended to focus on mathematics curricula as opposed to science curricula(Rutkowski and Rutkowski 2009; Zanini and Benton 2015). Science education is animportant subject to investigate from a global curriculum perspective becausescience has always been an international discipline, with important discoveries andadvances being made all over the world, but with the need for a central body ofunderstanding for these to be interpreted and presented as a school curriculum.Therefore, internationalized thinking has long been an influence on the develop-ment of science curricula, arguably more so than in subjects such as literature orhistory, which are more likely influenced by national cultural and historicalperspectives.
Many of the topics taught as science in schools are directly influenced by globalfactors, such as human health and disease, environmental impacts including climatechange, and the future of food and energy supplies. It can also be argued thatscientific development is the predominant driver of economic growth and quality oflife. Consequently, understanding how science is intended to be taught providesinsight into how future citizens are taught about the nature and role of scientificadvances.
The IEA’s Trends in Mathematics and Science Study (TIMSS) has collectedextensive data on intended mathematics and science curricula of participatingcountries since the 1990s (Mullis et al. 2016). While the intended curriculum is notnecessarily what was implemented or achieved, it nonetheless has a strong influenceon the implemented and achieved curricula of an education system. Twenty years ofcollected data provides a valuable opportunity to directly explore the effects ofglobalization on countries’ science curricula over time.
Given the global nature of science and science curricula, this study aimed toaddress three central research questions:
Have there been changes in intended science curricula over the last 20 years?
To answer this question, we conducted a coding exercise in which changes in theintended science curriculum of countries participating in TIMSS were tracked usingresponses to the TIMSS curriculum questionnaire. This not only enabled theidentification of changes in the curriculum but also enabled the nature of changes to
2 1 Has Globalization Impacted Science …

be tracked, for example, if countries were adding new topics to their curriculum orremoving topics from the curriculum.
If changes do exist, do they support the hypothesis that science curricula arebecoming increasingly similar across countries?
To address this question, we used the outcomes from our coding exercise. Wealso conducted cluster and discriminant analyses on countries’ responses to theTIMSS curriculum questionnaires. This enabled us to identify groups of countriesthat included similar science content in their curriculum. Finally, for a smallersample of countries, information on additional features of the science curriculum,such as the mean time spent teaching science per year, was obtained from theTIMSS encyclopedias and TIMSS international results in science reports (for a fulllist of available TIMSS publications, see https://timssandpirls.bc.edu/isc/publications.html).
Are there groups of countries where curricula are increasingly similar; can thebasis of an international core curriculum be identified?
We considered the outcomes of the coding exercise and cluster and discriminantanalyses jointly in order to establish whether the intended science curricula ofTIMSS countries were becoming increasingly similar. Interpreting the results andoutcomes of both approaches enabled us to establish a more complete picture of anyemergent international core curriculum.
1.2 Overview of This Book
After this brief introduction, a literature review (Chap. 2) provides backgroundinformation and context. The literature review has three key aims (1) to identify thefactors contributing to the globalization of science education and science curricula;(2) to identify existing evidence for the globalization of science curricula over time;and (3) to identify the methods that have been used previously to investigate theglobalization of curricula.
The review establishes potential drivers and mediators for the globalization ofscience curricula. Different research approaches are identified, ranging from qual-itative methods such as interviews, lesson observations and analysis of curriculumdocuments, through to quantitative methods using statistical approaches such ascluster analysis and latent class analysis.
This literature review informs the different methods we use to investigate theresearch questions (Chap. 3). Using multiple methodological approaches enablesevidence to be collected on different aspects of our three central research questions.Countries participating in TIMSS show considerable variation in terms of thenumber and nature of changes they made to their science curriculum between 1999(2003 for Grade 4) and 2015 (Chap. 4), and using this we are able to identify and
1.1 Establishing a Framework 3
highlight topics that were included in the vast majority of participating countries’intended science curricula. Cluster analysis and discriminant analysis provideevidence for convergence or divergence in science curricula over time. In Chap. 5,we examine how the evidence obtained from the analyses and the literature reviewrelate to our three research questions.
Our research contributes to the understanding of globalization in science edu-cation and curricula, however, this study is not a measure of the total sciencecurriculum for each country considered, but a measure of the similarity of theirintended science curriculum to the TIMSS framework. This research only examinedthe science curricula of countries that participated in TIMSS, but the same approachcould be applied to other international large-scale assessments to assess their impacton national science curricula. We conclude in Chap. 6 by suggesting future areas ofresearch which would complement this study.
References
Mullis, I. V. S., Martin, M. O., & Loveless, T. (2016). 20 Years of TIMSS: International trends inmathematics and science achievement, curriculum, and instruction. Chestnut Hill, MA: TIMSS& PIRLS International Study Center, Boston College. Retrieved from http://timss2015.org/timss2015/wp-content/uploads/2016/T15-20-years-of-TIMSS.pdf.
Rutkowski, L., & Rutkowski, D. (2009). Trends in TIMSS responses over time: Evidence ofglobal forces in education? Educational Research and Evaluation, 15(2), 137–152.
Zanini, N., & Benton, T. (2015). The roles of teaching styles and curriculum in mathematicsachievement: Analysis of TIMSS 2011. Research Matters, 20, 35–44.
Open Access This chapter is licensed under the terms of the Creative CommonsAttribution-NonCommercial 4.0 International License (https://creativecommons.org/licenses/by-nc/4.0/), which permits any noncommercial use, sharing, adaptation, distribution and reproductionin any medium or format, as long as you give appropriate credit to the original author(s) and thesource, provide a link to the Creative Commons license and indicate if changes were made.The images or other third party material in this chapters are included in the chapter’s Creative
Commons license, unless indicated otherwise in the credit line to tha material. If material is notincluded in the chapter’s Creative Commons license and your intended use is not permitted bystatutory regulation or exceeds the permitted use, you will need to obtain permission directly fromthe copyright holder.
4 1 Has Globalization Impacted Science …

Chapter 2A Review of the Existing Literatureon Globalization of Science Curricula
Abstract Given the extensive nature of globalization and its wide-ranging impact,the review of the literature on the effect of globalization on science education andscience curricula was restricted to three particular aspects. Firstly, identifyingthe factors that potentially contribute to the globalization of science education;secondly, exploring research evidence for the globalization of science curricula overtime; and thirdly, analyzing the approaches and methods that have been used inprevious research studies to empirically investigate the globalization of curricula.A wide range of factors were identified as promoting the globalization of scienceeducation and curricula, including the growing use of information technologies andthe increasing influence of intergovernmental organizations in education. However,regional and local cultural factors may counteract globalization to some extent. Theliterature review identified some evidence for globalization of science curricula overtime; the impacts of international large-scale assessments, such as the Trends inInternational Mathematics and Science Study (TIMSS), may have driven changesand reforms in the science curricula of many participating countries. The literaturerevealed that a number of both qualitative and quantitative methods had been usedto investigate globalization of curricula over time, and the advantages and draw-backs of each of the approaches were considered.
Keywords Curriculum alignment � Curriculum convergence � GlobalizationInternational large-scale assessment � Science education � Science curriculumTrends in Mathematics and Science Study (TIMSS) � TIMSS video study
2.1 Introduction
Globalization is a process with far-reaching impacts in many different disciplines,including education. Globalization is an extensive concept, although in its simplestform it can be described as relating to “reforms and structures that transcendnational borders” (Astiz et al. 2002). Within education, the process of globalizationhas the potential to exert a wide range of effects on national education policies and
© International Association for the Evaluation of Educational Achievement (IEA) 2018O. Stacey et al., The Globalization of Science Curricula, IEA Researchfor Education 3, https://doi.org/10.1007/978-3-319-71532-2_2
5

school science curricula. Whilst globalization has distinctive effects on education, itis important to note that this cannot be completely removed from wider economicand cultural globalization.
Given the variety of ways in which globalization can impact education andcurricula, this literature review had three key aims:
(1) to identify and explore the factors contributing to globalization in scienceeducation and science curricula
(2) to investigate the research evidence for the globalization of science curriculaover time
(3) to identify the approaches and methods that have been used in previousresearch studies to empirically investigate the globalization of curricula, and touse these to inform the statistical analyses conducted during this researchproject.
A literature search was conducted during the autumn of 2016. Given the largenumber of published articles on globalization in education and the resourcesavailable for this report, we did not attempt to present an exhaustive overview of allpublished articles relating to globalization of curricula. Instead, we employed ahighly focused search strategy. The literature search was designed to identifystudies that provided evidence of countries that had redesigned or modified theirscience curricula to mirror high-performing jurisdictions or to align more closely tothe TIMSS framework (curriculum) content. The literature search also looked forstudies that had already employed TIMSS data to investigate globalization ofcurricula.
The search strategy was designed to maximize the chances of identifying themost pertinent literature within those constraints. The date parameters were limitedto recent (2010 onwards) evidence on issues surrounding global alignment/globalization of science curricula. However, the date parameters were extended to1995 to identify research that had used TIMSS data to explore issues surroundingglobal alignment/globalization of science curricula (the influential ThirdInternational Mathematics and Science Study, the first cycle of what later becameknown as TIMSS, was administered in 1995). This ensured that significant studiesbased on data from the 1995 study were not missed from the literature review.
Key education bibliographic databases (the Australian Education Index, theBritish Education Index and the Education Resources Information Center [ERIC])were searched using globalization/curriculum alignment terms combined withscience education terms tailored to the specific search capability of each database(see Appendix A for a detailed explanation of the search terms employed). Inaddition, the table of contents of the key science education journal, the InternationalJournal of Science Education, were reviewed from 2010 onwards and relevantresearch papers were noted. The publications list on the International Association forthe Evaluation of Educational Achievement (IEA) website was also reviewed.
6 2 A Review of the Existing Literature …

The literature search identified 76 research articles. The abstracts of each of thesearticles were then appraised by three researchers in order to identify the mostrelevant articles to include in the literature review. A number of quality criteria wereapplied to establish the relevance of the article to the literature review. Priority wasgiven to: articles that considered the curricula/education system of more thanone country; articles published in peer-reviewed journals; articles that focused onscience curricula (as opposed to other subject curricula); empirical studies; andstudies that made use of data from international large-scale assessments such asTIMSS. A set of questions was used to appraise the articles identified in theliterature search (Appendix B).
We used a template (see Appendix C) to review and evaluate the contents of theten most relevant articles and summarize any data or evidence related to our threeresearch questions.
The research in this literature review identified forces that are contributing to anddriving globalization in science education and science curriculum and also forcesthat are counteracting or mediating globalization.
2.2 Factors Contributing to the Globalization of ScienceEducation and Science Curricula
Spring (2008) identified a number of different forces that are involved in drivingglobalization within education more generally. These forces include:
• the emphasis on education as a mechanism for economic growth• intergovernmental, governmental and international non-governmental organizations• information technology• multinational corporations• international large-scale assessments.
Whilst these forces are shaping globalization in education in a more generalsense, they are also influencing and impacting the globalization of science educa-tion and science curricula. The specific impact of each of these forces is outlinedbelow. Although each force is discussed separately, it is important to appreciate thatthese forces do not exist in isolation and interact with each other to shape theprocess of globalization in science education.
2.2.1 Education as a Mechanism for Economic Growth
The twenty-first century has seen growing convergence in political agendas inrelation to education, particularly in the developed world. Spring (2008) identified
2.1 Introduction 7
the concept of the knowledge economy as one of the most significant factorscontributing to the globalization of education and curricula. As countries around theworld become more engaged in the globalized economy, there develops animportant need for nations to prepare their young people for active participationwithin these globalized markets (Sellar and Lingard 2014). Also, as countries seekto build and develop knowledge-based economies, this has a direct effect on edu-cation and school curricula as politicians seek to equip learners with the skills andcompetencies that are needed to succeed in the global economy. Weber (2011)identified this phenomenon in the Gulf states, where the focus on the knowledgeeconomy is influencing school curricula as politicians seek to diversify these statesfrom their current hydrocarbon-based economies.
The knowledge economy is linked to the increased focus in many countries onthe role of education in promoting economic growth. As a consequence, there hasbeen greater emphasis in many countries on schools developing and equippingstudents with workplace skills and competencies and preparing them for life beyondeducation. This in turn has the potential to lead to convergence in science curriculaas countries adapt curricula to focus on aspects of science that have more potentialto facilitate future economic growth.
Globalization and the economic aspects of globalization are of particularrelevance to science education and science curricula, as many of the most global-ized sectors of the economy have a technological or scientific basis that requiresspecific scientific knowledge and skills. Computer and mobile technologies,pharmaceuticals and biotechnologies, petrochemicals and emerging clean energytechnologies are for example some of the most globalized sectors of the worldeconomy. Therefore, countries seeking to develop economic engagement in theseareas may consider changes to science curricula as a medium- to long-term strategyfor successful involvement in these sectors.
2.2.2 Intergovernmental and Non-governmentalOrganizations
In addition to the knowledge economy and economic globalization, some inter-governmental and nongovernmental organizations are important actors in theglobalization of education. For example, intergovernmental organizations such as theWorld Bank and the Organisation for Economic Cooperation and Development(OECD) are influential in both shaping educational discourse and the educationalagenda in many countries. Both organizations view the purpose of education from aneconomic perspective and consider education as amechanism fromwhich to stimulateeconomic growth. Sellar and Lingard (2014), for example, suggested that “the rise ofthe OECD’s education work is linked to the economization of education policy”.These organizations consider one of the primary roles of school is to prepare studentsto be successful participants in the knowledge economy (OECD 1996).
8 2 A Review of the Existing Literature …

2.2.3 Information Technology and MultinationalCorporations
The increasing role of information technology and the internet has had a significantimpact on globalization in science education. This has largely been due to the speedand ease with which information can be accessed and transferred (OECD 1996).Potential impacts of this on science curricula include the rapid sharing of scientificinformation and ideas across borders by universities and educational institutions, aswell as multinational corporations who provide educational services and curriculumresources to schools and education ministries across the world.
Information and communications technology (ICT) has already transformedscience education and curriculum in a number of different ways, for example by“expanding the spaces, methods and times for its spread” (Cornali and Tirocchi2012). Science teaching materials have been enhanced by ICT, with added func-tionalities including animations and multimedia content. In science education, thishas meant that experiments that could not be undertaken in the average schoolscience laboratory may now be simulated by such teaching tools. The quantity andaccessibility of learning resources has increased dramatically with the proliferationof ICT, and personalized learning tailored to the needs of the individual student hasbecome more feasible and cost effective. ICT has also allowed instantaneoussharing of information and content and permitted interactions between learners overlarger geographic distances. In future, the impact of ICT on science education andcurricula is likely to increase further, as traditional science curricula based onfactual knowledge are replaced with more open science curricula centered on theacquisition of specific skills (Cornali and Tirocchi 2012).
2.2.4 International Large-Scale Assessments
One of the most powerful forces shaping globalization in science education andscience curricula is the development of international large-scale assessments ofscience such as TIMSS and the Programme for International Student Assessment(PISA). The PISA assessment has been described as playing “a major role in thestandardization of education” (Spring 2008). International assessments are growingin influence as the number of countries participating in them increases. Large-scaleassessment is contributing to the globalization of science education and sciencecurricula in a number of different ways, as we will discuss.
A review of the effects of TIMSS 1995 on teaching and learning in 29 differentcountries highlighted the role that it had played in the restructuring of nationalscience curricula and the subsequent integration of science curricula across somecountries (Robitaille et al. 2000). Following TIMSS 1995, a number of the par-ticipating countries embarked on extensive science curriculum revisions, changing
2.2 Factors Contributing to the Globalization … 9

the science content taught (as in Kuwait) or the skill areas emphasized within thecurriculum (as in Latvia) (see Table 2.1).
Evidence from Israel (Klieger 2015) supports the idea that international surveysand the content assessed in them can promote the convergence and globalization ofscience curricula. Following poor TIMSS results in both 2003 and 2007, the IsraeliMinistry of Education opted to reform its science curriculum so that it was morealigned to the TIMSS science content domains. Therefore, in some countries atleast, the TIMSS assessments have directly affected national science curricula.
By contrast, interviews with experts in science education in Australia (a countrywhich has traditionally performed relatively well in TIMSS and PISA) suggest thatthe international assessments have not had a major impact on the curriculum(Aubusson 2011). However, these interviews did suggest that TIMSS and PISAwere nonetheless influential, and there was a clear desire amongst Australianpolicymakers and the science education community to ensure that standards onthese assessments were maintained over time.
Robitaille et al. (2000) also noted that for some countries (such as Japan), theimpact of TIMSS on the science curriculum had been relatively minor. Differencesin the impact that international large-scale assessments have had on countries’
Table 2.1 Responses to TIMSS 1995 science results
Type of response Description of response Examplecountries
No major changes tocurriculum
No changes or very minor changes in responseto TIMSS
Japan,Netherlands,Flemish Belgium
Changes to content inscience curriculum
Extra topics added to the science curriculum,for example the inclusion of environmentalscience topics
Iran, Kuwait
Changes to skillsemphasis in curriculum
Shift from acquiring knowledge to being ableto apply knowledge; greater emphasis onpractical and problem-solving skills
Latvia, CzechRepublic
Increased status of sciencewithin education system
More time allocated to teaching science,particularly at primary age
Iceland
Change to structure/organization of sciencecurriculum
Introduction of an integrated sciencecurriculum in the primary phase of schooling
Romania
Changes to scienceassessment
Change from sampling assessments to fullcohort testing
Philippines
Amendments to science assessments toincorporate TIMSS items
British Columbia(Canada)
Changes to teachertraining and development
Increased support and training to strengthenpre-secondary school teachers’ scienceknowledge
Norway
Changes to curriculum toaddress student attitudes
Science curriculum amended to addressstudents’ negative attitudes towards science
Republic ofKorea
10 2 A Review of the Existing Literature …

curricula reveal that each country participating has “its own unique set of moti-vations for participating, and each of them has their own set of expectations for thestudy” (Robitaille et al. 2000).
2.2.5 Policy Borrowing and Standardization
Linked to the rising influence of international large-scale assessments is “policyborrowing”, where countries adopt education reforms and policies that have beensuccessfully implemented in other countries, typically high-performing jurisdic-tions. There has been a suggestion that the rate of policy borrowing is increasingover time, and that this is directly affecting national education policies (Rutkowskiand Rutkowski 2009). This increase in policy borrowing is perhaps unsurprising, asinternational assessments facilitate comparison between countries and provideevidence for the most successful and high-performing countries (as measured by theassessment).
In addition to policy borrowing and international large-scale assessments, Astizet al. (2002) outlined the global trend towards greater emphasis on standardization,achievement and assessment in science and mathematics curricula. This has beenachieved through approaches strengthening school accountability and is also con-tributing to greater convergence of curriculum goals in different countries.
However, despite the wide range of forces driving globalization in scienceeducation and curricula, there are other factors that are counteracting or mediatingthe rate of globalization in this area. One of the most important counteractingfactors is local culture. For example, research comparing science teaching in Grade6 classrooms in Australia and China highlighted the impact of culture on curriculaand educational practices in these countries (Tao et al. 2013).
The study found that the contrasting cultures and education philosophies inAustralia and China had an impact not only on classroom practices but also on howeducation reforms are enacted. For example, in China, despite reforms to thescience curriculum to give a greater emphasis to constructivist approaches, theresearch identified resistance to these reforms, with traditional teaching approaches(such as the memorization of facts, reading books and watching teachers conductexperiments) still the dominant approach to science teaching in many schools.Clearly, even if the intended science curricula in different countries or jurisdictionsmay be becoming more globalized, this does not necessarily mean that theimplemented science curriculum experienced by students becomes more closelyaligned.
The misalignment between countries’ intended and implemented science cur-ricula and the complex interplay between central and local forces is not limited toChina. Astiz et al. (2002) identified similar issues in Spain and the United States. InSpain, a common curriculum is specified by central government, but this curriculumis then adapted and interpreted locally in the different regions of the country.
2.2 Factors Contributing to the Globalization … 11

This means that students in the different regions will have different interpretationsof the same curriculum.
In the United States, there are several contrasting forces that exert an influenceon the curriculum. On one level there has been the centralization of curriculumgoals, but opposing this there has been decentralized curriculum implementation.Once again, the localization of curriculum interpretation and implementation meansthat the implemented curriculum is likely to be far less standardized and morevariable than the intended curriculum prescribed centrally. These countries providestrong examples of how global forces act on curriculum at a national level but arethen modified and adapted at a more local level.
Other evidence also suggests that the effect of globalization in science educationand science curricula is relatively limited. Research using TIMSS data, whichcompared the content standards, textbook content and teaching time allocated toscience topics for students at Grade 8 in participating countries, indicated thatscience teaching and science curricula in Grade 8 in different countries were far lesshomogenous than for mathematics (Cogan et al. 2001). Considerable differences incountries’ approaches to science education have also been attributed to culturaldifferences between countries: “how the curriculum is specified and organized,what students are expected to learn and be able to do – are all reflections of thatculture” (Cogan et al. 2001, p. 106).
This preliminary overview reveals a number of different factors have beenidentified as contributing to the globalization of science education and sciencecurricula. Whilst there are strong driving forces promoting globalization of scienceeducation, evidence on the extent of their impact and for convergence in sciencecurricula is variable, with no consistent pattern to the effect on countries. The nextsection of the literature review specifically considers the evidence for the global-ization of science curricula over time.
2.3 What Evidence is There for the Globalizationof Science Curricula Over Time?
As noted in Sect. 2.2.4, each country has its own set of local conditions whichimpact both curriculum decisions and their motivation for participating in inter-national assessments such as TIMSS and PISA. However, several of the researchstudies identified in our literature review provided evidence for the globalization ofscience curricula over time, identifying international large-scale assessments suchas TIMSS and PISA as playing a role in this convergence. This is, in part, due to theway that these assessments facilitate the comparison of different education systems.This, in turn, may act as a catalyst for change and convergence, with countriesmaking changes to their education systems in order to address perceived weak-nesses or deficiencies identified as a result of their participation in the internationalassessments.
12 2 A Review of the Existing Literature …

The TIMSS 1995 survey provides a strong early example of the impacts ofinternational large-scale assessments on science education and curricula, with manygovernments analyzing the results from TIMSS 1995 and using the outcomes toinform decisions about future educational and economic development.
2.3.1 How Different Countries Responded to TIMSS 1995
Robitaille et al. (2000) analyzed the changes that were made to science curricula ina wide range of countries following the publication of the TIMSS 1995 results.Countries’ responses to their performance in TIMSS could be sorted into severalbroad categories (Table 2.1).
For some high-performing countries, such as Japan, the TIMSS 1995 results hadminimal impact on their science curriculum. Other countries, which performedreasonably well in TIMSS 1995, used the wide range of data reported in the studyto modify specific aspects of their science curriculum. For example, in the Republicof Korea, the government reduced the overall content of the curriculum to addressstudents’ negative attitudes to science, as reported in the TIMSS data. Both theCzech Republic and Latvia modified performance expectations to promote theapplication of science and problem-solving skills.
Kuwait introduced a module on environmental science and Romania reorganizedits curriculum into a more coherent whole to improve students’ abilities to makeconnections between different curriculum areas. Some changes were more closelyrelated to policy or application of policy than the specific curriculum. For example,Norway placed a much greater emphasis on strengthening the subject knowledge ofteachers, whilst the Canadian province of British Columbia introduced newassessments for Grades 4 and 7, with about half of the assessment questions drawnfrom released TIMSS items.
For several countries, a relatively poor performance in TIMSS 1995 acted as adirect prompt to institute significant science curriculum change, in an attempt toimprove their performance in future international comparison tests. In Iceland poorperformance in TIMSS 1995 started a process of curriculum review where theTIMSS framework itself was used as a curriculum model, leading to an increase inthe importance of science and mathematics teaching in Icelandic schools. Similarly,in Iran, poor results in TIMSS 1995 led to the identification of factors that meritedincreased attention in the curriculum, prompting changes to the curriculum againbased on the TIMSS framework. These increased the focus on scientific skills, aswell as the cognitive demand of the curriculum, and extended curriculum coverageto include areas such as the environment.
2.3 What Evidence is There for the Globalization … 13

2.3.2 Case Study: Israel
Israel provides an interesting case study of how a country has responded specifi-cally to the results from international large-scale assessments by changing itscurriculum and how this was implemented. Klieger (2015) outlined a series ofpolicy changes made between 1996 and 2011; the country’s poor performance inthe international surveys provided a major incentive for reforms, leading, in 2009,to the Ministry of Education setting achievement targets to progress at least tenplaces in the rankings for the TIMSS 2011 and PISA 2012 assessments. Theyaimed to achieve this by intervening at both the intended and implemented cur-ricular levels, through a series of curriculum changes and operational changes to thedelivery of the curriculum. Klieger (2015) reviewed the evidence for those changesfrom government documents and compared the science curriculum from 1996 tothat of 2011 for evidence of globalizing effects. International surveys had clearimpact on the content of the Israeli science curriculum. Topics that were absentfrom the international frameworks were dropped, including “the Earth and theuniverse” (some sub-topics were integrated within other topics), “information andcommunication” and “the senses”, whilst topics that appeared in the internationalframeworks were added, including “human health” and “acids and bases”. Thestructure of the curriculum and the way that skills were presented and organizedwithin the curriculum were also aligned to the international frameworks. Forexample, the 2011 Israeli curriculum integrated problem-solving skills within thescience content and further emphasized high-order thinking skills (HOTS) such asargumentation. In line with international frameworks, scientific inquiry skillscontinued to be presented separately.
The Israeli Government also sought to address the implemented curriculum byinterventions at the teacher level, seeing this as a more immediate way to bringabout change than through the intended curriculum. For example, in 2005, advicewas issued to ensure that teachers taught the content of international surveys evenwhen it did not appear in the Israeli curriculum at that time. In 2009, there was anintensive in-service training program for teachers based on the findings of theTIMSS and PISA studies, accompanied by closely specified “kits” of teachingmaterials that teachers were obligated to use.
The desired impact of these changes to the curriculum and its implementationwas seen in the results from TIMSS 2011. The baseline achievement for TIMSS1995 (Grade 8) in Israel was an average scaled score of 486, placing the country26th out of the 38 participating jurisdictions. After the implementation of many ofthe changes highlighted above, the average scaled score for Israel had risen to 516by 2011. This exceeded the scaled international average of 500 and ranked thecountry 13th out of the 42 participating educational jurisdictions. Klieger (2015)concluded that, because of the policies of the Department of Education, the inter-national frameworks have had a conspicuous influence on the curriculum content,but, as a consequence, classroom activities have become much more prescriptiveover this time.
14 2 A Review of the Existing Literature …

2.3.3 Factors That Oppose the Globalization of ScienceCurricula
The influence of globalizing factors on the intended curricula, through policy-makers engaging with globalizing influences such as international large-scaleassessments, has been documented (Klieger 2015; Robitaille et al. 2000). However,the implemented curriculum is delivered by teachers in the classroom, who areexposed to a different set of influences, especially at a more local, cultural level.Cogan et al. (2001) examined how different localized educational “cultures” canaffect the implementation of curricula by analyzing the TIMSS 1995 dataset to lookfor culturally specific patterns in the teaching of science across 36 of the countriesthat participated. In this context, the educational culture is defined in terms of
how schooling is organized – the goals and purposes identified for each year, how decisionmaking authority is distributed (or not)… how the curriculum is specified and organized,what students are expected to learn and be able to do.
(Cogan et al. 2001, p. 106).Cogan et al. (2001) analyzed the different curricula at three levels: the intended
curriculum, the potentially implemented curriculum, and the implemented cur-riculum. Firstly, the intended curriculum was measured by coding the differentcontent statements specified in the curricula of the educational jurisdictions. Thestudy compared these to the 48 TIMSS science framework topics for Grade 8assessment. Whilst most countries specified teaching the majority of these topics,there were significant variations. Seven countries included fewer than half of thesetopics in their curricula (Republic of Korea, Hong Kong, Romania, Japan,Germany, Greece and the Czech Republic), whilst three countries included alltopics (Iran, New Zealand and the United States).
The study quantified the potentially implemented curriculum by coding thecontent of science textbooks. Whilst most countries’ textbooks covered the majorityof the 48 TIMSS science framework topics, there were six countries that coveredless than half of these in textbooks (Denmark, Japan, Iran, Singapore, Israel andGermany), whilst four (Canada, Colombia, Switzerland and the United States)covered all, or nearly all topics.
The implemented curriculum was measured by the allocation of teachers andteaching time to the different topics. The picture in terms of teaching time iscomplicated by the teaching of science as different courses (e.g. biology, chemistry,physics and earth sciences), which means that no single topic in science was taughtby more than 70% of all science teachers (compared to an average of 90% of allteachers for mathematics topics). This produced a disparate picture, with substantialvariations apparent from a statistical analysis of the percentage of teachers teachingspecific topics in different countries.
In conclusion, Cogan et al. (2001) indicated that there were few commonalitiesacross countries, or even within countries at different curricular levels. For example,they were unable to define five “core” science topics across participating countries
2.3 What Evidence is There for the Globalization … 15

as they derived a different list of topics at each curricular level (curricular content,textbooks, teaching content and instructional time allocated). This variation is incontrast to a similar study conducted for mathematics that did exhibit consistencyacross countries and levels of organization. They concluded that this “reflects thegreater diversity in the way science is organized and delivered across the TIMSScountries, at least in comparison to mathematics” (Cogen et al. 2001, p. 128).
Other studies have reported regional cultural effects. Kjaernsli and Lie (2008)adopted a cluster analysis approach using item responses to TIMSS 2003 sciencequestions and identified a number of countries that clustered together largely alonggeographic or linguistic lines. For example, the study identified an Arabic cluster,an English-speaking cluster and a South Eastern European cluster. This studyprovides some evidence for the alignment and convergence of science curriculaalong geographic and cultural lines.
A more detailed approach to looking at cultural differences in implementednational curricula was taken by the 1999 TIMSS video study (Roth et al. 2006). Thestudy was conducted in conjunction with the IEA by the US National Center forEducation Statistics and the US Department of Education under a contract withLessonLab, INC of Los Angeles (for further details see http://www.timssvideo.com/timss-video-study). This study compared science teaching and learning in theUnited States to that of four higher achieving countries (namely Australia, Japan,the Czech Republic and the Netherlands) by coding the science content andinstructional approaches evidenced by video recordings of 439 representative Grade8 lessons across the five countries.
The study findings showed that science teaching in the United States exposedstudents to a wide variety of both pedagogical approaches and content, whilst theother countries reflected a common content-focused instructional approach (Rothet al. 2006). However, even within this common approach, there were significantvariations in the learning cultures of the different countries, with the CzechRepublic focused on whole class discussion, Australia and Japan on connectingideas through data and inquiry, and the Netherlands employing independenttextbook-centered reading and writing activities. The cultural differences meant thateach of the countries had a distinct approach to science teaching, providing studentswith different opportunities to learn science and different visions of what it meant tounderstand science.
2.3.4 Conclusions
The studies explored in Sect. 2.3 present evidence for the differing global, regionaland cultural influences on science curricula. Taken as a whole, these studies implythat whilst there is pressure on policymakers to globalize their intended curricula,there are also local cultural pressures working at the level of implementation andrealization that may provide some resistance to this globalizing effect.
16 2 A Review of the Existing Literature …

It is important to note that our literature review was limited to research on theglobalization of science curricula from 2010, with studies making use of TIMSSdata extending back to 1995. However, it has been suggested that 1995 may be toolate a starting point to detect changes in the globalization of curricula because bythis time globalization had already exerted a large influence on science curricula(Rutkowski and Rutkowski 2009). This needs to be taken into account whenconsidering the evidence for globalization in science curricula.
2.4 What Methods Have Been Used Previouslyto Investigate Globalization of Curricula?
The literature review identified a number of different methods that have been usedto investigate globalization of curricula. These methods were evaluated to reviewtheir appropriateness and robustness for different contexts and to inform the designof the methodology for this study. The methods used include both qualitative andquantitative approaches (Table 2.2).
Qualitative methods used to investigate the globalization of curricula include thedocumentary analysis of policy documents. For example, Klieger (2015) examinedthe effect of international surveys on science education and the science curriculumin Israel between 1996 and 2011 by analyzing curriculum and policy documentsand how these changed over the period. The study also compared these documentsto the requirements of the international surveys such as the TIMSS content domain.
Table 2.2 Methods used to investigate globalization of curricula
Study Method Data sourceKlieger (2015) Documentary analysis of education policy
documents and curriculum documentsIsraeli Ministry of Educationpolicy and curriculumdocuments
Tao et al.(2013)
Comparison of teaching and learning ofscience in Chinese and Australian Grade 6classrooms
Lesson observations, teacherinterviews, studentquestionnaires
Roth et al.(2006)
Comparison of science teaching in the USAand four high-performing jurisdictions
TIMSS 1999 video study
Cogan et al.(2001)
Median polish analysis TIMSS 1995 curriculum andteacher questionnaires
Rutkowski andRutkowski(2009)
Hierarchical cluster analysis and non-linearprincipal component analysis
TIMSS 1995 and 2003 (Grade8 mathematics item responsedata)
Kjaernsli andLie (2008)
Hierarchical cluster analysis TIMSS 2003 (science itemresponse data)
Zanini andBenton (2015)
Latent class analysis TIMSS 2011 Grade 8mathematics teacherquestionnaire
2.3 What Evidence is There for the Globalization … 17
This qualitative approach provided evidence that, over time, the Israeli sciencecurriculum was converging on the requirements of international surveys such asTIMSS.
Another study which contained a significant qualitative element to investigateglobalization compared the approaches used to teach science in Australian andChinese elementary schools (Tao et al. 2013). This study used a multiple com-parative case study approach in which three Australian schools and three Chineseschools were paired together for comparison based upon socioeconomic status(high, medium or low). The research consisted of analysis of curriculum documentsin each school, lesson observations, school tours, teacher interviews and studentquestionnaires. The methods used in this research enabled comparison of both theintended and implemented curriculum in Australian and Chinese schools, andobservation of the impact of culture on the curriculum in each school.
Other research methods used in the literature review studies identified werepredominantly quantitative in nature. One study compared aspects of the imple-mented science curricula in the United States, Australia, the Czech Republic, Japanand the Netherlands by reviewing eighth grade science lessons from the TIMSSvideo study (Roth et al. 2006). The content of the science lessons was coded and thecommonalities and differences between the content of the lessons in the UnitedStates and the four comparator countries were identified. This study concluded thateach country had a distinct approach to science teaching, providing students withdifferent opportunities to learn science and different visions of what it means tounderstand science. Additionally, the science lessons in each country varied interms of their organizational features and in the extent to which students wereactively involved in their science lessons.
Some studies made use of the responses to the TIMSS teacher and curriculumquestionnaires to investigate globalization of curricula. For example, Cogan et al.(2001) used TIMSS Grade 8 questionnaire responses to investigate similarities incountries’ science curricula. Detailed analysis of the questionnaire responsesenabled information about science content standards, textbook content and teachingtime for each science topic to be collated for each country. Matrices of the cur-riculum for each country were produced and median polish analysis conducted inorder to look for the effects of country by topic interactions.
Several studies made use of hierarchical cluster analysis to investigate thesimilarities and differences in curricula. This has been done for mathematics cur-ricula (Rutkowski and Rutkowski 2009) and science curricula (Kjaernsli and Lie2008). In mathematics, Rutkowski and Rutkowski (2009) investigated 16 countriesthat participated in TIMSS Grade 8 mathematics in both 1995 and 2003. Theyconducted an item analysis to establish the strengths and weaknesses in studentresponse patterns in each country and how this compares across countries.A hierarchical cluster analysis was then conducted for the 1995, 1999 and 2003TIMSS cycles to investigate the degree of alignment in curricula across differentcountries and how this changed between the three TIMSS cycles.
Kjaernsli and Lie (2008) used a similar approach with TIMSS 2003 science data.Probablity value (p-value) residuals were calculated, which measured how much
18 2 A Review of the Existing Literature …

better or worse students in each country performed on a particular science itemcompared to what would be expected based on the average student achievement ofthe country and the overall difficulty of the item. A hierarchical cluster analysis wasthen performed on each country to investigate how participating countries clustertogether based on similarities in the strengths and weaknesses of their students’responses to different types of answer.
In addition to hierarchical cluster analysis, latent class analysis has been used toidentify groups of countries with similar curricula. For example, Zanini and Benton(2015) investigated groupings of countries with similar mathematics curricula byconducting a latent class analysis using responses to TIMSS 2011 Grade 8 teacherquestionnaires. In this study, teacher responses to questions regarding whichmathematics topics were taught to their students were used in the latent classanalysis. The analysis found five distinct groupings of countries based on theteacher responses to the questionnaire, thereby providing evidence to suggest somedegree of alignment and harmonization in mathematics curricula.
The literature review suggests that there are a range of different methods that canbe successfully employed to investigate globalization of curricula. Each of theseapproaches has its own unique set of advantages and limitations. Among thequalitative studies, the documentary analysis of education policy and curriculumdocuments has a number of strengths. This approach enables a country’s curriculumchanges to be scrutinized in depth. The curriculum documents and associatedgovernment policy papers also often provide information about the explicit aims ofany changes or reforms to the curriculum and the rationale for them. This has theadvantage over some other approaches in that it can provide an insight into whychanges have been made to the curriculum and what the intended aims or aspira-tions of the changes were.
There are also disadvantages. Curriculum and policy documents can be timeconsuming to analyze and review, and this places a natural limit on the number ofcountries that can be examined given the constraints of time and budget. This typeof qualitative approach is thus better suited to studies that consider one or a smallnumber of countries as opposed to a large number of countries. Other disadvantagesinclude the difficulty of obtaining documents in a common language for somecountries, as well as the variation in the quality and extent of curriculum and policydocuments in different countries; this may make direct comparison betweencountries challenging. Furthermore, these documents often focus on the intendedcurriculum as opposed to the implemented curriculum, and so caution needs to beexercised when making inferences about a country’s implemented curriculum.
Other qualitative approaches identified in the literature review, such as lessonobservations and interviews with teachers and students, have a number of advan-tages when studying the possible globalization of science curricula. As well asproviding the opportunity to observe the implemented curriculum in schools asopposed to the intended curriculum, such studies often take the viewpoints ofseveral different actors in the school system (teachers and students) into account.However, this type of study can be time consuming and expensive, constraints thatmay influence the number of countries that can be considered. It is also difficult to
2.4 What Methods Have Been Used … 19

ensure that the data collected is truly representative when relying on a small sampleof observations and interviews.
Analyzing extracts from the TIMSS video study has a number of benefits,including the ability to observe science lessons in different countries and to code fordifferent pedagogic features in those countries. This approach also permits teachingmethods in different countries to be compared, and so enables aspects of the imple-mented science curriculum to be explored. However, the TIMSS video studywas onlyundertaken at one time point for science, and so it is thus difficult to use the data toinvestigate the globalization of science curricula over time or to estimate how rep-resentative the recorded lessons were of typical everyday science teaching. Indeed, itmust be acknowledged that teacher and pupil awareness that the lessons were beingrecorded may have affected the quality or nature of the lessons in some way.
The quantitative approaches identified in the literature review, such as clusteranalysis and latent class analysis, have a number of advantages but also somedisadvantages over the qualitative approaches outlined. Firstly, the quantitativeapproaches make it easier to include a greater number of countries in the investi-gation. This is an important consideration when analyzing the globalization ofscience curricula across the full cohort of countries taking part in an internationalsurvey such as TIMSS. These techniques have the potential to allow for morerobust large-scale investigations into the globalization of science curricula over timethan the qualitative approaches. Both cluster analysis and latent class analysis arewell suited to this type of analysis, and cluster analysis has the additional benefit ofbeing able to be conducted on a smaller dataset than latent class analysis.
Having considered the relative merits of each of the techniques identified in theliterature review, and the datasets and resources available for this research, themethods we have chosen to use and our rationale for using them are outlined inChap. 3 of the report.
References
Astiz, M., Wisemand, A., & Baker, D. (2002). Slouching towards decentralization: Consequencesof globalization for curricular control in national education systems. Comparative EducationReview, 46(1), 66–88.
Aubusson, P. (2011). An Australian science curriculum: Competition, advances and retreats.Australian Journal of Education, 55(3), 229–244.
Cogan, S., Wang, H., & Schmidt, W. (2001). Culturally specific patterns in the conceptualization ofthe school science curriculum: Insights from TIMSS. Studies in Science Education, 36, 105–133.
Cornali, F., & Tirocchi, S. (2012). Globalization, education, information and communicationtechnologies: What relationships and reciprocal influences? Procedia—Social and BehavioralSciences, 47, 2060–2069. Retrieved from http://www.sciencedirect.com/science/article/pii/S1877042812026857.
Kjaernsli, M., & Lie, S. (2008). Country profiles of scientific competencies in TIMSS 2003.Education Research and Evaluation, 14, 73–85.
Klieger, A. (2015). Between two science curricula: The influence of international surveys on theIsraeli science curriculum. The Curriculum Journal, 26(3), 404–424.
20 2 A Review of the Existing Literature …

OECD. (1996). The knowledge-based economy. Paris: Organisation for Economic Cooperationand Development. Retrieved from https://www.oecd.org/sti/sci-tech/1913021.pdf.
Roth, K. J., Druker, S. L., Garnier, H. E., Lemmens, M., Chen, C., Kawanaka, T., Rasmussen, D.,Trubacova, S., Okamoto, Y., Gonzales, P., Stigler, J., & Gallimore, R. (2006). Highlights fromthe TIMSS 1999 video study of eighth-grade science teaching (NCES 2006-17). USDepartment of Education, National Center for Education Statistics. Washington, DC: USGovernment Printing Office. Retrieved from https://nces.ed.gov/pubs2006/2006017.pdf.
Robitaille, R., Beaton, A., & Plomp, T. (Eds.). (2000). The impact of TIMSS on the teaching andlearning of mathematics and science. Vancouver: Pacific Educational Press.
Rutkowski, L., & Rutkowski, D. (2009). Trends in TIMSS responses over time: Evidence ofglobal forces in education? Educational Research and Evaluation, 15(2), 137–152.
Seller, S., & Lingard, B. (2014). The OECD and the expansion of PISA: New global modes ofgovernance in education. British Educational Research Journal, 40 doi: https://doi.org/10.1002/berj.3120. Retrieved from https://www.researchgate.net/publication/259535939_The_OECD_and_the_expansion_of_PISA_New_global_modes_of_governance_in_education.
Spring, J. (2008). Research on globalization and education. Review of Educational Research, 78(2), 330–363.
Tao, Y., Oliver, M., & Venville, G. (2013). A comparison of approaches to the teaching andlearning of science in Chinese and Australian elementary classrooms: Cultural andsocioeconomic complexities. Journal of Research in Science Teaching, 50(1), 33–61.
Weber, A. S. (2011). The role of education in knowledge economies in developing countries.Procedia—Social and Behavioral Sciences, 15, 2589–2594. Retrieved from http://www.sciencedirect.com/science/article/pii/S1877042811006975.
Zanini, N., & Benton, T. (2015). The roles of teaching styles and curriculum in mathematicsachievement: Analysis of TIMSS 2011. Research Matters, 20, 35–44.
Open Access This chapter is licensed under the terms of the Creative CommonsAttribution-NonCommercial 4.0 International License (https://creativecommons.org/licenses/by-nc/4.0/), which permits any noncommercial use, sharing, adaptation, distribution and reproductionin any medium or format, as long as you give appropriate credit to the original author(s) and thesource, provide a link to the Creative Commons license and indicate if changes were made.The images or other third party material in this chapters are included in the chapter’s Creative
Commons license, unless indicated otherwise in the credit line to tha material. If material is notincluded in the chapter’s Creative Commons license and your intended use is not permitted bystatutory regulation or exceeds the permitted use, you will need to obtain permission directly fromthe copyright holder.
References 21

Chapter 3Methodology: Examiningthe Globalization of Science CurriculaUsing TIMSS
Abstract Twenty years of collected TIMSS data reveals interesting insights intothe globalization of science curricula. To answer the research questions, threedifferent methods were used to analyze the TIMSS dataset. First, changes incountries’ intended science curricula were captured and coded over the course ofthree TIMSS cycles (1999, 2007 and 2015 for Grade 8, and 2003, 2007 and 2015for Grade 4). Changes were identified using countries’ responses to the TIMSScurriculum questionnaires. This approach tracks changes in national science cur-ricula over time. Second, cluster and discriminant analyses of the curriculumquestionnaire data were used to determine potential convergence of curricula;countries may be clustered into groups on the basis of the topics included or notincluded in their intended science curricula. Third, the TIMSS encyclopedias andTIMSS teacher questionnaires provide detailed information on additional featuresof the implemented science curricula, such as the mean time spent teaching sciencein each country, or the percentage of students taught the TIMSS science topics.Such information was carefully analyzed for a subsample of countries. However,inconsistencies in the way this information was collected and presented acrossdifferent TIMSS cycles made comparisons across countries between cycleschallenging. As each of the three methods has its advantages and limitations,investigating the three research questions from different angles and with different,yet complementary techniques offers the most comprehensive analysis of theavailable TIMSS data.
Keywords Cluster analysis � Curriculum coding � Curriculum convergenceDiscriminant analysis � International large-scale assessment � Science educationTrends in Mathematics and Science Study (TIMSS) � TIMSS curriculumquestionnaire
A review of the existing literature identified several methods have been used pre-viously to investigate globalization of curricula The research methodology we usedto investigate our three research questions can be separated into three distinctstrands.
© International Association for the Evaluation of Educational Achievement (IEA) 2018O. Stacey et al., The Globalization of Science Curricula, IEA Researchfor Education 3, https://doi.org/10.1007/978-3-319-71532-2_3
23

(1) We coded responses to the TIMSS science curriculum questionnaire data, inorder to track changes in national science curricula over time.
(2) We undertook cluster and discriminant analyses, which grouped countries intodistinct groups on the basis of the TIMSS science topics included in theirintended science curricula. (The reasons and rationale for using cluster anddiscriminant analyses over other statistical techniques such as latent classanalysis will be discussed later in the chapter.)
(3) We coded additional science curriculum features for a smaller sample ofcountries.
All three methods made use of data collected by the TIMSS curriculum ques-tionnaire, which provides information on which TIMSS science topics are includedin the intended science curricula of participating countries. In each case, we elab-orate further on the limitations of the data sources and methods.
3.1 Coding of Curriculum Questionnaire Data
The TIMSS curriculum questionnaires provide a rich array of data on the sciencecurricula and science teaching in participating countries at Grades 4 (ages 9–10)and 8 (ages 13–14). One section of the curriculum questionnaires pertains toscience topics covered at each particular grade (either Grade 4 or 8). The question-naire asks respondents (typically representatives from the Ministry of Education orequivalent) to indicate whether each TIMSS science topic is taught to “all or almostall students” in the grade, “only the more able students”, or whether it is “not includedin the curriculum” through to that grade (see Fig. 3.1 for an example from thequestionnaire).
The responses to the questionnaires reveal the TIMSS science topics included ina country’s science curriculum for a particular grade in a particular year. To addressour first research question on whether there have been changes in countries’intended science curricula since 1999, individual countries’ responses to thecurriculum questionnaires between 1999 and 2015 were coded.
By comparing individual countries’ responses to the curriculum questionnairebetween different TIMSS cycles, changes in the science topics included in coun-tries’ intended science curricula over time can be detected.
Because the TIMSS curriculum questionnaire was first administered in 1999 forGrade 8 and 2003 for Grade 4, it was not feasible to code responses from everycycle of TIMSS; TIMSS 1999 was used as the baseline for Grade 8 and TIMSS2003 as the baseline for Grade 4 (Table 3.1). For both grades, TIMSS 2015 was themost recent time point that could be considered. In addition to the earliest and mostrecent TIMSS cycles with available curriculum questionnaires, an intermediateTIMSS cycle (2007) was also included in this coding exercise. The inclusion of anintermediate cycle allowed changes in a country’s science curriculum to be detectedat more than one time point. This is important as countries may have changed the
24 3 Methodology: Examining the Globalization of Science …

Fig. 3.1 Extract from curriculum questionnaire for Grade 8 science TIMSS 2015. Source TIMSS2015 Grade 8 curriculum questionnaire © 2015 International Association for the Evaluation ofEducational Achievement (IEA). Publisher: TIMSS & PIRLS International Study Center, LynchSchool of Education, Boston College
3.1 Coding of Curriculum Questionnaire Data 25

topics in their science curriculum more than once between the baseline and 2015cycles. If a science topic was added between 1999 and 2007 and then removedbetween 2007 and 2015, the change would not be detected if only the baseline and2015 cycles were considered.
The science topics included in the curriculum questionnaire varied slightly foreach cycle of TIMSS. However, in order to map changes in the participatingcountries’ curricula consistently across the TIMSS cycles, it was necessary toconsider the same set of science topics in each cycle. Therefore, we first mapped thescience topics across the TIMSS cycles to identify equivalent topics in thecurriculum questionnaires of each TIMSS cycle.
We used the TIMSS 2015 science topics as the basis for this mapping exercise,matching science topics in the older TIMSS curriculum questionnaires to the 2015TIMSS science topics. In some cases, there was a direct match in science topicsacross cycles, while, in other cases, there was no match. We found there werescience topics in the TIMSS 2015 curriculum questionnaire that were not includedin earlier questionnaires and, similarly, there were topics from earlier cycles thatwere not included in the 2015 curriculum questionnaire. As an illustration, the 1999questionnaires included topics on the nature of science and scientific inquiry, butthere were no equivalent science topics in the 2015 questionnaire. Only sciencetopics that could be matched across all three TIMSS cycles were included in thecoding exercise. For Grade 8 there were 20 science topics that mapped across thethree TIMSS cycles and for Grade 4 there were 21 such topics (for a full list of thesetopics and the results of this mapping, see Chap. 4, Sect. 4.1.5).
To identify the nature of the curriculum change, we developed a codingframework (Table 3.2).
Table 3.1 TIMSS cycles used in the analysis
Grade TIMSS cycles used
4 2003, 2007, 20158 1999, 2007, 2015
Table 3.2 Codes used in the curriculum mapping exercise
Code Description of code
−2 Science topic has been removed from the curriculum at that grade−1 Reduced emphasis on the science topic in the curriculum at that grade (topic was
previously taught to most or all students in grade, but is now only taught to the moreable students in the grade)
0 No change to science topic1 Greater emphasis on the science topic in the curriculum at that grade (topic was
previously taught only to more able at that grade but is now taught to most or allstudents in the grade)
2 Science topic has been introduced to the curriculum at that grade
26 3 Methodology: Examining the Globalization of Science …

In order to complete the coding exercise, the responses of individual countries tothe curriculum questionnaire for each TIMSS cycle considered were obtained fromthe IEA data repository (data and documentation files from completed IEA stud-ies are freely available for research purposes at http://www.iea.nl/data). For eachscience topic that mapped across the three TIMSS cycles, a country’s response towhether the science topic was intended to be taught to “all or most students”, “onlythe more able students”, or was “not included in the curriculum” through to thatgrade was compared between cycles. For example, in Iran in 2003 at Grade 4, thecurriculum questionnaire response to the life sciences topic “the characteristics ofliving things and the major groups of living things” indicated that the topic wastaught to “all or most students”. However, in 2007, the curriculum questionnaireresponse for this topic indicated that it was “not included in the curriculum throughGrade 4”. Therefore between 2003 and 2007 this topic was coded as a −2 (sciencetopic removed from the curriculum at that grade) for Iran. This process was repeatedfor each country that had participated in at least two of the TIMSS cyclesunder consideration. Pairwise comparisons were made, for example at Grade 4,comparing the curriculum questionnaire responses in 2003–2007, 2007–2015, and2003–2015.
This method addresses our first research question concerning whether there havebeen changes in countries’ intended science curricula, as well as providing infor-mation about the nature of these changes; for example, whether countries wereincreasing the breadth of their curriculum by adding additional topics. This approachalso partially addresses our second research question about whether science curriculaare becoming increasingly similar across countries over time, as the coding indi-cates whether these changes are leading to an increased convergence in the intendedscience curricula across countries over time. The analysis also provides some evidencefor our third research question on the potential existence of an international core sciencecurriculum, by identifying science topics that are included in the intended curricula ofall or the majority of countries participating in TIMSS.
3.2 Cluster Analysis and Discriminant Analysis
Our second research question asked whether science curricula taught in differentcountries have been becoming more similar over the last 20 years. We investigatedan array of complementary statistical techniques, and opted for a cluster analysisfollowed by a discriminant analysis.
We applied the cluster analysis to the first TIMSS cycle (1999 for Grade 8 and2003 for Grade 4) in order to identify clusters of countries that were similar in termsof their intended science curricula. The cluster analysis was conducted on countries’responses to the section of the curriculum questionnaire detailing which sciencetopics were included in the intended curriculum at each grade. Only the sciencetopics which could be mapped across all three TIMSS cycles were included in theanalysis to ensure comparability. The second step, the discriminant analysis, was
3.1 Coding of Curriculum Questionnaire Data 27

again performed on the first cycle of TIMSS, in order to produce a model that wasthen used to classify countries in the following TIMSS cycles.
The advantage of this two-step technique over a simple cluster analysis repeatedon the three cycles of TIMSS considered is that, while the cluster analysis classifiescountries based on the specific information of what is taught in each of the threecycles using the exact same model every time, the discriminant analysis uses acompletely separate algorithm to classify countries in each of the three cycles.
In this investigation, the comparison of clusters of countries over time is notmeaningful as the clusters will have been created using different criteria each time.Furthermore, the set of countries participating in each cycle is not constant, withnew countries joining and some countries which participated in the early TIMSScycles leaving. This issue is partially addressed by discriminant analysis. This isbecause new entrants to the more recent TIMSS cycles do not have an effect on theclustering rule, which is fixed. As a result, new entrants are simply classified asbelonging to one cluster group based on their responses to the TIMSS curriculumquestionnaire.
That said, the clustering algorithm itself is influenced by the specific set ofcountries that were included in the first TIMSS cycle. A straightforward solution tothis problem would be to restrict the analysis to countries that have participated inall three TIMSS cycles. We chose not to pursue this approach as we considered theadvantages to be more than offset by the disadvantages.
One of the main drawbacks to this approach is that it would narrow the analysisto a relatively small set of countries (21 for Grade 8 and 18 for Grade 4) and, as aconsequence, would limit the conclusions we would be able to make from theanalysis. This, in turn, would give a very partial response to our research question,as we would be testing the hypothesis of convergence in science curricula on asubsample of countries. What is going on in this specific subsample might be notrepresentative of what is happening in the overall population. With this caveat inmind, we chose to prioritize a more complete analysis and exploit all the infor-mation available by running our model on the full sample.
A limitation of our approach is that the number of clusters is identified using thefirst TIMSS cycle and is therefore fixed for the following two cycles. If sciencecurricula are becoming more dissimilar, this would result in a higher numberof clusters in more recent TIMSS cycles. We would not be able to detect thisphenomenon using our approach. However, given the relative stability of sciencecurricula, this event is unlikely. To check this assumption, when we conductedthree separate cluster analyses on the three cycles of TIMSS, the ideal number ofclusters identified by the algorithm was always the same (two in each case).1
1The results of the three separate cluster analyses are not reported due to concerns regarding themisinterpretation of the outcome. Nevertheless, the finding that the number of groups identified bythe algorithm is constant in all cycles is relevant in establishing that the science curricula ofcountries are not diverging to such an extent to justify the identification of an increasing number ofclusters over time.
28 3 Methodology: Examining the Globalization of Science …

Having outlined our statistical approach and the rationale behind it we now givea more thorough account of the statistical techniques used in this investigation.
Cluster analysis is a statistical technique that allows the grouping of a set ofobservations according to certain characteristics, in such a way that observations inthe same cluster are more similar to each other than to observations in other groups.In the context of our investigation, the observations that are clustered are countries,and the variables used to group them are the responses given to the TIMSScurriculum questionnaire items on the science topics that are included in countries’intended science curricula. Our analysis aims to investigate the existence of con-vergence in science curricula, with convergence signaled by the tendency of agroup to expand at the expense of others.
When running the analysis on the TIMSS dataset we chose to implement atwo-step cluster analysis. The first step of this procedure consists of pre-clusteringthe records into small sub-clusters that are then consolidated into a smaller numberof groups in the second step. The advantage of this methodology over otherclustering algorithms is that, when the number of groups is unknown, the algorithmautomatically returns the optimal number of clusters based on the Bayesian infor-mation criterion (BIC).2 Observations are grouped together based on a distancemeasure that, in this case, reflects how different countries are from each other interms of science topics covered in their curricula. In order to cluster the observa-tions, we adopt the log-likelihood criterion that is appropriate when groupingobservations using continuous as well as categorical variables. This distancemeasure works best when all variables are independent and categorical variableshave a multinomial distribution.3 The log-likelihood is a probability-based distance.The distance between two clusters is related to the decrease in log-likelihood asthey are combined.4
Our original intention was to perform a latent class analysis on the data. Weperformed a cluster analysis followed by a discriminant analysis due to the reducedsize of the sample. Given the large number of parameters estimated, latent classanalysis requires a considerable number of observations. (In statistics, a modelcannot be identified unless the sample size is one more than the number ofpredictors and, as a rule of thumb, we need around ten observations per parameterto estimate a model with reasonable precision.)
2The Bayesian information criterion (BIC) is used to select between different models based on howwell they fit the data and the number of parameters they use. The BIC is an increasing function ofboth the number of parameters (the BIC penalizes the complexity of the model) and the errorvariance (a measure of how well the model fits the data). The algorithm chooses the model with thelowest BIC that implies either fewer explanatory variables, better fit, or both.3In practice, these conditions are rarely satisfied, but the algorithm is thought to behave reasonablywell when the assumptions are not met.4The goal of the clustering algorithm is to maximize the probability (or likelihood) of obtaining thefigures observed in the dataset, given the clusters that are identified at the final stage. Hence, giventhat our aim is to maximize the likelihood function, the bigger the drop that results from mergingtwo clusters, the more dissimilar the observations therein contained.
3.2 Cluster Analysis and Discriminant Analysis 29

Previous studies which have used TIMSS data to categorize countries’ curriculainto particular groups using latent class analysis, such as Zanini and Benton (2015),made use of teacher questionnaire responses as opposed to curriculum question-naire responses. There are a far greater number of observations in the teacherquestionnaire than there are in the curriculum questionnaire, making the latent classanalysis approach viable for studies using teacher questionnaire data. It is notpossible to use latent class analysis in this study as there is only one observationavailable for each participating country, and this study uses the curriculum ques-tionnaire as opposed to the teacher questionnaire because of time and resourceconstraints. That said, the purpose of cluster analysis is the same as latent classanalysis but, instead of using a model to group observations, it employs distancemeasures that are less demanding in terms of number of observations needed.
Discriminant analysis is, in a sense, used as a tool to reverse what has beenimplemented with cluster analysis. It is a statistical technique used to determinewhich variables discriminate between two or more groups (Ayinla and Adekunle2015). This procedure was performed on the groups of countries that had beenpreviously identified by the cluster analysis. It created a model which identified themost important science topics in determining the grouping of countries.
To illustrate how this works in practice, if a particular science topic, for example“forces”, is taught in all countries in group A and in none of the countries in groupB, given group A and B,5 the algorithm that performs discriminant analysis is ableto detect that this science topic is an important element of discrimination betweenthe two groups. The algorithm infers that countries teaching that specific sciencetopic will be highly likely to belong to group A, while countries that do not teachthe topic will be highly likely to belong to group B.
In reality, the algorithm performing discriminant analysis is slightly morecomplex, as it takes into account all the science topics at once and, for each of them,estimates a coefficient that reflects the probability of belonging to a given groupbased on the answer given to that particular question (for example, whether studentsat that grade are expected to be taught that science topic or not). When all thecoefficients are fitted in a linear model, for each observation (country), we are ableto predict the group identity based on the answers given in the curriculumquestionnaire.
The model can then be used to predict the clustering of countries in subsequentyears. If convergence of science curricula has occurred in the last 20 years, weshould observe a tendency for countries to concentrate in a single group.
As indicated above, this approach has advantages compared to cluster analysisalone but it is not immune from criticism. Firstly, the approach enables the iden-tification of convergence (when one group of countries grows over time at theexpense of others). However, as already mentioned, it does not enable the detectionof divergence. This shortfall arises because, by construction, the number of clustersin cycles following the baseline year will be equal to or lower than the number of
5In this case the two groups were identified by means of cluster analysis.
30 3 Methodology: Examining the Globalization of Science …

clusters detected in that baseline year. We have already provided explanations forwhy this is not a major concern in our specific dataset. Moreover, we should pointout that the scope of this study is to assess whether convergence in science curriculahas occurred rather than divergence.
A second concern is that, although this procedure allows the detection ofwhether science curricula are getting more similar over time, it also focuses onfeatures that made the science curricula of countries different in the first place. Thismeans that the science topics that are particularly important in determining thegroup a country belongs to in the baseline year will keep on playing a primary rolein subsequent cycles. Additionally, science topics that do not discriminate stronglybetween groups in the baseline cycle will only play a marginal role in the classi-fication of countries in subsequent years.
Continuing with the earlier example, if, in the baseline year, all countries ingroup A are teaching a given science topic and no countries in group B are teachingthat topic, but, in the second cycle, all countries include the science topic in theircurriculum, the algorithm would, in this case, predict that all observations in thesecond cycle belong to group A. In light of this result, we could be tempted toconclude that curricula are converging but this might not be the case. If there isanother science topic in the questionnaire and this topic is taught by all countries inthe first cycle, the algorithm would completely ignore this item as it is not able todiscriminate between observations (countries). However, if in the following cycle,some countries stop teaching that topic so that part of the sample has it in theirscience curricula and part of the sample does not, the model will not be able toexploit this information because the topic is not included in the predictive model.6
In this example, one group grows at the expense of the other, but convergence is notsupported. The curricula are becoming more similar in some dimensions, but arediverging in other aspects that our model is not taking into account.
This is only a hypothetical example and, in reality, the situation is more com-plicated as the algorithm considers multiple science topics at a time. Moreover, it isunlikely to come across science topics with zero predictive power.7 More often wewill have science topics with low predictive power (i.e. not able to discriminatebetween groups with high precision). In this case, the information will not becompletely disregarded but the algorithm will instead attach a low coefficient to thescience topic. As a consequence the answer given to the question related to thatscience topic will affect the probability of belonging to a certain group only by avery small degree.
In order to resolve the issue related to the dependence of our results on the pre-dictive power of science topics in the initial cycle of the questionnaire, the sameprocesswas repeated in reverse. Thismeans that, starting from themost recent TIMSS
6We could consider this topic to be included in the model with a zero coefficient, reflecting the factthat its predictive power was null in the first cycle.7This occurs if, as in our example, all countries in the sample give the same answer to a certainquestion.
3.2 Cluster Analysis and Discriminant Analysis 31

cycle available (2015 for both Grade 4 and Grade 8), the data were clustered and adiscriminant analysis performed based on the resulting groups. Using the model thatemerges from the discriminant analysis, countries were classified according to theanswers given in earlier cycles of the questionnaire. This reverse approachwas used toassess differences in curricula based on science topics that were homogeneouslytaught (or not taught) in the first TIMSS cycle and hence have diverged.
Using the previous example,with this newapproach, the algorithmwill now clustercountries based on the answers given in the final cycle of the questionnaire. A sciencetopic that did not discriminate in thefirst cycle (as it was taught by all countries) is nowan important predictor for clustering observations in the final cycle, and the sciencetopic that was a good discriminant in first place, is no longer relevant. Applying thereverse approach to this case, the cluster analysis conducted on the final cycle willgroup observations into two separate groups while assigning all observations to asingle group in the initial cycle (because all countries gave the same answer to the itemin the earlier cycle). Given that one of the clusters was bigger in the first cycle than inthe end-point questionnaire, we can conclude that curricula have diverged along thespecific dimension (science topic) we are analyzing. The interpretation will be com-plicated by the fact that in reality ourmodel considersmultiple science topics at a time.
It is important to note that discriminant analysis is a linear technique and we haveapplied it to a dataset in which we have categorical variables. This approach is notinappropriate provided the underlying assumptions are understood. The challenge ofapplying a linear technique to categorical variables is that, for each item, the modelwill treat the categories as continuous variables andwill return a single coefficient thathas the same interpretation as the beta in a linear regression.8 Given that our variablesaremeasured on a three-point scale (ranging from 1 to 3), for a given science topic, theprobability of belonging to a given groupwill be two times larger/smaller for a countrywith a value of 2 (topic taught to only the more able students) compared to a countrywith a value of 1 (topic taught to all ormost students). Similarly, given the linear natureof the coefficients, the probability of belonging to a given group will be three timeslarger/smaller for a country with a value of 3 (topic not taught in a given grade)compared to a country with a value of 1 (topic taught to all or most students). This is alimitation of our analysis but, as long aswe arewilling to assume that individuals in themiddle of the scale (i.e. teaching to the more able students only) are equally differentfrom individuals at the two extremes (teaching to all or teaching to nobody), then theuse of a linear model is appropriate. For our purpose the assumption is not unrea-sonable considering the fact that the limited amount of data prevents us from esti-mating a non-linear model.9
8In a linear regression the beta coefficient represents the difference in the predicted value of Y foreach one-unit difference in a certain variable, keeping all other variables constant.9Here we encounter a similar problem to the one we have already discussed for latent classanalysis. A non-linear model (such as latent class analysis) would require the estimation of acoefficient for each of the values taken by each categorical variable. In our case, for example atGrade 8, we have 20 variables with three possible outcomes each, implying 40 coeffients toestimate. This is impossible given the sample size.
32 3 Methodology: Examining the Globalization of Science …
From this short description of our statistical analysis it is evident that assessingconvergence in science curricula is not a straightforward task and that differenttechniques are likely to result in different outcomes. Given that each approach hasadvantages and disadvantages, investigating the research question from differentangles and with different yet complementary techniques offers the most robustsolution.
Finally, readers should be aware that cluster analysis does not involve hypothesistesting and the computation of significance levels. As a result, the appropriateness ofa solution can only be assessed by the researcher. This should be evaluated throughthe critical observation of the elements composing the clusters and the difference inthe pattern of answers given by countries belonging to different groups.
3.3 Additional Analysis of a Sample of Countries
Both the coding of curriculum questionnaires and statistical methods outlined inSects. 3.1 and 3.2 make exclusive use of responses from the TIMSS curriculumquestionnaire. This allows a rigorous comparison of the intended science curriculaof countries participating in TIMSS over time. This dataset, however, gives littleinformation about the implemented science curriculum of a country. To comple-ment these two earlier approaches, a number of other features of the implementedscience curriculum were captured for a selection of countries that have participatedin at least two of the TIMSS cycles considered in this report. Changes in thesefeatures were recorded to investigate whether there is convergence over time.
We collected information about various aspects of the implemented sciencecurricula, such as the mean time spent teaching science in each country, thepercentage of students taught the TIMSS science topics, the organization andstructuring of the science curriculum, and science assessment. This informationcame from the TIMSS encyclopedias and from the TIMSS teacher questionnairesfor the selected countries (Martin et al. 2000, 2004, 2008; Mullis et al. 2016). Forthis part of our study, we selected 15 countries at Grade 4 (Table 3.3) and 16countries at Grade 8 (Table 3.4) on the basis of a number of different criteria.Firstly, the majority of these countries have appeared in all three TIMSS cyclesunder study at both Grade 4 and 8. The countries that have not, such as Qatar, haveappeared in at least two cycles and were included to widen the geographic distri-bution and achievement profile of the sample. In a few cases, a country thatparticipated in all three TIMSS cycles was not included. This was either because thecountry appeared in three cycles for one grade but not the other, or because therewas no data available from the curriculum questionnaire on the topics included inthe intended science curriculum in a particular grade. This was the case, forexample, for the Netherlands. Such countries were discounted from the selection.Countries which participated in only one relevant TIMSS cycle were also excludedfrom this analysis, thus ensuring that the amount of information that can be collectedon each country was maximized.
3.2 Cluster Analysis and Discriminant Analysis 33

In our selection of countries, we endeavored to reflect the geographic scope ofTIMSS and also represent the full range of achievement on the TIMSS assessment.This means that the sample includes high achievers such as Singapore and Japan,more moderate achievers such as Italy and New Zealand, and countries that haveperformed less well, such as Morocco, Qatar and Iran. Furthermore, our sampleincludes Middle Eastern countries, East Asian countries, European countries,southern hemisphere nations and African nations. The selection also includes someless developed countries, such as Iran, and takes into account the outcomes of thecluster analysis by including countries from each cluster identified by the analysis.
The same 15 countries were selected for both Grade 4 and Grade 8 as thisrepresented the most efficient strategy for collecting information on additionalaspects of science curricula, such as time allocated to science and percentage ofstudents taught the TIMSS science topics. For Grade 8, Israel was included as asixteenth country as the literature review identified it as a country that had madeextensive changes to its science curriculum as a result of participation in TIMSS(Klieger 2015). As a consequence, exploring the science curriculum in Israel seemshighly relevant to this study.
Table 3.3 Countries included in additional analysis at Grade 4
Country Average TIMSSscience score in 2003
Average TIMSSscience score in 2007
Average TIMSSscience score in 2015
Morocco 304 (6.7) 297 (5.9) 352 (4.7)Iran 414 (4.1) 436 (4.3) 421 (4.0)Qatar N/A 294 (2.6) 436 (4.1)NewZealand
520 (2.5) 504 (2.6) 506 (2.7)
Italy 516 (3.8) 535 (3.2) 516 (2.6)Australia 521 (4.2) 527 (3.3) 524 (2.9)Lithuania 512 (2.6) 514 (2.4) 528 (2.5)England 540 (3.6) 542 (2.9) 536 (2.4)Hungary 530 (3.0) 536 (3.3) 542 (3.3)Slovenia 490 (2.5) 518 (1.9) 543 (2.4)UnitedStates
536 (2.5) 539 (2.7) 546 (2.2)
ChineseTaipei
551 (1.7) 557 (2.0) 555 (1.8)
Hong Kong 542 (3.1) 554 (3.5) 557 (2.9)Japan 543 (1.5) 548 (2.1) 569 (1.8)Singapore 565 (5.5) 587 (4.1) 590 (3.7)
Note Standard errors are provided in brackets after the average achievement scores. N/A notapplicable
34 3 Methodology: Examining the Globalization of Science …

3.4 Methodological Limitations
There are a number of inherent limitations in our methodological approach andthese should be taken into account when interpreting the results.
Firstly, the primary data source used for coding changes in the intended sciencecurriculum, and for the cluster analysis, is responses to the section of the curriculumquestionnaire on science topics intended to be taught. We have assumed that thesequestionnaires have been completed accurately but have no way of testing ourassumption. There are, however, likely to be sources of error in the completion of thequestionnaires. For example, the science topics in each country’s curriculum are unlikelyto correspond word for word to the science topics listed in the TIMSS curriculumquestionnaire. Therefore, it is likely that there is some degree of subjectivity in how thecurriculum questionnaires are interpreted and completed in each country.
Secondly, we have assumed that the curriculum questionnaire responses for eachcountry accurately reflect the intended curriculum for the whole country. Whilst thisis likely to be the case for countries with highly prescribed statutory national sciencecurricula, such as England, this may not be the case in all countries, such as thosewith a federal structure like Germany, or those with a decentralized curriculum.
Table 3.4 Countries included in additional analysis at Grade 8
Country Average TIMSSscience score in 1999
Average TIMSSscience score in 2007
Average TIMSSscience score in 2015
Morocco 323 (4.3) 402 (2.9) 393 (2.5)Iran 448 (3.8) 459 (3.6) 456 (4.0)Qatar N/A 319 (1.7) 457 (3.0)Italy 493 (3.9) 495 (2.8) 499 (2.4)Israel 468 (4.9) 468 (4.3) 507 (3.9)Australia 540 (4.4) 515 (3.6) 512 (2.7)NewZealand
510 (4.9) N/A 513 (3.1)
Lithuania 488 (4.1) 519 (2.5) 519 (2.8)Hungary 552 (3.7) 539 (2.9) 527 (3.4)UnitedStates
515 (4.6) 520 (2.9) 530 (2.8)
England 538 (4.8) 542 (4.5) 537 (3.8)Hong Kong 530 (3.7) 530 (4.9) 546 (3.9)Slovenia 533 (3.2) 538 (2.2) 551 (2.4)ChineseTaipei
569 (4.4) 561 (3.7) 569 (2.1)
Japan 550 (2.2) 554 (1.9) 571 (1.8)Singapore 568 (8.0) 567 (4.4) 597 (3.2)
Note Standard errors are provided in brackets after the average achievement scores. N/A notapplicable
3.4 Methodological Limitations 35

A third limitation is that coding of changes in the curriculum approach can onlybe used in countries which have taken part in at least two of the TIMSS cyclesconsidered. This excludes countries that only started participating in TIMSS inmore recent cycles and also excludes the many developing countries that do notparticipate at all. This means that developed countries are over-represented in thisanalysis, which limits the generalizability of the conclusions.
Fourthly, the TIMSS science topics included in the curriculum questionnaires ineach cycle change slightly. As noted earlier, in the TIMSS 1999 curriculumquestionnaire there was a section on science topics based on the nature of scienceand scientific inquiry skills. There is no equivalent section in the 2015 curriculumquestionnaire. It is consequently not possible to code for changes to these areas ofthe curriculum and it is likely that, as a result, our coding will not capture all thechanges in the content and intended science curricula of countries over time.
Another limitation is that some of the science topics included in the curriculumquestionnaire are likely to be covered in subjects other than science in somecountries. For example, in England, some of the Earth science topics are taught ingeography. Another limitation is that the time frame considered differs for Grade 4and Grade 8. Ideally the same time frame would have been used for both grades, butthis was not possible as TIMSS was not administered at Grade 4 in 1999. As aresult, and to maximize the time frames explored in the study, different startingpoints were used for Grades 4 and 8.
There is the further challenge that in each TIMSS cycle there are differentnumbers of participating countries, with some countries dropping out and newcountries entering. This makes direct comparisons between different cycles lessstraightforward and the interpretation of results more complex. Furthermore, thescope of this study does not allow us to explore the reasons why countries leave theTIMSS study or choose to enter it.
In addition, by using TIMSS curriculum questionnaire data, this study isrestricted to considering globalization in science curricula from 1999 to 2015 forGrade 8 and 2003–2015 for Grade 4. This means that changes in science curriculaprior to 1999 that may have led to increased global alignment in science curriculaacross countries will be missed. Other studies investigating globalization ofcurricula have encountered similar issues. Rutkowski and Rutkowski (2009) sug-gested that using data from the 1990s as a baseline to measure curricular change andglobal alignment may be too late to detect globalization in national curricula. Theyargued that globalization was already exerting an influence on curricula well beforethis point in time.
Despite these limitations we consider the curriculum questionnaire to be a veryuseful and rich source of information on the intended curriculum in countriesparticipating in TIMSS. These datasets represent the largest comparative body ofevidence on science curricula recorded across both a wide range of countries andover an extended time period. By combining analyses with in-depth examination ofthe features of the science curriculum for a subset of countries from other TIMSSsources, we also consider some aspects of countries’ implemented science curricula,uncovering additional evidence for or against convergence over time.
36 3 Methodology: Examining the Globalization of Science …

References
Alayande, S., & Adekunle, B. (2015). An overview and application of discriminant analysis indata analysis. IOSR Journal of Mathematics, 11(1), 12–15. Retrieved from http://www.iosrjournals.org/iosr-jm/papers/Vol11-issue1/Version-5/B011151215.pdf.
Klieger, A. (2015). Between two science curricula: The influence of international surveys on theIsraeli science curriculum. The Curriculum Journal, 26(3), 404–424.
Martin, M. O., Mullis, I. V. S., Gonzalez, E. J., Gregory, K. D., Smith, T. A., Chrostowski, S. J.,et al. (2000). TIMSS 1999 international science report, findings from IEA’s repeat of the thirdinternational mathematics and science study at the eighth grade. Chestnut Hill, Massachusetts:TIMSS & PIRLS International Study Center, Boston College. Retrieved from https://timssandpirls.bc.edu/timss1999i/pdf/T99i_Sci_All.pdf.
Martin, M. O., Mullis, I. V. S., Gonzalez, E. J., & Chrostowski, S. J. (2004). Findings from IEA’strends in international mathematics and science study at the fourth and eighth grades.Chestnut Hill, Massachusetts: TIMSS & PIRLS International Study Center, Boston College.Retrieved from https://timss.bc.edu/timss2003i/scienceD.html.
Martin, M. O., Mullis, I. V. S., Foy, P., Olson, J. F., Erberber, E., Preuschoff, C., et al. (2008).TIMSS 2007 international science report. Chestnut Hill, Massachusetts: TIMSS & PIRLSInternational Study Center, Boston College. Retrieved from https://timss.bc.edu/TIMSS2007/PDF/TIMSS2007_InternationalScienceReport.pdf.
Mullis, I. V. S., Martin, M. O., Foy, P., & Hooper, M. (2016). TIMSS 2015 international results inscience. Chestnut Hill, Massachusetts: TIMSS & PIRLS International Study Center, BostonCollege. Retrieved from http://timssandpirls.bc.edu/timss2015/international-results/.
Rutkowski, L., & Rutkowski, D. (2009). Trends in TIMSS responses over time: Evidence ofglobal forces in education? Educational Research and Evaluation, 15(2), 137–152.
Zanini, N., & Benton, T. (2015). The roles of teaching styles and curriculum in mathematicsachievement: Analysis of TIMSS 2011. Research Matters, 20, 35–44.
Open Access This chapter is licensed under the terms of the Creative CommonsAttribution-NonCommercial 4.0 International License (https://creativecommons.org/licenses/by-nc/4.0/), which permits any noncommercial use, sharing, adaptation, distribution and reproductionin any medium or format, as long as you give appropriate credit to the original author(s) and thesource, provide a link to the Creative Commons license and indicate if changes were made.The images or other third party material in this chapters are included in the chapter’s Creative
Commons license, unless indicated otherwise in the credit line to tha material. If material is notincluded in the chapter’s Creative Commons license and your intended use is not permitted bystatutory regulation or exceeds the permitted use, you will need to obtain permission directly fromthe copyright holder.
References 37

Chapter 4Results: Evidence for the Globalizationof Science Curricula from TIMSS
Abstract In TIMSS, participating education systems are asked in the curriculumquestionnaire which TIMSS science topics are included in their intended sciencecurricula. By coding the changes in countries’ responses, some measure of thechanges in national science curricula between 1999 and 2015 (for Grade 8) andbetween 2003 and 2015 (for Grade 4) may be determined. Countries can also becategorized by how stable or changeable their curriculum is on the basis of thenumber of changes they have made to their curriculum, the average number ofcurriculum changes at Grades 4 and 8 for each TIMSS cycle and the topics commonto the vast majority of participating countries’ intended science curricula. Theanalysis found there was considerable variation among countries in terms of thenumber and nature of changes they made to their science curriculum between 1999(2003 for Grade 4) and 2015. Cluster analysis and discriminant analysis revealedwhich science topics were most discriminating in terms of predicting countryclusters. For both grades, and for each TIMSS cycle, the analyses produced twogroups of countries based on responses to the curriculum questionnaire. The clusterand discriminant analyses provide stronger evidence for convergence in sciencecurricula over time at Grade 8 than at Grade 4. The implemented science curriculumof 15 countries was examined in more depth using the TIMSS teacher questionnaireresponses; due to difficulties in obtaining robust comparable data for countriesacross the different TIMSS cycles and the significant caveats that would haveapplied to any conclusions drawn from these analyses, these data are notconsidered.
Keywords Cluster analysis � Curriculum change � Curriculum convergenceDiscriminant analysis � International large-scale assessment � Science curriculumScience education � Science topics � Trends in Mathematics and Science Study(TIMSS)
© International Association for the Evaluation of Educational Achievement (IEA) 2018O. Stacey et al., The Globalization of Science Curricula, IEA Researchfor Education 3, https://doi.org/10.1007/978-3-319-71532-2_4
39
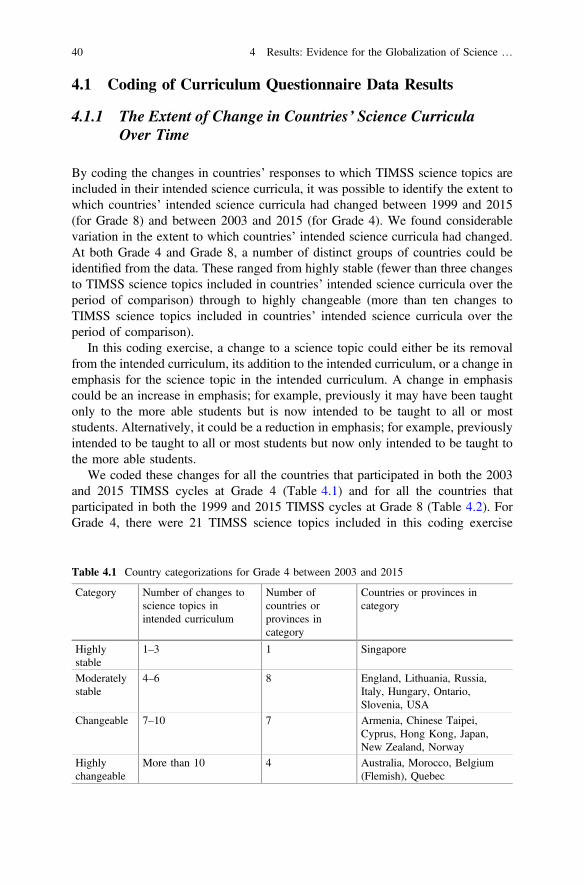
4.1 Coding of Curriculum Questionnaire Data Results
4.1.1 The Extent of Change in Countries’ Science CurriculaOver Time
By coding the changes in countries’ responses to which TIMSS science topics areincluded in their intended science curricula, it was possible to identify the extent towhich countries’ intended science curricula had changed between 1999 and 2015(for Grade 8) and between 2003 and 2015 (for Grade 4). We found considerablevariation in the extent to which countries’ intended science curricula had changed.At both Grade 4 and Grade 8, a number of distinct groups of countries could beidentified from the data. These ranged from highly stable (fewer than three changesto TIMSS science topics included in countries’ intended science curricula over theperiod of comparison) through to highly changeable (more than ten changes toTIMSS science topics included in countries’ intended science curricula over theperiod of comparison).
In this coding exercise, a change to a science topic could either be its removalfrom the intended curriculum, its addition to the intended curriculum, or a change inemphasis for the science topic in the intended curriculum. A change in emphasiscould be an increase in emphasis; for example, previously it may have been taughtonly to the more able students but is now intended to be taught to all or moststudents. Alternatively, it could be a reduction in emphasis; for example, previouslyintended to be taught to all or most students but now only intended to be taught tothe more able students.
We coded these changes for all the countries that participated in both the 2003and 2015 TIMSS cycles at Grade 4 (Table 4.1) and for all the countries thatparticipated in both the 1999 and 2015 TIMSS cycles at Grade 8 (Table 4.2). ForGrade 4, there were 21 TIMSS science topics included in this coding exercise
Table 4.1 Country categorizations for Grade 4 between 2003 and 2015
Category Number of changes toscience topics inintended curriculum
Number ofcountries orprovinces incategory
Countries or provinces incategory
Highlystable
1–3 1 Singapore
Moderatelystable
4–6 8 England, Lithuania, Russia,Italy, Hungary, Ontario,Slovenia, USA
Changeable 7–10 7 Armenia, Chinese Taipei,Cyprus, Hong Kong, Japan,New Zealand, Norway
Highlychangeable
More than 10 4 Australia, Morocco, Belgium(Flemish), Quebec
40 4 Results: Evidence for the Globalization of Science …

whilst for Grade 8 there were 20 TIMSS science topics. The same comparison wasmade between 2003–2007 and 2007–2015 for Grade 4 and between 1999–2007 and2007–2015 for Grade 8; in each case they yielded similar results.
The Singaporean curriculum was noticeably more stable than that of othercountries at Grade 4 (Table 4.1). There was only one change in the TIMSS topicsintended to be taught in Singapore at Grade 4 between 2003 and 2015, and the nextmost stable country (Lithuania) made only four changes to its intended sciencecurriculum in the same period. By contrast, in Belgium (the country with the mostchangeable curriculum), there were 15 changes in the TIMSS topics intended to betaught. Given Singapore’s high performance on TIMSS across the years it isunsurprising that the number of changes to the intended science topics taught wasminimal between 2003 and 2015, as there was likely less incentive to revise thecurriculum. By contrast, Morocco is one of the lowest performing countries inTIMSS science at Grade 4. It is likely that the high number of changes to itsintended science curriculum have been instigated to improve future science per-formance generally, not just on TIMSS.
Similar patterns emerge from the Grade 8 data in terms of distinct groups ofcountries demonstrating varying number of changes to their intended science cur-riculum (Table 4.2). However, the countries in each group do not necessarily matchthe Grade 4 groupings. For example, although Singapore shows remarkable sta-bility in its science curriculum at Grade 4, changes in the intended science cur-riculum at Grade 8 have been far more extensive. It is important here to note that,for Grade 4, the comparison is being made between 2003 and 2015, whereas forGrade 8 the comparison is between 1999 and 2015 and so covers a longer timeperiod. Additionally, the countries taking part in TIMSS at Grade 4 and Grade 8 arenot exactly the same.
Table 4.2 Country categorizations for Grade 8 between 1999 and 2015
Category Number of changes toscience topics taughtin intended curriculum
Number ofcountries orprovinces incategory
Countries or provincesin category
Highlystable
1–3 7 Hungary, Hong Kong, Jordan,Turkey, USA, Iran, ChineseTaipei
Moderatelystable
4–6 13 England, Japan, Malaysia,Slovenia, Thailand, Australia,Canada, Italy, Lithuania, NewZealand, Chile, Republic ofKorea, Russia
Changeable 7–10 2 Singapore, MoroccoHighlychangeable
More than 10 2 South Africa, Israel
4.1 Coding of Curriculum Questionnaire Data Results 41

4.1.2 The Nature of Change in Countries’ ScienceCurricula
This analysis enabled the nature of changes to the science curriculum of eachcountry to be identified in addition to the number of changes made. Whilst countriescould be grouped into categories based upon the extent to which their curricula hadchanged or remained stable, the profile of countries within each grouping could bequite different. The analysis identified some countries as “cutters” and some as“adders”. Cutters are countries where curricular changes resulted in fewer TIMSSscience topics appearing in the intended science curricula, whereas adders arecountries where curricular changes tended to result in additional TIMSS sciencetopics appearing within the intended science curricula. A third group of countrieswas identified, which we decribe as “balancers”. These are countries where cur-ricular changes resulted in roughly equal numbers of TIMSS topics being addedand removed from the intended science curricula. We identified countries for eachof these categories for Grade 4 (Table 4.3, comparison between 2003 and 2015TIMSS data) and for Grade 8 (Table 4.4, comparison between 1999 and 2015TIMSS data). Similar patterns emerged when comparing the data for 2003–2007and 2007–2015 at Grade 4 and the data for 1999–2007 and 2007–2015 at Grade 8so, in the interests of space, only the 2003 and 1999–2015 results are presentedhere.
Whilst the same categories exist for both Grade 4 and Grade 8, the proportion ofcountries in each category varies for the two grades (Tables 4.3 and 4.4).
Table 4.3 Country categorization for Grade 4 (2003–2015)
Category Number of countries orprovinces in category
Countries or provinces
Adders 8 England, Belgium (Flemish), Hungary, Japan,Chinese Taipei, Morocco, Armenia, Cyprus
Cutters 6 Italy, Lithuania, Singapore, Norway, Australia,Ontario
Balancers 6 Russia, Slovenia, Hong Kong, New Zealand,Quebec, USA
Table 4.4 Country categorization for Grade 8 (1999–2015)
Category Number of countries orprovinces in category
Countries or provinces
Adders 13 South Africa, Israel, Chile, England, Japan,Thailand, Italy, Republic of Korea, Hong Kong,Iran, Chinese Taipei, Jordan, Malaysia
Cutters 8 Singapore, Australia, New Zealand,Russia, Lithuania, Slovenia, Turkey, Hungary
Balancers 3 Morocco, Canada, USA
42 4 Results: Evidence for the Globalization of Science …

Additionally, countries can have different profiles for Grade 4 and Grade 8. Forexample, at Grade 4, Morocco is categorized as an adder, as between 2003 and2015 it added four science topics to its curriculum and removed one. By contrast, atGrade 8, Morocco is classed as a balancer, as between 1999 and 2015 it added fourscience topics and removed four science topics from its curriculum.
4.1.3 Changes to Science Curricula Between TIMSS Cycles
The analysis enabled the average number of curricular changes between TIMSScycles to be calculated (Tables 4.5 and 4.6). As the number of countries partici-pating in each TIMSS cycle varies, the number of countries within each comparisondiffers (Tables 4.5 and 4.6).
Table 4.5 Average number of changes to science curriculum at Grade 4
Comparison Number ofcountriesincomparison
Averagenumberof topicsadded
Averagenumberof topicsremoved
Averagenumber oftopics withincreasedemphasis
Averagenumber oftopics withreducedemphasis
Averagenumber oftopicswith nochange
2003–2007 21 2.95(2.66)
1.76(2.09)
0.57(1.37)
0.05(0.21)
15.67(2.92)
2007–2015 18 3.44(2.77)
2.39(2.21)
1.06(2.12)
0.53(1.29)
12.50(4.76)
2003–2015 26 3.08(3.19)
2.12(2.21)
0.23(0.50)
0.73(1.53)
14.88(3.15)
Note Standard deviations for each average are given in brackets
Table 4.6 Average number of changes to science curriculum at Grade 8
Comparison Number ofcountriesincomparison
Averagenumberof topicsadded
Averagenumberof topicsremoved
Averagenumber oftopics withincreasedemphasis
Averagenumber oftopics withreducedemphasis
Averagenumberof topicsnochange
1999–2007 25 1.88(2.01)
1.64(1.98)
0.32(0.61)
0.52(1.58)
15.8(4.05)
2007–2015 36 2.08(2.11)
1.44(1.80)
0.39(1.03)
0.67(1.29)
15.42(3.07)
1999–2015 23 2.65(2.74)
1.39(1.55)
0.17(0.48)
0.61(1.31)
15.13(3.07)
Note Standard deviations for each average are given in brackets
4.1 Coding of Curriculum Questionnaire Data Results 43

For each comparison, at both grades, the average number of science topics addedis greater than the average number of topics removed (Tables 4.5 and 4.6). Thissuggests that, across countries as a whole, changes in a country’s science cur-riculum are more likely to lead to an increase rather than a decrease in the numberof TIMSS science topics included in the curriculum.
It is also more common for topics to be completely removed or added to thescience curriculum than it is for there to be a change in emphasis to a science topicin the curriculum. Additionally, the results suggest that the science curriculum atGrade 4 is more subject to change than the science curriculum at Grade 8, as theaverage number of topics added or removed in each comparison is higher for Grade4 than Grade 8. This finding is consistent with our earlier observation that, at Grade8, a higher proportion of countries are categorized as having highly stable ormoderately stable curricula than at Grade 4 (Tables 4.1 and 4.2).
4.1.4 TIMSS Science Topics Included in Countries’Curricula
This analysis enabled us to identify the extent to which TIMSS science topics wereincluded in the intended curricula of participating countries, and whether there wereparticular TIMSS science topics that were core to the majority of participatingcountries’ science curricula.
As the science topics included in each TIMSS cycle changed slightly each cycle,the science topics from the earlier TIMSS cycles were mapped to the 2015 TIMSSscience topics to identify those that were common across all three cycles.
The number of TIMSS science topics included in the majority (80% or more)and minority (50% or fewer) of countries’ intended curricula for Grade 4 and Grade8 change over time (Tables 4.7 and 4.8).
For Grade 4, between 2003 and 2015, the number of TIMSS science topicstaught in at least 80% of participating countries increased, whilst the number oftopics taught to fewer than half of participating countries decreased (Table 4.7).This suggests that there is a growing number of core science topics at Grade 4 thatare included in the majority of participating countries’ intended science curricula.However, caution needs to be exercised in interpreting these results, as the number
Table 4.7 Science topics taught in the majority and minority of participating countries at Grade 4
TIMSSyear
Number ofparticipatingcountries
Number of science topicscovered by 80% or more ofcountries
Number of science topicscovered by 50% or fewer ofcountries
2003 29 2 62007 46 5 32015 53 7 2
44 4 Results: Evidence for the Globalization of Science …
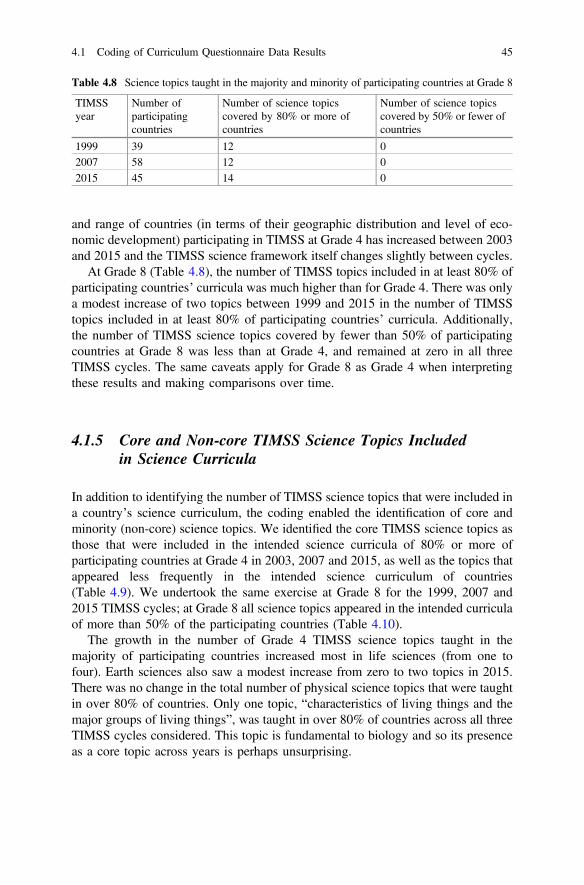
and range of countries (in terms of their geographic distribution and level of eco-nomic development) participating in TIMSS at Grade 4 has increased between 2003and 2015 and the TIMSS science framework itself changes slightly between cycles.
At Grade 8 (Table 4.8), the number of TIMSS topics included in at least 80% ofparticipating countries’ curricula was much higher than for Grade 4. There was onlya modest increase of two topics between 1999 and 2015 in the number of TIMSStopics included in at least 80% of participating countries’ curricula. Additionally,the number of TIMSS science topics covered by fewer than 50% of participatingcountries at Grade 8 was less than at Grade 4, and remained at zero in all threeTIMSS cycles. The same caveats apply for Grade 8 as Grade 4 when interpretingthese results and making comparisons over time.
4.1.5 Core and Non-core TIMSS Science Topics Includedin Science Curricula
In addition to identifying the number of TIMSS science topics that were included ina country’s science curriculum, the coding enabled the identification of core andminority (non-core) science topics. We identified the core TIMSS science topics asthose that were included in the intended science curricula of 80% or more ofparticipating countries at Grade 4 in 2003, 2007 and 2015, as well as the topics thatappeared less frequently in the intended science curriculum of countries(Table 4.9). We undertook the same exercise at Grade 8 for the 1999, 2007 and2015 TIMSS cycles; at Grade 8 all science topics appeared in the intended curriculaof more than 50% of the participating countries (Table 4.10).
The growth in the number of Grade 4 TIMSS science topics taught in themajority of participating countries increased most in life sciences (from one tofour). Earth sciences also saw a modest increase from zero to two topics in 2015.There was no change in the total number of physical science topics that were taughtin over 80% of countries. Only one topic, “characteristics of living things and themajor groups of living things”, was taught in over 80% of countries across all threeTIMSS cycles considered. This topic is fundamental to biology and so its presenceas a core topic across years is perhaps unsurprising.
Table 4.8 Science topics taught in the majority and minority of participating countries at Grade 8
TIMSSyear
Number ofparticipatingcountries
Number of science topicscovered by 80% or more ofcountries
Number of science topicscovered by 50% or fewer ofcountries
1999 39 12 02007 58 12 02015 45 14 0
4.1 Coding of Curriculum Questionnaire Data Results 45

Table 4.9 Core and non-core TIMSS science topics at Grade 4
Common sources of energy (e.g. the Sun, electricity, wind) and uses of energy (heating and cooling homes, providing light)
Life sciences 2003 2007 2015
Characteristics of living things and the major groups of living things (e.g. mammals, birds, insects, flowering plants)
Major body structures and their functions in humans, other animals, and plants
Life cycles of common plants and animals (e.g. humans, butterflies, frogs, flowering plants)
Understanding that some characteristics are inherited and some are the result of the environment
How physical features and behaviors help living things survive in their environments
Relationships in communities and ecosystems (e.g. simple food chains, predator-prey relationships, human impacts on the environment)
Human health (transmission and prevention of diseases, symptoms of health andillness, importance of a healthy diet and exercise)
Physical sciences 2003 2007 2015
States of matter (solid, liquid, gas) and properties of the states of matter (volume, shape); how the state of matter changes by heating or cooling
Classifying materials based on physical properties (e.g. weight / mass, volume, conducting heat, conducting electricity, magnetic attraction)
Mixtures and how to separate a mixture into its components (e.g. sifting, filtering, evaporation, using a magnet)
Chemical changes in everyday life (e.g., decaying, burning, rusting, cooking)
46 4 Results: Evidence for the Globalization of Science …

There was only a small growth in the number of Grade 8 TIMSS science topicstaught in the majority of participating countries’ curricula (Table 4.8). The variationin the change across the three TIMSS cycles for each of the four content domains istherefore not unexpected: biology and earth science saw both an increase anddecrease in the number of science topics taught in more than 80% of participatingcountries, while chemistry and physics saw an increase and no change respectively
Light and sound in everyday life (e.g. understanding shadows and reflection, understanding that vibrating objects make sound)
Electricity and simple circuits (e.g. identifying materials that are conductors, recognizing that electricity can be changed to light or sound, knowing that a circuit must be complete to work correctly
Properties of magnets (e.g. knowing that like poles repel and opposite poles attract, recognizing that magnets can attract some objects)
Forces that cause objects to move (e.g. gravity, pushing/pulling)
Earth sciences 2003 2007 2015
Common features of the Earth’s landscape (e.g. mountains, plains, deserts, rivers, oceans) and their relationship to human use (farming, irrigation, land development)
Where water is found on the Earth and how it moves in and out of the air (e.g. evaporation, rainfall, cloud formation, dew formation)
Understanding that weather can change from day to day, from season to season, and by geographic location
Understanding what fossils are and what they can tell us about past conditions on Earth
Objects in the solar system (the Sun, the Earth, the Moon, and other planets) and their movements (the Earth and other planets revolve around the Sun, the Moon revolves around the Earth)
Key
Topic in curriculum of at least 80% of countries in TIMSS Topic in curriculum of 50–80% of countriesTopic in curriculum of less than 50% of countries
4.1 Coding of Curriculum Questionnaire Data Results 47

Table 4.10 Core and non-core TIMSS science topics at Grade 8
Biology 1999 2007 2015
Differences among major taxonomic groups of organisms (plants, animals, fungi, mammals, birds, reptiles, fish, amphibians)
Major organs and organ systems in humans and other organisms (structure / function, life processes that maintain stable bodily conditions)
Cells, their structure and functions, including respiration and photosynthesis as cellular processes
Life cycles, sexual reproduction, and heredity (passing on of traits, inherited versus acquired / learned characteristics)
Role of variation and adaptation in survival / extinction of species in a changing environment (including fossil evidence for changes in life on Earth over time)
Interdependence of populations of organisms in an ecosystem (e.g. energy flow, food webs, competition, predation) and factors affecting population size in an ecosystem
Human health (causes of infectious diseases, methods of infection, prevention, immunity) and the importance of diet and exercise in maintaining health
Chemistry 1999 2007 2015
Classification, composition, and particulate structure of matter (elements, compounds, mixtures, molecules, atoms, protons, neutrons, electrons)
Mixtures and solutions (solvent, solute, concentration / dilution, effect of temperature on solubility)
Properties and uses of common acids and bases
Chemical change (transformation of reactants, evidence of chemical change, conservation of matter, common oxidation reactions–combustion, rusting, tarnishing)
48 4 Results: Evidence for the Globalization of Science …

in the number of topics taught in more than 80% of countries. No particular contentdomain is becoming increasingly more common across all countries.
Six science topics were taught in over 80% of participating countries across allthree TIMSS cycles considered. “Cell structure and function” is one of these coretopics and is again a topic that has been identified as one of the fundamental
Physical states and changes in matter (explanations of properties in terms of movement and distance between particles; phase change, thermal expansion, and changes in volume and / or pressure)
Energy forms, transformations, heat, and temperature
Basic properties / behaviors of light (reflection, refraction, light and color, simple ray diagrams) and sound (transmission through media, loudness, pitch, amplitude, frequency)
Electric circuits (flow of current; types of circuits–parallel / series) and properties and uses of permanent magnets and electromagnets
Forces and motion (types of forces, basic description of motion, effects of density and pressure)
Earth science 1999 2007 2015
Earth’s structure and physical features (Earth’s crust, mantle, and core; composition and relative distribution of water, and composition of air)
Earth’s processes, cycles, and history (rock cycle; water cycle; weather versus climate; major geological events; formation of fossils and fossil fuels)
Earth’s resources, their use and conservation (e.g. renewable / non-renewable resources, human use of land / soil, water resources)
Earth in the solar system and the universe (phenomena on Earth–day / night, tides, phases of moon, eclipses, seasons; physical features of Earth compared to other bodies)
Key
Topic in curriculum of at least 80% of countries in TIMSS Topic in curriculum of 50–80% of countriesTopic in curriculum of less than 50% of countries
Physics 1999 2007 2015
4.1 Coding of Curriculum Questionnaire Data Results 49

concepts in school science (Harlen 2010). It is thus unsurprising that it features as acore topic throughout.
4.1.6 Comparison of TIMSS Topics Taught AcrossCountries
We have identified science topics that are considered core and non-core in thescience curriculum of countries participating in TIMSS (Sect. 4.1.5). However, asthe number of countries that has participated in TIMSS has varied between cycles,comparisons are challenging. To overcome this, we focused on science topicsincluded in the science curriculum of countries that have participated in all threeTIMSS cycles under consideration for Grade 4 (Table 4.11) and for Grade 8(Table 4.12).
At Grade 8 a far higher number of the TIMSS science topics were included in thecurriculum of most participating countries than at Grade 4. At both grades therewere a number of topics that were taught in the majority of cases across all TIMSScycles, for example, “states of matter” at Grade 4 (Table 4.11) and “life cycles,sexual reproduction and heredity” at Grade 8 (Table 4.12). However, at Grade 4 inparticular, there are some topics that are not commonly included in the curriculumin any of the three TIMSS cycles considered. One such topic is “understandingwhat fossils are and what they can tell us about past conditions on Earth”.
We found that restricting the analysis to countries participating in all threeTIMSS cycles under consideration nonetheless revealed very similar patterns tothose we earlier identified in the wider pool of countries that had participated in atleast one of the TIMSS cycles under investigation (see Sect. 4.1.4).
4.2 Cluster Analysis and Discriminant Analysis
We applied cluster and discriminant analyses of the curriculum questionnaire datato determine potential convergence of curricula; countries may be clustered intogroups on the basis of the topics included or not included in their intended sciencecurricula at Grade 4 and Grade 8.
4.2.1 Grade 4
The cluster analysis performed on the 2003 TIMSS data for Grade 4 resulted incountries being aggregated in two groups. As mentioned previously, the optimalnumber of groups is assessed as that with the lowest Bayesian information criterion
50 4 Results: Evidence for the Globalization of Science …
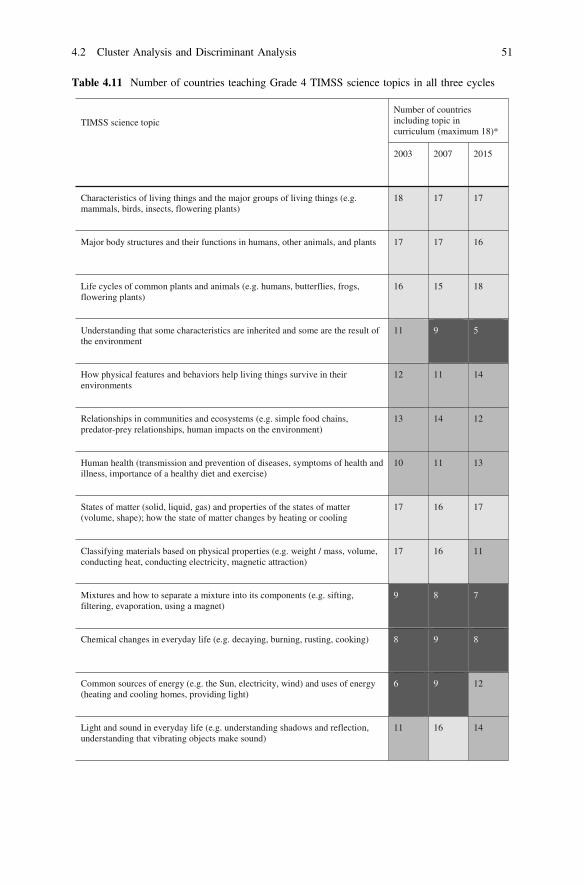
Table 4.11 Number of countries teaching Grade 4 TIMSS science topics in all three cycles
TIMSS science topic Number of countries including topic in curriculum (maximum 18)*
2003 2007 2015
Characteristics of living things and the major groups of living things (e.g. mammals, birds, insects, flowering plants)
18 17 17
Major body structures and their functions in humans, other animals, and plants 17 17 16
Life cycles of common plants and animals (e.g. humans, butterflies, frogs, flowering plants)
16 15 18
Understanding that some characteristics are inherited and some are the result of the environment
11 9 5
How physical features and behaviors help living things survive in their environments
12 11 14
Relationships in communities and ecosystems (e.g. simple food chains, predator-prey relationships, human impacts on the environment)
13 14 12
Human health (transmission and prevention of diseases, symptoms of health and illness, importance of a healthy diet and exercise)
10 11 13
States of matter (solid, liquid, gas) and properties of the states of matter (volume, shape); how the state of matter changes by heating or cooling
17 16 17
Classifying materials based on physical properties (e.g. weight / mass, volume, conducting heat, conducting electricity, magnetic attraction)
17 16 11
Mixtures and how to separate a mixture into its components (e.g. sifting, filtering, evaporation, using a magnet)
9 8 7
Chemical changes in everyday life (e.g. decaying, burning, rusting, cooking) 8 9 8
Common sources of energy (e.g. the Sun, electricity, wind) and uses of energy (heating and cooling homes, providing light)
6 9 12
Light and sound in everyday life (e.g. understanding shadows and reflection, understanding that vibrating objects make sound)
11 16 14
4.2 Cluster Analysis and Discriminant Analysis 51

(BIC).1 The cluster quality could be described as fair according to the silhouettemeasure of cohesion and separation.2 Cluster analysis identified the first five mostdiscriminating items for TIMSS 2003 at Grade 4 (Fig. 4.1).
Electricity and simple circuits (e.g. identifying materials that are conductors, recognizing that electricity can be changed to light or sound, knowing that a circuit must be complete to work correctly
12 10 10
Properties of magnets (e.g. knowing that like poles repel and opposite poles attract, recognizing that magnets can attract some objects)
13 11 11
Forces that cause objects to move (e.g. gravity, pushing / pulling) 9 8 12
Common features of the Earth’s landscape (e.g. mountains, plains, deserts, rivers, oceans) and their relationship to human use (farming, irrigation, land development)
13 12 9
Where water is found on the Earth and how it moves in and out of the air (e.g. evaporation, rainfall, cloud formation, dew formation)
12 15 14
Understanding that weather can change from day to day, from season to season, and by geographic location
9 12 16
Understanding what fossils are and what they can tell us about past conditions on Earth
7 8 5
Objects in the solar system (the Sun, the Earth, the Moon, and other planets) and their movements (the Earth and other planets revolve around the Sun, the Moon revolves around the Earth)
9 12 11
*Note Eighteen countries participated in all three cycles considered here.
Key
Topic included in curriculum of 15 or more countriesTopic in curriculum of 10–14 countriesTopic included in the curriculum of fewer than 10 countries
1Hereafter we report the BIC for the solution with 1, 2 and 3 clusters:– 1 cluster: BIC = 1022.543– 2 clusters: BIC = 992.822 (−29.721 with respect to one single cluster)– 3 clusters: BIC = 1042.923 (+50.101 with respect to two clusters).
2This is a measure of how similar an object is to its own cluster (cohesion) compared to otherclusters (separation). This measure ranges from −1 to 1, the highest figures indicating a bettercluster outcome. In this case, the value of the silhouette measure is around 0.25 which falls into the‘fair’ range (between 0.2 and 0.5).
52 4 Results: Evidence for the Globalization of Science …

Table 4.12 Number of countries teaching Grade 8 TIMSS science topics in all three cycles
Earth’s structure and physical features (Earth’s crust, mantle, and core; composition and relative distribution of water, and composition of air)
17 19 20
TIMSS science topic Number of countries including topic in curriculum (maximum 21)*
1999 2007 2015
Differences among major taxonomic groups of organisms (plants, animals, fungi, mammals, birds, reptiles, fish, amphibians)
21 21 18
Major organs and organ systems in humans and other organisms (structure / function, life processes that maintain stable bodily conditions)
18 21 20
Cells, their structure and functions, including respiration and photosynthesis as cellular processes
21 20 20
Life cycles, sexual reproduction, and heredity (passing on of traits, inherited versus acquired / learned characteristics)
21 21 20
Role of variation and adaptation in survival / extinction of species in a changing environment (including fossil evidence for changes in life on Earth over time)
14 12 16
Interdependence of populations of organisms in an ecosystem (e.g. energy flow, food webs, competition, predation) and factors affecting population size in an ecosystem
17 20 19
Human health (causes of infectious diseases, methods of infection, prevention, immunity) and the importance of diet and exercise in maintaining health
16 15 16
Classification, composition, and particulate structure of matter (elements, compounds, mixtures, molecules, atoms, protons, neutrons, electrons)
14 21 20
Mixtures and solutions (solvent, solute, concentration / dilution, effect of temperature on solubility)
20 17 19
Properties and uses of common acids and bases 19 17 15
Chemical change (transformation of reactants, evidence of chemical change, conservation of matter, common oxidation reactions–combustion, rusting, tarnishing)
14 16 17
Physical states and changes in matter (explanations of properties in terms of movement and distance between particles; phase change, thermal expansion, and changes in volume and/or pressure)
21 21 18
Energy forms, transformations, heat, and temperature 20 17 19
Basic properties / behaviors of light (reflection, refraction, light and color, simple ray diagrams) and sound (transmission through media, loudness, pitch, amplitude, frequency)
17 18 18
Electric circuits (flow of current; types of circuits–parallel / series) and properties and uses of permanent magnets and electromagnets
20 17 19
Forces and motion (types of forces, basic description of motion, effects of density and pressure)
16 21 20
4.2 Cluster Analysis and Discriminant Analysis 53

The most discriminating science topic was “Understanding that some character-istics are inherited and some are the result of the environment”, indicating that thisspecific science topic is the one that is the most important in defining whether acountry may be classified as belonging to Group 1 or Group 2 (Fig. 4.2). For each ofthe five most discriminating science topics, we mapped the number of countries inGroup 1 and Group 2 that were teaching the science topic to all or most students, onlyto the most able students, or not including the topic in the curriculum at that grade.
Earth’s processes, cycles, and history (rock cycle; water cycle; weather versus climate; major geological events; formation of fossils and fossil fuels)
15 21 19
Earth’s resources, their use and conservation (e.g. renewable / non-renewable resources, human use of land / soil, water resources)
19 17 18
Earth in the solar system and the universe (phenomena on Earth–day / night, tides, phases of moon, eclipses, seasons; physical features of Earth compared to other bodies)
19 16 19
*Note Twenty-one countries participated in all three cycles considered here.
Key
Topic included in curriculum of 18 or more countriesTopic in curriculum of 13–17 countriesTopic included in the curriculum of fewer than 13 countries
0 0.2 0.4 0.6 0.8 1
Understanding that some characteristics areinherited and some are the result of the
environment
How physical features and behaviors help livingthings survive in their environments
Forces that cause objects to move (e.g., gravity,pushing/pulling)
Life cycles of common plants and animals (e.g.,humans, butterflies, frogs, flowering plants)
Common features of the Earth’s landscape (e.g., mountains, plains, deserts, rivers, oceans) and
their relationship to human use (farming, irrigation, land development)
Predictor importance
Fig. 4.1 Most discriminating topics in 2003 cluster analysis: Grade 4
54 4 Results: Evidence for the Globalization of Science …

While for the most discriminating item (Fig. 4.2a), there is an almost perfectseparation between answers given by countries in Group 1 and countries in Group2, the answers given by countries in the two groups tend to become more similar asthe item becomes less discriminating (Fig. 4.2b–e).
Having identified two groups using cluster analysis, we conducted a discriminantanalysis in order to estimate a classification model for countries in the successive
0
4
8
12
16
Taught to all pupils Taught to somepupils
Taught to somepupils
Taught to somepupils
Taught to somepupils
Not in the curriculum
a) Understanding that some characteristics are inherited and some are the result of the
environment
Group 1 Group 2
0
4
8
12
16
Taught to all pupils Taught to somepupils
Not in the curriculum
b) Physical features and behaviors help living things survive in their environments
Group 1 Group 2
0
4
8
12
Taught to all pupils Not in the curriculum
c) Forces that cause objects to move (e.g., gravity, pushing/pulling)
Group 1 Group 2
0
4
8
12
16
Taught to all pupils Not in the curriculum
d) Life cycles of common plants and animals (e.g., humans, butterflies, frogs,
flowering plants)
Group 1 Group 2
0
4
8
12
16
Taught to all pupils Not in the curriculum
e) Common features of the Earth’s landscape (e.g., mountains, plains, deserts,
rivers, oceans) and their relationship to human use (farming, irrigation, land
development)
Group 1 Group 2
Fig. 4.2 Answers by group for the five most discriminating topics identified by cluster analysis ofTIMSS 2003 data for Grade 4
4.2 Cluster Analysis and Discriminant Analysis 55

cycles of TIMSS. As already mentioned, the topics that we found to be the mostdiscriminating in the cluster analysis were assigned higher coefficients in theregression. These topics contribute most towards identifying the countriesbelonging to one of the two groups in the second and third TIMSS cycles con-sidered (Tables 4.13 and 4.14).3
For each TIMSS cycle, we ascertained the number and percentage of countries inGroup 1 and Group 2 (Table 4.13). The proportion of countries in Group 1increased slightly over time at the expense of Group 2. However, the gain wasmodest (+14.64% points) and the possibility that this increase was driven by newlyentered countries that did not participate in TIMSS 2003 cannot be ruled out.
Countries moved between groups in subsequent cycles of the survey(Table 4.14).4 For instance, we can see that out of the 11 countries that wereclassified as belonging to Group 1 in 2003, ten were still classified as belonging to
Table 4.13 Classification of countries at Grade 4 based on discriminant analysis using clustergroupings from TIMSS 2003 data
Group Number (and percentage) of countries by group
2003 2007 2015
Group 1 16 (55.17%) 35 (76.09%) 37 (69.81%)Group 2 13 (44.83%) 11 (23.91%) 16 (30.19%)
Table 4.14 Classification of countries appearing in consecutive TIMSS surveys at Grade 4
Initial group
Movement between 2003 and 2007
Movement between 2007 and 2015
Group 1 Group 2 Group 1 Group 2
Group 1
10 out of 11remained
(90.91%)
1 out of 11moved
(9.09%)
16 out of 21remained
(76.19%)
5 out of 21moved
(23.81%)
Group 2
5 out of 11moved
(45.45%)
6 out of 11remained
(54.55%)
5 out of 9moved
(55.56%)
4 out of 9remained
(44.44%)
Note Gray-shaded cells contain the number and percentage of countries that have been classified inthe same group in two consecutive TIMSS cycles, while the unshaded cells display the number andpercentage of countries that have moved across groups
3It must be emphasized that, while the classification of countries in 2003 was the result of ourcluster analysis, the classification in the following two cycles was a prediction obtained byapplying the model estimated from the discriminant analysis to the countries’ new set of responses.4By construction, these tables include only countries that have taken part in two consecutiveTIMSS cycles.
56 4 Results: Evidence for the Globalization of Science …

the same group in 2007, while the remaining country was classified as belonging toGroup 2. Hence, between 2003 and 2007 countries in Group 1 were mostly stable.Conversely, a non-negligible fraction of countries belonging to Group 2 (45.45%)changed their classification. Between 2007 and 2015 few countries moved fromGroup 1 to Group 2 (23.81%) while, once again, a considerable fraction of coun-tries that were classified as belonging to Group 2 (55.56%) moved to Group 1. Thisprovides some evidence in support of the hypothesis that science curricula areconverging and becoming more similar over time at Grade 4.
The critical point is that, while in the first table the increase in the percentage ofcountries belonging to Group 1 might be driven by new countries that were notincluded in previous cycles (see Table 4.13), the same set of countries are in each ofthe tables (see Table 4.14). Hence, movements (and as a consequence variations inthe percentage of countries in each group) occur only when a country that wasoriginally classified in one group modifies its science curriculum to such an extentthat it becomes more similar to countries in the other group.
To conclude the investigation of the results obtained for Grade 4, considerationneeds to be given to how newly entered countries5 are classified in 2007 and 2015.The majority of countries that entered TIMSS in 2007 are classified as belonging toGroup 1 and the same applies to countries that entered the study in 2015(Table 4.15). The confluence of newly entered countries into one of the two groupsdoes not indicate convergence by itself.6 Nevertheless, if a core science curriculumis emerging we would expect the majority of countries to adhere to it.
The increase in the proportion of countries belonging to Group 1 (Tables 4.13and 4.15) suggests that this is partially because new countries tend to be classifiedmore often than not in this group. However, even considering only countries thathave been in two consecutive TIMSS cycles, Group 1 is growing at the expense ofGroup 2, suggesting a certain degree of convergence (Table 4.14). The finding thatnewly entered countries are more often classified as belonging to Group 1 isconsistent with the emergence of a core science curriculum to which countries tendto adhere.
For the five most discriminating items (see Fig. 4.1), we further analyzed theanswers given by the 18 countries that participated in the 2003, 2007 and 2015
Table 4.15 Cluster analysisclassification of newly enteredcountries at Grade 4
Group 2007 2015
Group 1 19 out of 24 17 out of 23(79.17%) (73.91%)
Group 2 5 out of 24 6 out of 23(20.83%) (26.09%)
5These are countries that are in the dataset in a given cycle but not in the immediate previous cycle.6Newly entered countries could be disproportionally more similar to countries in one of the twogroups to begin with.
4.2 Cluster Analysis and Discriminant Analysis 57

TIMSS cycles (see Fig. 4.3a–e) to establish whether there were indications thatscience curricula at Grade 4 were converging. Only the 18 countries that participatedin all the TIMSS cycles under consideration were included, to ensure statisticalvalidity.
0
4
8
12
16
20
Taught to all pupils Taught to somepupils
Not in the curriculum
a) Understanding that some characteristics are inherited and some are the result of the
environment
2003 2007 2015
0
4
8
12
16
20
Taught to all pupils Taught to somepupils
Not in the curriculum
b) How physical features and behaviors help living things survive in their
environments
2003 2007 2015
0
4
8
12
16
20
Taught to all pupils Taught to somepupils
Not in the curriculum
c) Forces that cause objects to move (e.g., gravity, pushing/pulling)
2003 2007 2015
0
4
8
12
16
20
Taught to all pupils Taught to somepupils
Not in the curriculum
d) Life cycles of common plants and animals (e.g., humans, butterflies, frogs,
flowering plants)
2003 2007 2015
0
4
8
12
16
20
Taught to all pupils Taught to somepupils
Not in the curriculum
e) Common features of the Earth’s landscape (e.g., mountains, plains, deserts,
rivers, oceans) and their relationship to human use (farming, irrigation, land
development)
2003 2007 2015
Fig. 4.3 Evolution of the distribution of the five most discriminating Grade 4 science topics(identified in 2003) between 2003 and 2015
58 4 Results: Evidence for the Globalization of Science …

Three science topics demonstrated a clear tendency to converge7 (Fig. 4.3a–c),while one remained stable (Fig. 4.3e) and the other underwent an inversion intendency (the topic “forces that cause objects to move” was predominantly nottaught in 2003, but the majority of countries had included it in the curriculum by2015; see Fig. 4.3d). This is important because it confirms that the model we havepresented identifies a general tendency to convergence in science curricula. Thefinding of overall convergence does not rule out the possibility that single topics areactually diverging. As long as the increase in similarities is enough to offset theemergence of dissimilarities, the model will identify overall convergence.
The model obtained by means of the discriminant analysis puts more emphasison topics that were particularly important in defining the clusters in the first cycleand less on topics that were not discriminating at that point. We therefore repeatedthe same process in reverse. In practical terms, starting from the groups identifiedby means of a cluster analysis of the 2015 TIMSS cycle, we estimated a model thatpredicted countries’ membership based on the responses they gave to the 2015curriculum questionnaire. This model was then used to group countries in earliercycles. We used this approach to verify whether aspects that were similar in 2003(i.e. science topics that were widely taught or not taught) have become increasinglydifferent over time. Our previous model was not able to identify this phenomenon,as topics that were not discriminating in the first cycle give only a very minorcontribution in predicting future membership. The model once again identified twoclusters8 and the classification quality was fair according to the silhouette measureof cohesion and separation.
Among the five most discriminating items in 2015, there was only one topic(“understanding that some characteristics are inherited and some are the result ofthe environment”) that was shared with the 2003 analysis (Fig. 4.4). This supportedthe hypothesis of convergence. The topics that were very discriminating betweenGroup 1 and Group 2 in 2003 had converged and dissimilarities with respect toother topics now defined the clustering. These dissimilarities might be pre-existing(meaning that the topics were already dissimilar in 2003, but they were over-shadowed by other aspects that were even more relevant in defining the clusteringof countries), or they might have emerged over time (topics that were widely taught,or not taught, by the majority of countries have been removed, or introduced, bysome of them). The occurrence of this second event, which would indicate diver-gence along some dimensions, was why we repeated the analysis in reverse.
7In this case, convergence is identified by a concentration of the percentage reported in thehistogram towards one single answer.8The BIC for the solution with 1, 2 and 3 clusters:
– 1 cluster: BIC = 1537.288– 2 clusters: BIC = 1450.742 (−86.546 with respect to one single cluster)– 3 clusters: BIC = 1494.038 (+43.296 with respect to two clusters).
4.2 Cluster Analysis and Discriminant Analysis 59

Applying this reverse approach, we found that the percentage of countries inGroup 19 had decreased between 2003 and 2007 and remained stable in the fol-lowing cycle (Table 4.16). This contradicts the hypothesis of convergence of sci-ence curricula, as it suggests that the treatment of topics that distinguished countriesin 2015 was more homogeneous in 2003. Nevertheless, the results are based ondifferent sets of countries in each cycle and hence the evidence might be driven bynew entrants. To address this issue, we replicated our investigation into themovement of countries between consecutive cycles (Table 4.17). Once again, thegeneral tendency was for countries to move from Group 2 to Group 1. However,
0 0.2 0.4 0.6 0.8 1
Chemical changes in everyday life (e.g.,decaying, burning, rusting, cooking)
Understanding that some characteristicsare inherited and some are the result of
the environment
Common sources of energy (e.g., theSun, electricity, wind) and uses of energy
(heating and cooling homes, providinglight)
Relationships in communities andecosystems (e.g., simple food chains,
predator-prey relationships, humanimpacts on the environment)
Understanding what fossils are and whatthey can tell us about past conditions on
Earth
Predictor importance
Fig. 4.4 Most discriminating items in 2015 cluster analysis: Grade 4
Table 4.16 Classification of countries at Grade 4 based on discriminant analysis using clustergroupings from TIMSS 2015 data
Group Number (and percentage) of countries by group
2003 2007 2015
Group 1 22 out of 29 26 out of 46 31 out of 53(75.86%) (56.52%) (58.49%)
Group 2 7 out of 29 20 out of 46 22 out of 53(24.14%) (43.48%) (41.51%)
9Even though we call these two groups Group 1 and Group 2, these groups do not relate to thegroups we have analyzed previously as the groups have been identified by means of two differentmodels.
60 4 Results: Evidence for the Globalization of Science …

there was still a non-negligible fraction of countries that followed the reversecourse, particularly between 2007 and 2015. Given that there appeared to beconsiderable movement across groups, the results provided only weak evidence insupport of the hypothesis of convergence in science curricula (Table 4.17).
We also studied the classification of newly entered countries in 2007 and 2015(Table 4.18).10 The majority of countries that entered the survey in 2015 wereclassified as belonging to Group 1, while new entrants in 2007 were distributedalmost equally between Group 1 and Group 2. The results are not conclusive for thereasons mentioned before, and there are no strong indications that a core sciencecurriculum is emerging.
We interpreted these results (Tables 4.16, 4.17 and 4.18) as suggesting thattopics that distinguished countries as belonging to Group 1 and Group 2 in 2015were not more similar in 2003 (and thus there was no divergence).
Table 4.17 Classification of countries appearing in consecutive TIMSS surveys at Grade 4
Initial group Movement between 2003 and 2007 Movement between 2007 and 2015
Group 1 Group 2 Group 1 Group 2
Group 1 13 out of 17 remained
4 out of 17 moved
10 out of 16 remained
6 out of 16 moved
(76.47%) (23.53%) (62.50%) (37.50%)
Group 2 3 out of 5 moved
2 out of 5remained
9 out of 14 moved
5 out of 14 remained
(60.00%) (40.00%) (64.29%) (35.71%)
Note Gray-shaded cells contain the number and percentage of countries that have been classified inthe same group in two consecutive TIMSS cycles, while the unshaded cells display the number andpercentage of countries that have moved across groups
Table 4.18 Cluster analysisclassification of newly enteredcountries at Grade 4
Group 2007 2015
Group 1 11 out of 24 16 out of 23(45.83%) (69.57%)
Group 2 13 out of 24 7 out of 23(54.17%) (30.43%)
10Even if the discriminant analysis is applied in reverse, the results of the model are interpreted inthe same way as in the previous case. The only purpose for clustering countries according toquestionnaire responses given in the 2015 TIMSS cycle is to give more importance to items thatdiffer at this point in time. We are still interested in the effect of countries that entered the study in2007 and 2015 on the percentages (Table 4.16).
4.2 Cluster Analysis and Discriminant Analysis 61

We also examined how the distribution of the most discriminating items hadevolved over time (Fig. 4.5). As in the previous case (Fig. 4.3), the behavior oftopics was heterogeneous. Some were converging (e.g. see Fig. 4.5a, c), while forthe others it was hard to identify a clear pattern.
0
4
8
12
16
20
Taught to all pupils Taught to somepupils
Not in the curriculum
a) Chemical changes in everyday life (e.g., decaying, burning, rusting, cooking)
2003 2007 2015
0
4
8
12
16
20
Taught to all pupils Taught to somepupils
Not in the curriculum
b) Understanding that some characteristics are inherited and some are the result of the
environment
2003 2007 2015
0
4
8
12
16
20
Taught to all pupils Taught to somepupils
Not in the curriculum
c) Common sources of energy (e.g., the Sun, electricity, wind) and uses of energy
(heating and cooling homes, providing light)
2003 2007 2015
0
4
8
12
16
20
Taught to all pupils Taught to somepupils
Not in the curriculum
d) Relationships in communities and ecosystems (e.g., simple food chains,
predator-prey relationships, human impacts on the environment)
2003 2007 2015
0
4
8
12
16
20
Taught to all pupils Taught to somepupils
Not in the curriculum
e) Understanding what fossils are and what they can tell us about past conditions on
Earth
2003 2007 2015
Fig. 4.5 Evolution of the distribution of the five most discriminating science topics (identified in2015) between 2003 and 2015
62 4 Results: Evidence for the Globalization of Science …

Taking into account the outcomes presented so far, we conclude that there isonly weak evidence to support the hypothesis that science curricula at Grade 4 havebecome increasingly similar over time.
4.2.2 Grade 8
We repeated the analysis we have presented for Grade 4 in order to assess con-vergence of science curricula at Grade 8.
As for Grade 4, the cluster analysis performed on the 1999 TIMSS data forGrade 8 resulted in countries being classified in two groups.11 The cluster quality isfair according to the silhouette measure of cohesion and separation. Cluster analysispredicted the five most discriminating items for TIMSS 1999 (Fig. 4.6).
The most discriminating topic is “chemical change (transformation of reactants,evidence of chemical change, conservation of matter, common oxidation reactions–combustion, rusting, tarnishing)”.
For each of the five most discriminating items (Fig. 4.7), we mapped the numberof countries in Group 1 and Group 2 that were teaching the topic to all or most
0 0.2 0.4 0.6 0.8 1
Chemical change (transformation of reactants, evidence of chemical change, conservation of
matter, common oxidation reactions –combustion, rusting, tarnishing)
Forces and motion (types of forces, basicdescription of motion, effects of density and
pressure)
Classification, composition, and particulatestructure of matter (elements, compounds,
mixtures, molecules, atoms, protons, neutrons,electrons)
Properties and uses of common acids and bases
Earth’s processes, cycles, and history (rock cycle; water cycle; weather versus climate; major geological events; formation of fossils and fossil
fuels)
Predictor importance
Fig. 4.6 Most discriminating science topics in TIMSS 1999 cluster analysis: Grade 8
11The BIC for the solution with 1, 2 and 3 clusters:– 1 cluster: BIC = 835.908– 2 clusters: BIC = 801.228 (−34.680 with respect to one single cluster)– 3 clusters: BIC = 838.015 (+36.787 with respect to two clusters).
4.2 Cluster Analysis and Discriminant Analysis 63

students, only the more able students, or not including the topic in the curriculum atthat grade.
The more discriminating the item (from Fig. 4.7a–e), the sharper the distinctionbetween Group 1 and Group 2.
0
4
8
12
Taught to all pupils Taught to somepupils
Not in the curriculum
a) Chemical change (transformation of reactants, evidence of chemical change,
conservation of matter, common oxidation reactions – combustion, rusting, tarnishing)
Group 1 Group 2
0
4
8
12
Taught to all pupils Taught to somepupils
Not in the curriculum
b) Forces and motion (types of forces, basic description of motion, effects of density and
pressure)
Group 1 Group 2
0
4
8
12
Taught to all pupils Taught to somepupils
Taught to somepupils
Not in the curriculum
c) Classification, composition, and particulate structure of matter (elements, compounds,
mixtures, molecules, atoms, protons, neutrons, electrons)
Group 1 Group 2
Group 1 Group 2
0
4
8
12
Taught to all pupils Taught to somepupils
Not in the curriculum
d) Properties and uses of common acids and bases
Group 1 Group 2
0
4
8
12
Taught to all pupils Not in the curriculum
e) Earth’s processes, cycles, and history (rock cycle; water cycle; weather versus climate; major geological events; formation of fossils and fossil
fuels)
Fig. 4.7 Answers by group for the five most discriminating topics at Grade 8 identified by TIMSS1999 cluster analysis
64 4 Results: Evidence for the Globalization of Science …

We used the model that results from applying discriminant analysis on theclusters identified in 1999 to predict the probability of belonging to Group 1 andGroup 2 in the later TIMSS cycles (2007 and 2015).
For each cycle, we ascertained the number and percentage of countries in Group1 and Group 2 (Table 4.19), revealing a strong tendency for countries to concen-trate in a single group over time. The two groups were of similar size in 1999, butthe overwhelming majority of countries were classified in Group 2 by 2015. Ashighlighted previously, even given the apparent strength of this result, it has to beinterpreted with some caution because the increase of one group at the expense ofthe other could be driven by new countries entering TIMSS in 2007 and 2015.
Countries moved between groups in subsequent cycles of the survey(Table 4.20). Between 1999 and 2007, the majority of countries that were classifiedas belonging to Group 1 moved to Group 2 (75%) while no country followed thereverse path (from Group 2 to Group 1). Similarly, between 2007 and 2015, all thecountries remaining in Group 1 moved to Group 2, while only a small number ofcountries moved from Group 2 to Group 1 (9.68% of countries classified asbelonging to Group 2 in 2007).
Table 4.19 Classification of countries at Grade 8 based on discriminant analysis using clustergroupings from TIMSS 1999 data
Group Number (and percentage) of countries by group
1999 2007 2015
Group 1 20 out of 38 9 out of 58 3 out of 45(52.63%) (15.52%) (6.67%)
Group 2 18 out of 38 49 out of 58 42 out of 45(47.37%) (84.48%) (93.33%)
Table 4.20 Classification of countries appearing in consecutive TIMSS surveys at Grade 8
2007 2015
Initial group Group 1 Group 2 Group 1 Group 2
Group 1 3 out of 12 remained
9 out of 12 moved
0 out of 5 remained
5 out of 5 moved
(25.00%) (75.00%) (0.00%) (100.00%)
Group 2 0 out of 15 moved
15 out of 15remained
3 out of 31 moved
28 out of 31
remained
(0.0 0%) (100.00%) (9.68%) (90.32%)
Note Gray-shaded cells contain the number and percentage of countries that have been classified inthe same group in two consecutive TIMSS cycles, while the unshaded cells display the number andpercentage of countries that have moved across groups
4.2 Cluster Analysis and Discriminant Analysis 65

In both 2007 and 2015, the great majority of new entrant countries (all newentrants in 2015) were classified as belonging to Group 2 (Table 4.21). The results(Tables 4.19 and 4.20) provide strong evidence in support of the hypothesis ofconvergence in science curricula at Grade 8.
We repeated the exercise we performed for Grade 4 for the five most discrim-inating items identified by the 1999 cluster analysis, further analyzing the answersgiven by the 21 countries that participated in 1999, 2007 and 2015 (Fig. 4.8) toclarify why countries have been increasingly classified as belonging to Group 2over time. Only data for the 21 countries that participated in all three TIMSS cyclesunder consideration were included, to ensure statistical validity.
In contrast to Grade 4, among the five most discriminating topics, all items butone (“properties and uses of common acids and bases”) demonstrated a clear ten-dency to converge.
Repeating the cluster and discriminant analyses in reverse starting from the 2015data to verify the findings once again identified two groups of countries,12 with“fair” cluster quality according to the silhouette measure of cohesion andseparation.
Among the five most discriminating topics (Fig 4.9), there was only one item(“Earth’s processes, cycles, and history”) that was common to the 1999 and 2015analyses. This confirms the convergence we already identified; the topics that werevery discriminating in 1999 converged and other topics were driving the clustering.
Applying this reverse approach, we identified the number and proportion ofcountries classified in Group 1 and Group 2 over the three cycles of TIMSS atGrade 8 (Table 4.22). The percentage of countries in both groups was stable overtime.
We also studied the movement of countries that participated in consecutiveTIMSS cycles in order to rule out the possibility that the results (Table 4.22) weredriven by countries that entered later cycles (Table 4.23). While there was someevidence that countries classified as belonging to Group 1 had moved to Group 2 inthe ensuing cycle, movements in the opposite direction (from Group 2 to Group 1)were rare, evidencing a tendency for countries to concentrate towards Group 2. As aresult, considering only the countries that have been in subsequent TIMSS cycles,
Table 4.21 Cluster analysisclassification of newly enteredcountries at Grade 8
Group 2007 2015
Group 1 6 out of 31 0 out of 9(19.35%) (0.00%)
Group 2 25 out of 31 9 out of 9(80.65%) (100.00%)
12The BIC for the solution with 1, 2 and 3 clusters:– 1 cluster: BIC = 1123.414– 2 clusters: BIC = 1072.458 (−50.955 with respect to one single cluster)– 3 clusters: BIC = 1104.873 (+32.415 with respect to two clusters).
66 4 Results: Evidence for the Globalization of Science …

0
4
8
12
16
20
24
Taught to all pupils Taught to somepupils
Not in the curriculum
a) Chemical change (transformation of reactants, evidence of chemical change,
conservation of matter, common oxidation reactions –combustion, rusting, tarnishing)
1999 2007 2015
0
4
8
12
16
20
24
Taught to all pupils Taught to somepupils
Not in the curriculum
b) Forces and motion (types of forces, basic description of motion, effects of density and
pressure)
1999 2007 2015
0
4
8
12
16
20
24
Taught to all pupils Taught to somepupils
Not in the curriculum
c) Classification, composition, and particulate structure of matter (elements, compounds, mixtures, molecules, atoms,
protons, neutrons, electrons)
1999 2007 2015
0
4
8
12
16
20
24
Taught to all pupils Taught to somepupils
Not in the curriculum
d) Properties and uses of common acids and bases
1999 2007 2015
0
4
8
12
16
20
24
Taught to all pupils Taught to somepupils
Not in the curriculum
e) Earth’s processes, cycles, and history (rock cycle; water cycle; weather versus
climate; major geological events; formation of fossils and fossil fuels)
1999 2007 2015
Fig. 4.8 Evolution of the distribution of the five most discriminating topics at Grade 8 (identifiedin 1999) between 1999 and 2015
4.2 Cluster Analysis and Discriminant Analysis 67

not only did we find no sign of divergence, if anything, we found the opposite.Topics that were highly discriminating in the 2015 TIMSS cycle were treated in aneven more unequal way in previous years. The fact that these items did not emergeas highly discriminating in the 1999 cluster analysis is due to the fact that othertopics were even more important in defining group belonging, hence their effectwas overshadowed.
Although confirming that the majority of countries entering TIMSS in 2007 and2015 may be classified as belonging to Group 2 (Table 4.24) is not by itselfconclusive, this does support the hypothesis that an internationally understood corescience curriculum is developing over time.
0 0.2 0.4 0.6 0.8 1
Interdependence of populations oforganisms in an ecosystem (e.g., energyflow, food webs, competition, predation)
and factors affecting population size in anecosystem
Earth’s processes, cycles, and history (rock cycle; water cycle; weather versus
climate; major geological events; formation of fossils and fossil fuels)
Major organs and organ systems inhumans and other organisms
(structure/function, life processes thatmaintain stable bodily conditions)
Earth in the solar system and theuniverse (phenomena on Earth -day/night, tides, phases of moon,
eclipses, seasons; physical features ofEarth compared to other bodies)
Basic properties/ behaviors of light(reflection, refraction, light and color,
simple ray diagrams) and sound(transmission through media, loudness,
pitch, amplitude, frequency)
Predictor importance
Fig. 4.9 Most discriminating topics in 2015 cluster analysis: Grade 8
Table 4.22 Classification ofcountries at Grade 8 based ondiscriminant analysis usingcluster groupings fromTIMSS 2015 data
Group Number (and percentage) of countries by group
1999 2007 2015
Group 1 6 out of 38 14 out of 58 9 out of 45(15.79%) (24.14%) (20.00%)
Group 2 32 out of 38 44 out of 58 36 out of 45(84.21%) (75.86%) (80.00%)
68 4 Results: Evidence for the Globalization of Science …
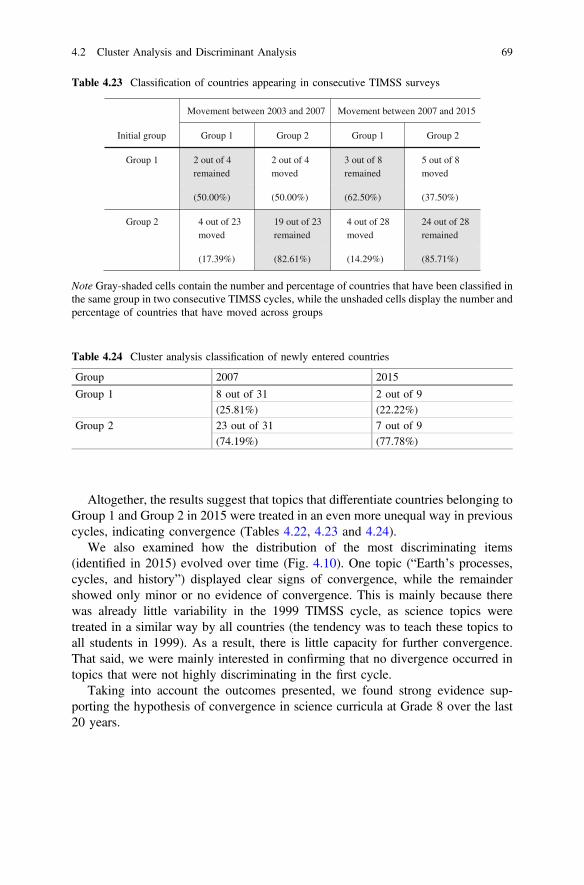
Altogether, the results suggest that topics that differentiate countries belonging toGroup 1 and Group 2 in 2015 were treated in an even more unequal way in previouscycles, indicating convergence (Tables 4.22, 4.23 and 4.24).
We also examined how the distribution of the most discriminating items(identified in 2015) evolved over time (Fig. 4.10). One topic (“Earth’s processes,cycles, and history”) displayed clear signs of convergence, while the remaindershowed only minor or no evidence of convergence. This is mainly because therewas already little variability in the 1999 TIMSS cycle, as science topics weretreated in a similar way by all countries (the tendency was to teach these topics toall students in 1999). As a result, there is little capacity for further convergence.That said, we were mainly interested in confirming that no divergence occurred intopics that were not highly discriminating in the first cycle.
Taking into account the outcomes presented, we found strong evidence sup-porting the hypothesis of convergence in science curricula at Grade 8 over the last20 years.
Table 4.23 Classification of countries appearing in consecutive TIMSS surveys
Initial group
Movement between 2003 and 2007 Movement between 2007 and 2015
Group 1 Group 2 Group 1 Group 2
Group 1 2 out of 4 remained
2 out of 4 moved
3 out of 8 remained
5 out of 8moved
(50.00%) (50.00%) (62.50%) (37.50%)
Group 2 4 out of 23moved
19 out of 23remained
4 out of 28 moved
24 out of 28 remained
(17.39%) (82.61%) (14.29%) (85.71%)
Note Gray-shaded cells contain the number and percentage of countries that have been classified inthe same group in two consecutive TIMSS cycles, while the unshaded cells display the number andpercentage of countries that have moved across groups
Table 4.24 Cluster analysis classification of newly entered countries
Group 2007 2015
Group 1 8 out of 31 2 out of 9(25.81%) (22.22%)
Group 2 23 out of 31 7 out of 9(74.19%) (77.78%)
4.2 Cluster Analysis and Discriminant Analysis 69

0
4
8
12
16
20
24
Taught to all pupils Taught to somepupils
Not in the curriculum
a) Interdependence of populations of organisms in an ecosystem (e.g., energy flow, food webs, competition, predation)
and factors affecting population size in an ecosystem
1999 2007 2015
0
4
8
12
16
20
24
Taught to all pupils Taught to somepupils
Not in the curriculum
b) Earth’s processes, cycles, and history (rock cycle; water cycle; weather versus
climate; major geological events; formation of fossils and fossil fuels)
1999 2007 2015
0
4
8
12
16
20
24
Taught to all pupils Taught to somepupils
Not in the curriculum
c) Major organs and organ systems in humans and other organisms
(structure/function, life processes that maintain stable bodily conditions)
1999 2007 2015
0
4
8
12
16
20
24
Taught to all pupils Taught to somepupils
Not in the curriculum
d) Earth in the solar system and the universe (phenomena on Earth - day/night, tides, phases of moon, eclipses, seasons;
physical features of Earth compared to other bodies)
1999 2007 2015
0
4
8
12
16
20
24
Taught to all pupils Taught to somepupils
Not in the curriculum
e) Basic properties/ behaviors of light (reflection, refraction, light and color, simple
ray diagrams) and sound (transmission through media, loudness, pitch, amplitude,
frequency)
1999 2007 2015
Fig. 4.10 Evolution of the distribution of the five most discriminating topics (identified in 2015)between 1999 and 2015
70 4 Results: Evidence for the Globalization of Science …

4.3 Further Analysis Using TIMSS Teacher Questionnaireand Encyclopedia Data
The results outlined in Sects. 4.1 and 4.2 are based on data from the TIMSScurriculum questionnaires. We also used the TIMSS encyclopedias, data from theTIMSS teacher questionnaire and additional data from the TIMSS curriculumquestionnaire to build up a more detailed picture of other aspects of science cur-ricula for a select number of countries (listed in Table 3.3). The objective of thisanalysis was to obtain information on aspects of countries’ implemented sciencecurricula to complement the data gathered on the intended curriculum (from thecoding exercise and cluster and discriminant analyses). The aim was to enablechanges in some aspects of the implemented science curricula to be tracked overtime.
Curriculum features investigated included the instructional time spent teachingscience each year and the percentage of students who have been taught the TIMSSscience topics. Although we intended to explore a number of other curriculumfeatures, the data sources did not support further additional analyses. Features thatinterested us included the emphasis teachers placed on science investigation in theirteaching, the emphasis on different cognitive processes in the science curriculum,and the percentage of instructional time devoted to teaching science.
We encountered a number of difficulties in collecting information on theimplemented science curricula. Firstly, for the 1999 (Grade 8) and 2003 (Grade 4)TIMSS cycles, there were no published TIMSS encyclopedias. The encyclopediaswere only produced from the 2007 cycle onwards. As a result, much of theinformation on participating countries’ science curricula that is available for latercycles was not available for the first TIMSS surveys considered in this report,thereby limiting the comparisons that can be made.
A second challenge was that, in many cases, the relevant items in the teacher andcurriculum questionnaires changed between TIMSS cycles. This makes it impos-sible to directly compare responses between cycles. For example, in each TIMSScycle there is a question that asks about teacher emphasis on science investigation;however, the wording of the question varies. In 2015, the question asked teachers torate how often they emphasized science investigation in their lessons. They couldselect their response from “about half the lessons or more” or “in less than half thelessons”. By contrast, in the 2007 teacher questionnaire, respondents were asked,for seven different science investigation activities, to rate whether the students theytaught had the opportunity to do the activity in about half the lessons or more.These activities included practices such as watching the teacher demonstrate aninvestigation or relating what they learned about science to their daily lives. As thequestions are framed in different ways, it is difficult to make direct comparisons. Weencountered this issue for a large number of the curriculum features that we wereoriginally intending to compare.
We also found that there was a considerable amount of missing data. We hadselected countries for inclusion in this sample on the basis that they had taken part
4.3 Further Analysis Using TIMSS Teacher Questionnaire and Encyclopedia Data 71

in at least two TIMSS cycles but, in a number of cases, countries had not providedthis additional information on the implemented curriculum. For example, in 2007,there was no information provided by New Zealand on the percentage of studentstaught the TIMSS science topics for Grade 4 or Grade 8. Again, this made com-parisons challenging, both for a single country over time and between countries inthe same cycle. As a consequence, and because of the significant caveats that wouldhave applied to any conclusions drawn from these analyses, we decided not topursue further in-depth analyses based on the teacher and curriculumquestionnaires.
Reference
Harlen, W. (Ed.). (2010). Principles and big ideas of science education. Hertfordshire: Associationfor Science Education. Retrieved from https://www.ase.org.uk/documents/principles-and-big-ideas-of-science-education/.
Open Access This chapter is licensed under the terms of the Creative CommonsAttribution-NonCommercial 4.0 International License (https://creativecommons.org/licenses/by-nc/4.0/), which permits any noncommercial use, sharing, adaptation, distribution and reproductionin any medium or format, as long as you give appropriate credit to the original author(s) and thesource, provide a link to the Creative Commons license and indicate if changes were made.The images or other third party material in this chapters are included in the chapter’s Creative
Commons license, unless indicated otherwise in the credit line to tha material. If material is notincluded in the chapter’s Creative Commons license and your intended use is not permitted bystatutory regulation or exceeds the permitted use, you will need to obtain permission directly fromthe copyright holder.
72 4 Results: Evidence for the Globalization of Science …
Chapter 5The Globalization of Science Educationand Science Curricula: Discussionand Conclusions
Abstract In this exploration of the globalization of science curricula, a codingexercise, cluster analysis and discriminant analysis of twenty years of TIMSS datawere used to answer three research questions: (1) Have there been changes inintended science curricula over the last 20 years? (2) If changes do exist, do theysupport the hypothesis that science curricula are becoming increasingly similaracross countries? (3) Are there groups of countries where curricula are increasinglysimilar; can the basis of an international core curriculum be identified? The analysisprovides strong evidence to suggest that there have been changes to countries’intended science curricula. The coding exercise found that all countries in theanalysis had made changes to their intended curricula, although the extent of cur-ricular changes varied considerably between countries. Cluster and discriminantanalyses showed that over time there was a tendency for countries to cluster intoone particular grouping based on responses to the TIMSS curriculum questionnaire.The number of TIMSS science topics that could be considered core to the curriculaof the majority of participating countries increased over time, particularly at Grade4, suggesting that science curricula are becoming increasingly similar acrosscountries. Among the two groups of countries identified by the cluster and dis-criminant analyses, there was a clear tendency for one group to include a widerscience curriculum encompassing a greater range of science topics than the othergroup. At Grade 8 the results strongly suggest that there has been convergence inscience curricula over time. In terms of whether an international core curriculumcan be identified, there are some TIMSS science topics which could be consideredcore to the curricula of most countries. Assessment is likely to play an importantrole, as high-stakes assessment is likely to influence science curricula and what istaught in schools.
Keywords Core science curriculum � Curriculum change � Curriculumconvergence � Curriculum development � Globalization � Science curriculumScience education � Trends in Mathematics and Science Study (TIMSS)
© International Association for the Evaluation of Educational Achievement (IEA) 2018O. Stacey et al., The Globalization of Science Curricula, IEA Researchfor Education 3, https://doi.org/10.1007/978-3-319-71532-2_5
73

5.1 Have There Been Changes in Intended ScienceCurricula Over the Last 20 Years?
Unsurprisingly, the intended science curriculum in many countries has clearlychanged over the last 20 years due to multiple factors, including advances in sci-entific theory, changes in educational and assessment practices, changes to gov-ernmental emphases in education, as well as the influence of internationallarge-scale assessments such as TIMSS and other globalizing factors (as discussedin Sect. 2.2). Our investigation therefore prompted additional but related supple-mentary questions:
• What are the extent and scope of changes to science curricula?• Are there recognizable patterns to these changes that enable inferences to be
drawn about which factors are important for different countries in influencingthe specific nature of the changes that are made to their science curricula?
Before considering these questions, when drawing conclusions and makinginferences from our analyses, note that the reference dataset we used was theTIMSS curriculum questionnaire. This questionnaire records, for each participatingcountry, whether their science curriculum covered the individual topics within theTIMSS framework during the specified year of study. We identified science topicsthat mapped across all TIMSS cycles considered in this study; 20 science topicswere defined for Grade 4 and 21 for Grade 8. The TIMSS questionnaire does not,however, record the topics included in a country’s curriculum that are outside theTIMSS science framework, nor does it record information on topics that are presentin the TIMSS science framework but taught to a year group other than the onespecified in the framework. As a consequence, this is not a measure of the totalscience curriculum for each country, but a measure of the similarity of theirintended science curriculum to the TIMSS framework.
5.1.1 The Scope and Extent of Changes to ScienceCurricula as Measured by the TIMSS CurriculumQuestionnaire Datasets
In Sect. 4.1, we presented the overall extent of the changes that countries havemade to their curricula, based on comparisons that can be made between countriesthat have recorded curriculum questionnaires for the two TIMSS cycles in question(Tables 4.5 and 4.6). From this we conclude that:
• For most countries, the majority of TIMSS science topics remained stable (i.e.their inclusion or omission from the countries’ intended curricula did notchange) across each pairwise comparison.
74 5 The Globalization of Science Education …

• TIMSS science topics were more likely to be added to national curricula thanremoved. This may indicate a trend towards alignment of national curricula withthe TIMSS science framework, suggesting that, when introducing new topics totheir curricula, countries may favor the TIMSS framework topics over otherpriorities.
• There were a higher number of changes evident at Grade 4 as compared toGrade 8. A possible explanation for this is that a much greater proportion of theGrade 8 topics were already included in participant countries’ Grade 8 curriculathan the equivalent proportion of Grade 4 topics. This suggests that there wasgreater “capacity for change” in the Grade 4 curricula. In addition, Grade 4 ismuch earlier in the learning development of individuals and therefore moredistant from the pressures of the end-of-school qualifications that prepare stu-dents for entry into the (globalized) jobs market. This might mean that there arefewer external pressures for a standardized curriculum at Grade 4 than at Grade8, allowing greater experimentation and therefore a more fluid curriculum.
• A small number of topics show a changed emphasis between TIMSS cycles foreach grade. This is where topics may be introduced to a restricted range ofstudents (usually the more able) or extended from a restricted range to the entirecohort. The indication is that this type of change is much less prevalent thanadding or removing topics for the entire cohort, perhaps because of the addi-tional logistical complications of defining and resourcing the delivery of aspecific curriculum to subgroups within a cohort.
5.1.2 Patterns of Curricular Changes Made by DifferentCountries as Measured by the TIMSS CurriculumQuestionnaire Datasets
As it is clear that there have been changes to the curricula of different countriesacross the TIMSS cycles, analyzing how these changes vary across differentcountries, and identifying any specific patterns in the changes that countries haveintroduced to their science curricula may provide important insights into the factorsthat may be driving such changes.
In order to investigate further, we focused our comparison of the curricula oncountries that participated in the first available cycle of TIMSS (2003 for Grade 4and 1999 for Grade 8) and the most recent cycle (2015 for both grades). Werecorded all changes that had been made, including changes in the emphasis of atopic in the curriculum (namely changing a topic that had been specified as only forthe most able students to a topic specified as appropriate for all students).
Accordingly, we grouped countries by the number of changes they made to theircurricula with topics from the TIMSS framework (see Chap. 4, Tables 4.1 and 4.2).A greater proportion of countries made significant changes to their curriculum atGrade 4 than Grade 8, with 11 out of 20 countries at Grade 4 making changes to at
5.1 Have There Been Changes in Intended … 75

least seven of the TIMSS framework topics (equivalent to a third of the frameworktopics). In contrast, only four of 24 countries at Grade 8 made a similar level ofchanges. This supports our earlier conclusion (Sect. 5.1.1) that changes are morecommon at Grade 4 than Grade 8.
Having identified the countries that made the greatest number of changes to theircurricula between the specified time points, we investigated any apparent patternsthat may explain why these changes were made. In our search for evidence of theinfluence of globalization effects, a particular focus was placed on whether theparticipation of countries in international large-scale assessments influenced thechanges to their curricula, and specifically whether their participation and perfor-mance in TIMSS cycles had any influence on the changes they made. Robitailleet al. (2000) and Klieger (2015) both presented evidence that some countries dorespond to their performance in international large-scale assessments with specificchanges to their curricula.
The investigation focused on the countries that had made changes to at least athird of the relevant TIMSS science topics and compared their baseline performancein TIMSS, namely in 2003 (at Grade 4) or in 1999 (at Grade 8), to analyze the effectof changes at that grade. We used these baseline cycles as these provided the firstinternationally comparative data to governments of the performance of their stu-dents, and were therefore likely to have prompted discussion and review of thecurriculum and how it may have been linked to performance in TIMSS. We alsolooked at the ranking of each of the countries in the TIMSS cycle to investigatewhether performance in TIMSS could be related to the extent to which a countrychanged its science curriculum.
The IEA consistently emphasizes that the specific rankings in TIMSS areinaccurate, as a country’s average scale score is presented as a range of values.The IEA also makes it clear that, when comparing performance, countries can onlybe judged as ranking separately if their scores are separated by at least the margin oferror of measurement. However, within countries and in the international media, thenature of the ranking is often misunderstood and reported without such cautions,which may unduly influence policymakers into making changes to curricula.
Based on their TIMSS ranking, the 14 countries identified as having changed atleast seven major topics of their curriculum divide into three distinct groups. Thesecan be defined as:
• Top-end competitors: Countries that ranked between number two and numberfive in the rankings, but did not attain the top ranking, and so were perceived ascompeting for this in future cycles (Table 5.1).
• Mid-ranking changers: Countries that achieved scale scores above the interna-tional average but below the top five countries. These countries may be per-ceived as seeking to improve their position in the rankings (Table 5.2).
• Below average responders: Countries that achieved scores below the interna-tional average in the baseline cycle and have sought to respond with significantreform of their curriculum (Table 5.3).
76 5 The Globalization of Science Education …

Unexpectedly, we identified a significant number of changes to the curricula ofcountries with top-end performance. It could be expected that high-achievingcountries would have a curriculum enabling high performance in TIMSS and wouldtherefore be less likely to require multiple curriculum changes. A clue to the force
Table 5.1 Top-end competitors
Grade Country Rank inbaselineTIMSS
Numberofchanges
Type ofchanges
Baselineaveragescale score
2015averagescale score
4 ChineseTaipei
2/25 10 Adder 551 555
4 Japan 3/25 7 Adder 543 569a
4 HongKong
4/25 9 Balancer 542 557
8 Singapore 2/38 8 Cutter 568 597a
8 Japan 4/38 4 Adder 550 571a
8 Republicof Korea
5/38 6 Balancer 549 556
KeyAdder = a country where curriculum changes resulted in more TIMSS science topics appearing inthe country’s intended science curriculumBalancer = A country where curriculum changes resulted in roughly equal number of TIMSSscience topics being added and removed from the intended science curriculumCutter = A country where curriculum changes resulted in fewer TIMSS science topics appearingin the country’s intended science curriculumaAverage scale score improved by at least 20 points from baseline to 2015 TIMSS. 20 pointsrepresents one-fifth of a standard deviation in TIMSS. An improvement in scale score was selectedas opposed to an improvement in ranking as this is directly comparable across cycles
Table 5.2 Mid-ranking changers
Grade Country Rank inbaselineTIMSS
Numberofchanges
Type ofchanges
Baselineaveragescale score
2015averagescale score
4 Australia 11/25 12 Cutter 521 5244 New
Zealand12/25 8 Balancer 520 506
4 Belgium(Flemish)
13/25 15 Adder 518 512
KeyAdder = a country where curriculum changes resulted in more TIMSS science topics appearing inthe country’s intended science curriculumBalancer = A country where curriculum changes resulted in roughly equal number of TIMSSscience topics being added and removed from the intended science curriculumCutter = A country where curriculum changes resulted in fewer TIMSS science topics appearingin the country’s intended science curriculum
5.1 Have There Been Changes in Intended … 77

for change is that the countries that achieved the top rankings, Singapore at Grade 4and Chinese Taipei at Grade 8, instituted only minimal change following their highperformance at that grade. It is therefore of interest that these same countriesinstituted significant changes in the alternate grades where they both achievedsecond place. One possible reason is that performing just below the top spot hasprompted a review of the curriculum in order to be more competitive in futureTIMSS cycles. All countries that fall into this group are also geographically close.This might reflect a competitive effect amongst neighbors, or may indicate specificregional cultural influences.
The response in terms of the nature of curriculum change varied. The majorityresponse was to add TIMSS science topics to the curriculum. Singapore, however,removed or reduced the emphasis of eight TIMSS topics in its Grade 8 curriculum(which is in contrast to its treatment of the Grade 4 curriculum, as discussed). HongKong and the Republic of Korea rebalanced their curricula by adding and removingTIMSS topics. However, the changes made to the topics taught in each country aredependent on the nature of the “baseline” curriculum for that country, so conclu-sions about the preferred approach are difficult to make.
As we were also interested in whether any of the specific changes were con-nected to the performance of a country in future TIMSS cycles, we also recordedthe average scaled score for these countries in the baseline and 2015 cycles.Although all of these countries maintained their high ranking in the 2015 cycle,only Singapore at Grade 8 and Japan at both Grade 4 and Grade 8 improved their
Table 5.3 Below average responders
Grade Country Rank inbaselineTIMSS
Numberofchanges
Numberof topicsadded
Baselineaveragescale score
2015averagescale score
4 Cyprus 19/25 7 Adder 480 4814 Norway 20/25 10 Cutter 466 538a
4 Armenia 21/25 7 Adder 437 –
4 Morocco 25/25 13 Adder 304 352a
8 Israel 26/38 11 Adder 468 507a
8 Morocco 37/38 10 Balancer 323 393a
8 SouthAfrica
38/38 12 Adder 243 358a
KeyAdder = a country where curriculum changes resulted in more TIMSS science topics appearing inthe country’s intended science curriculumBalancer = A country where curriculum changes resulted in roughly equal number of TIMSSscience topics being added and removed from the intended science curriculumCutter = A country where curriculum changes resulted in fewer TIMSS science topics appearingin the country’s intended science curriculumaAverage scale score improved by at least 20 points from baseline to 2015 TIMSS. 20 pointsrepresents one-fifth of a standard deviation in TIMSS. An improvement in scale score was selectedas opposed to an improvement in ranking as this is directly comparable across cycles
78 5 The Globalization of Science Education …

scale score by a noteworthy amount (more than 20 points) over this period. It is notpossible to say which specific factors contributed to improvement in these scores,but it is likely that curriculum effects played an important part.
Another cluster of countries grouped in the middle of the ranking table mademultiple curricular changes at Grade 4 but not at Grade 8 (Table 5.2). The moststriking aspects of this group are that two of the countries changed more than half ofthe TIMSS science topics in their curriculum, but that, despite these large-scalechanges, there was minimal impact on the average scaled score. For example, onlyAustralia achieved a slightly higher score in TIMSS 2015 than the baseline, withNew Zealand and Belgium achieving a lower score in the later cycle.
The “below average responders” group is where we expected curriculum changeto be most apparent (Table 5.3). We assumed that countries might be likely toreflect on poor performance in the baseline TIMSS survey and use this as animpetus to change policy, whilst using the TIMSS framework as a model formodifying their national curricula. This is the process that Klieger (2015) detailedfor Israel. In line with this hypothesis, the majority of “below average responders”have made a significant number of changes to their curriculum and added TIMSScontent. The exceptions to this case were Norway, where the curriculum changesresulted in the removal of nine TIMSS science topics from its curriculum, andMorocco, where the curriculum changes resulted in an equal number of TIMSSscience topics being added and removed from its science curriculum at Grade 8.
In terms of the impact of these changes, the “below average responders” haveshown significant improvement in their TIMSS average scale scores, with Norwayimproving by 72 points at Grade 4 and moving to a position well above theinternational average. Israel also moved to above the international average at Grade8 in 2015. That said, both Norway and Israel achieved scores close to the inter-national average in their baseline year. Morocco (Grade 4 and Grade 8) and SouthAfrica (Grade 8) also saw significant improvements in average scale score, withSouth Africa improving by 115 points over the time period. That said, thisimprovement was based on a poor baseline score and ranking, and South Africaremained the lowest ranked country in the 2015 TIMSS cycle. Morocco similarlyonly gained one and two ranking places at Grade 4 and Grade 8, respectively.
Although these findings suggest that closer adherence to the science curriculumrepresented by the TIMSS framework has boosted performance for the poorestperforming countries in the TIMSS international assessment, causality cannot beinferred. A wide range of other potential variables, which have not been examinedin this investigation, could contribute to this improvement. That said, improvementwould be expected as the curriculum and assessment became much better alignedwith the TIMSS framework. The analysis also suggests that countries value theimprovements that this alignment can provide and that they see the TIMSSframework as a suitable model on which to base their curriculum development.
5.1 Have There Been Changes in Intended … 79

5.2 If Changes Do Exist, Do They Support the HypothesisThat Science Curricula Are Becoming IncreasinglySimilar Across Countries?
Addressing this research question was contingent on countries’ intended sciencecurricula changing over the past 20 years. Our evidence (Sect. 5.1) revealed thatthis has been the case for many countries, so the next step was to determine whetherthese changes in intended science curricula supported the hypothesis that sciencecurricula were becoming increasingly similar across countries. Our analyses pro-vided mixed evidence to support this hypothesis.
5.2.1 Evidence That Science Curricula Are BecomingIncreasingly Similar
Our analysis suggests that, in some respects, the science curricula of countriesparticipating in TIMSS are becoming increasingly similar. Firstly, the coding ofcurriculum questionnaires indicates that over time, at both Grade 4 and Grade 8, thenumber of TIMSS science topics that were included in countries’ intended sciencecurricula was increasing, with countries on average adding more topics to theirscience curricula than they are removing (see Chap. 4, Tables 4.5 and 4.6).
One consequence of this was that a greater number of the TIMSS science topicswere included in the majority (over 80%) of participating countries’ science cur-ricula in the 2015 TIMSS cycle than in earlier cycles. The finding is consistent forboth Grade 4 and Grade 8. At Grade 4, seven of the 21 TIMSS science topics werecovered by more than 80% of participating countries in 2015, compared to only twoof the TIMSS science topics in 2003. The trend was less pronounced at Grade 8,with an increase from 12 to 14 of the 20 TIMSS science topics included in over80% of participating countries’ curricula. In Grade 4, in addition, there was also anassociated drop in the number of TIMSS science topics that only appeared in theminority (less than 50%) of participating countries’ curricula. This trend was notobserved at Grade 8 as, in the baseline (1999) TIMSS survey, there were no TIMSSscience topics that appeared in less than 50% of participating countries’ curricula.
These results provide evidence that countries’ curricula are becoming moresimilar over time, and that these changes appear to be increasing the likelihood ofthe same science topics being included in each country’s curriculum. When inter-preting the outcomes of this analysis, it is important to acknowledge that thenumber and composition of countries in each of the TIMSS cycles varies and thatthis has the potential to impact the results. It is also important to acknowledge thatthe finding that science curricula are becoming increasingly similar relates only tothe curriculum as measured against the science topics included in the TIMSScurriculum questionnaire. Whilst the science topics included in the TIMSSframework are broad and balanced in terms of coverage of different aspects of
80 5 The Globalization of Science Education …

science, they are not an exhaustive list of the potential science topics that could beincluded in a country’s curriculum. Additionally, we have no information regardingthe science curricula of countries that have not participated in TIMSS and so cannotmake any claims about the extent to which non-participating countries’ sciencecurricula are becoming more similar over time.
The outcomes of the cluster analysis and discriminant analysis provide someevidence to support the conclusion that science curricula are becoming more similaracross countries participating in TIMSS, with the evidence being stronger at Grade8 than at Grade 4. The analyses provide strong evidence of convergence in thescience curricula of countries participating at Grade 8 between 1999 and 2015, withthe number of countries clustering into Group 2 growing at the expense of thenumber clustering into Group 1. In 1999, approximately half of countries clusteredinto Group 1 and half into Group 2. By contrast, in 2015, over 90% of countriesclustered into Group 2 and less than 10% into Group 1 (see Chap. 4, Table 4.19).This suggests that, over time, at Grade 8, changes in intended science curricula areleading to an increasing number of countries with similar profiles in terms of thetopics they do and do not include in their science curricula.
At Grade 4, however, the strength of evidence from the cluster analysis anddiscriminant analysis is less strong. The discriminant analysis suggests that changesin participating countries’ science curricula have led to only mild convergence overtime. In 2003, 55% of countries clustered into Group 1 and 45% into Group 2,whereas in 2015, 70% of countries clustered into Group 1 and 30% into Group 2(see Chap. 4, Table 4.13). However, there was some movement of countriesbetween the two groups across the TIMSS cycles considered, suggesting lessconvergence and more fluidity over time than at Grade 8 (see Chap. 4, Table 4.14).This may be because the science curriculum at primary level in some countries isless prescribed than at secondary level, where the subject usually has a higher statusand profile and is often associated with high-stakes assessment.
One additional piece of evidence from the cluster and discriminant analysis,which supports the hypothesis that science curricula are becoming increasinglysimilar over time, comes from the science topics that were most important inpredicting which group a country clustered into. For example, in 1999 at Grade 8the science topic that was most important at determining which group a countryclustered into was “chemical change (transformation of reactants, evidence ofchemical change, conservation of matter, common oxidation reactions–combustion,rusting, tarnishing)”. By contrast, in the 2015 TIMSS cycle, this was only thefifteenth most important topic in determining which group a country clustered in.Of the 21 countries participating in all three TIMSS cycles considered in thisinvestigation, in 1999, this topic was included in 11 out of the 12 Group 2 coun-tries’ intended science curriculum. By contrast, it was only included in three of thenine Group 1 countries’ curriculum (Chap. 4, Fig. 4.5). However, in 2015, themajority of countries in both groups (17 out of 21) included this topic in theirintended curriculum for all students (Chap. 4, Fig. 4.6).
The findings from our coding exercise and cluster and discriminant analyses areconsistent with findings from the literature review. Robitaille et al. (2000), for
5.2 If Changes Do Exist, Do They Support the Hypothesis That Science … 81

example, found that, in response to the 1995 TIMSS cycle, a number of countries,such as Iran and Kuwait, changed the content of their science curricula to incor-porate new science topics on the environment. These changes, in turn, led to theirscience curricula becoming more aligned to the TIMSS framework. Similarly,revisions to the Israeli science curriculum have led to closer alignment between thisand the TIMSS science framework (Klieger 2015). As countries’ science curriculachange and become more aligned to the TIMSS framework, one consequence is thatthe intended science curricula of different countries will converge.
5.2.2 Evidence That Suggests Science CurriculaAre Not Becoming Increasingly Similar
Although some aspects of the analyses and literature review supported thehypothesis that science curricula are becoming increasingly similar across coun-tries, other aspects of the analysis suggested otherwise. Firstly, as already discussed,based on the outcomes of the cluster and discriminant analyses, the evidence forconvergence in science curricula at Grade 4 was weaker than at Grade 8. Thishighlights the important point that it is too simplistic to make a broad generalizationthat science curricula are becoming increasingly similar across countries over time.The number of countries, phase of schooling (e.g. primary versus secondary) andtime scale considered, all affect the conclusions that can be drawn with regard tothis hypothesis.
Secondly, the majority of our analysis has focused on intended science curriculaand, in other aspects of the curriculum, there is little evidence to support the notionthat science curricula are becoming increasingly similar over time. For example, interms of the amount of time spent teaching science, wide variations exist in themean number of hours identified in each country, with no evidence of this con-verging over time. For example, in 2015 at Grade 4, the average time spent teachingscience each year (as identified from the TIMSS teacher questionnaire) in Qatar wasalmost three times as much as in New Zealand. At Grade 8 a similar patternemerged.
In addition, although the responses to the curriculum questionnaire indicated atendency for more TIMSS science topics to be included in countries’ intendedscience curricula in both grades over time, the teacher questionnaire responsespainted a slightly different picture. For example, although we have not reported indetail on the results of our additional analysis of selected countries for the reasonscited in Sect. 4.4, we did find that the average percentage of students who had beentaught the TIMSS science topics was slighter higher for both Grade 4 and Grade 8in the baseline cycles (1999 for Grade 8, and 2003 for Grade 4) than in the mostrecent 2015 cycle. This suggests that, although there may be evidence to support thehypothesis of the intended science curriculum becoming increasingly similar overtime, this is not necessarily reflected in the implemented science curriculum
82 5 The Globalization of Science Education …

experienced by students. As research identified in the literature review suggested,although curricula can be centrally prescribed, the way in which they are interpretedand enacted can vary widely at the local level (Astiz et al. 2002; Cogan et al. 2001).
The literature review and outcomes of the discriminant analysis also suggestthat, although science curricula may, in some respects, be becoming increasinglysimilar over time, the changes are not necessarily leading to uniformity, as countriesstill cluster into distinct groups. For both grades and in all cycles, our discriminantanalysis produced two groupings. Other studies using a similar approach alsoidentified multiple groupings, and this is true for both science (Kjaernsli and Lie2008) and mathematics (Zanini and Benton 2015). These studies found a tendencyfor countries to group based on geographic and cultural lines, suggesting that thesefactors still play an important role in aspects of the curriculum for both science andmathematics.
5.3 Are There Groups of Countries Where Curricula AreIncreasingly Similar; Can the Basis of an InternationalCore Curriculum Be Identified?
We investigated whether there was any evidence that science curricula werebecoming increasingly similar over time in certain groups of countries to establishwhether the basis of an international core science curriculum could be identified.
5.3.1 Are There Groups of Countries Where ScienceCurricula Are Increasingly Similar?
We have already discussed the outcomes of the cluster and discriminant analyses(Sect. 5.2), which provide some evidence to suggest increased similarity of coun-tries’ science curricula over time.
Consideration of the science topics that most contribute to the country groupingsenables the curricula of countries within each group to be categorized. Using theTIMSS 2015 data and the cluster and discriminant analysis for this year at bothGrade 4 and Grade 8, it was possible to identify and characterize the curricula of thetwo groups of countries.
At Grade 4 in 2015, the main differences between the science curriculum profilesof Group 1 and Group 2 countries could be categorized by Group 1 countriestending to cover a greater number of science topics than Group 2 countries. Thefollowing topics, for example, were likely to be included in Group 1 countries’science curricula and unlikely to be present in Group 2 countries’ science curricula:
5.2 If Changes Do Exist, Do They Support the Hypothesis That Science … 83

• common sources of energy and uses of energy• understanding that some characteristics are inherited and some are the result of
the environment• chemical changes in everyday life• understanding what fossils are and what they can tell us.
Several of these topics come from the physical sciences area of the TIMSSscience framework. This suggests that countries in Group 1 may have a morebalanced and broad focus to their science curriculum. Countries in Group 2 appearto have less of a focus on physical science topics and instead focus on life sciencestopics. It may be that physical science topics receive less attention as they can bemore abstract and less concrete than some of the topics in life and Earth science,making them less likely to be taught at Grade 4. In addition, the life sciences topic“understanding that some characteristics are inherited and some are the result of theenvironment” is a relatively advanced concept for Grade 4 children and so it isperhaps unsurprising that it is not included in the curricula of many countries inGroup 2.
A similar pattern emerged at Grade 8 in 2015, where Group 2 countries tended toinclude a greater number of science topics in their curriculum than Group 1countries. The following four topics for example were likely to be included inGroup 2 countries’ science curricula and unlikely to be present in that of Group 1countries:
• interdependence of populations of organisms in an ecosystem• major organs and organ systems in humans and other organisms• Earth’s processes, cycles, and history• Earth in the solar system and the universe.
In contrast to the Grade 4 topics, none of these topics were in the physicalsciences areas of the curriculum (chemistry and physics). It is not so obvious whythese topics may differ so much between the two groups, particularly as the twobiology topics cover quite different aspects of the subject, one ecological and onecovering human biology. It may be that the two Earth science topics, particularlyEarth’s processes, cycles, and history, may be covered by Group 2 countries insubjects other than science, for example in geography. This may explain theimportance of this topic in the clustering, although this cannot be said for certain.
This clustering pattern and the finding that there are distinct groups of countrieswith similar curricula is consistent with other research, such as that conducted byKjaernsli and Lie (2008), who investigated the achieved curriculum in differentcountries using item responses to TIMSS science questions for TIMSS 2003 data.This study also identified a number of distinct groupings of countries that clusteredtogether. Similar patterns have emerged on analysis of TIMSS mathematics data(Rutkowski and Rutkowski 2009; Zanini and Benton 2015).
Where our data differs from these studies, however, is that the cluster groupingsin previous studies have tended to identify a larger number of country groupings,whereas this analysis has identified only two. Additionally, the cluster groupings in
84 5 The Globalization of Science Education …

previous studies have typically grouped along geographic or linguistic lines, forexample an Arabic grouping, an East Asian grouping, an Anglophone grouping etc.With only two groups identified in our study for each cycle, and therefore a largernumber of countries present in each group, it is more difficult to make general-izations about the geographic, cultural and linguistic characteristics of countries.For example, at Grade 4 in 2015, Anglophone and Scandinavian countries arepresent in both groups.
At Grade 8 in 2015, the proportion of countries in Group 2 is greater than inGroup 1, which makes characterization of this group easier. Group 1 did not tend tocontain Anglophone countries and tended to have a higher number of North Africanand Middle Eastern countries, including Morocco, Lebanon, Dubai and Bahrain. Inaddition, no Western European countries were present, suggesting that at this gradethere was some country clustering along geographic and cultural lines.
Although the cluster and discriminant analysis provides evidence to suggest thatthere are distinct cluster groupings and that there are defined curriculum charac-teristics of countries in each cluster, it is important to note that there is fluidity inthese groupings. For example, at Grade 4 in particular, there is movement ofcountries between groups between each TIMSS cycle. This suggests that, whilethere is increasing similarity in countries’ curricula, countries still have the potentialto change and shift their curriculum profile and characteristics between groupings.
5.3.2 Can the Basis of an International Core ScienceCurriculum Be Identified?
In addition to identifying country groupings where there is convergence of sciencecurricula, the second element of this research question pertains to whether the basisof an international core curriculum can be identified. This research provides evi-dence to suggest that the basis of a core international science curriculum can beidentified. For example, the coding exercise has identified TIMSS science topicswhich could now be described as core (included in over 80% of participatingcountries’ curricula) at both Grade 4 (Table 4.9) and Grade 8 (Table 4.10).
At Grade 4, the number of TIMSS science topics taught in the majority ofparticipating countries increased over time from two in 2003 to seven in 2015, outof a total of 21 topics (Table 4.7). At Grade 8, there was a more modest increase,from 12 to 14, out of a total of 20 topics (Table 4.8). This growth in the number oftopics taught in the majority of participating countries, particularly at Grade 4,suggests that a core science curriculum is emerging amongst countries. The seven“core” topics at Grade 4 in 2015 consisted of four life sciences topics, one physicalscience and two Earth science topics. This is consistent with findings from thecluster and discriminant analysis where Group 2 countries tended not to teach someof the physical sciences topics, i.e. it is unsurprising that fewer physical sciencestopics are represented in the core science topics at Grade 4.
5.3 Are There Groups of Countries Where Curricula Are … 85

Two of the topics which increased most in terms of the proportion of countriesincluding them in their science curricula at Grade 4 were “human health” (whichhad an increase of 29 percentage points between 2003 and 2015), and “under-standing that weather can change from day to day, from season to season, and bygeographic location” (which had an increase of 27 percentage points). These topicsreflect major global issues facing the world today. For example, the importance of ahealthy diet and exercise can be viewed in light of rising levels of obesity which areaffecting many developed countries across the world. Additionally, an under-standing of weather patterns and variations is crucial to an appreciation of climatechange.
At Grade 8 the core science topics were spread more evenly across the differentscience subjects. In TIMSS 2015, four biology topics, three chemistry topics, threephysics topics and four Earth science topics could be considered core. This mayreflect the fact that, at secondary level, as students are introduced to topics such asthe particle model and the structure of atoms, more aspects of chemistry and physicsbecome accessible to students and can be more readily included in sciencecurricula.
The presence of an international core science curriculum and the evidence fromthis study which suggests that this core curriculum appears to be growing over timeis consistent with research highlighted in the literature review identifying thatinternational large-scale assessments are leading to the standardization of educationsystems (Spring 2008), and the suggestion that these assessments are facilitatingpolicy borrowing and the homogenization of education over time (Rutkowski andRutkowski 2009). There is the potential, in future, that as more countries participatein surveys such as TIMSS and compare their outcomes on these assessments withthose of other countries, curriculum reform will drive further convergence of cur-ricula, leading to a stronger core international science curriculum. There is also thepotential that new core science topics will emerge, based on global issues andchallenges, or to better reflect advances in science or in areas of science with moreeconomic potential, such as genetics and genomics.
Although this research suggests that it is possible to identify the basis of aninternational core science curriculum, there are a number of caveats which it isimportant to acknowledge. Firstly, the core curriculum identified here is defined onthe basis of countries that have taken part in at least one of the TIMSS cyclesconsidered in this report. Whilst the number of participating countries is high, thesample cannot be considered representative of all countries, with a higher numberof economically developed countries participating in TIMSS and a relatively smallnumber of countries from Africa and South America for example. As a result, wecan only state that there is evidence of a core curriculum amongst countries thatparticipate in TIMSS.
Secondly our analysis only considers science content as opposed to other aspectsof the science curriculum such as the emphasis placed on science investigation, orthe skills emphasized within the curriculum, such as scientific reasoning orproblem-solving. Although we attempted to collect information on these aspects ofthe curriculum, due to inconsistencies between TIMSS cycles in the way this
86 5 The Globalization of Science Education …

information was collected, it was not possible to make such comparisons. Thesefeatures of the science curriculum are very important, but it is not possible withinthe limitations of this analysis to establish whether there are any international corestandards with regard to the curriculum emphasis placed on science investigation oron scientific reasoning or problem-solving skills.
A further challenge and caveat is that our judgement of whether there is evidenceto support the basis of an international core curriculum uses the TIMSS curriculumquestionnaire responses. It has already been noted that the accuracy of thesequestionnaires and how well they reflect school curricula will vary betweencountries for several reasons. Firstly, in all countries there will be variation in theway the curriculum is interpreted and enacted in schools. Additionally, in somecountries, particularly those with a federal structure, different curricula are likely tobe in place in different states or provinces. As a result, a single curriculum ques-tionnaire response for these countries is unlikely to accurately reflect the curriculumcontent of each state or province within the country.
The curriculum questionnaire provides information on whether a countryincludes a particular topic in its science curriculum at Grade 4 and Grade 8. Whilstthis provides a useful summary of what is included in the curriculum, it ishigh-level information, and does not provide information about the level of sci-entific detail included for the topic. For example, the exact content of the Grade 8topic on cell structure and function could vary considerably between countries. Insome countries, the curriculum could simply specify the basic structure and func-tion of animal and plant cells, whilst in others, the curriculum may require moredetailed knowledge of cell organelles and the specialization of cells for differentroles. Therefore, whilst we have identified common core topics taught in themajority of participating TIMSS countries, there could still be wide variation inparticular topics between countries.
Finally, whilst we have identified topics that could be considered part of aninternational core science curriculum at Grades 4 and 8, this analysis has not takeninto account how countries assess their science curriculum. Assessment is likely toplay an important role as high-stakes assessment is likely to influence the sciencecurriculum and what is taught in schools. Again, due to inconsistencies in the waythe assessment questions in the TIMSS teacher and curriculum questionnaires havebeen phrased over multiple cycles, it has not been possible to compare assessmentarrangements for science at Grades 4 and 8. Obtaining this information would beilluminating as it would identify whether there are common or core approaches toassessing the science curriculum at Grades 4 and 8, in addition to the core topicsincluded within assessment.
5.3 Are There Groups of Countries Where Curricula Are … 87

References
Astiz, M., Wisemand, A., & Baker, D. (2002). Slouching towards decentralization: Consequencesof globalization for curricular control in national education systems. Comparative EducationReview, 46(1), 66–88.
Cogan, S., Wang, H., & Schmidt, W. (2001). Culturally specific patterns in the conceptualizationof the school science curriculum: Insights from TIMSS. Studies in Science Education, 36, 105–133.
Kjaernsli, M., & Lie, S. (2008). Country profiles of scientific competencies in TIMSS 2003.Education Research and Evaluation, 14, 73–85.
Klieger, A. (2015). Between two science curricula: The influence of international surveys on theIsraeli science curriculum. The Curriculum Journal, 26(3), 404–424.
Robitaille, R., Beaton, A., & Plomp, T. (Eds.). (2000). The impact of TIMSS on the teaching andlearning of mathematics and science. Vancouver: Pacific Educational Press.
Rutkowski, L., & Rutkowski, D. (2009). Trends in TIMSS responses over time: Evidence ofglobal forces in education? Educational Research and Evaluation, 15(2), 137–152.
Spring, J. (2008). Research on globalization and education. Review of Educational Research,78(2), 330–363.
Zanini, N., & Benton, T. (2015). The roles of teaching styles and curriculum in mathematicsachievement: Analysis of TIMSS 2011. Research Matters, 20, 35–44.
Open Access This chapter is licensed under the terms of the Creative CommonsAttribution-NonCommercial 4.0 International License (http://creativecommons.org/licenses/by-nc/4.0/), which permits any noncommercial use, sharing, adaptation, distribution and reproduction inany medium or format, as long as you give appropriate credit to the original author(s) and thesource, provide a link to the Creative Commons license and indicate if changes were made.The images or other third party material in this chapters are included in the chapter’s Creative
Commons license, unless indicated otherwise in the credit line to tha material. If material is notincluded in the chapter’s Creative Commons license and your intended use is not permitted bystatutory regulation or exceeds the permitted use, you will need to obtain permission directly fromthe copyright holder.
88 5 The Globalization of Science Education …

Chapter 6Future Directions and Topics for FurtherResearch into the Globalization of ScienceCurricula
Abstract The impacts of globalization on science education and curricula are ofconsiderable interest internationally, not least in terms of preparing a nation’sstudents for employment in a rapidly changing world. This study was not a measureof the total science curriculum for each country considered, but a measure of thesimilarity of their intended science curriculum to the Trends in Mathematics andScience Study (TIMSS) framework; further research into the effects on the sciencecurricula of countries that have not participated in TIMSS or using data from otherrelevant large-scale assessments would add an additional dimension to under-standing the globalization of science curricula. Research exploring the processes bywhich countries embark on science curriculum reform would be an importantavenue for further work in order to gain a better understanding of why countriesdecide to make the changes they do.
Keyword Globalization � Science curriculum � Science educationTrends in Mathematics and Science Study (TIMSS)
Making use of the extensive IEA TIMSS datasets has enabled us to empiricallyaddress a number of important questions pertaining to the globalization of sciencecurricula over a wide time range. The research complements and builds on previousresearch on globalization of curricula, which has tended to focus on mathematicsrather than science.
However, globalization of science curricula is a broad topic, and we were unableto explore all areas of interest given our limited resources and time. As a conse-quence, we here identify important areas for additional research to build further onthis work.
Firstly, we focused primarily on countries’ intended science curricula, asopposed to the implemented or achieved curricula. Devising a complementaryresearch program to explore the extent to which countries’ implemented andachieved curricula may be converging would be the next logical step, and theTIMSS teacher questionnaire is an obvious source of relevant data.
© International Association for the Evaluation of Educational Achievement (IEA) 2018O. Stacey et al., The Globalization of Science Curricula, IEA Researchfor Education 3, https://doi.org/10.1007/978-3-319-71532-2_6
89

Secondly, our focus was on the TIMSS science topics included in countries’curricula, as opposed to the skills emphasized within curricula. There would bevalue in investigating how these aspects of curricula change in countries over time;for example, whether there is a trend for an increasing emphasis on scienceinvestigation and problem-solving skills, as opposed to pure content knowledge.
Thirdly, we compared countries’ science curricula using the TIMSS scienceframework. Whilst this framework covers a broad range of science topics, it is notan exhaustive list. It is therefore possible that some countries’ science curriculaincluded topics that were not covered in the TIMSS science framework. One way toovercome this limitation would be to conduct a study that makes direct comparisonsof countries’ science curricula using the original curriculum documents (as opposedto the TIMSS science framework) as the basis for the comparison.
Our research identified a number of changes in countries’ science curricula overtime, particularly in terms of the science content included. However, we did notexplore the causal mechanisms or drivers supporting the development of curriculumchanges at an international level. Research exploring the processes by whichcountries embark on science curriculum reform would be an important avenue forfurther work, in order to gain a better understanding of why countries decide tomake the changes they do.
We investigated globalization in science curricula using the 1999 TIMSS surveyas a baseline for Grade 8 and the 2003 TIMSS survey as a baseline for Grade 4. Asdiscussed in Chap. 2, Rutkowski and Rutkowski (2009) have suggested thatinvestigating globalization in education and the curriculum using data from the1990s onwards is starting too late, because the effects of globalization wereapparent far earlier than this. Extending the study of globalization back further intime may detect changes and convergence in science curricula that our study mayhave missed, but depends upon the availability of reliable comparative data.
Here, we focused on countries that participated in TIMSS. It could be arguedthat countries participating in such studies have, to some extent, already bought intoa global education agenda, and thus research that explores and compares the cur-ricula of countries participating in TIMSS against the curricula of those that do notwould provide an alternative perspective and add an additional dimension to thestudy of the globalization of science curricula. Furthermore, as many developingcountries do not participate in TIMSS, analysis that makes use of available cur-riculum data from these countries would augment any study of the globalization ofscience curricula.
Finally, our research has not made reference to, or used data from, other inter-national large-scale assessments of science such as the Programme for InternationalStudent Assessment (PISA). Given its influence and prominence, and the additionof new PISA assessments (such as the PISA-based test for schools and PISA forDevelopment), research which considers globalization in science curricula withinthe context of PISA and its assessment frameworks, would also provide importantcomplementary information.
90 6 Future Directions and Topics for Further Research into …

Summary of the Key Findings
• The literature review identified a number of factors contributing to glob-alization in science education and science curricula. These included thegrowing emphasis on education as a mechanism for economic growth, theincrease in information technology in education and the role of internationallarge-scale assessments in facilitating comparisons between countries.Despite these factors, however, there were other forces which mediatedthe globalization of science curricula, such as local culture and localinterpretation of a centralized curriculum.
• The analysis found strong evidence that there have been changes inintended science curricula over the last 20 years. For example, everycountry analyzed in the investigation had made changes, although theextent of the changes varied considerably. The analyses also identified thatmore changes were made to intended science curricula at Grade 4 than atGrade 8, therefore suggesting a more fluid science curriculum in theprimary phase.
• The analyses suggest that, in some respects, science curricula arebecoming increasingly similar over time. For example, there was a trendfor more of the TIMSS science topics to be included in the majority (over80%) of participating countries’ curricula. This trend was observed at bothgrades, although was more pronounced at Grade 4.
• The cluster and discriminant analyses indicate strong convergence in thescience curricula of countries participating at Grade 8. The number ofcountries clustering into Group 2 grew at the expense of the numberclustering into Group 1. This suggests that, over time, changes in intendedscience curricula mean an increasing number of countries with similarprofiles in terms of the topics they do and do not include in their sciencecurricula.
• At Grade 4, the strength of evidence for science curricula becomingincreasingly similar over time is less strong, with the results of the dis-criminant analysis suggesting that changes in countries’ science curriculahave led to only mild convergence in curricula.
• At both Grade 4 and Grade 8 two distinct groups of countries could beidentified based on their intended science curricula. At Grade 4 one grouptended to have a broad and balanced science curriculum covering a rangeof topics, whilst the other group had less emphasis on physical sciencetopics and a greater focus on life sciences topics.
• Similarly, at Grade 8, one group included a greater number of TIMSSscience topics in its intended curriculum than the other. However, the topicsomitted from the group which included a more restricted number of sciencetopics in their curriculum were not confined to one specific area of science,unlike Grade 4.
6 Future Directions and Topics for Further Research into … 91
• Finally the analysis identified core science topics that were present in theintended curricula of the vast majority of countries included in thisanalysis. At Grade 4, these core topics tended to be concentrated in the lifesciences. By contrast, at Grade 8, they were distributed more evenlyacross the science subjects.
Reference
Rutkowski, L., & Rutkowski, D. (2009). Trends in TIMSS responses over time: Evidence ofglobal forces in education? Educational Research and Evaluation, 15(2), 137–152.
Open Access This chapter is licensed under the terms of the Creative CommonsAttribution-NonCommercial 4.0 International License (http://creativecommons.org/licenses/by-nc/4.0/), which permits any noncommercial use, sharing, adaptation, distribution and reproduction inany medium or format, as long as you give appropriate credit to the original author(s) and thesource, provide a link to the Creative Commons license and indicate if changes were made.The images or other third party material in this chapter are included in the chapter's Creative
Commons license, unless indicated otherwise in a credit line to the material. If material is notincluded in the chapter's Creative Commons license and your intended use is not permitted bystatutory regulation or exceeds the permitted use, you will need to obtain permission directly fromthe copyright holder.
92 6 Future Directions and Topics for Further Research into …

Appendix A:Literature Review Search Strategy
Bibliographic Databases
The search strategy for each database reflects the differences in database structureand vocabulary. Throughout, the abbreviation “ft” denotes that a free-text searchterm was used and the symbol * denotes truncation.
Australian Education Index (Searched Via Proquest,http://www.proquest.com/, 13 October 2016)
#1 Curriculum development#2 Globalisation#3 Global approach#4 Alignment (ft)#5 Curricula alignment (ft)#6 Curriculum alignment (ft)#7 Curricular reform (ft)#8 Curriculum reform (ft)#9 Global alignment (ft)#10 Globali*ation (ft)#11 Internationali*ation (ft)#12 Policy borrowing (ft)#13 #1 or #2 or #3 ��� #12#14 Primary school science#15 Secondary school science#16 Science curriculum#17 Science education#18 Elementary school science (ft)#19 Science instruction (ft)#20 #14 or #15 or #16 ��� #19#21 #13 and #20
© International Association for the Evaluation of Educational Achievement (IEA) 2018O. Stacey et al., The Globalization of Science Curricula, IEA Researchfor Education 3, https://doi.org/10.1007/978-3-319-71532-2
93

#22 TIMSS (ft)#23 Trends in international mathematics and science study (ft)#24 #22 or #23#25 #20 and #24.
British Education Index (BEI; Searched Via EBSCO,https://www.ebsco.com/, 12 October 2016)
#1 Curriculum alignment#2 Curriculum planning#3 Curriculum change#4 Education and globalization#5 Curricula alignment (ft)#6 Curriculum development (ft)#7 Curricular reform (ft)#8 Curriculum reform (ft)#9 Global alignment (ft)#10 Global approach (ft)#11 Globali*ation (ft)#12 Internationali*ation (ft)#13 Policy borrowing (ft)#14 #1 or #2 or #3 ��� #13#15 Science—Study and teaching#16 Science—Study and teaching (Elementary)#17 Science—Study and teaching (Secondary)#18 STEAM education#19 STEM education#20 Elementary school science (ft)#21 Secondary school science (ft)#22 Science education (ft)#23 Science curriculum (ft)#24 Science instruction (ft)#25 #15 or #16 or #17 ��� #24#26 #14 and #25#27 TIMSS (ft)#28 Trends in international mathematics and science study (ft)#29 #27 or #28#30 #25 and #29.
94 Appendix A: Literature Review Search Strategy

The Education Resource Information Center (ERIC; Searched ViaEBSCOhost, https://search.ebscohost.com/, 12 October 2016)
#1 Alignment (Education)#2 Curricula alignment (ft)#3 Curriculum alignment (ft)#4 Curriculum development#5 Curricular reform (ft)#6 Curriculum reform (ft)#7 Global alignment#8 Global approach#9 Globali*ation (ft)#10 Internationali*ation (ft)#11 Policy borrowing (ft)#12 #1 or #2 or …. #11#13 Elementary school science#14 Science curriculum#15 Science education#16 Science instruction#17 Secondary school science#18 #13 or #14 or ��� #17#19 #12 and #18#20 TIMSS (ft)#21 Trends in international science and mathematics study (ft)#22 #20 or #21#23 #18 and #22.
Journal “hand searches”International Journal of Science Education (see http://www.tandfonline.com/loi/tsed20).
Website searchesInternational Association for the Evaluation of Educational Achievement (IEA;http://www.iea.nl).
Appendix A: Literature Review Search Strategy 95

Appendix B:Questions Included in Selection Log
The following questions were included in the selection log used to appraise therelevance and suitability of articles for inclusion in the literature review.
(1) Who are the author(s) of the research?(2) To which organization(s) are the author(s) affiliated?(3) Which country was the research originally published in?(4) What date was the research published?(5) What type of publication (e.g. journal, book, government report) is the
research published in?(6) What is the main focus of the research?(7) What age range does the research consider?(8) Which country or countries does the research consider?(9) Does the research provide evidence on the influence of globalization on
school curricula?(10) Does the research focus on science curricula? If not what subject(s) does it
consider?(11) Does the research make use of data from international large-scale assess-
ments? If so, which ones TIMSS, PISA or others?(12) Based on the responses to questions 1–11, an assessment of how relevant the
research is to this study.
© International Association for the Evaluation of Educational Achievement (IEA) 2018O. Stacey et al., The Globalization of Science Curricula, IEA Researchfor Education 3, https://doi.org/10.1007/978-3-319-71532-2
97
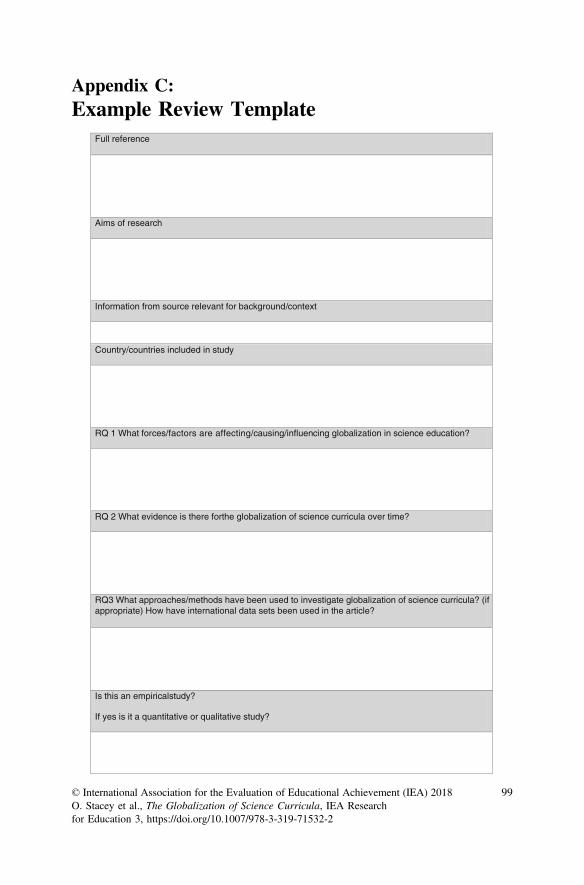
Appendix C:Example Review Template
Full reference
Aims of research
Information from source relevant for background/context
Country/countries included in study
RQ 1 What forces/factors are affecting/causing/influencing globalization in science education?
RQ 2 What evidence is there forthe globalization of science curricula over time?
Is this an empiricalstudy?
If yes is it a quantitative or qualitative study?
RQ3 What approaches/methods have been used to investigate globalization of science curricula? (if appropriate) How have international data sets been used in the article?
© International Association for the Evaluation of Educational Achievement (IEA) 2018O. Stacey et al., The Globalization of Science Curricula, IEA Researchfor Education 3, https://doi.org/10.1007/978-3-319-71532-2
99
Open Access This chapter is licensed under the terms of the Creative CommonsAttribution-NonCommercial 4.0 International License (http://creativecommons.org/licenses/by-nc/4.0/), which permits any noncommercial use, sharing, adaptation, distribution and reproduction inany medium or format, as long as you give appropriate credit to the original author(s) and thesource, provide a link to the Creative Commons license and indicate if changes were made.The images or other third party material in this books are included in the book’s Creative
Commons license, unless indicated otherwise in the credit line to tha material. If material is notincluded in the books’s Creative Commons license and your intended use is not permitted bystatutory regulation or exceeds the permitted use, you will need to obtain permission directly fromthe copyright holder.
100 Appendix C: Example Review Template