david r. agrawal, william f. fox
TRANSCRIPT

8708 2020
November 2020
Taxing Goods and Services in a Digital Era David R. Agrawal, William F. Fox

Impressum:
CESifo Working Papers ISSN 2364-1428 (electronic version) Publisher and distributor: Munich Society for the Promotion of Economic Research - CESifo GmbH The international platform of Ludwigs-Maximilians University’s Center for Economic Studies and the ifo Institute Poschingerstr. 5, 81679 Munich, Germany Telephone +49 (0)89 2180-2740, Telefax +49 (0)89 2180-17845, email [email protected] Editor: Clemens Fuest https://www.cesifo.org/en/wp An electronic version of the paper may be downloaded · from the SSRN website: www.SSRN.com · from the RePEc website: www.RePEc.org · from the CESifo website: https://www.cesifo.org/en/wp

CESifo Working Paper No. 8708
Taxing Goods and Services in a Digital Era
Abstract
Taxing consumption in the digital economy poses unique challenges for fiscal authorities. Recent institutional reforms, such as states changing remittance rules for the sales and use tax following the Supreme Court decision in South Dakota v. Wayfair, were enacted in order to increase tax revenue collections and create a more neutral tax system. Although these reforms induced more remote vendors to remit taxes on a destination basis, the revenue gains were modest, consistent with most large online vendors remitting taxes prior to the reforms. Instead, following the recent large shock to online shopping from the Covid-19 pandemic, the shift to destination-based taxation has redistributed revenues between large and small local jurisdictions. Increased online shopping raises revenue growth in small jurisdictions while contracting revenues in large jurisdictions. But, Wayfair is not the end of the story: technological changes that induce new consumption patterns, promise new challenges for fiscal authorities. Critical challenges for the next decades include limiting administrative and compliance costs of enforcing taxes in a digital world, determining filing thresholds, dealing with online marketplaces and facilitators, and taxing the consumption of digital services from two-sided platforms. With respect to digital services, we discuss whether consumption taxes should be imposed on both monetized platforms and non-monetized platforms such as social media, and the mechanisms for doing so. JEL-Codes: H200, H700, K300, L800, R500. Keywords: sales tax, e-commerce, online shopping, enforcement, compliance, South Dakota v. Wayfair, consumption tax, digital services, platforms.
David R. Agrawal Martin School of Public Policy &
Department of Economics University of Kentucky Lexington / KY / USA [email protected]
William F. Fox The University of Tennessee, Knoxville Boyd Center for Business & Economic Research,
Haslam College of Business Knoxville / TN / USA

2
I. INTRODUCTION
Many classic problems in public finance concern the breadth of the tax base, the scope
for tax evasion, administrative and compliance costs, the behavioral responses of firms and
individuals, and the equity of the distribution of revenues across local governments. Online
shopping and the consumption of digital services, which pose many challenges for fiscal systems
around the world, are interesting applications of these classic problems.
Consumption taxes on goods and services such as the value added tax are common
around the world. However, the U.S. systems of consumption taxation generally has a narrower
base, mainly taxing the retail sales of tangible goods and limited services, though the value
added tax (VAT) base falls short of taxing all consumption. Although the retail sales tax in the
United States was the largest source of state revenue for decades and the second largest source
for local governments, it has stagnated in its revenue raising capability, as recent tax increases
were not sufficient to offset the narrowing of the tax base.
In this article, we focus on two critical reasons for the decline of the retail sales tax base:
the shift of consumption away from goods towards services and technological change that has
spurred online shopping and the creation of new digital services. Relative to the income tax base,
the sales tax base is generally smaller: partly because consumption is less than income, but partly
because of the historical application of the retail sales tax to tangible goods. Unlike the income
tax, where legislators started with a relatively broad base and may shrink it over time through
various deductions or exemptions, the sales tax starts with a relatively narrow base that must
attempt to keep up with real-time changes in consumption patterns and new types of products.
This is a daunting challenge.
Technological change can be a double-edged sword. Technological change that lowers
the cost of moving people, factors, and goods, may negatively affect tax systems by heightening
tax competition for mobile factors. At the same time, technological change may create
opportunities for governments by allowing them to enforce taxes better by using computerized
systems and comprehensive digital records.
With respect to the retail sales tax, this is not the first time that states have had to grapple
with these issues. Indeed, this is an apt time to review the future of the sales tax given the
publication of this article marks the 100th anniversary of a U.S. state introducing a tax resembling
the retail sales tax (Hines, 2007). When states first began to adopt general sales taxes in the Great
Depression, services represented approximately 25 percent of consumption. Starting in the
1950s, this share – which was previously stagnant – began growing, reaching approximately 50
percent of consumption by 2000 (Buera and Kaboski, 2012). As of 2017, services represent 69%
of personal consumption expenditures. Technological change has been critical to the growth of
many service sectors such as health care. Despite this rapid growth in services, states generally
failed to respond to these technological changes. As services become more important than the

3
consumption of goods, states attempted to offset the narrowing base by raising rates. Some states
expanded the base to include services, but this happened selectively.
More recently, technological change spurring the advent of remote catalog sales and
eventually, online purchases, raised new and important issues for state and local governments.
For years, states were restricted by a Supreme Court ruling in Quill Corp v. North Dakota
(preceded by National Bellas Hess v. Department of Revenue of Illinois) that only allowed states
to require remote vendors to remit sales taxes if the vendor had physical presence in the state.
With Congress unwilling to intervene and remote sales growing extensively over time, this
substantially eroded the sales tax base in the early days of the internet.1
The issue of online shopping highlights the importance of remittance rules in the design
of optimal tax systems (Slemrod, 2019). Quill effectively designated millions of online shoppers
as the remitting party when the vendor did not have presence in the consumer’s state. Thus,
extremely high administrative costs of tracking these purchases or auditing millions of individual
purchases effectively left many online purchases tax-free. In this way, the internet acted as a tax
haven that facilitated consumer tax evasion and avoidance strategies, much like cross-border
shopping did earlier. However, such a problem is mitigated – although not eliminated – if,
instead, large vendors are the remitting parties.
More recently, technological changes to business models and supply chains provided
some hope of counteracting declining revenues from e-commerce. Large vendors such as
Amazon established physical presence in more and more states to get goods quicker to market,
thus triggering the requirement to remit state and local taxes. And more recently, evolving
institutions, following the Supreme Court’s recent South Dakota v. Wayfair decision, now allow
states to adopt an economic nexus standard instead of a physical presence standard with respect
to tax remittance. In particular, taxation by vendors with economic presence follows the
destination principle, meaning that the vendor remits the taxes due to the state and locality where
the consumer lives. Indeed, there are many theoretical arguments for taxing consumption on a
destination basis. For example, destination-based taxation eliminates competition for mobile
cross-border shoppers (Agrawal and Mardan 2019). Moreover, as discussed in McLure (1998)
and McLure (1999), destination-based taxes are more likely to reflect the provision of benefits of
public services and are less likely to be exported inappropriately to residents of other
jurisdictions.
Policy commentators have been overjoyed at states’ newfound ability to effectively
require remote vendors to remit taxes based on the destination principle. Will the Court ruling
open the floodgates, resulting in large gains of tax revenue from previously untaxed online
purchases? Given the massive shock to online shopping because of Covid-19, does destination-
1 Bruce and Fox (2000) estimated sales tax losses of approximately $20 billion by 2003.

4
based taxation of online sales affect the distribution of sales tax revenue across counties and
localities? What are the costs to states and firms of this new economic nexus standard and will
the added revenue outweigh the administrative and compliance costs? Given the persistence of
institutions and the historical choices of how states define the tax base, does the Court ruling
help states address future digitization of consumption via both monetized services and non-
monetized services like Netflix, Uber, Airbnb, Facebook, Google, and Twitter?2 We attempt to
answer these questions in this article, while also providing guidance to policymakers for how to
proceed for the future of taxing consumption. While the first two questions truly hinge on
Wayfair, many of the answers to the remaining questions apply even in the absence of the
Supreme Court ruling. For this reason, we view the Court ruling as both an impetus to some
economic effects, but also a point in calendar time from which we can evaluate the future of
consumption taxes going forward. Moreover, the answers to the questions on digital services
apply to other countries around the world.
Using data on Tennessee state and local tax revenue and information about remote sales,
we first document, following Wayfair and adoption of an economic nexus standard, how tax
revenues increased from new vendors previously not remitting state and local taxes. This
increase in revenue was modest. Newly registered vendors represented 2.5% of local tax
revenue. The relatively small increase is likely a result of most large online vendors already
remitting state and local taxes, including many apparently on a voluntary basis.
However, the distribution of revenue across counties, which levy local sales taxes in
Tennessee, was critically affected by the new economic nexus standard. Consistent with the
theoretical evidence in Agrawal and Wildasin (2020), immediately following the economic
nexus reform, we document a slight increase in revenue in small counties and either a flat or a
declining share of revenue in the largest counties. In part, this is because prior to reforms
following Wayfair, remote vendors with nexus in Tennessee had the option to remit taxes using a
common local rate or on a destination-basis, but needless to say, many vendors elected the
former simpler approach for which the formula to distribute the revenues advantaged larger
population jurisdictions. Then, following the massive shock resulting from Covid-19, where
many households switched to online shopping, tax revenue from the sales tax dramatically grew
in small jurisdictions despite the economic downturn, but fell in large jurisdictions. The
institutional rules regarding economic nexus were critical for the distributive effects of this
massive shock to online shopping on the allocation of revenues across counties.
2 The recent GAFA Tax (Google, Amazon, Facebook and Apple Tax) in France attempts to tax
sufficiently large companies’ income at a flat rate. However, these digital taxes are usually
focused on the challenge of taxing corporate income in market countries given international
agreements rather than including digital goods and services in consumption tax structures.

5
The basic intuition is as follows. Theoretically, assuming that the fall in demand was
similar across jurisdictions, a shock that increases online shopping implies that rural consumers
are no longer driving to jurisdictions with shopping malls and retail agglomerations. Prior to the
Covid-19 shock, revenues would have accrued to the town containing the shopping mall. But,
with destination-based taxation of online shopping, the tax revenue accrues to the smaller
hometown. As an example, consider a resident in a small rural community outside of Tulsa,
Oklahoma. Previously, this resident may have driven to shopping malls in Tulsa and its suburbs
because their small hometown may not have any big box retailers; tax revenue accrues to Tulsa
or its suburbs. During Covid-19, this resident may be more inclined to buy online, which
generates tax revenue to the small home community.3 In this way, Wayfair redistributes revenues
of taxing goods from large jurisdictions to small jurisdictions. Even in the absence of Covid-19,
ignoring the issues of adding services to the tax base, we would have likely seen such a pattern,
but it would have been more gradual as consumers continue to gradually switch from shopping
malls in relatively large jurisdictions to online shopping as technological change lowers the
relative cost of buying online.
The ruling will have important implications on the tax system as a whole. In practice, we
show that the Wayfair ruling does not significantly broaden the definition of what is in the tax
base, but rather changes the remittance rules of the sales and use tax system.4 By shifting the
remitting party to the online vendor, economic nexus lowers administrative (enforcement) costs
of raising an equivalent amount of revenue. Rather than needing to audit many small individuals
with little hope of detecting online purchases, the government can now audit firms, which raises
the cost effectiveness of spending an extra dollar on enforcement. Of course, states may still
experience large administrative costs as they seek to audit many small out-of-state firms,
depending on the states’ compliance thresholds and on the extent of coordination with other
states. Even so, the new administrative costs of enforcing the tax code via audits of out-of-state
firms are not clear and effective enforcement may require coordination across multiple state
governments.
The compliance costs to firms are potentially non-trivial. Although many states have
simplified tax systems, some states delegate authority over the tax base and filing responsibilities
3 Given the small community has few large-scale shopping opportunities, why does it have a
sales tax in the first place? Although small communities are void of big-box retailers, they may
have small stores or sales by firms providing non-exportable services.
4 Even prior to Wayfair, online sales of tangible property were subject to taxation. The issue is
that for sales from vendors without nexus, the remitting party was the consumer who was legally
obliged to remit consumer use taxes, but tax evasion on these purchases was rampant. In this
way, Wayfair simply changes who remits the tax and facilitates government enforcement of taxes
on the same taxable base.

6
to municipalities. This was presumably, part of the reason why sufficiently small firms were
exempt from the tax. Moreover, the tax authority must be cognizant that added enforcement may
yield modest success (Johannesen, Langetieg, Reck, Risch, and Slemrod, 2020). In particular, the
shift of the remitting party to the vendor may induce new evasion or avoidance strategies: firms
may attempt to bunch under the economic nexus filing threshold, firms may use multiple
platforms and marketplaces to conceal sales or firms may just hope that enforcement is not yet
established and simply evade taxes. We discuss the effect of the ruling from a compliance costs
and administrative cost perspective.
Finally, we discuss the future of the sales tax in the context of continued technological
changes. As consumption continues to shift toward services, the sales tax becomes less effective
at raising revenue. Path dependence and slow moving institutions have often led states to only
incrementally expand the tax base to services. But this is not only a problem for the sales tax, as
many value added taxes often do not tax some major service sectors. The shift towards the
consumption of services is increasingly to platform-based technologies. The taxation of digital
services raises interesting challenges for policymakers, especially when the consumption
services provided by platforms are non-monetized. In some cases, these services, such as Netflix
or Uber, are not currently taxed in some states relative to more traditional services such as cable
television or taxicabs subject to the retail sales tax. Furthermore, many platforms, especially
social media firms, raise a majority of revenue through the sale of advertising with consumption
of the service being unpriced to the consumer. We discuss the arguments for expanding the sales
tax to include these types of consumption, emphasizing efficiency arguments. Regardless,
finding ways to broaden the base, not only selectively, will be critical for the future of the tax.
Although the retail sales tax has stagnated as a source of revenue in recent years, the
Wayfair decision provides opportunities for states to begin long-overdue reforms. Many
economists and policymakers see consumption taxation as a desirable policy goal. Given the
U.S. lacks a broad-based federal tax on consumption, the existing state and local retail sales taxes
provide a means to tax consumption. But, to be successful, these states must look beyond the
economic nexus reforms recently passed in almost every state. In many ways, Wayfair and the
resulting state reforms may have been too late. But, as we discuss, with appropriate and
comprehensive reforms, the sales tax can be an important tax for the next one hundred years and
not just a legacy of the last century.
To summarize, the Wayfair ruling has only modest implications for the design of sales
tax structures, as it only affects the ability to enforce taxation on a particular set of goods.
Wayfair lowers compliance costs and makes destination-based taxation more feasible, so it has
already had significant impact on sales tax practice. However, we caution against viewing
Wayfair as settling issues with respect to the base erosion of the sales tax. Traditional goals of
tax design, including neutrality, fairness, efficiency, and low compliance and administration
costs, should still be employed to determine the sales tax’s breadth. Some resulting specific
policy counsel for the sales tax includes: a) the tax should be levied against a broad consumption

7
base, b) the tax should generally be levied on final and not intermediate transactions, c) the
channel or the form through which consumption is obtained should be irrelevant to taxability
unless compliance or administrative costs are excessive for some channels, and d) the tax should
be levied on a destination basis.
II. BRIEF HISTORY
In this section, we discuss the history of retail sales taxation in the United States,
including recent Court decisions that have influenced the design of the tax system.
A. Background to Sales Taxation
As already previewed in the introduction, state sales taxes were the largest source of state
tax revenues for decades, but the tax has eroded as a share of both GDP and total state tax
revenues over the past 15 years (Figure 1). The sales tax’s revenue share stabilized between
1995-2005 and was first surpassed by the personal income tax in 1997. Frequent sales tax rate
increases since the 1970s maintained the sales tax share for many years but ultimately the rate
increases were not sufficient to offset narrowing of the base. Personal income taxes have mostly
lowered the share of revenue from unit based selective sales taxes on tobacco products, alcohol
and motor fuels, which have not seen nearly enough quantity growth to sustain their revenue
share in light of infrequent rate hikes. In total, the income tax share of state revenues has nearly
doubled over the past 50 years while the sales tax share has remained approximately constant.
Inability to enforce the sales tax effectively on remote sales has been an important reason
that the sales tax has declined in importance recently. As buyers shifted many in-store purchases
to online vendors, tax collection was often complicated and not enforced.5 Other factors include
the propensity of sales taxes to be levied more broadly on goods than services, as the latter have
grown much more rapidly as a share of the economy (health care, for example, has grown from 5
percent of GDP in 1960 to 12 percent in 1990 and 18 percent in 2018). Table 1 shows the growth
in services as a share of total expenditures. State decisions to exempt items, such as food at
home, and to implement tax holidays, have further eroded the base. In addition, states’ slow
response to taxing new technologies, new goods, and consumption via new distribution channels
has the same effect as exempting certain items from tax. Other taxes’ bases, such as the personal
income tax, are often broad enough and structured in a way that accommodates emerging
technologies, but the sales tax’s historical structure limits its ability to stay current. This is
discussed in more detail below.
5 See Fox (2016) for further discussion of sales tax growth over time.

8
B. Online Shopping
As is well known, e-commerce has grown substantially over the last decade, rising to 10
percent of total retail trade. In particular, sales from e-commerce retailers amounted to
approximately $520 billion in 2019, relative to total retail sales of $5,270 billion. Given retail
sales are the bulk of the base for the sales taxes in the United States, the growth in online
shopping created many concerns for state and local governments as the internet facilitated tax
avoidance. These concerns were heightened by numerous studies showing that online shopping
patterns are sensitive to the tax treatment of brick-and-mortar purchases relative to online
purchases (Ballard and Lee, 2007; Baugh, Ben-David and Park, 2018; Einav, Knoepfle, Levin
and Sundaresan, 2014; Ellison and Ellison, 2009; Goolsbee, 2000; Goolsbee, Lovenheim, and
Slemrod, 2010).
C. The Influence of the Court: Quill and Wayfair
A critical element of the U.S. sales tax system is the remittance rules that govern whether
firms or buyers remit taxes to the government. From an enforcement perspective, requiring
vendors to remit the tax is more effective than requiring many consumers to remit the tax. A
series of judicial decisions shaped these remittance rules and initially limited states abilities to
enforce tax compliance in the online era.
Quill Corp. v. North Dakota6 required that firms have physical presence in a state before
they could be compelled to remit the state’s sales tax.7 This ruling effectively meant that each
consumer must remit taxes on online sales when the online vendor did not have physical
presence in the state. Under this regime, states were reliant on consumers remitting use taxes
rather than vendor compliance to collect tax on many remote transactions. Individual compliance
with the use tax is widely believed to be very poor, at least in part because little if any auditing of
individual use tax returns takes place. Business use tax compliance is also weak, though some
auditing occurs in this case. For example, with respect to businesses, Smith (2018) finds 14.9
percent non-compliance with the Washington State use tax compared with 0.9 percent for the
sales tax. Still, Smith (2018) found much better business use tax compliance than in earlier
studies conducted over the previous several decades by Washington.
6 Quill Corp. v. North Dakota, 504 U.S. 298 (1992). Technically, the physical presence
requirement was established National Bellas Hess, Inc. v. Department of Revenue, and Quill
simply reiterated the holding. Several justices concurred solely based on the doctrine of stare
decisis.
7 See Stark (2021) for detailed discussion of previous and current Supreme Court rulings on
states’ ability to enforce compliance responsibilities on remote firms.

9
Over time, many states were aggressive in defining physical presence (see Agrawal and
Fox, 2017), but the earlier Quill decision hampered and delayed enforcement and resulted in
significant base erosion. The potential for revenue losses in the Quill era was mitigated by
evolving business practices and supply chains, whereby large online vendors established physical
presence in many states in order to get goods to consumers quickly. Thus, in the average state by
2012, more than half of the sales from the 300 largest online vendors had the tax remitted
(Bruce, Fox and Luna, 2015).
South Dakota v. Wayfair8 offers the opportunity to reverse some of the base erosion
resulting from rampant tax evasion of the use tax on online purchases by enhancing states’
ability to collect sales taxes on remote transactions. The Wayfair decision reversed the physical
presence requirement by allowing states to determine nexus based an economic rather than
physical presence. While the Court did not provide a definitive statement on what triggers
economic nexus, it is widely recognized that an online vendor must have a significant number of
transactions or a significant amount of sales into a state. Effectively, Wayfair altered states’
ability to compel compliance, which significantly improves the ability to enforce tax on a
destination basis.
D. State Reactions to Wayfair
States responded very rapidly to Wayfair, with some passing legislation prior to the
Supreme Court decision (see Table 2).9 Given the opportunity offered by Wayfair, all states
except Florida and Missouri enacted legislation requiring remote firms to remit the sales tax.10
The effective dates ranged from in 2018 to Texas in October 2020. States generally exempt firms
with a sufficiently small number of transactions or value of sales into the state. 11 State collection
thresholds range from $100,000 to $500,000, with Kansas saying that no threshold may apply.
Many states also have a threshold for the number of transactions, which can operate with either
both thresholds required or either being sufficient to trigger remittance responsibility for the
vendor. The quantity and dollar valued thresholds allows two different views of what it means to
exploit a state’s economy, but they are simply measurable standards and not theoretically derived
8 South Dakota v. Wayfair, Inc., 585 U.S. ___ (2018).
9 Alabama and Tennessee were among other states that faced court challenged during the same
period as the South Dakota v. Wayfair case.
10 See also Afonso (2019) and Mikesell and Ross (2019) for a discussion of state reforms and the
role of the use tax after Wayfair.
11 Most states, such as Wisconsin, have a requirement of either the dollar or the transactions
threshold, but New York requires both thresholds to be met.

10
measures of presence. States continue to develop their economic nexus legislation. For example,
several states, including Tennessee, have already lowered their dollar threshold and several have
eliminated their transaction threshold.
Recently, states have also begun to enact reforms related to the remittance rules with
respect to online marketplace facilitators. 12 A marketplace facilitator is defined as a marketplace
that contracts with third party sellers to promote their sale of physical property, digital goods,
and services through the marketplace. Digital Commerce 360 reports $552 billion in marketplace
sales in 2019. Following Pennsylvania, Rhode Island, and Washington in 2018, at least 42 states
have legislation requiring marketplace facilitators to collect taxes on behalf of individual firms.
Marketplace facilitator laws “require third-party marketplace platforms that advertise or sell
goods on behalf of others (marketplace sellers) to collect and remit tax on behalf of marketplace
sellers” (Kranz, 2020). These laws shift marketplace facilitators from having the option to collect
tax for third parties operating on their site to being required to collect for them.13 Marketplace
facilitator laws lessen state problems of identifying individual sellers and potentially reduce the
number of tax returns. As with economic nexus laws, state statutes vary widely and are often
very general, leaving the implementation details to revenue departments. Many states are still
developing the details of how the laws will operate and many challenges likely remain
unforeseen. Firms have a number of concerns, such as how the tax on product returns is treated,
the liability that facilitators have for determining tax on many detailed goods and services that
are sold by others, and whether local governments will enact their own facilitator legislation. It
also remains uncertain as to which taxes, in addition to the sales tax, that facilitators must collect.
E. Technological Change and the Future
Broadening the sales tax base to include emerging technologies and goods is the sales
tax’s challenge for the future. The accelerating speed with which new channels for delivering
services develop, new products are created, and the pace at which users adopt them pressure
states to modernize or restructure their tax systems. States must respond by accelerating their
modernization pace given rapidly changing business and consumer behavior. Unless the structure
evolves with the economy, the sales tax will continue eroding and burdening traditional
consumption relative to new alternatives.
12 Much of this paragraph draws from Kranz (2020).
13 Firms such as Amazon and Walmart were already required to collect and remit taxes on
transactions on their own account.

11
Autonomous vehicles are one example of new technologies and changing channels for
meeting consumer tastes. Fox (2020)14 discusses how development of autonomous vehicles
could reduce state transportation tax revenues by around 60 percent in a number of states, given
the interaction between electric autonomous vehicles and existing state tax structures. Loss of
fuel tax revenue explains much of the decline as vehicles are increasingly electric, but reduced
sales tax on selected taxable vehicle services and vehicle sales may be even larger as the number
of vehicles falls. Fox (2020) argues that dedicated companies (such as Uber or Lyft) are likely
the providers of mobility in the future and transportation services should be taxed rather than
various transportation inputs, such as the vehicles.15 The sales tax is one instrument that could be
used for this purpose, though the service is unlikely to be automatically accommodated within
most states existing statutes. Other examples of new technologies include, for example, digital
services such as streaming services, social networking platforms, and cloud storage spaces.16 An
interesting distinction that perhaps influences the political feasibility of tax base reforms is
whether the new technology replaces other physical goods that were previously taxed versus new
technologies that are completely new consumption goods. In the former case, including the new
technologies in the tax base compensates for lost revenue due to product substitution, while the
latter case expands the set of products that is taxable.
Historically, most state sales taxes were created as taxes on tangible personal property,
which limit the breadth of the tax base and require services and some new goods to be separately
articulated in state tax law as they develop. Gross receipts based sales taxes levied in some states,
such as in Hawaii, do not suffer from this weakness to the same extent. Similarly, a value added
tax often does not require legislative action as new goods and services are created unless
particular types of sales fall under previously exempted or zero-rated categories. Income tax
bases are generally structured much more broadly and include new forms of income.17 The
challenge with the sales tax is that legislative action is likely needed in most states to effectuate
the base expansions. History is not encouraging. The 1986 Florida base expansion experience18
14 Also, see Fisher (2020) and Clark (2020) for discussion of autonomous vehicles.
15 Other options for replacing lost vehicle taxes include a gross receipts tax on transportation
services and vehicle miles travelled fees.
16 In the presence of lines that delineate high-tax and low-tax products, technological change can
facilitate tax-driven product innovation as new products are developed to avoid the higher tax
rate (Gillitzer, Kleven, and Slemrod 2017). But, often time, new products are not developed for
tax avoidance reasons.
17 Carried interest is an exception which is characterized as capital income when it is better
described as labor income.
18 See, Hellerstein (1988) for discussion of the experience.

12
and paucity of sales tax base expansions despite widespread discussion,19 suggest that states will
remain slow in responding. The result will be a tax system that relatively penalizes traditional
commerce (particularly goods consumption) and benefits emerging goods and technologies.
Obviously, this raise numerous efficiency issues, especially if the physical goods are close
substitutes with the new digital services.
Later in the paper, we discuss several potential remedies that tackle issues related to the
consumption taxation of multi-sided platforms. But more generally, legislative remedies must
either substantially expand the definition of the sales tax base in ways that include emerging
technologies or states must enact piecemeal expansions. Historical efforts to significantly
broaden the base have generally failed, offering limited hope that states will seek broad
solutions.
III. EVIDENCE ON THE REVENUE EFFECTS OF WAYFAIR
In this section, we study the tax revenue effects of the Wayfair decision. We focus on one
state, Tennessee, for several reasons. First, Tennessee publicly releases monthly revenue data at
both the state and local level. Second, we have obtained information on tax revenues remitted by
remote vendors – data not readily available in most other states. To study the revenue effects, we
collect monthly data on tax revenues at the state and local level.
A. A Case Study of the Institutional Reforms in Tennessee
Prior to the passage of economic nexus rules in Tennessee, remote vendors that were
remitting taxes had a choice over how to remit local taxes. Historically, remote vendors could
elect to remit county taxes based on the consumer’s destination or remote vendors with no
physical presence in Tennessee were able to apply a uniform 2.25% local option sales tax rate.
Under the latter approach, the vendor did not need to keep track of local sales tax rates or situs
sales in local jurisdictions and instead could remit the state rate plus the uniform local rate. Then,
any local taxes from out-of-state dealers not using destination sourcing were distributed to
counties based upon the ratio of local tax collections in the county over total local tax collections
in all counties. Unlike most other states, Tennessee applies an origin sourcing rule for intrastate
e-commerce sales, even if the purchase is delivered to a home address.
The timeline of events in Tennessee was as follows. In October 2016, Sales and Used
Tax Rule 1320-05-01-.129 Subparagraph 2 – informally, Rule 129(2) – was proposed by the
Tennessee Department of Revenue. This rule, similar to South Dakota’s law said that remote
vendors with more than $500,000 of sales to consumers in the state have nexus for sales and use
19 See Fox and Murray (1988) for an early discussion of the case for sales taxing services.

13
tax purposes. The Rule states that by March 2017, these vendors should register with the state
and begin remitting taxes starting on July 1, 2017. As with South Dakota’s law, this was met
with legal challenges. More problematic, the Tennessee state government enacted Public Charter
452 in May 2017, which prohibited the Department of Revenue from collecting taxes under the
rule even if permitted under a court ruling until Rule 129(2) was approved by the legislature. The
Wayfair ruling was handed down in June 2018. Then, the state passed Public Chapter 429 in
May 2019. This authorized the Department of Revenue to begin enforcing Rule 129(2) to collect
sales tax from remote vendors without physical presence but who have more than $500,000 of
sales into the state of Tennessee. Firms that met Tennessee’s threshold by July 31, 2019 were
expected to begin collecting sales taxes no later than October 1, 2019.
Although Public Chapter 429 allowed for collection from remote vendors without
physical presence, these vendors still had the ability to use the uniform local tax rate option.
Public Chapter 491, which was effective October 1, 2019, required these remote vendors to
apply and remit the specific local sales tax rate in the city or county to which the good was
delivered. After October 2019, any local taxes from out-of-state dealers not using destination
sourcing will be based upon the local tax collections in the county from dealers with no location
in the state that can be identified by situs over the total local tax collections in all counties from
dealers with no location in the state that can be identified by situs. However, this formula should
apply to very little revenue because the vendors are required to remit at destination and the
formula would only be applied if the vendor did not provide sufficient information with respect
to destination-sourcing. Note that the effective date of Public Chapter 491 is the same as the date
as when firms were expected to first begin collecting taxes under Public Chapter 429. Thus,
although we will reference Public Chapter 491 as the October date for simplicity, all our
empirical results should be interpreted as the joint effect of both laws.
B. The Amount of Tax Revenue from Remote Vendors Following Economic Nexus Reforms
Against this backdrop, we study the effect of these events on tax revenue. As
background, for fiscal year 2017-2018, the Tennessee state sales tax raised $8.9 billion and local
taxes in the state collected $2.6 billion. Thus, in the fiscal year prior to the June 2018 Court
decision, the state collected on average $741 million per month and local governments collected
$217 million per month.
It is often difficult to evaluate the revenue impacts of nexus rules because states do not
publicly release data on revenue collected from remote vendors specifically. However, the state
of Tennessee provided us access to two unique data series. The first represents the revenue
remitted by remote vendors without a physical presence in the state of Tennessee. Because the
data only cover vendors without a physical presence, this should not be construed as the total
revenue resulting from online shopping, as it does not include online sales from instate vendors
like Walmart. Nonetheless, this is the best data to evaluate the effect of Wayfair and economic
nexus on the amount of additional tax revenue. The second dataset is the revenue raised from

14
vendors that are newly registered as remote sellers since June 2018, i.e., since the decision in
Wayfair. The information on remote vendor status self-reported and possibly subject to
underreporting.
To study these effects, we present a series of figures. The vertical lines in the graph, and
in subsequent figures, show the month prior to Wayfair and implementation of Public Chapter
491. The latter event also corresponds to the month prior to when vendors with economic nexus
were required to begin remitting taxes under Public Chapter 429.
The solid line in Figure 2 shows the total revenue remitted to localities from remote
vendors, adjusted for month fixed effects.20 Given the higher tax rate, the remittances to the state
are likely three times as large. Prior to Wayfair, sales tax revenue from out-of-state vendors
represented approximately 14 percent of local tax revenue, suggesting that online purchases from
remote vendors is critical to financing local public services. However, the court decision and
subsequent passage of economic nexus and the abolition of the uniform local rate option, seem to
have had minimal effects, with the $40 million from remote vendors after Wayfair representing a
similar share of total local revenue.
The dashed line in Figure 2 reinforces this result. This series is constructed based upon
answers to questions in the filing data from taxpayers who have registered as remote sellers since
June 2018, i.e., since the decision in Wayfair. As can be seen, newly registered vendors
contributed only $5 million in local sales tax revenue per month by 2020. This is approximately
2.5 percent of local monthly sales tax revenue. 21 This small effect likely results from several
factors. First, Tennessee’s threshold for economic nexus is relatively high compared to other
states. Second, as shown in Bruce, Fox, and Luna (2015), many of the largest online vendors
were already remitting taxes at the state and local level even as early as 2012. Third, several
large vendors (such as Wayfair) appear to have begun voluntary compliance after the Supreme
Court decision.
The evidence on the effects of economic nexus in other states is limited. Using multiple
states, Fox, Hargaden, and Luna (2020) estimate that state sales tax revenues rose about 3.5
percent from imposing economic nexus requirements and a comparable amount from
marketplace facilitator legislation. Mikesell and Ross (2019) find that remote vendor
20 Given our main analysis will focus on the distribution of revenues, we focus on the revenue
impact to local governments.
21 The results are likely a lower bound because the Tennessee revenues analyzed here are based
on firms self-identifying as remote firms. Further, some remote firms may have been remitting
revenues on a destination basis, even before it was required. Marketplace sales are also not
included because Tennessee only recently passed legislation for the marketplaces.

15
registrations tripled in Indiana after the passage of economic nexus, but the impacts on state tax
revenues were modest.
The dashed series in Figure 3 shows the amount of local revenue from newly registered
(after Wayfair) remote vendors without a physical presence as a share of total local revenue from
all remote vendors without a physical presence. As can be seen, these new vendors represent a
bit more than 10% of revenue from remote vendors. Given remote vendors without physical
presence raise approximately 14 percent of total local revenue, consistent with the prior figure,
newly registered vendors contribute only a small increase to total revenue.
However, the solid line in Figure 3 shows a potential redistribution of local revenue.
Recall that prior to Public Chapter 491 any local taxes from out-of-state dealers not using
destination sourcing were distributed to counties based upon the ratio of local tax collections in
the county over total local tax collections in all counties. Given the formula is based upon local
tax revenue for physical goods (where the goods sell), the formula does not well-approximate
destination sourcing and advantages large jurisdictions with many retail agglomerations.
Theoretically, large jurisdictions are potentially advantaged for two reasons. First, the bulk of
physical sales occur in places with retail agglomerations. Second, in standard tax competition
models (Kanbur and Keen 1993) large jurisdictions set higher tax rates than smaller jurisdictions,
potentially raising more revenue all else equal.22
As can be seen by the solid line in Figure 3, immediately following the passage of Public
Chapter 491, the number of vendors applying destination-sourcing to local sales increases
dramatically. By the middle of 2020, almost one hundred percent of remote vendors without a
physical presence have switched to destination sourcing.
B. The Distribution of Revenues Across Counties After Economic Nexus Reforms
While the prior section focused on the amount of new revenue, Figure 3 also suggests
that the distribution of revenues may have changed. Public Chapter 491 affects not just the
amount of revenue, but also the distribution of revenue. In Tennessee, this may have occurred
because of movement away from a formula that favored large jurisdictions and because online
sales from new vendors or resulting from shocks that encourage online shopping relative to
brick-and-mortar shopping, are now sourced at destination.
22 In Tennessee, this second reason is likely to play a minimal role because jurisdictions often
max out at the highest possible county sales tax rate (Luna, Bruce, and Hawkins 2007). Further,
small rural jurisdictions may primarily sell nontraded goods, such as in small restaurants, and can
set tax rates with minimal concern for cross border competition. But such an effect might arise in
other states or at a finer municipal level where there is potentially more variation in tax rates.

16
With respect to the latter channel, Covid-19 provides one such shock to online shopping.
Because of the rapid spread of Covid-19 starting in March 2020, many state governments began
to shut down and placed substantial limitations on what businesses could remain open.
Therefore, many individuals switched a substantial fraction of their retail purchases from brick-
and-mortar purchases to online purchases.
Agrawal and Wildasin (2020) provide a theoretical model that allows us to think about
the effects of such a shock. This dramatic shift to online purchases, combined with economic
nexus regulations that require online vendors to remit taxes on a destination-basis, erodes the tax
base of large agglomerated jurisdiction while increasing the tax base of smaller jurisdictions.
Intuitively, prior to the Covid-19 shock, individuals living in more remote and rural jurisdictions
needed to travel to suburban or urban jurisdictions for many of their purchases. Driving to these
retail shopping centers meant that they contributed tax revenue to these large jurisdictions. As a
result of the Covid-19 shock, these individuals no longer purchased goods at shopping malls
located outside of their hometowns and instead made the purchases online, which given the sales
are taxed at destination, contributed tax revenue to their home community. Thus, Covid-19
should provide a shock that erodes agglomeration benefits of large towns and redistributes
revenue from large to small jurisdictions.23 Critically, this redistribution would have been
dampened without the Wayfair ruling and appropriate state reforms.
In this section, we present compelling visual evidence on the distributional effects on tax
revenues across local governments as a result of the Wayfair ruling, the passage of economic
nexus, and due to the massive shock to online shopping from Covid-19. To do this, we split the
sample of 95 counties in Tennessee into three groups: the largest counties, the smallest counties,
and all other counties. While subjective, for purposes of this paper,24 we define the largest
counties as the four counties housing the principal cities (Memphis, Nashville, Knoxville, and
Chattanooga) in Tennessee’s main metropolitan areas. All four of these counties have more than
350,000 people living in them. The smallest counties are defined as counties in the bottom 50%
of counties based on population size. This threshold corresponds to counties with less than
32,000 people. Population acts as an exogenous proxy for economic activity.
While population is not a measure of retail agglomeration, it is correlated with
agglomeration. As shown in Figure 4, in normal times, the four largest counties raise
approximately 42 percent of all state and local sales tax revenue – more than proportional than
23 Covid-19 also triggers an economic shock, potentially reducing demand for retail purchases.
Thus, in our analysis below, we assume that any negative demand shock is similar in large and
small jurisdictions. Given we seek to analyze this issue descriptively, such an assumption is
plausible.
24 Results are similar if we use other definitions of large and small counties.

17
their share of the state’s population. The bottom 50 percent of counties contain 12 percent of the
state’s population and are approximately 9 percent of the state’s personal income but raise only 6
percent of total tax revenue. Given large counties raise proportionally more revenue than their
populations and small counties raise proportionally less revenues than their populations, this
highlights the spatial asymmetry of retail shopping opportunities. Critically, from Figure 4 we
can already see that the share of revenue raised in small counties has increased substantially
during the recent Covid-19 pandemic.
Note that any response immediately after the Wayfair decision should be due entirely to
voluntary compliance, as Tennessee did not change the compliance responsibility until October
2019, corresponding to the effective date of Public Chapter 491. For simplicity, we omit a line
for Covid-19, which led to many states closing non-essential businesses in March/April 2020.25
To study the effects of Wayfair, Public Chapter 491, and Covid-19 on the distribution of
tax revenues, Figure 5 plots tax revenue in the largest and smallest counties. Then, in Figure 6,
we plot the year-over-year growth rate (e.g., March 2019 relative to March 2018). Graphs
involving tax revenue levels are smoothed by removing month fixed effects and plotting a
moving average with equal weight to the given month, month prior and month later. Year over
year growth rate graphs (March 2019 / March 2020) do not remove month fixed effects and
simply plot a moving average.
Keeping in mind that Figure 5 removes seasonality using month fixed effects, in level
terms, the Wayfair ruling has no noticeable effect on tax revenues of small and large
jurisdictions, consistent with the number of newly registered out-of-state vendors being minimal.
However, in the few months after passage of Public Chapter 491, the level of revenues accruing
to small counties increases by several million dollars. Following the start of the Covid-19 shock,
which induced a dramatic shift to online purchases, revenues in small jurisdictions continue to
rise despite the negative economic shock from the virus. At the same time, revenues fall in large
jurisdictions following the shutdown of economic activity.
These effects are more noticeable in the year-over-year growth rates in Figure 6, which
because the year-over-year changes reduce seasonality, we do not adjust for month fixed effects.
Following the passage of Public Chapter 491, the growth rate increases in small counties more so
than in large counties. This is consistent with a shift from vendors using a single uniform rate
toward destination-based taxation. The online shopping shock induced by Covid-19 amplifies the
growth, with revenue in small jurisdictions rising 15 percent, while in large jurisdictions it turns
25 The Governor of Tennessee issued various executive orders, including restrictions on mass
gatherings on March 13, a request for business to shift to “alternative business models” on March
22, “safer at home” guidelines on March 30, and Executive Order No. 23 requiring Tennesseans
to stay at home except for essential activities on April 2, 2020.

18
to negative 15 percent. Certainly, the economic shock to Covid-19 is likely larger in urbanized
areas, and we do not claim these are the causal effects of a pure shift to online shopping. But
critical for us is that the growth rates in cities and more rural communities are opposite in sign,
which can only be explained by a shift to online shopping.26
With respect to the external validity of these results, the effect identified may be even
greater in other states. Several states, including Tennessee, apply an origin sourcing rule for
intrastate e-commerce sales, even if the purchase is delivered to a home address. In these nine
states,27 the online vendor applies tax to the product based on the point of origin (the “ship from
address”) for all transactions within the same state. In this way, if Amazon provides fulfilment
services for a local Tennessee firm, the tax revenue will go to the locality where the inventory
was stored. However, online transactions fulfilled by out-of-state remote vendors with nexus are
to be sourced at destination.
In states that do not have an origin sourcing rule, online sales are sourced at destination
regardless of whether they are intrastate or interstate. In these cases, the effects we identify
would apply to both intrastate sales and interstate sales. Given within state e-commerce
transactions are a nontrivial share of e-commerce (Hortaçsu, Martínez-Jerez, and Douglas, 2009),
we thus view the results in Tennessee as providing a lower bound on the shift of revenue from
large to small jurisdictions in purely destination sourcing states.
C. Local Sales Tax Issues of the Future
The prior analysis suggests an interesting redistribution of revenues following a massive
shock to online shopping. But the sign of the effects would also apply to smaller – and more
gradual – shocks that might arise from the cost of online shopping falling relative to the cost of
brick-and-mortar shopping. Costs may decline gradually as shipping costs fall, as aggregator
websites make it easier for consumers to find goods, as consumers become much more
accustomed to online shopping for more and more goods, or as retail-shopping locations become
further away due to store closures.
26 This assumes that Covid-19 does not induce individuals in smaller counties to switch from
larger urban places to local physical shopping (corner stores, etc.) According to the Department
of Commerce and Chetty, Friedman, Hendren, Stepner, and the Opportunity Insights Team
(2020), online purchases increased by 37% from the first to the second quarter of 2020,
suggesting the effect to online shopping represents a first-order effect especially as many goods
are likely not available at smaller local stores.
27 Two other states apply a hybrid sourcing rule where origin sourcing applies on some intrastate
e-commerce sales.

19
Overtime, such shocks will shift consumer purchases away from retail agglomerations
toward online purchases, which given economic nexus, can be taxed at the place of residence.
This will erode the taxable agglomeration rents of large jurisdictions with retail agglomerations
and fill the revenue coffers of smaller – more remote – jurisdictions. Thus, the sign of the effects
we identify in response to the Covid-19 shock may be similar to more gradual shocks from
technological change in the coming decades. In turn, in the future twenty years from now,
Wayfair may create winners and losers as online shopping costs continue to fall. Although
Wayfair, provides agglomerated jurisdictions with a way to tax their resident online purchases,
their tax bases may decline as they no longer may be able to engage in tax exporting to cross-
border shoppers who previously drove to shopping malls in large jurisdictions simply because
they had no retail centers nearby. In this way, even with economic nexus, the tax base remains
footloose, which in turn might encourage these jurisdictions to lower their tax rates, as they can
no longer take advantage of their agglomerations. But smaller jurisdictions benefit from online
shopping and destination sourcing, which lowers consumer mobility, perhaps encouraging them
to raise their tax rates.
Interestingly, as discussed in Agrawal and Wildasin (2020), as online shopping transfers
tax revenue from large to small jurisdictions, total local tax revenue may fall. If small
jurisdictions traditionally levy lower tax rates than large jurisdictions (Kanbur and Keen, 1993),
an online sale from a resident of a rural community is likely to be taxed at a lower rate than an
equivalent bricks-and-mortar purchase from an urban or suburban jurisdiction. In the nationally
representative dataset from Agrawal (2019), the average town plus sub-municipal district tax rate
in states allowing for local taxes is 1.16 percent for the top quartile of towns on the basis of
population and 0.70 for towns in the bottom three quartiles based on population.
The basis of the sales tax is often de facto defined as the place where receipt of goods or
services is taken. Consumers going into another state to cross border shop presumably create
issues similar to an e-commerce sale when a firm delivers goods to the consumers’ homes, even
though this issue has received little attention. In-state local taxes could also be altered in those
states that grant legal taxing authority of local sales taxes on a destination basis.
With respect to local tax competition, even if online sales are taxed under the destination-
principle, tax competition will still exist.28 As long as some goods (or services), need to be
purchased from a physical store, tax-induced incentives for cross-border shopping will persist.
Moreover, even though online vendors are required to remit taxes at destination, physical stores
and service providers still remit based on the origin principle. Moreover, jurisdictions may also
28 For studies of local tax competition, see Agrawal (2015), Agrawal (2019), Burge and Piper
(2012) and Burge and Rogers (2011).

20
compete for online shoppers: agglomerated jurisdictions may adjust their tax rates in order to
discourage online shopping. In the very long term, we could imagine a world where the cost of
online shopping is extremely low relative to brick-and-mortar sales and all purchases are online.
Only then will economic nexus eliminate inefficient tax competition for cross-border shoppers.
But, such a world may create other types of competition as individuals might then migrate to
avoid a purely destination-based sales tax, much like they may to avoid local income taxes (e.g.,
Schmidheiny 2006; Martinez 2019).
Finally, in most states, vendors file their local tax returns with the state government, and
they need not file returns in each locality. The future of local sales taxes may also be influenced
by the presence of six home rule states.29 Home rule states are those where local governments
(either county, town, districts or tribal governments) may collect and administer taxes
independently of the state government. However, the amount of independence varies across
states. Following Wayfair, the states also differ in how they are applying economic nexus rules
for localities. We discuss compliance costs in the next section, but generally abstract from the
added compliance costs imposed by home rule localities, which may be substantial.
IV. ADMINISTRATIVE AND COMPLIANCE ISSUES
A. Administrative Issues for Sourcing
States and businesses must settle on the meaning of “destination” and “origin,”
particularly in states where instate sales are taxed at origin and out of state sales at destination for
local tax purposes. The courts may also impose constraints on these decisions as shipments to a
particular location from out of state may result in both different compliance costs and different
tax rates than for shipments intrastate to the same location. As demonstrated above for
Tennessee, these decisions can have large distributional effects as revenues move from large to
small counties. The range of issues30 is likely to evolve with supply chains, development of
channels for obtaining goods and services, digitization of products and so forth. For example, at
what rate is tax imposed and which county receives the revenues for a sale by an out of state
vendor that is fulfilled through an instate location of a third-party facilitator? What if fulfillment
takes place from an out of state location for an in-state vendor? Such decisions potentially
require detailed information on which inventories are used for fulfillment and where the
inventories are held. Third party vendors could be required to separate the same product
29 These states include Alabama, Alaska, Colorado, Idaho, and Louisiana. In addition, Arizona
administers local jurisdictions’ sales taxes, but home rule applies for local tribal governments.
30 Interestingly, discussion has often focused traditionally on the difficulty of identifying
destination for indirect taxes. The concerns we raise suggest that determining origin can also be
very complicated as means of fulfillment transition over time.

21
according to specific ownership as they trace products to their origin or destination. Conclusions
on where origin and destination are located may offer tax planning opportunities for vendors.
B. Compliance Costs, the Filing Notch, and Audits
The Quill ruling created a characteristic notch based on geography and physical presence.
Firms without physical presence in a state could not be compelled to collect sales tax, though as
noted above, buyers were still expected to remit use tax. The notch existed because of
differential enforcement capacity for the sales tax relative to the use tax and not by an explicit
statute. Wayfair narrowed the notch by allowing states to require remote firms to collect and
remit sales tax, but all states (potentially except Kansas) include a small seller exception in their
economic nexus statutes. Thus, compliance is required for larger but not smaller remote firms.
Both large and small in-state firms are required to collect tax.31
Each state created a complex set of notches in its Wayfair economic nexus statute
regarding collection and remittance of tax by remote firms. The effective notches potentially
depend on the size of the state, the minimum threshold for a collection responsibility, the
channels added together to measure whether the threshold is met, and the frequency with which
the thresholds are calculated. As discussed above, states established compliance thresholds
ranging from $100,000 to $500,000 in yearly sales into the state (see Table 2), with some states
also having a requirement based on the number of transactions during the year. Other differences
exist across states. For example, some states base the threshold on the previous year’s sales and
others have a rolling threshold based on the most recent 12 months. Generally, these thresholds
are forward looking and either apply to the next calendar year or the next 12 months. Some states
may seek to assert that firms have taxable presence going forward once the threshold is met, but
the specific administrative rules are still being developed and generally have not been tested
through the legal system. These thresholds likely mean that much smaller firms are more likely
to be required to collect tax in large market states (high population/income) than in small market
states. For example, a firm selling evenly in proportion to population across the country would
need only $4.2 million in national sales to have a collection responsibility that met California’s
$500,000 threshold, but the same firm would need $37.1 million in sales to meet South Dakota’s
much lower $100,000 threshold.
Many firms sell through multiple channels including their own website and one or more
marketplaces. States differ in how and which sales are aggregated to determine whether the
threshold is met. As noted above, most states with economic nexus legislation also require
collection by marketplaces. The marketplaces may calculate and collect the tax but they
31 Some exceptions may exist for very low activity levels and differences often exist in required
frequency of filing tax returns.

22
generally do not remit the tax on behalf of vendors, which must file their own tax returns or hire
someone to do it for them. Some states sum all of these channels in determining whether the
threshold is met and others do not. Table 2 identifies states that include marketplace sales in
determining if the threshold is met.
The notches discussed above could increase compliance and administration costs and
cause bunching below the threshold. Firms cannot alter their current year compliance
responsibility by bunching in states that determine presence based on prior year sales, though
they potentially can influence nexus in the following year. Compliance burdens exist for those
firms that have a collection responsibility, but also for firms that need to track their sales to
determine whether they have sufficient economic presence to create nexus. Voluntary
compliance may be greater in states that determine nexus based on the most recent 12 months of
sales. Firms may be unsure whether they have a compliance responsibility may then voluntarily
comply to reduce their risks of failing to comply or to avoid certain compliance costs.
Different thresholds and approaches to measuring total sales across states add to the
compliance burdens as firms must understand the requirements for collecting for each state in
addition to measuring destination-based remote sales. The problem is exacerbated when firms
operate through multiple channels and need to aggregate data from different information systems
to determine whether thresholds are met and the associated tax liabilities. Further, states do not
always require destination situsing for instate sales even though they require it for out-of-state
sales, adding additional burdens as firms may situs some sales on a destination basis and other on
an origin basis.
The notches may be effectively larger than their legislated structure because states can
find it difficult to identify potential taxpayers and determine whether they are appropriately
complying with the law. The result could lead to significant evasion if states are unable to
convincingly audit firms. States will likely use multiple means to identify these firms, including
audits and data that is collected from related firms. Several vendors are also seeking to sell
software to states, that among other things, identifies firms that are believed to meet the
thresholds. Absent such third part reporting, some coordination across states may be necessary.
Although the notches could also cause bunching as firms seek to remain just under the
threshold, several factors reduce this possibility. Decentralization of thresholds to the state level
likely reduces bunching relative to a larger national threshold. Moreover, complexity of state
thresholds and collection by marketplaces makes bunching more difficult and perhaps not
worthwhile. But, in the extreme example, firms may seek to limit compliance by dividing into
multiple separate legal entities providing different products into states and targeting advertising
by geography. The costs and benefits of seeking legal ways to remain under thresholds may
cause firms to risk non-compliance as the means of avoiding a compliance responsibility.

23
V. TAXING DIGITAL SERVICES
A. Introduction to Taxation of Digital Services
In this section, we discuss several policy issues of the future in the context of
technological change creating new types of consumption patterns. Although the health care
sector is one of the fastest growing sectors in the economy, we exclude discussion of taxation of
health services given that such proposals are not politically feasible, and moreover, because
many broad-based consumption taxes around the world exempt the health care sector. Instead,
we focus on major issues most closely relating to online purchases and the digital economy. We
also emphasize base expansions that are of current interest to policymakers.
This section focuses on digital goods and services (as illustrated in Table 3) and not on
digital transaction platforms used to obtain goods and services. Airbnb, Uber, Amazon and
others are transaction platforms are marketplaces for obtaining goods and services and are not
the goods or services directly consumed, though as discussed below, they clearly add value by
allowing efficient access to these goods and services. Obviously, if a broad base is desired, final
goods and services obtained through these mechanisms should be subject to sales tax. The
marketplace or channel will generally be the most cost-effective means to collect and remit tax.
In particular, platforms like Airbnb and Uber can collect and remit tax more efficiently than the
myriad providers of transient housing and mobility.32 Moreover, these types of platforms are not
subject to the same types of externalities that are challenging for taxing two-sided platforms.
B. Digital Services
The policy prescriptions at the end of the introduction offer direction for expanding sales
tax structures as technological changes and digitization create new goods, services and
consumption channels. Wayfair reflects the Court’s understanding and allowance of taxation that
is neutral with respect to distribution channels, with small seller exceptions to limit the
compliance costs arising from sales into multiple markets. However, Wayfair only addresses
nexus issues associated with remote sales of taxable goods and services and does not speak to the
problem of sales tax laws that are too narrowly construed and out of date with respect to current
consumption behavior. Frequent updates of the sales tax base are imperative if states are to tax
evolving forms of consumption. Alternatively, states could entirely restructure their sales tax
laws to broadly tax consumption, which would generally incorporate new forms of consumption
32 See for example, Bibler, Teltser and Temblay (2020).

24
in the base, rather than the current approach often requiring piecemeal addition of services.
However, given recent history, such a broad reform is unlikely.
1. Current State Practice for Taxing Digitized Transactions
Taxing digitized transactions is not a new issue for states and remains a key next step for
many states to take given the rapid movement toward digitized goods and services. State statutes
vary widely in their coverage of digital goods and services and the sales tax in most states would
benefit from base expansions. Table 3 identifies the propensity of states to tax selected digital
and media services.33 Neutrality and equity, usually argue for taxing goods and services when
provided to consumers in digitized (as well as tangible) form to move the sales tax closer to a
consumption base. Further, the sales tax’s revenue elasticity will be greater if the tax base
includes evolving and rapidly growing components of consumption. The imperative of taxing
digitized services grows if very similar services are taxed in physical form.
States generally created their sales taxes as levies on tangible personal property (DVDs,
landline telephones, etc.) and services and digitized transactions have been added through a
variety of means, though often to a limited extent and with substantial variation across states.
Several states, including Hawaii, New Mexico34 and South Dakota tax many digitized services
and most consumer services (with a few exceptions). On the other hand, Garrett and Nulle
(2020) observe that Georgia, Nevada and Oklahoma are at the other extreme with little or no
taxation of digital transactions. Specific statutes were enacted in some states to expand the base
to select services,35 but in some cases without consideration of digitization. Some other states
have interpreted certain digitized transactions as the transfer of tangible personal property and
imposed tax through existing statutes. For example, 28 states define tangible personal property to
include prewritten computer software (see Garrett and Nulle, 2020), though they differ on
definitions of prewritten software. The problems of modernizing tax systems are complicated in
33 State taxation of services is taken from the Federal of Tax Administrators’ Services Tax
Survey for 2017. In some cases, the tax is imposed at a rate that differs from the general sales
tax. In other cases, states levy a tax other than the sales tax, such as in Delaware, which taxes
many of the services through gross receipts taxes and does not have a general sales tax, and in
Washington, which levies tax through its Business and Occupations Tax (potentially in addition
to the sales tax).
34 Hawaii and New Mexico’s sales taxes are gross receipts taxes on business revenues (with
certain exemptions), which often avoid the need to articulate specific services.
35 For example, North Carolina added digital newspapers, magazines, photographs and greeting
cards to the sales tax base in 2019 and updated the definitions of a number of digital products.
See N.C. Gen. Stat. § 105-164.3(#) and others.

25
states, such as Missouri, which have passed constitutional amendments to prohibit taxation of
new services. Constitutional bans, which surely have been enacted on political rather than
economic grounds, may include newly digitized goods requiring these states to use increasingly
inefficient tax structures.
At least 12 states define certain digital products, such as prewritten software, so that the
method of delivery is irrelevant but this is not the norm across the range of digital transactions.36
Nine states only tax prewritten software if delivered through tangible medium (see Garett and
Nulle, 2020). In addition, Rosen and Haffield (2016) observe that every state taxes tangible
recordings (such as DVDs and music CDs), but digital analogues are often not taxed. Only 27
states tax downloaded videos and 18 tax streaming of video. Twenty-eight states tax e-books;
states seldom tax magazines and newspapers, whether in physical or digital form.
2. Challenges for Taxing Digitized Transactions
Garrett and Nulle (2020) observe that state sales tax decisions on digital transactions
appear to be determined by whether the transactions are a digital product or a digital service,
whether software is different from digitally delivered content, whether the purchases are
downloaded or merely accessed, or whether they are live or recorded content. These distinctions
may fit taxation into existing statutes, but fail to address taxation of digital products in term of
goals for good tax policy in the presence of continually evolving consumption patterns.
Generally, the base should be determined by efficiency issues37 such as whether the purchase is
for final consumption and is fundamentally equivalent to other taxable transactions,
administrative concerns such as if transaction can be sourced to the destination, and the
compliance costs on firms.
Opponents of taxing digitized services (and services more broadly) often contend that
many transactions are intermediate purchases and expansion to services simply increases
distortionary effects of taxing inputs and pyramiding. States often have failed to enact
36 Texas defines prewritten software very broadly to include all forms but California does not tax
the electronic transfer since it is not the transfer of tangible personal property (see Rosen and
Haffield, 2016).
37 Long ago states imposed flat rates on all taxable transactions (with notable exceptions such as
transient accommodations, and even then often through separate taxes) or complete exemption
and ignored Ramsey rule efficiency concerns. See Sadka (1977) for conditions where uniform
tax rates are efficient. VAT policy is similar, with flat rates on a wide range of transactions.

26
exemptions for business purchases of services in the same manner as for goods,38 and in cases
where they have, it is likely difficult for the vendor to distinguish between final and intermediate
transactions (Phillips and Ibaid, 2019).39 We have little empirical evidence on the fraction of
digital goods and services that are business purchases, but there is some evidence for physical
goods (Ring 1989; Ring 1999; Wildasin 2001).
Big data and new technologies often allow services to be sitused either explicitly or
implicitly on a destination basis, but unique problems exist. Administrative issues arise as
consumers travel and purchase digital services on their own devices, such as on demand video, at
locations other than where they live or are billed for the service. It may be technically possible to
remit tax at the rate and location where each unit of service is used, but decisions must be made
on whether this level of preciseness is necessary to create a substantially destination-based tax.40
Vendors of digital goods may have some information on consumers, such as an email
addresses, but may not have geographic information on the buyer or consumer.41 The use tax can
be imposed on buyers, but will suffer from poor compliance as discussed above. A differing
problem arises for digital goods and services simultaneously consumed in multiple locations.
Rosen and Haffield (2016) explain a proposal for taxing difficult to source transactions at origin
rather than destination. Of course, this fails to reap the benefits of destination taxation.
Apportionment of the tax base has been suggested for products consumed at multiple locations,
consistent with state corporate tax practice.
Taxing digital services on a destination-basis is not just an issue for the U.S. sales tax
system, but creates similar challenges for the value added tax systems in the European Union.
38 Sales for resale and component parts of manufactured goods are examples of exemptions that
generally apply to goods but not services.
39 Mazerov (2009) provides policy discussion of the problems with imposing tax on intermediate
transactions. D’Annunzio, Mardan and Russo (2020) discuss a case where taxation of an
intermediary service provider is efficiency enhancing. These authors assume that one unit of
intermediate service needs to be consumed in order to consume the final good.
40 The issue of how precisely to determine the destination for taxes is not new. For example,
consider the case of cross border shoppers. The buyers’ tax rate could be linked to the place
where their credit card is billed, for example. In the case of consumption of digital services while
travelling, IP addresses could technically be used, but spoofing possibilities exist. Similar issues
also would arise in the apportionment of tax base discussed below for two-sided platforms.
41 Taxing services on a destination basis can be more difficult than for goods since a delivery
address is not likely to exist. We return to further complications due to the system of local
taxation subsequently.

27
Against this backdrop, OECD (2014, 2015) proposed guidelines on how to structure a
destination-based value added tax on digital services. In particular, OECD (2015) suggests that
consumption of digital taxes need not be taxed precisely where consumption occurs, but rather
the digital supplier should use all the available information, including address, credit card details,
and even IP address as proxies for the location of consumption (Hellerstein, 2016). In the U.S.
decentralized tax setting where consumers may have address information and credit card
information in different jurisdictions, potentially using out-of-town post office boxes for their
billing information, this might pose challenges. For further details on taxation of digital services
under the value added tax, see Agrawal and Fox (2017).
3. Taxation with Multi-sided Platforms
Recent years have seen amazing growth in the use of social media platforms, online
streaming services, and web-based information engines. Facebook, Google, Twitter, Instagram,
YouTube, Hulu, Pandora, Spotify and others potentially operate with two-sided – or more
generally, multi-sided – platforms characterized by two (or more) distinct sets of users.42 They
provide significant services to consumers, provide carefully targeted advertising, and potentially
sell data collected on the site to third parties. Social media consumers and advertisers do not
directly interact with each other, but externalities exist across the two sides of the platform. For
example, the value to advertising rises with the number of consumers and, assuming advertising
is viewed as a bad by the consumer,43 the consumption value of social media falls with more
advertising on the platform. The consumption value includes the benefits from allowing users
access to an attractive framework for connecting with a network of others. The platform can
generate revenue from one or both sides of the platform. These two-sided digital platforms
operate with indirect network externalities that create complex administrative tax issues for state
and local governments, particularly since much of the consumption value is not monetized to the
consumer though considerable value appears to exist for consumers.44 Failure to tax social media
42 The discussion focuses on two-sided platforms and not transactional platforms offering
services to consumers and advertisers and is not addressing taxation of marketplace facilitators
and other digital platforms that primarily provide exchanges between buyers and sellers, such as
Uber, Airbnb and others. The latter set of firms often fail the definition of two-sided platforms
(see Koethenbuerger, 2020) and do not pose the same sales tax issues discussed in this section.
Consumer purchases of goods and services obtained through these transaction platforms should
generally be subject to tax.
43 So, both sides of the platform may enter consumer utility functions.
44 See Kind, Koethenbuerger, and Schkelderup (2008), Koethenbuerger (2020), Kind and
Koethenbuerger (2018), Lassmann, Liberini, Russo, Cuevas, and Cuevas (2020), and Russo
(2019) .Koethenbuerger (2020) is primarily addressing corporate taxes in a case where relatively
little labor and capital is used in the source country to produce a service, which depends

28
appropriately runs the risk of continued erosion of the sales tax base. Discussion in the previous
sections suggests that the monetized sales to final consumers should be included in the sales tax
base, but two-sided platforms raise a number of other issues, especially when the service is not
monetized to the consumer. Although the value added tax has some advantages, platforms also
present issues for value added taxes.
In contrast to two-sided platforms, firms defined as transactional platforms are required
to collect and remit tax for individual sellers in most states, as described above, and it is most
efficient for firms such as Uber and Airbnb to collect and remit the tax for their many providers
even if they do not fit marketplace facilitator legislation. Marketplaces provide consumer value
by providing efficient means for consumers to obtain goods and services. However, the value of
the service is already included in the consumer price and a portion of which is retained or
transmitted to the marketplace to pay for the service. The important point is that the sales tax is
imposed on the entire consumer purchase, which includes the portion of the price remitted to the
vendor and the portion retained by the platform. Amazon provides a marketplace to connect
buyers and sellers but also provides other services, such as video and audio, and in this sense
may be both a marketplace and a two-sided platform.
Returning to the issue of two-sided platforms, pricing models for social media firms
range across the spectrum from only pricing advertising services (and perhaps the sale of digital
data) to only pricing the service to the consumer to hybrids of these two extremes. Netflix45 only
prices to consumers and Facebook only prices to advertisers. Newspapers generate revenues
from both sides. Thus, social media firms differ widely regarding whether they monetize services
to consumers. Marginal cost on both sides of the platform may be nearly zero (with high fixed
primarily on intellectual property. These papers are generally addressing international taxation of
digital services when international agreements complicate imposition of direct taxes. Bourreau,
Caillaud, and DeNjis (2018) examine the effects of adding a small tax on data offered through
two-sided markets in the presence of a VAT.
45 An argument can be made that Netflix is not a platform because it generates content and may
purchase the rights of other content, pricing it to the consumer. We are simply viewing Netflix as
at the consumer pricing edge of the pricing continuum of digital services that crosses from
complete consumer pricing to complete advertising pricing. If Netflix used just a small amount
of advertising, then it would clearly be a platform. Companies such as Facebook, on the other
hand, are essentially at the all-advertising end of the continuum. The content on Facebook and
Youtube can be thought of as being provided by the users but the firms may pay some content
providers and certainly impact the content through the framework that is provided for accessing
and viewing the content. So, the distinctions from Netflix are at best only by a small degree.

29
costs),46 which means firms maximize revenues across the two sides of the platform. In general,
price exceeds marginal cost to the social media firm on the priced sides of the platform if – as is
generally the case – marginal cost is sufficiently low.47 Maintaining consumption tax bases is
challenging in markets where companies are able to shift revenues between the two sides of the
platform. Among others, a neutral tax policy should be neutral with respect to consumption
decisions, social media companies’ internal business pricing models, and for business purchasers
of social media services. A key margin on the advertising side is competition with other
intermediate transactions purchased by the buyers.
Consider distortions along three margins on the consumer side of the platform: social
media monetized to the consumer offered by one company competing with social media not
monetized to the consumer offered by another, the same company providing both monetized and
non-monetized versions of the service, and non-monetized media services versus all other
consumption. Netflix prices to consumers, which competes with TikTok that is not priced to
consumers, as the latter generates revenues from other sides of the platform. Netflix services are
taxed in states that include video streaming in the base, so the tax distorts the choice of Netflix
versus Facebook or TikTok, but is neutral with respect to other taxed goods and services (such as
cable TV).
Pandora, Spotify and YouTube offer services with advertising and no-fee or alternatively
with a fee and no advertising, presumably to allow consumers with sufficient distaste for
advertising to purchase the service. These firms presumably separate their consumers into those
who pay for the service and those who receive service with advertising (though consumers may
shift from one group to another) as pricing decisions are made. Consumers are induced to select
services with advertising whenever the priced versions without advertising are subject to tax.48
The externality of advertising’s value rises with the number of consumers who receive
advertising and this further encourages firms to raise consumer prices for the version of the
service without advertising in order to increase the number who accept advertising. Of course, at
the extensive margin, raising the price risks consumers who cannot be induced to accept
46 In this sense, social media companies have similarities to natural monopolies with marginal
cost much lower than average cost.
47 Prices may not exceed social marginal cost if consumers regard advertising as a negative,
which is (at least to some extent) internalized to the social media firm if consumers reduce usage
of the media.
48 The problems discussed here are somewhat different with a VAT, which is generally paid on
both sides of the platform – on the purchase of social media services and the purchase of
advertising. A credit is given to advertisers for tax paid on purchases, so no distortion arises in
intermediate markets.

30
advertising to switch to other social media platforms. A clear understanding of consumer
preferences could permit social media companies to maximize revenues by setting the consumer
and advertiser prices based on willingness to pay for the social media service, consumer distaste
for ads that helps determine whether consumers can be moved from the priced to the advertising
side of the product, and the effects of the number of consumers on advertising revenues. The key
point is that a tax only on priced consumer services or only on advertising distorts the decision.
When platforms have various pricing options, taxing the consumer side but not the other
sides of the platform encourages social media firms to engage in tax avoidance strategies by
generating more revenue from the advertising side of the platform, so the tax distorts internal
pricing decisions and business models.49 Shifting revenue generation to the advertising side
presumably lowers revenues raised from consumers (though this depends on consumers’
willingness to pay for social media without advertising), raises the number of users (to the extent
that users prefer ads to prices at the margin), and makes advertising more valuable (if there are
more users opting for advertising). Similarly, a tax on the advertising side but not on the
consumer side could lead to greater reliance on consumer revenues.
4. Policy Options for Taxing Social Media
Several policy options are available to tackle these distortions, but each only addresses
some of the distortions arising from taxation and neutrality in intermediate transactions,
neutrality across different consumer services, and intra-firm social media choices. The options
are not mutually exclusive but are discussed separately. Each option improves the sales tax
revenue elasticity and horizontal equity.
Tax the implicit value of non-monetized consumer services. First, tax could be levied
on the implicit value of non-priced consumer services. Many other areas of non-priced
consumption exist and remain untaxed, but social media is distinct by virtue of its massive size
and growth.50 Under this proposal, the social media company must remit any implicit tax on the
value of consumer services as no financial relationship exists with non-monetized users. This
equalizes the initial incidence of the consumer side tax from the social media company’s
perspective. However, consumers of platforms like Spotify still have the incentive to reduce
49 Although not studying digital services, Elschner (2013) shows how taxes may distort
organizational form.
50 Similar issues arise with income taxes. Taxation of some fringe benefits under the individual
income tax provide evidence of non-monetized values being taxed to limit avoidance through
receipt of non-monetized fringe benefits. Another perhaps more directly relevant example is
attempts to tax banking services that are “paid for” with lower interest rates.
31
purchased services unless the social media company shifts some or all of the implicit tax to the
consumer by increasing the extent of advertising. Implicit taxes could also be imposed on non-
priced social media (Facebook), which equalizes the consumer’s decisions versus priced services
if (some of) the tax is forwarded shifted to consumers through more ads.
Valuing the non-monetized service to consumers is a key issue. The price charged to
those purchasing the service for firms such as Spotify provides a benchmark51 for value to other
consumers. However, no obvious means exists as a benchmark for social media that is never
priced. Kothenbuerger (2020) observes that there generally are no good external markets to use
as benchmarks, though his comments also refer to advertising.
Sales tax practice has not expanded broadly to taxing non-monetized transactions, though
examples exist.52 Promotional gifts given to customers are taxed as inventory when withdrawn
from nontaxable purposes and transferred to taxable purposes. Sales tax is levied on meals
provided to employees’ families in Virginia offers another example.53 In these cases, the tax is
based on cost to the providers. Taxation on non-monetized transactions obviously raises
administrative costs to the tax authority, may create evasion opportunities, and the valuation is
likely to lead to considerable controversy.54
Tax the non-consumer side of the platform. Levying sales tax on the non-consumer
sides of the platform is a second policy option.55 Most likely such a tax would be imposed on
51 Of course, revealed behavior suggests that those accepting the service without fee do not value
the service equal to the fee.
53 See “Virginia Tax Commissioner Explains Tax on Restaurant’s Complimentary Meals” in Tax
Notes.
54 The is an interesting parallel to the debate over whether income or expenditures should be used
as the tax base. Interestingly, Haig ranked utility, consumption expenditures, and accreditation
income as possible tax bases (Wildasin 1990), but he ends up as being credited as a proponent of
taxing income. This arose because he simply asserted that the measurement of consumption
expenditures was administratively infeasible. But, in part, technological change likely reversed
the view on the measurability of consumption expenditures in more recent times. It remains to be
seen how future technology may change the administrative burden of measuring digital services
consumption.
55 Maryland legislated a tax on advertising services in 2019, but it was subsequently vetoed by
the Governor.
32
both the consumer and non-consumer sides of the platform.56 Advertising has often paid for or
defrayed prices to consumers with historic two-sided platforms, such as with television, radio,
magazines, and newspapers, so the issue of services provided to consumers at subsidized or zero
price is new only to some degree. The magazines and newspapers may be sales taxed, but
without tax on the subsidized component of the price. Moreover, broadcast television is not
taxed. Florida sought to tax advertising services as part of its sales tax base expansion in 1986,
and this was likely an important reason for the base expansion’s rapid demise.
Four arguments for taxing advertising and consumer sales are provided. First, and the
strongest argument, advertising revenues could operate as a surrogate for the implicit value of
consumer services discussed above. Advertising can be thought of as a proxy for the marginal
social media user’s value (in the sense that she would cease using the platform if another dollar
of advertising is added), but would be a lower bound for value for other consumers. No
additional tax on the implicit value is necessary if this is the basis for taxing advertising. Second,
a tax on both sides of the platform substantially reduces firm incentives to engage in tax
avoidance in their pricing decisions. Effectively, a gross receipts tax is levied on all firm
revenues, similar to the gross receipts based sales tax used in states like Hawaii.57 The tax would
also be similar to a VAT that is imposed on all taxpayer sales, though the credit-invoice system
neutralizes VAT on intermediate sales. Third, a gross receipts tax on all social media firm
revenues ensures that firms not monetizing the entire service to consumers are subject to some
sales tax. Equity and revenue criteria justify some sales tax on firms providing significant
consumer services. Finally, advertising revenues are economic rents if price is well above
marginal cost, so the sales tax is extracting rents.
The gross receipts tax would be on some intermediate inputs, though a portion of ads are
for political, not-for profit and other purposes rather than being on intermediate transactions.
Non-business purchasers of advertising can be regarded as final consumers for sales tax
purchases. A tax on intermediate purchases of advertising only distorts choices between
advertising on social media and other intermediate inputs and only cascades if it is forward
shifted to buyers. The tax borne by social media firms may not create similar distortions. The tax
likely is not forward shifted to purchasers if social media companies are maximizing marginal
56 Revenues from both sides of the platform belong in calculations of a profits tax, VAT, and
gross receipts tax discussed by Koethenbuerger (2020). Problems similar to including tax at
destination can arise for both these taxes and sales taxes.
57 The Hawaii tax offers preferred rates for many intermediate transactions.

33
revenue minus zero marginal cost.58 Social media firms would not generate more profits by
shifting advertising prices if a percent of pure profits is extracted.
Sales taxes based on consumer priced services are sourced to the consumers’ destination
but the gross receipts base on advertising revenues is national or international in scope. The base
can be shared across the relevant subnational governments within the U.S. (or between
countries). The geographic location of users offers the best base for apportionment between state
and local governments. The number of users in a state, frequency of use, or depth of use (such as
time on the social media) provide options for apportionment across states.59 Presumably, IP
addresses could determine the consumer’s geographic location, although spoofing technology
may create challenges. Sales tax apportionment is already used for certain transactions, such as
when a company employs taxable software in multiple states simultaneously.
Significant potential revenue exists from taxing the non-consumer side of the platform;
Facebook offers an example of the potential tax base. North American Facebook revenues from
2019 Q2 through 2020 Q1 totaled $35.5 billion. Comparing this to the $5,270 billion of total
retail sales, indicates that size of the portion of consumption from Facebook alone represents 0.6
percent of total retail sales and a slightly smaller percent of total consumption. Thus, this would
raise a non-trivial amount of tax revenue. States taxing these revenues from Facebook at the 6
percent median state tax rate would generate $1.9 billion.60 In practice, the specific revenues
would be determined at each state’s tax rate and based on the apportionment of the base using
measures of consumption as described in the previous paragraph.
58 The discussion here assumes enforced destination taxes regardless where the firms are located.
Lassmann, Liberini, Russo, Cuevas, and Cuevas (2020) find evidence of forward shifting of
corporate income taxes into advertising prices and argue that the same could apply to gross
receipts taxes. However, their argument for shifting is in an economy with source-based taxation
and multiple countries where only domestic companies are subject to the tax. Russo (2019)
discusses research on forward shifting of the sales tax to final consumers, but the tax offered here
is levied on intermediate services provided by firms with significant market power and very low
marginal costs. Thus, prior research on sales tax incidence is not likely to apply here.
59 This differs from apportioned corporate income taxation in several ways. First, the intent is to
tax consumption, not profits, so the base is revenues with no deduction for costs. Second,
apportionment would be based on a measure of users and would not include a combination of
payroll, property, or sales (since there is no sale to the consumer) as with the traditional
corporate income tax. It should be noted that corporate taxation increasingly focuses on
apportionment to the destination by overweighting sales.
60 Total North American Facebook revenues were adjusted down assuming the taxable share of
revenues is proportional to the share of population in U.S. states with sales taxes relative to the
total U.S. and Canada population. Thus, the potential tax base was reduced by 12.56 percent.

34
Although taxation of digital services appears daunting, we hope that the above analysis
will provide states with a policy guide to be able to discuss the pros and cons of various policy
options. As well, many of the policy issues discussed above are also informative for countries
around the world that may be considering how to tax digital services under the value added tax.
Now is the time to modernize our tax systems for the future.
VI. CONCLUSION
Throughout recent history, technology has rapidly evolved. This technical change affects
the way people buy goods, the business model of retail firms, and the types of goods that are
consumed. Initially, technological change lowered the cost of getting goods to market. For
example, the invention of the automobile and refrigeration gave rise to new shopping patterns
that allowed chain stores to drive out smaller mom-and-pop stores. Catalog sales then allowed
consumers to buy goods from remote vendors. The recent decade has proven no exception: the
continued rise of e-commerce and online giants such as Amazon allow consumers to buy goods
from near and far. But technological change has also affected how and what we consume. More
recently, the rise of marketplace facilitators has spurred new competition from smaller remote
vendors while platforms like Airbnb and Uber have shocked the hotel and taxicab industries.
Finally, the rise of digital services such as Twitter, Facebook, and Google provide new types of
consumption that were unimaginable fifty years ago.
At the same time, the institutions that structure our political system evolve incrementally
and provide links between the past and the present (North, 1991). This means that institutions
may yield policies that are state dependent, whereby past policies influence the probabilities of
future outcomes. This can lead to path dependence whereby those state dependent outcomes
converge to an equilibrium. In the case of fiscal systems, institutions shape the breadth of the tax
bases we have, the patterns of tax rates, and the enforcement mechanisms we design. Certainly,
current day fiscal policies are not preordained, but they are highly dependent on the historical
design of early fiscal systems and therefore evolve gradually. And, these fiscal policies influence
development of new technologies, as in the case of ecommerce, where growth was likely initially
spurred by inability to enforce destination-based taxes on remote sales as firms were incentivized
to remain remote to avoid requirements to collect and remit the sales tax.
Rapid technological change and incremental evolution of fiscal systems are at tension
with one another. The speed at which technology evolves is much more rapid than how quickly
our institutions adapt to those changes, which means that our fiscal systems are often
inconsistent or out of step with current day business models, patterns of consumption, and means
of tax avoidance or evasion. Certainly, this is true with the retail sales tax, which has been
significantly influenced by its roots in the Great Depression where state governments established
the tax on retail sales of goods and not services. This historical choice was due to retail sales

35
being a high share of consumption and concerns about difficulties of enforcing the tax on
services, where many service providers were small (Mikesell, 2018). These historical choices
continue to shape the structure of the sales tax today, despite services rising as a share of
consumption and despite improved enforcement abilities on service providers. The pace with
which technology is developing and being adapted has accelerated, increasing the tension with
incremental institutional change and likely exacerbating problems for efficient market
development.
In recent years, the states demonstrated a willingness to make some changes, especially
with respect to nexus questions for remote vendors. In this case, it was not the state-level
institutions that made change incremental, but rather the constraints imposed by federal judicial
rulings and the unwillingness of Congress to take action with respect to those rulings. Congress
failed to act so that states could compel online vendors to remit taxes without having a physical
presence, despite widespread support from state governments. Why would Congress be at odds
with so many state legislatures? Because the sales tax is a decentralized tax, Congress would
have borne all the political costs (e.g., lobbying from large online vendors and discontent from
online purchasers) but realized none of the benefits (e.g., increased tax revenue), although
support from state governments might be a small offset. Thus, when thinking about what the
sales tax will look like thirty years from now, it is important to remember that the hands of state
policymakers are constrained by federal actions (Stark, 2021).
At the same time, technological change can become so rapid or higher-level reforms or
Court decisions like Wayfair may be so powerful, that they provide an impetus to begin systemic
reforms or make the absence of reform less important as local distribution centers became more
important. Certainly, recent years may provide such a policy window for governments to
broaden their tax bases. While it is likely that this broadening will be incremental, even small
amounts of tax base broadening may generate substantial revenues for state and local
governments and lessen distortions from uneven taxation.
In theory, a value added tax and a sales tax on a commodity are equivalent. But,
economists are often quick to advocate for a value added tax due to its self-enforcing properties
and more tractable treatment of intermediate purchases. Recent research has challenged the
conventional wisdom of the self-enforcing properties due to vulnerabilities on enforcement of the
VAT (Keen, 2007; Waseem, 2020). Moreover, much of the discontent with the sales tax comes
from the way the sales tax has been historically operationalized in the United States – a narrow
base with possible cascading elements and problematic enforcement of destination taxation. But,
these need not be defining characteristics of a sales tax. Recent expansions by the states to
selective services suggest a desire to broaden the sales tax base. The recent Wayfair decision
makes some progress at effective destination sourcing in a decentralized tax system that is
arguably more difficult to achieve under a value added tax (Keen 2000).

36
Figure 1: Tax Revenue as a Percent of Total Taxes or GDP
Panel A: Income and Sales Tax Revenue as a Percent of Total Tax Revenue
Panel B: General Sales Tax Revenue as a Percent of GDP
Note: Panel A shows U.S. general state sales tax revenue and income tax revenue as a share of
total own source tax revenue. Panel B shows U.S. general state sales tax revenue as a percent of
GDP. Source: U.S. Bureau of the Census, Quarterly Survey of State and Local Tax Revenue.

37
Figure 2: Local Tax Revenue from Remote Sellers in Tennessee
Note: This figure shows the total amount of local sales tax revenue from remote sellers and the
total amount of local sales tax revenue from newly registered vendors after the Wayfair decision
in Tennessee. Both series rely on on self-reported information by the vendor. Local sales tax
revenue from remote sellers is adjusted by removing month fixed effects. The first vertical line
corresponds to the Wayfair decision. The second vertical line corresponds to the month prior to
Public Chapter 491 going into effect and firms with economic nexus being required to remit
under Public Chapter 429. Source: Tennessee Department of Revenue.

38
Figure 3: Percent of Local Revenue from Remote Sales that Is Sourced at
Destination or from New Vendors
Note: This figure shows the percent of local sales tax revenue from remote vendors that is
sourced at destination in Tennessee. Prior to Public Chapter 491, remote vendors could source
local taxes using a single rate or based on the destination rate. This figure does not include data
for online vendors making within state sales. Additionally, the figure shows the percent of local
sales tax revenue from remote vendors that is collected from vendors that newly register after
Wayfair. The first vertical line corresponds to the Wayfair decision. The second vertical line
corresponds to the month prior to Public Chapter 491 going into effect and firms with economic
nexus being required to remit under Public Chapter 429. Source: Tennessee Department of
Revenue.

39
Figure 4: Share of Total Revenue Raised in Large and Small Counties
This figure shows the percent of local sales tax revenue raised in large and small counties over
time in Tennessee. Large counties are defined as the four counties housing the four largest
principal cities (Memphis, Nashville, Knoxville, and Chattanooga) of Tennessee’s metropolitan
areas. Small counties are defined as the smallest 50 percent of counties based on population size.
The first vertical line corresponds to the Wayfair decision. The second vertical line corresponds
to the month prior to Public Chapter 491 going into effect and firms with economic nexus being
required to remit under Public Chapter 429. Covid-19 began to shut down state economies in
March/April 2020. Source: Tennessee Department of Revenue.

40
Figure 5: Tax Revenue Raised in Large and Small Jurisdictions
Panel A: Small Counties
Panel B: Large Counties
This figure shows the amount of local sales tax revenue in large and small counties over time in Tennessee. Large
counties are defined as the four counties housing the four largest principal cities (Memphis, Nashville, Knoxville,
and Chattanooga) of Tennessee’s metropolitan areas. Small counties are defined as the smallest 50 percent of
counties based on population size. To remove volatility, we remove month fixed effects, adding back in the value in
the month prior to Public Chapter 491, and then plot a moving average of this series. The first vertical line
corresponds to the Wayfair decision. The second vertical line corresponds to the month prior to Public Chapter 491
going into effect and firms with economic nexus being required to remit under Public Chapter 429. Covid-19 began
to shut down state economies in March/April 2020. Source: Tennessee Department of Revenue.

41
Figure 6: Tax Revenue Growth in Large and Small Jurisdictions
This figure shows the year-over-year growth in tax revenue in large and small counties over time in Tennessee.
Large counties are defined as the four counties housing the four largest principal cities (Memphis, Nashville,
Knoxville, and Chattanooga) of Tennessee’s metropolitan areas. Small counties are defined as the smallest 50
percent of counties based on population size. We plot a moving average of this series. The first vertical line
corresponds to the Wayfair decision. The second vertical line corresponds to the month prior to Public Chapter 491
going into effect and firms with economic nexus being required to remit under Public Chapter 429. Covid-19 began
to shut down state economies in March/April 2020. Source: Tennessee Department of Revenue.

42
Table 1: Personal Consumption Expenditures By Category
1979 2019
Durable Goods 14.3% 10.5%
Autos 5.7% 3.6%
Furniture and Household 4.1% 2.5%
Other Durables 4.5% 4.5%
Nondurable Goods 32.3% 20.5%
Food and Beverage 13.8% 7.1%
Other Nondurables 18.5% 13.4%
Services 53.5% 69.0%
Total Expenditures 100% 100%
This table indicates the percent of total expenditures that is spent on durable goods, nondurable goods, and services
over time in the United States. Source: Bureau of Economic Analysis.

43
Table 2: State Nexus Rules
State Notes Effective Date Threshold Transactions Marketplace Sales
Alabama October 1, 2018 $250,000 0
Alaska Local Rules Apply
Arizona October 1, 2019 $200,000 0
2020 $150,000 0
2021 $100,000 0
Arkansas July 1, 2019 $100,000 200 0
California April 1, 2019 $500,000 1
Colorado December 1, 2018 $100,000 200 0
April 14, 2019 $100,000 0
Connecticut December 1, 2018 $250,000 200 1
July 1, 2019 $100,000 200 1
Delaware N/A
District of Columbia January 1, 2019 $100,000 200 1
Florida Proposed July 1, 2020 $100,000 200
Georgia January 1, 2019 $250,000 200 1
January 1, 2020 $100,000 200 1
Hawaii July 1, 2018 $100,000 200 1
Idaho June 1, 2019 $100,000 1
Illinois October 1, 2018 $100,000 200 0
Indiana October 1, 2018 $100,000 200 0
Iowa January 1, 2019 $100,000 200 1
July 1, 2019 $100,000 1
Kansas Proposed October 1, 2019 $100,000
Kentucky October 1, 2018 $100,000 200 1
Louisiana July 1, 2020 $100,000 200 0
Maine July 1, 2018 $100,000 200 0
Maryland October 1, 2018 $100,000 200 1
Massachusetts October 1, 2017 $500,000 100 0
October 1, 2019 $100,000 0
Michigan October 1, 2018 $100,000 200 1
Minnesota October 1, 2018 $100,000 100 1
October 1, 2019 $100,000 200 1
Mississippi September 1, 2018 $250,000 1
Missouri Proposed January 1, 2021 $100,000
Montana N/A
Nebraska April 1, 2019 $100,000 200 1
Nevada November 1, 2018 $100,000 200 1
New Hampshire N/A
New Jersey November 1, 2018 $100,000 200 1
New Mexico July 1, 2019 $100,000 0
New York June 21, 2018 $300,000 100 1
June 24, 2019 $500,000 100 1
North Carolina November 1, 2018 $100,000 200 1
North Dakota October 1, 2018 $100,000 200 0
December 31, 2018 $100,000 0
Ohio January 1, 2018 $500,000 1
August 1, 2019 $100,000 200 1
Oklahoma November 1, 2019 $100,000 0
Oregon N/A

44
Pennsylvania July 1, 2019 $100,000 1
Rhode Island July 1, 2019 $100,000 200 1
South Carolina November 1, 2018 $100,000 1
South Dakota November 1, 2018 $100,000 200 1
Tennessee October 1, 2019 $500,000 0
October 1, 2020 $100,000 1
Texas October 1, 2019 $500,000 1
Utah January 1, 2019 $100,000 200 0
Vermont July 1, 2018 $100,000 200 1
Virginia July 1, 2019 $100,000 200 0
Washington October 1, 2018 200 1
March 14, 2019 $100,000 1
West Virginia January 1, 2019 $100,000 200 1
Wisconsin October 1, 2018 $100,000 200 1
Wyoming February 1, 2019 $100,000 200 0
This table shows the adoption date of economic nexus rules by state along with any thresholds (in sales or
number of transactions) necessary to trigger economic nexus. The marketplace sales column includes a 1 if
marketplace facilitator revenues are included in calculations of whether the threshold is met and a 0 otherwise.
Source: Sales Tax Institute, Economic Nexus State Guide
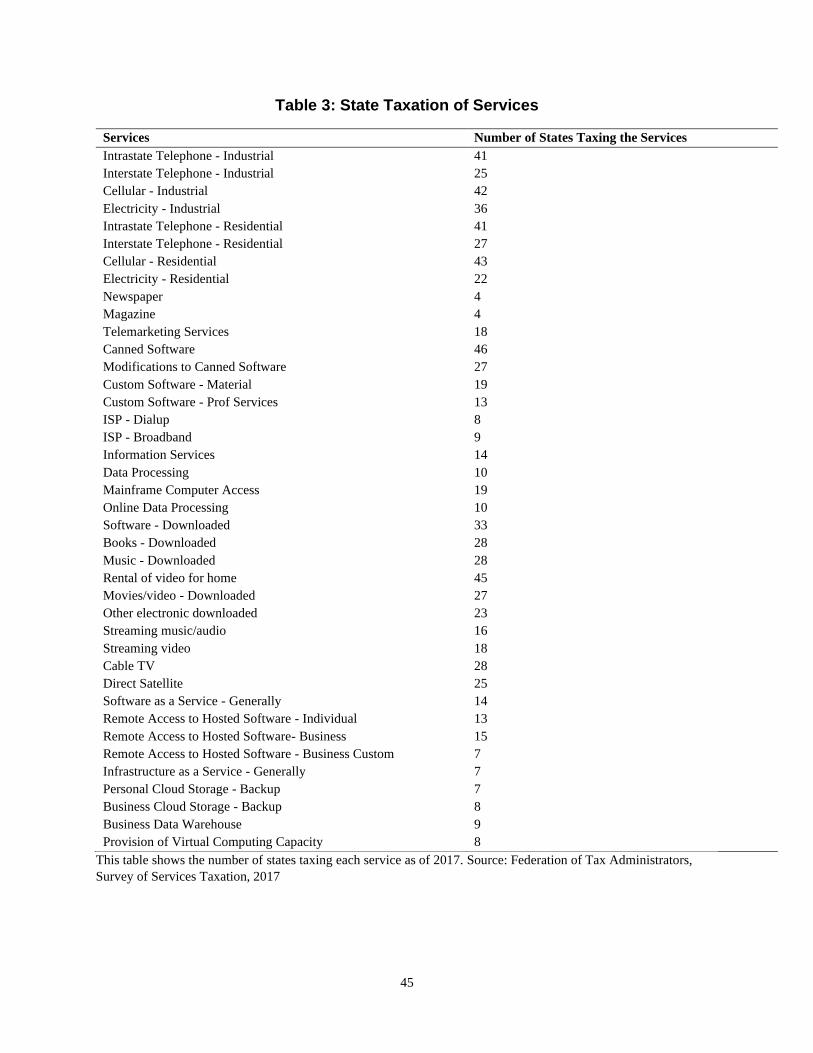
45
Table 3: State Taxation of Services
Services Number of States Taxing the Services
Intrastate Telephone - Industrial 41
Interstate Telephone - Industrial 25
Cellular - Industrial 42
Electricity - Industrial 36
Intrastate Telephone - Residential 41
Interstate Telephone - Residential 27
Cellular - Residential 43
Electricity - Residential 22
Newspaper 4
Magazine 4
Telemarketing Services 18
Canned Software 46
Modifications to Canned Software 27
Custom Software - Material 19
Custom Software - Prof Services 13
ISP - Dialup 8
ISP - Broadband 9
Information Services 14
Data Processing 10
Mainframe Computer Access 19
Online Data Processing 10
Software - Downloaded 33
Books - Downloaded 28
Music - Downloaded 28
Rental of video for home 45
Movies/video - Downloaded 27
Other electronic downloaded 23
Streaming music/audio 16
Streaming video 18
Cable TV 28
Direct Satellite 25
Software as a Service - Generally 14
Remote Access to Hosted Software - Individual 13
Remote Access to Hosted Software- Business 15
Remote Access to Hosted Software - Business Custom 7
Infrastructure as a Service - Generally 7
Personal Cloud Storage - Backup 7
Business Cloud Storage - Backup 8
Business Data Warehouse 9
Provision of Virtual Computing Capacity 8
This table shows the number of states taxing each service as of 2017. Source: Federation of Tax Administrators,
Survey of Services Taxation, 2017

46
DISCLOSURES
The authors have no financial arrangements that might give rise to conflicts of interest
with respect to the research reported in this paper.
ACKNOWLEDGEMENTS
We thank Donald Bruce, Naomi Feldman, Mohammed Mardan, Scott Peterson, Iuliia
Shybalkina, Kirk Stark, David Wildasin, and George Zodrow for comments.

47
REFERENCES
Afonso, Whitney B., 2019. “The Barriers Created by Complexity: A State-by-State Analysis of
Local Sales Tax laws in Light of the Wayfair Ruling.” National Tax Journal 74 (4), 777-800.
Agrawal, David R., 2015. “The Tax Gradient: Spatial Aspects of Fiscal Competition,” American
Economic Journal: Economic Policy 7 (2), 1-29.
Agrawal, David R., 2019. “The Internet as a Tax Haven? The Effect of the Internet on Tax
Competition.” SSRN Working Paper.
Agrawal, David R. and William F. Fox, 2017. “Taxes in an E-Commerce Generation,”
International Tax and Public Finance 24, 903-926.
Agrawal, David R. and Mohammed Mardan, 2019. “Will Destination-based Taxes Be Fully
Exploited When Available? An Application to the U.S. Commodity Tax System,” 169, 128-143.
Agrawal, David R. and David E. Wildasin, 2020. “Technology and Tax Systems.” Journal of
Public Economics 185: 104082.
Ballard, Charles L., and Jaimin Lee, 2007. “Internet Purchases, Cross-Border Shopping and
Sales Taxes.” National Tax Journal 60 (4), 711–725.
Baugh, Brian, Itzhak Ben-David and Hoonsuk Park, 2018. “Can Taxes Shape an Industry?
Evidence from the Implementation of the ‘Amazon Tax’.” Journal of Finance 73 (4), 1819-1855.
Bibler, Andrew J., Keith F. Teltser, and Mark J. Tremblay, 2020. “Inferring Tax Compliance
from Pass-through: Evidence from Airbnb Tax Enforcement Agreements.” Review of Economics
and Statistics. Forthcoming.
Bourreau, Marc, Bernard Caillaud, and Romain De Njis, 2018. “Taxation of a Digital Monopoly
Platform,” Journal of Public Economic Theory 20(1), 40-51.
Bruce, Donald and William F. Fox, 2000. “E-Commerce in the Context of Declining State Sales
Tax Bases.” National Tax Journal. 53 (4), 1373-1388.
Bruce, Donald, William F. Fox, and LeAnn Luna, 2015. “E-Tailer Sales Tax Nexus and State
Tax Policies.” National Tax Journal. 68 (3S), 735–766.
Buera, Francisco J. and Joseph P. Kaboski, 2012. “The Rise of the Service Economy.” American
Economic Review 102 (6), 2450-2569.
Burge, Gregory S. and Brian Piper, 2012. “Strategic Fiscal Interdependence: County and
Municipal Adoptions of Local Option Sales Taxes,” National Tax Journal 65 (2), 387-416.

48
Burge, Gregory, and Cynthia Rogers, 2011. “Local Option Sales Taxes and Consumer Spending
Patterns: Fiscal Interdependence Under Multi-tiered Local Taxation,” Regional Science and
Urban Economics 41, 46-58.
Chetty, Raj, John N. Friedman, Nathaniel Hendren, Michael Stepner, and the Opportunity
Insights Team, 2020. “The Economic Impacts of COVID-19: Evidence from a New Public
Database Built Using Private Sector Data,” Working paper, November.
Clark, Benjamin Y., 2020. “The Impacts of Autonomous Vehicles on Local Government
Budgeting and Finance: Case of Solid Waste Collection,” National Tax Journal 73 (1),
259-281.
D’Annunzio, Anna D., Mohammed Mardan and Antonio Russo, 2020. “Multi-part Tariffs and
Differentiated Commodity Taxation,” RAND Journal of Economics, 51(3), 786-804.
Einav, Liran, Dan Knoepfle, Jonathan Levin, and Neel Sundaresan, 2014. “Sales Taxes and
Internet Commerce.” American Economic Review 104 (1), 1–26.
Ellison, Glenn, and Sara F. Ellison, 2009. “Tax Sensitivity and Home State Preferences in
Internet Purchasing.” American Economic Journal: Economic Policy 1 (2), 53–71.
Elschner, Christina, 2013. “Special Tax Regimes and the Choice of Organizational Form:
Evidence from the European Tonnage Taxes.” Journal of Public Economics 97, 206-216.
Fisher, Ronald C., 2020. “Governmental Expenditure Implications of Autonomous Vehicles,”
National Tax Journal 73 (1), 235-258.
Fox, William F., 2016. “Economic Importance and Conceptual Framework of the Sales Tax,” in
Sales Taxation, 2nd edition, edited by William F. Fox, Institute for Professionals in Taxation
Fox, William F., 2020. “The Influence of Autonomous Vehicles on States Tax Revenues,”
National Tax Journal 73 (1), 199-234.
Fox, William F., Enda Hargaden, and LeAnn Luna, 2020. “Statutory Incidence and Sales Tax
Compliance: Evidence from Wayfair,” October 15.
Fox, William F. and Matthew Murray, 1988. “Economic Aspects of Taxing Services,” National
Tax Journal 41 (1), 19-36.
Garrett, Natalia and Grant Nulle, 2020. “Digital Goods and Services: How States Define, Tax
and Exempt these Items,” State Tax Notes, May 18.

49
Gillitzer, Christian, Henrik Jacobsen Kleven, and Joel Slemrod. 2017. “A Characteristics
Approach to Optimal Taxation: Line Drawing and Tax-Driven Product Innovation,” The
Scandinavian Journal of Economics 119 (2), 240-267,
Goolsbee, Austan, 2000. “In a World Without Borders: The Impact of Taxes on Internet
Commerce.” Quarterly Journal of Economics 115 (2), 561–576.
Goolsbee, Austan, Michael Lovenheim, and Joel Slemrod, 2010. “Playing with Fire: Cigarettes,
Taxes, and Competition from the Internet.” American Economic Journal: Economic Policy 2 (1),
131–154.
Hellerstein, Walter, 1988. “Florida’s Sales Tax on Services,” National Tax Journal 41 (1), 1-18.
Hellerstein, Walter, 2016. A Hitchhiker’s Guide to the OECD’s International VAT/GST
Guidelines. Florida Tax Review 18 (10), 589–637.
Hines, James R., Jr., 2007. “Taxing Consumption and Other Sins.” Journal of Economic
Perspectives 21 (1), 49-68.
Hortaçsu, Ali, F. Asís Martínez-Jerez, and Jason Douglas, 2009. “The Geography of Trade in
Online Transactions: Evidence from eBay and MercadoLibre.” American Economic Journal:
Microeconomics 1 (1), 53-74.
Johannesen, Niels, Patrick Langetieg, Daniel Reck, Max Risch and Joel Slemrod, 2020. “Taxing
Hidden Wealth: The Consequences of US Enforcement Initiatives on Evasive Foreign
Accounts.” American Economic Journal: Economic Policy 12 (3), 312-346.
Kanbur, Ravi and Michael Keen, 1993. “Jeux Sans Frontières: Tax Competition and Tax
Coordination When Countries Differ in Size,” The American Economic Review 83 (4), 877-892.
Keen, Michael, 2000. “VIVAT, CVAT, and All That; New Forms of Value-Added Tax for
Federal Systems,” IMF working paper 2000/83.
Keen, Michael. 2007, “VAT Attacks!” International Tax and Public Finance 14 (4), 365-381.
Kind, Hans Jarle and Marko Koethenbuerger, 2018. “Taxation in Digital Media Markets,”
Journal of Public Economic Theory 20 (1), 22-39.
Koethenbuerger, Marko, 2020. “Taxation of Digital Platforms.” EconPol Working Paper 41,
January, Vol. 3.

50
Kranz, Stephen, 2020. “Marketplace Facilitators,” PowerPoint presented to Southeastern
Association of Tax Administrators, August 25.
Lassmann, Andrea, Federica Liberini, Antonio Russo, Ángel Cuevas and Ruben Cuevas, 2020.
“Global Spillovers of Taxation in the Online Advertising Market. Theory and Evidence from
Facebook,” CESifo Working Paper No. 8149.
Luna, LeAnn, Donald J. Bruce, and Richard R. Hawkins, 2020. “Maxing Out: An Analysis of
Local Option Sales Tax Rate Increases.” National Tax Journal 60 (1), 45-63.
Martínez, Isabel, 2019. “Beggar-Thy-Neighbour Tax Cuts: Mobility after a Local Income and
Wealth Tax Reform in Switzerland,” Working paper, October.
Mazerov, Michael, 2009. “Expanding Sales Taxation of Services: Issues and Options,” Center
for Budget and Policy Priorities, August 10.
McLure, Charles E., Jr., 1998. “Electronic Commerce and the Tax Assignment Problem:
Preserving State Sovereignty in a Digital World,” State Tax Notes 14, 1169-1181.
McLure, Charles E., Jr., 1999. “Electronic Commerce and the State Retail Sales Tax: A
Challenge to American Federalism,” International Tax and Public Finance 6, 193-224.
Mikesell, John L, 2018. “The American Retail Sales Tax: Depression’s Child in the New
Economy of the 21st Century.” Working paper, April 17.
Mikesell, John L. and Justin M. Ross, 2019. “After Wayfair: What Are State Use Taxes Worth?”
National Tax Journal 72 (4), 801-820.
North, Douglass C., 1991. “Institutions.” Journal of Economic Perspectives 5 (1), 97-112.
OECD, 2014. “Addressing the Tax Challenges of the Digital Economy.” OECD/G20 Base
Erosion and Profit Shifting Project, OECD Publishing.
OECD, 2015. “International VAT/GST Guidelines.” Paris: OECD Publishing.
Phillips, Andrew and Muath Ibaid, 2019. “The Impact of Imposing Sales Taxes on Business
Inputs,” State Tax Research Institute, Council on State Taxation.
Ring, Raymond J., Jr., 1989. “The Proportion of Consumers’ and Producers’ Goods in the
General Sales Tax,” National Tax Journal 42 (2), 167-179.
51
Ring, Raymond J., Jr., 1999. “Consumers’ Share and Producers’ Share of the General Sales
Tax,” National Tax Journal 52 (1), 79-90.
Rosen, Arthur R. and Susan Haffield, 2016. “Sales Taxation and E-Commerce” in Sales
Taxation, 2nd edition, edited by William F. Fox, Institute for Professionals in Taxation.
Russo, Karl, 2019. “Superiority of the VAT to Turnover Tax as an Indirect Tax on Digital
Services,” National Tax Journal, 72 (4), 857-880.
Sadka, Efraim, 1977. “A Theorem on Uniform Taxation,” Journal of Public Economics, 7, 387-
391.
Schmidheiny, Kurt, 2006. “Income Segregation and Local Progressive Taxation: Empirical
Evidence from Switzerland,” Journal of Public Economics, 90 (3), 429-458.
Slemrod, Joel, 2019. “Tax Compliance and Enforcement.” Journal of Economic Literature 57
(4), 904-954.
Smith, Vickie, 2018. “2018 Compliance Study,” State of Washington, December
https://dor.wa.gov/sites/default/files/legacy/Docs/Reports/Compliance_Study/compliance_study_
2018.pdf
Stark, Kirk, 2021. “South Dakota v. Wayfair: One Small Step for Man.” National Tax Journal.
Waseem, Mazhar, 2020. “Overclaimed Refunds, Undeclared Sales, and Invoice Mills: Nature
and Extent of Noncompliance in a Value-Added Tax.” October 2020.
Wildasin, David, 1990. “R. M. Haig: Pioneer Advocate of Expenditure Taxation?” Journal of
Economic Literature 28 (2), 649-654.
Wildasin, David E., 2001. “Sales Taxation in Kentucky: Problems and Prospects.” In D.E.
Wildasin, M.T. Childress, M. Hackbart, L.K. Lynch, and C. W. Martie (eds.), Financing State
and Local Government: Future Challenges and Opportunities, Kentucky Long Term Policy
Research Center, 27-38.