david marques-ibanez european central bank · david marques-ibanez european central bank (with...
TRANSCRIPT
Bank Risk during the Financial Crisis: Do business models matter?
David Marques-Ibanez European Central Bank
(with Simone Manganelli and Yener Altunbas)
The opinions are those of the authors only and do not necessarily refflect the views of the European Central Bank
The evaluation management and sharing of risks is one of the core activities of the banking sector:
• Delegated monitors: better than other institutions at screening and managing risks (Diamond, 1984),
• Better than markets at handling risks that can not be diversified (Allen and Gale, 1997).
Managing risks is core to banks…
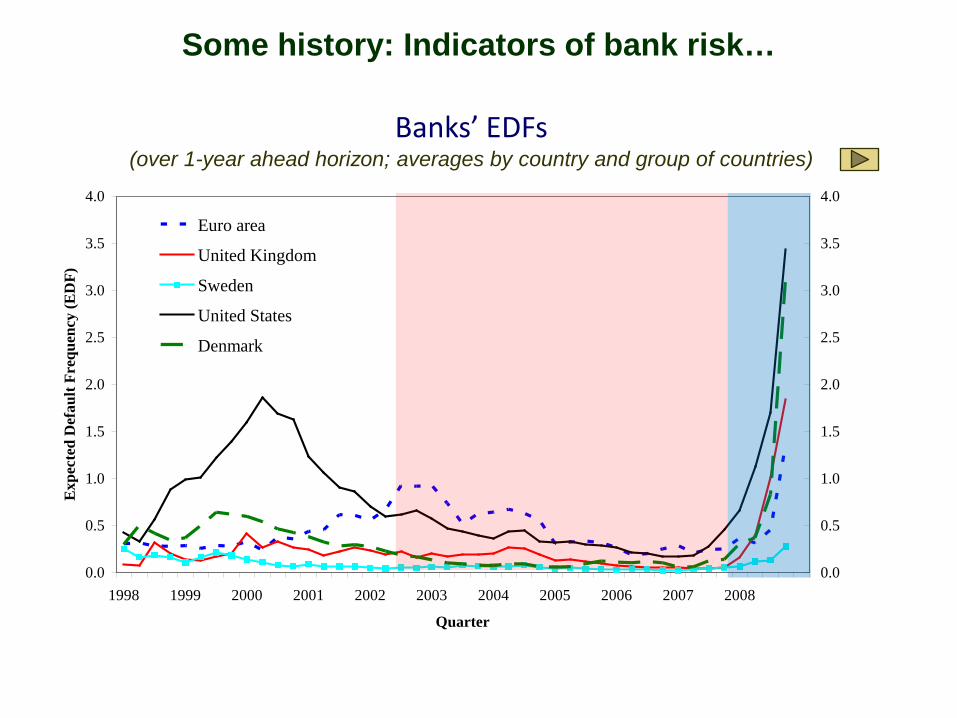
Forward-looking market-based indicators of bank risk actually…
o Concentrated prior to the crisis.
o Improved prior to the crisis.
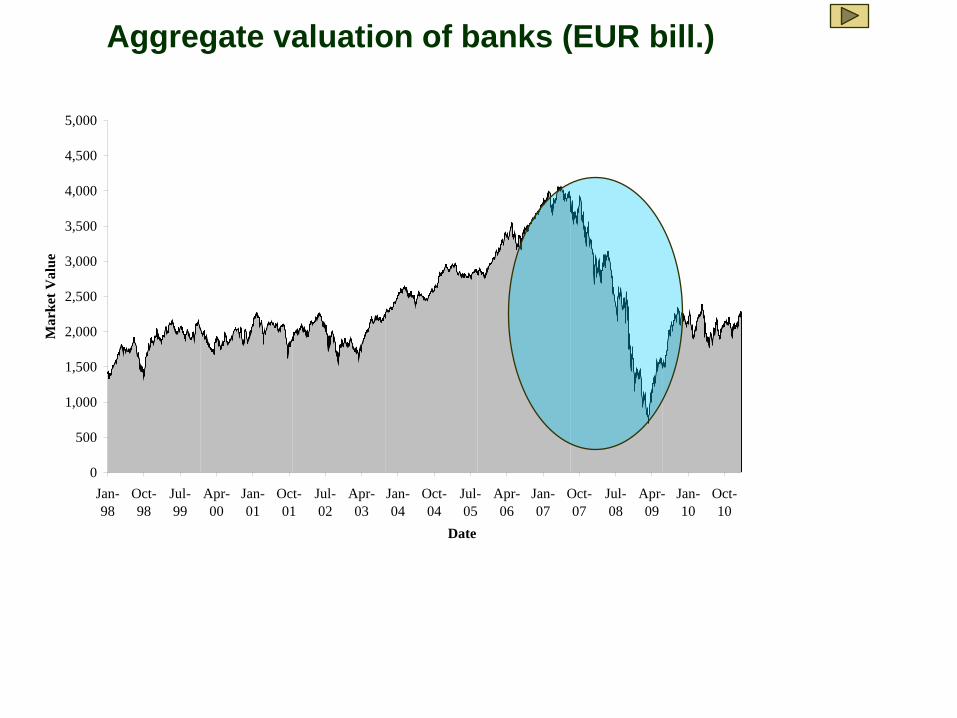
The period of the crisis revealed the largest materialization of bank risk.
While managing risks is core to banks…
There was also a huge variability in the performance of individual banks.
Basic narratives of underlying causes and dynamics offer conflicting views.
Can we use this variability to predict bank risk?
While managing risks is core to banks…
0.0
0.5
1.0
1.5
2.0
2.5
3.0
3.5
4.0
1998 1999 2000 2001 2002 2003 2004 2005 2006 2007 2008
Quarter
Exp
ecte
d D
efau
lt Fr
eque
ncy
(ED
F)
0.0
0.5
1.0
1.5
2.0
2.5
3.0
3.5
4.0
Euro area
United Kingdom
Sweden
United States
Denmark
Banks’ EDFs (over 1-year ahead horizon; averages by country and group of countries)
Some history: Indicators of bank risk…
0
500
1,000
1,500
2,000
2,500
3,000
3,500
4,000
4,500
5,000
Jan-98
Oct-98
Jul-99
Apr-00
Jan-01
Oct-01
Jul-02
Apr-03
Jan-04
Oct-04
Jul-05
Apr-06
Jan-07
Oct-07
Jul-08
Apr-09
Jan-10
Oct-10
Date
Mar
ket V
alue
Aggregate valuation of banks (EUR bill.)

Figure 1. Box-plot distribution of individual stock market returns of banks Figure 1 plots the pre and during crisis cross-sectional distribution of the stock market returns of listed banks operating in the European Union and the United States. Data consists of monthly stock market prices from 2002Q1 to 2009Q4 obtained from Datastream. The charts report the 10%, 25%, 50%, 75% and 90% quantiles before and after the crisis. The “box plot” consists of a “box” which goes from the first to the third quartile (Q1, Q3). Within the box the thick horizontal line represents the median. The bottom whisker goes from 25% to the 10% quantile, while the top goes from the 75% to 90% quantile of the distribution.
10%
10%
90%
90%
25%
25%
median: 0.30%median: -0.70%
75% 75%
-10%
-8%
-6%
-4%
-2%
0%
2%
4%
6%
8%
2002Q1-2007Q2 2007Q3-2009Q4 Source: Constructed from Datastream data.
Tightening and widening of bank risk

De-regulation
Financial innovation Banks business models
Ris
k-ta
king
ince
ntiv
es
Bank distress
Macroeconomic Environment
Pre-crisis crisis

Do variability in pre-crisis business models explain bank distress during the crisis?
Which business models explain bank distress for the different dimensions of bank distress?
Which business models explain bank distress for the tail of riskier banks?
Does stock market value creation explain bank distress on top of business models characteristics?
Accounts of crises drivers vary (Lo, 2011) ……look at cross-section and banking literature.
Crisis Pre-crisis
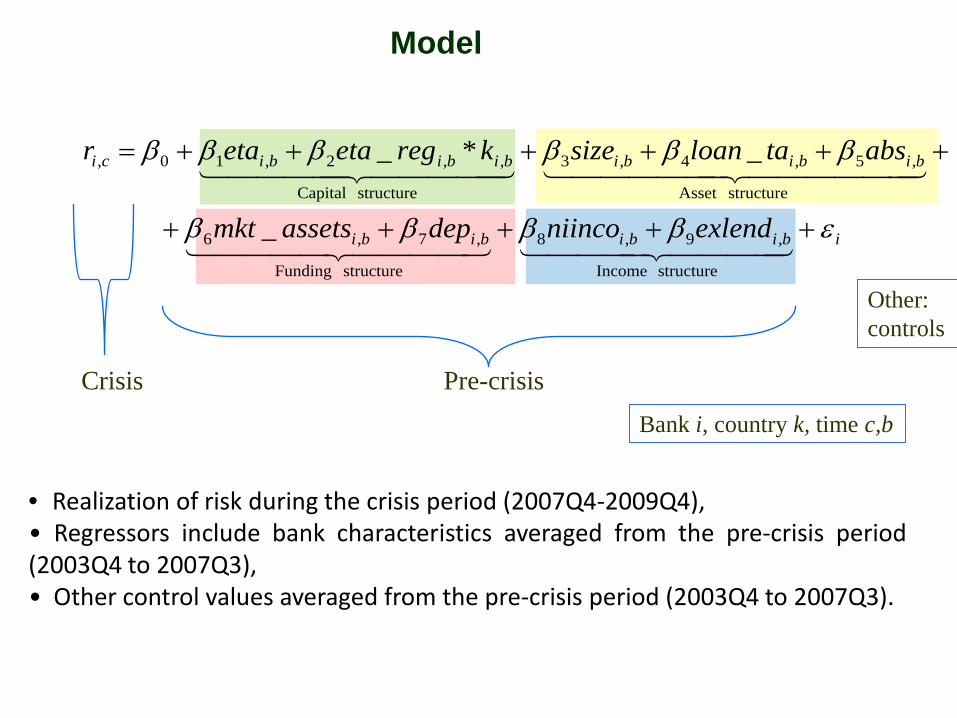
• Realization of risk during the crisis period (2007Q4-2009Q4), • Regressors include bank characteristics averaged from the pre-crisis period (2003Q4 to 2007Q3), • Other control values averaged from the pre-crisis period (2003Q4 to 2007Q3).
Bank i, country k, time c,b
Model
Other: controls
ibibibibi
bibibibibibici
exlendniincodepassetsmkt
abstaloansizekregetaetar
εββββ
ββββββ
+++++
++++++=
structure Income
,9,8
structure Funding
,7,6
structureAsset
,5,4,3
structure Capital
,,2,10,
_
_*_
Variables Symbol Source Description
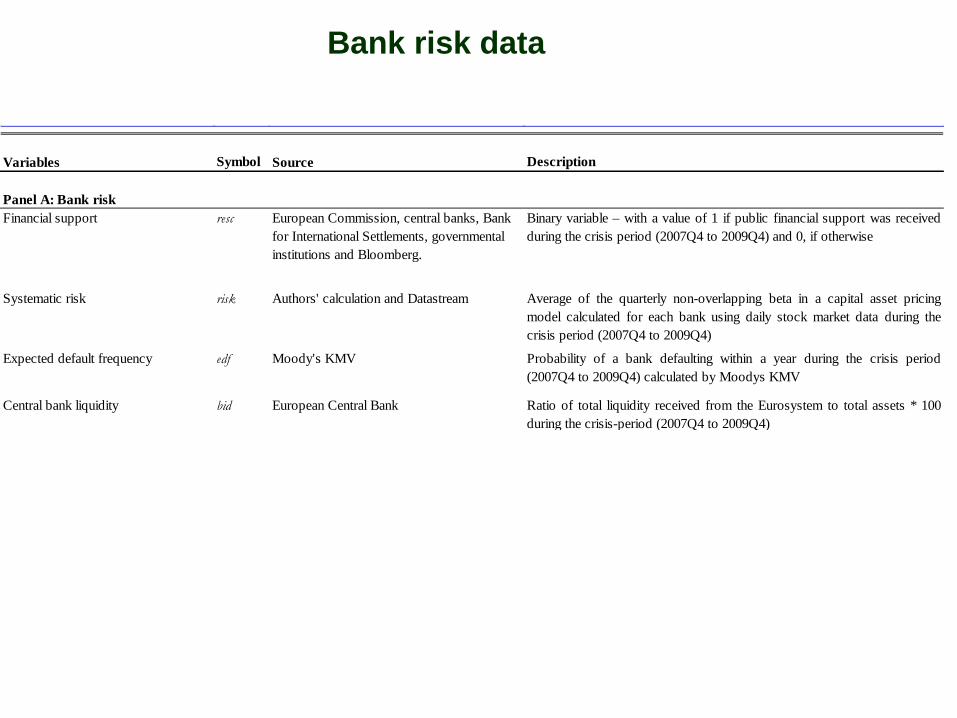
Panel A: Bank riskFinancial support resc European Commission, central banks, Bank
for International Settlements, governmental institutions and Bloomberg.
Binary variable – with a value of 1 if public financial support was receivedduring the crisis period (2007Q4 to 2009Q4) and 0, if otherwise
Systematic risk risk Authors' calculation and Datastream Average of the quarterly non-overlapping beta in a capital asset pricingmodel calculated for each bank using daily stock market data during thecrisis period (2007Q4 to 2009Q4)
Expected default frequency edf Moody's KMV Probability of a bank defaulting within a year during the crisis period(2007Q4 to 2009Q4) calculated by Moodys KMV
Central bank liquidity bid European Central Bank Ratio of total liquidity received from the Eurosystem to total assets * 100during the crisis-period (2007Q4 to 2009Q4)
Bank risk data
Global sample of 16 countries. Initial sample includes over 1,100 listed banks from: Belgium, Denmark, Germany, Greece, Finland, France, Ireland, Italy, Luxembourg, the Netherlands, Portugal, Spain, Sweden, the United Kingdom and the United State
Quarterly data: Banks’ balance sheet indicators from Bloomberg manually matched to 1) risk, 2) securitization, 3) ownership information.
Macro variables: from IMF, OECD, World bank and BIS database: competition, Regulation, asset prices.
Data
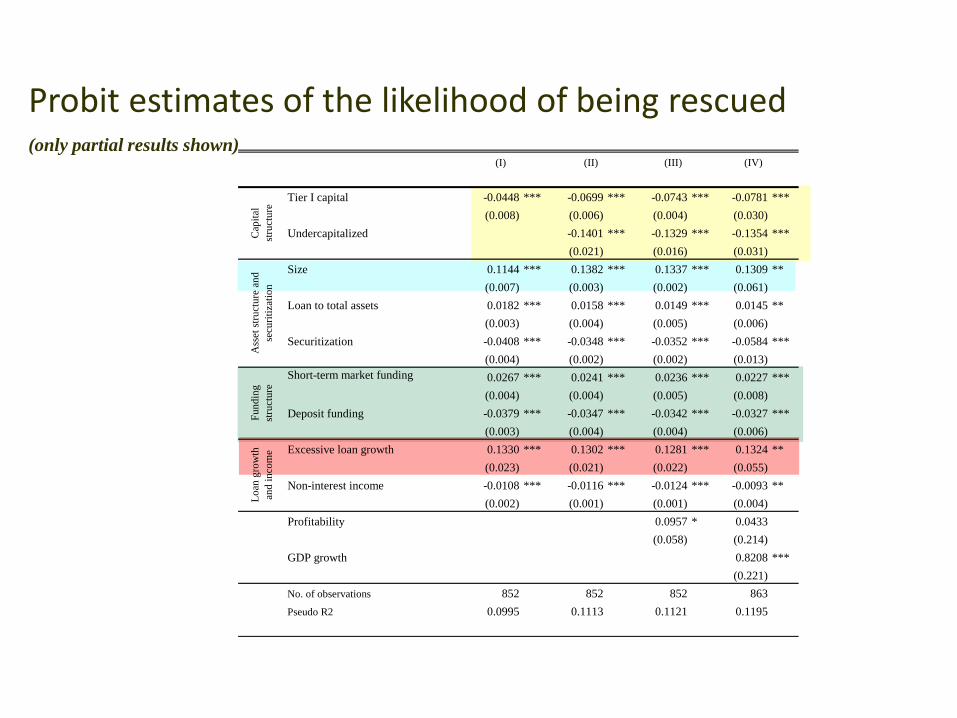
Probit estimates of the likelihood of being rescued (only partial results shown)
(I) (II) (III) (IV)
Tier I capital -0.0448 *** -0.0699 *** -0.0743 *** -0.0781 ***(0.008) (0.006) (0.004) (0.030)
Undercapitalized -0.1401 *** -0.1329 *** -0.1354 ***(0.021) (0.016) (0.031)
Size 0.1144 *** 0.1382 *** 0.1337 *** 0.1309 **(0.007) (0.003) (0.002) (0.061)
Loan to total assets 0.0182 *** 0.0158 *** 0.0149 *** 0.0145 **(0.003) (0.004) (0.005) (0.006)
Securitization -0.0408 *** -0.0348 *** -0.0352 *** -0.0584 ***(0.004) (0.002) (0.002) (0.013)
Short-term market funding 0.0267 *** 0.0241 *** 0.0236 *** 0.0227 ***(0.004) (0.004) (0.005) (0.008)
Deposit funding -0.0379 *** -0.0347 *** -0.0342 *** -0.0327 ***(0.003) (0.004) (0.004) (0.006)
Excessive loan growth 0.1330 *** 0.1302 *** 0.1281 *** 0.1324 **(0.023) (0.021) (0.022) (0.055)
Non-interest income -0.0108 *** -0.0116 *** -0.0124 *** -0.0093 **(0.002) (0.001) (0.001) (0.004)
Profitability 0.0957 * 0.0433(0.058) (0.214)
GDP growth 0.8208 ***(0.221)
No. of observations 852 852 852 863Pseudo R2 0.0995 0.1113 0.1121 0.1195
Cap
ital
stru
ctur
eA
sset
stru
ctur
e an
d se
curit
izat
ion
Fund
ing
stru
ctur
eLo
an g
row
th
an
d in
com
e
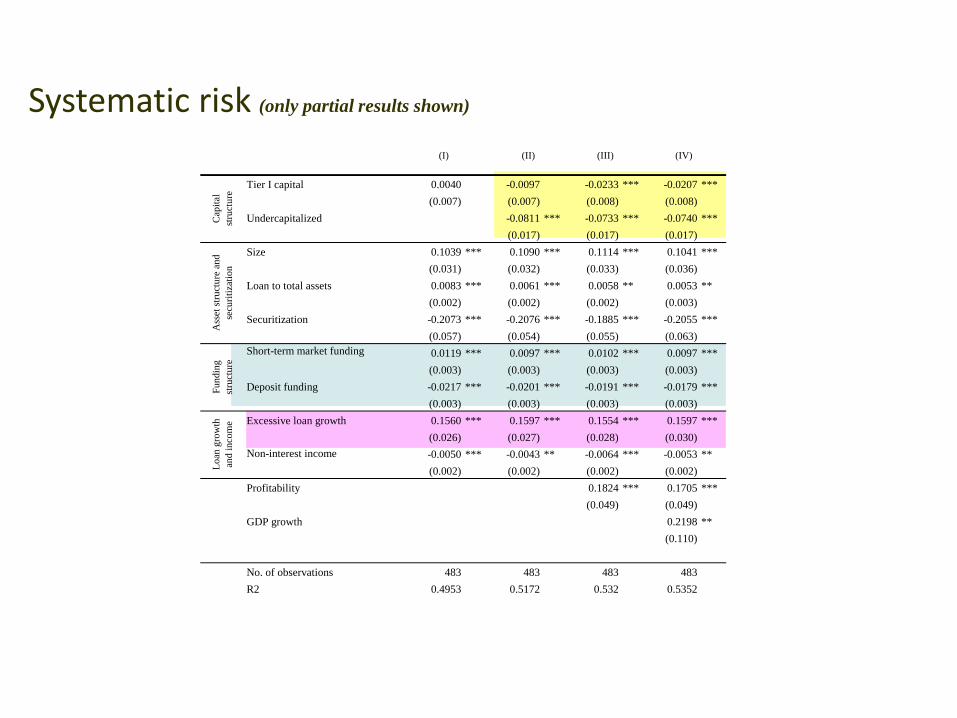
Systematic risk (only partial results shown)
(I) (II) (III) (IV)
Tier I capital 0.0040 -0.0097 -0.0233 *** -0.0207 ***(0.007) (0.007) (0.008) (0.008)
Undercapitalized -0.0811 *** -0.0733 *** -0.0740 ***(0.017) (0.017) (0.017)
Size 0.1039 *** 0.1090 *** 0.1114 *** 0.1041 ***(0.031) (0.032) (0.033) (0.036)
Loan to total assets 0.0083 *** 0.0061 *** 0.0058 ** 0.0053 **(0.002) (0.002) (0.002) (0.003)
Securitization -0.2073 *** -0.2076 *** -0.1885 *** -0.2055 ***(0.057) (0.054) (0.055) (0.063)
Short-term market funding 0.0119 *** 0.0097 *** 0.0102 *** 0.0097 ***(0.003) (0.003) (0.003) (0.003)
Deposit funding -0.0217 *** -0.0201 *** -0.0191 *** -0.0179 ***(0.003) (0.003) (0.003) (0.003)
Excessive loan growth 0.1560 *** 0.1597 *** 0.1554 *** 0.1597 ***(0.026) (0.027) (0.028) (0.030)
Non-interest income -0.0050 *** -0.0043 ** -0.0064 *** -0.0053 **(0.002) (0.002) (0.002) (0.002)
Profitability 0.1824 *** 0.1705 ***(0.049) (0.049)
GDP growth 0.2198 **(0.110)
No. of observations 483 483 483 483R2 0.4953 0.5172 0.532 0.5352
Cap
ital
stru
ctur
eA
sset
stru
ctur
e an
d se
curit
izat
ion
Fund
ing
stru
ctur
eLo
an g
row
th
an
d in
com
e
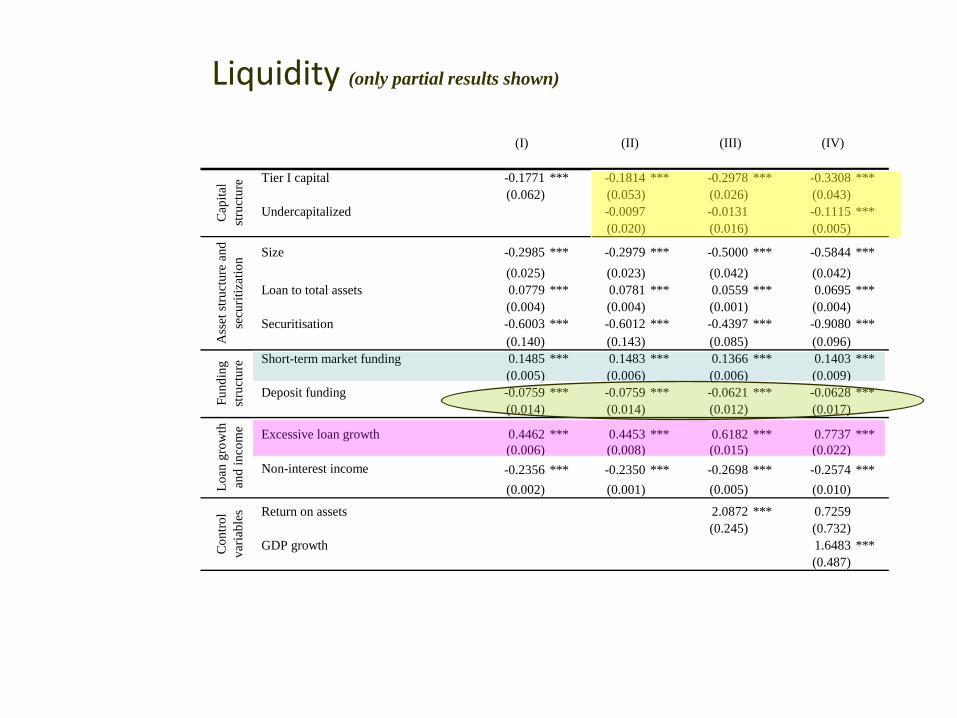
Liquidity (only partial results shown)
(I) (II) (III) (IV)
Tier I capital -0.1771 *** -0.1814 *** -0.2978 *** -0.3308 ***(0.062) (0.053) (0.026) (0.043)
Undercapitalized -0.0097 -0.0131 -0.1115 ***(0.020) (0.016) (0.005)
Size -0.2985 *** -0.2979 *** -0.5000 *** -0.5844 ***(0.025) (0.023) (0.042) (0.042)
Loan to total assets 0.0779 *** 0.0781 *** 0.0559 *** 0.0695 ***(0.004) (0.004) (0.001) (0.004)
Securitisation -0.6003 *** -0.6012 *** -0.4397 *** -0.9080 ***(0.140) (0.143) (0.085) (0.096)
Short-term market funding 0.1485 *** 0.1483 *** 0.1366 *** 0.1403 ***(0.005) (0.006) (0.006) (0.009)
Deposit funding -0.0759 *** -0.0759 *** -0.0621 *** -0.0628 ***(0.014) (0.014) (0.012) (0.017)
Excessive loan growth 0.4462 *** 0.4453 *** 0.6182 *** 0.7737 ***(0.006) (0.008) (0.015) (0.022)
Non-interest income -0.2356 *** -0.2350 *** -0.2698 *** -0.2574 ***(0.002) (0.001) (0.005) (0.010)
Return on assets 2.0872 *** 0.7259(0.245) (0.732)
GDP growth 1.6483 ***(0.487)
Con
trol
varia
bles
Cap
ital
stru
ctur
eA
sset
stru
ctur
e an
d se
curit
izat
ion
Fund
ing
stru
ctur
eLo
an g
row
th
and
inco
me

-0.05
0
0.05
0.1
0.15
0.2
0.25
0.3
0 10 20 30 40 50 60 70 80 90 100
Quantile
Coe
ffic
ient
of S
ize
size 95% CI+ 95% CI- OLS 95% CI+ 95% CI-
So business models matter, but is the impact the same for all levels of risk?
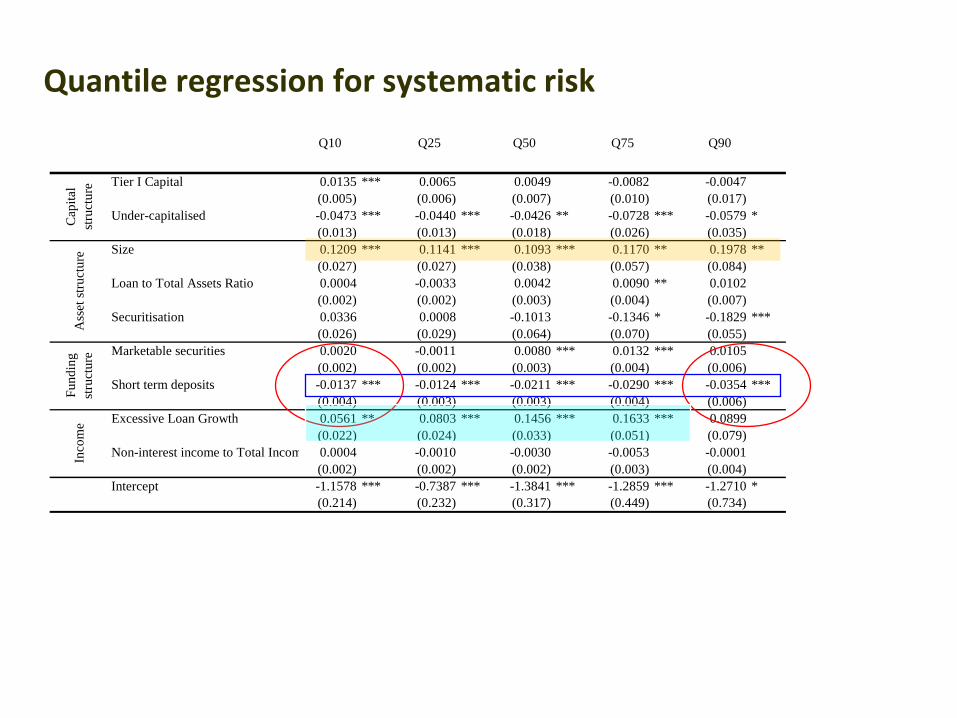
Quantile regression for systematic risk
Q10 Q25 Q50 Q75 Q90
Tier I Capital 0.0135 *** 0.0065 0.0049 -0.0082 -0.0047(0.005) (0.006) (0.007) (0.010) (0.017)
Under-capitalised -0.0473 *** -0.0440 *** -0.0426 ** -0.0728 *** -0.0579 *(0.013) (0.013) (0.018) (0.026) (0.035)
Size 0.1209 *** 0.1141 *** 0.1093 *** 0.1170 ** 0.1978 **(0.027) (0.027) (0.038) (0.057) (0.084)
Loan to Total Assets Ratio 0.0004 -0.0033 0.0042 0.0090 ** 0.0102(0.002) (0.002) (0.003) (0.004) (0.007)
Securitisation 0.0336 0.0008 -0.1013 -0.1346 * -0.1829 ***(0.026) (0.029) (0.064) (0.070) (0.055)
Marketable securities 0.0020 -0.0011 0.0080 *** 0.0132 *** 0.0105(0.002) (0.002) (0.003) (0.004) (0.006)
Short term deposits -0.0137 *** -0.0124 *** -0.0211 *** -0.0290 *** -0.0354 ***(0.004) (0.003) (0.003) (0.004) (0.006)
Excessive Loan Growth 0.0561 ** 0.0803 *** 0.1456 *** 0.1633 *** 0.0899(0.022) (0.024) (0.033) (0.051) (0.079)
Non-interest income to Total Incom 0.0004 -0.0010 -0.0030 -0.0053 -0.0001(0.002) (0.002) (0.002) (0.003) (0.004)
Intercept -1.1578 *** -0.7387 *** -1.3841 *** -1.2859 *** -1.2710 *(0.214) (0.232) (0.317) (0.449) (0.734)
Cap
ital
stru
ctur
eA
sset
stru
ctur
eFu
ndin
g st
ruct
ure
Inco
me
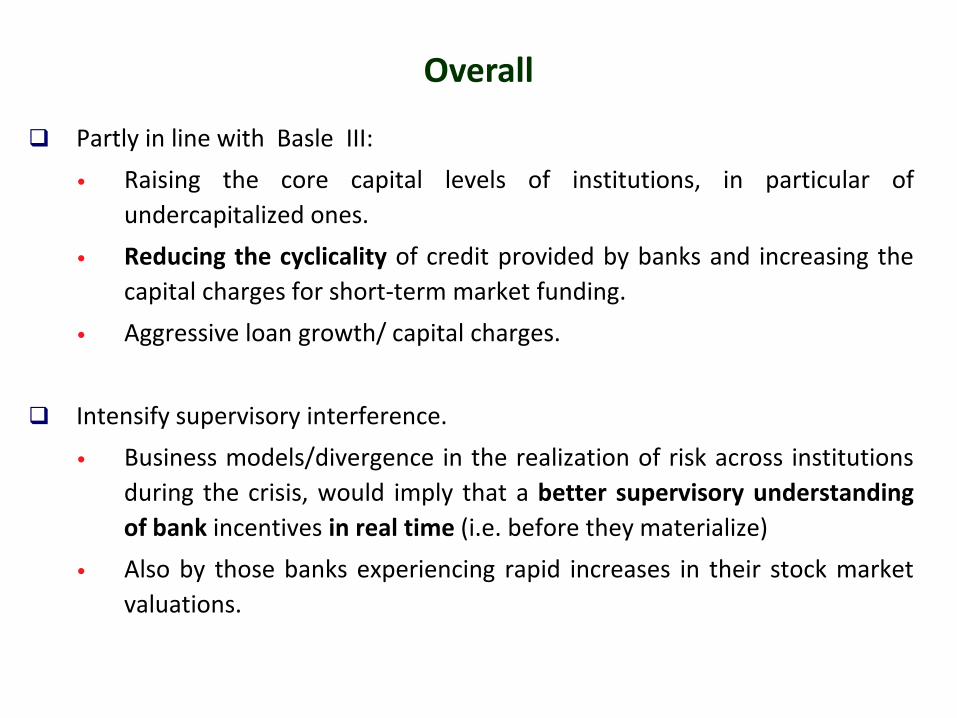
Partly in line with Basle III:
• Raising the core capital levels of institutions, in particular of undercapitalized ones.
• Reducing the cyclicality of credit provided by banks and increasing the capital charges for short-term market funding.
• Aggressive loan growth/ capital charges.
Intensify supervisory interference.
• Business models/divergence in the realization of risk across institutions during the crisis, would imply that a better supervisory understanding of bank incentives in real time (i.e. before they materialize)
• Also by those banks experiencing rapid increases in their stock market valuations.
Overall
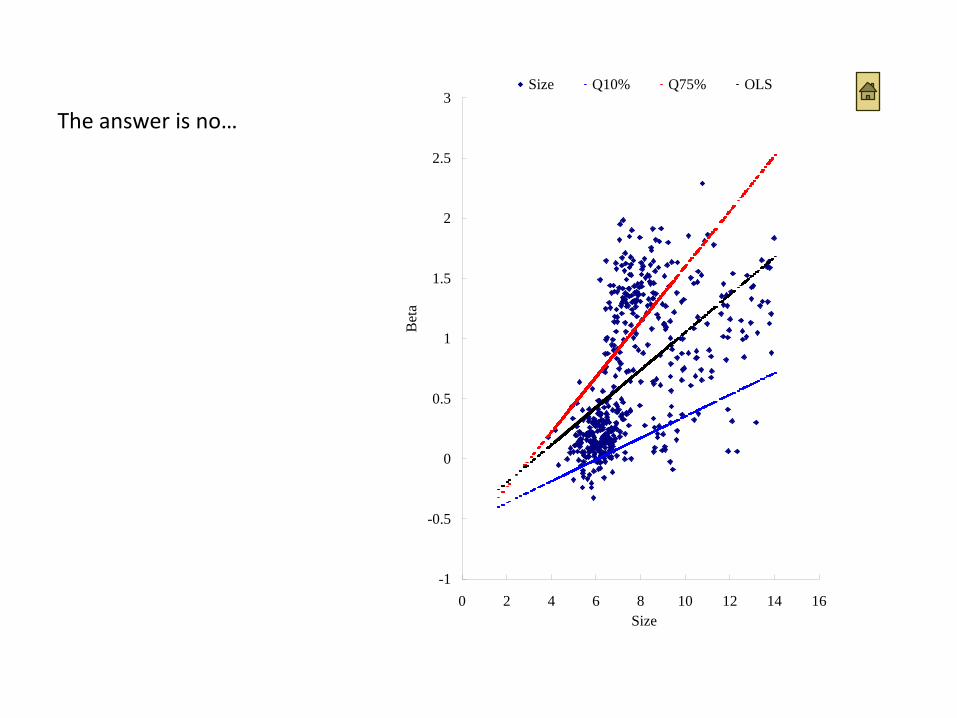
The answer is no…
-1
-0.5
0
0.5
1
1.5
2
2.5
3
0 2 4 6 8 10 12 14 16Size
Bet
a
Size Q10% Q75% OLS
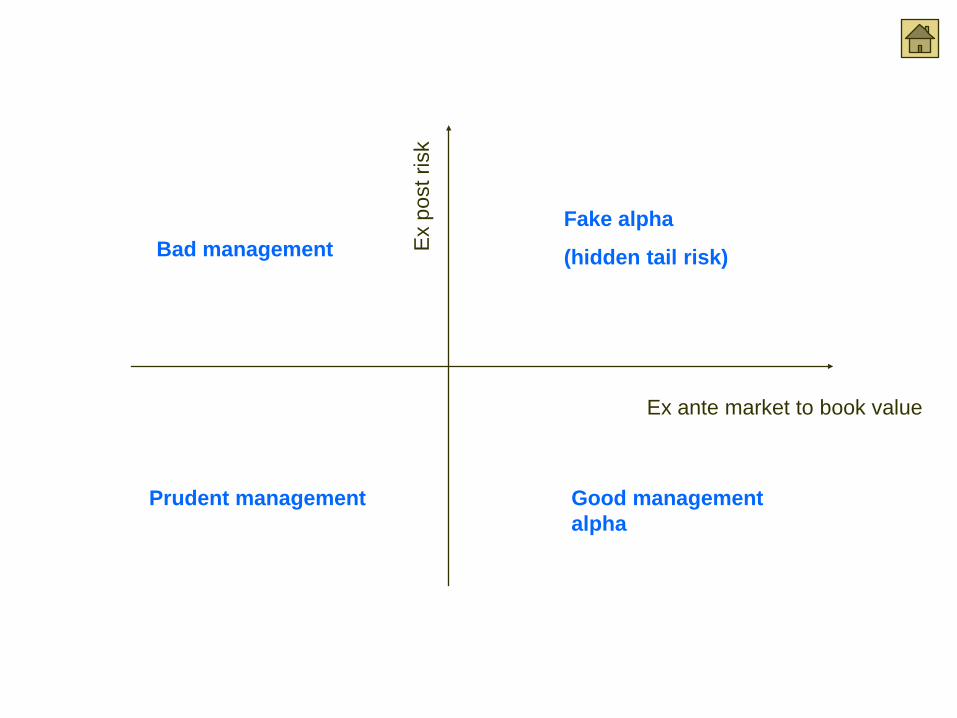
Ex ante market to book value E
x po
st ri
sk
Fake alpha
(hidden tail risk)
Good management alpha
Prudent management
Bad management
Prior to the crisis a number of studies focused on individual aspects likely to affect bank risk:
o Capital (Wheelock and Wilson 2000,
o Funding sources (Demirgüc-Kunt and Huizinga, 2010),
o Securitization and connections with financial markets (Boot and Thakor, 2009, Keys et al., 2008, Mian and Sufi, 2009),
o Corporate governance (Laeven and Levine, 2008), diversification (Stirohl, 2009).
Prev Lit: huge

Banks increased their dependence on financial markets for funding at relatively low costs:
o Financial markets investors were expected to provide more market discipline (Calomiris and Kahn, 1991). Outsource/Free riding,
o “Dark side” of wholesale funding: noisy signals could lead to liquidation of solvent institutions (Huang and Ratnovski, 2011)
Funding structure