david kerr - strategy analytics
TRANSCRIPT

Strategy Analytics
Collision Course: How will the Location
Market Evolve in the next 3-5 years?
David Kerr
Vice President, Global Wireless Practice

Agenda
Where are we today?
Major issues impacting location services market
On portal to off portal – who has the upper hand?
Monetization strategies & challenges
www.strategyanalytics.com 2
Monetization strategies & challenges
LBS users & revenue flows
Conclusions

Defence
Systems
GaAs
RF Components
Wireless Handset
Components
Connected Home
Devices
Multiplay
Networks
Digital
Media
Automotive
Custom Insights to Support Client Business Planning
Proprietary
Consulting
Advice
Work
shops Strategic
Advisory
Services
www.strategyanalytics.com 3
Wireless
Media
Wireless
Enterprise
Wireless
Devices
Emerging
Markets
Smartphones
Automotive
Multimedia
Navigation
Automotive
Electronics
Consumer
Energy
Virtual Worlds
Tariffs
Consulting
Projects
Advisory
Reports
User
Experience
Bench
marking
Best
Practice
Insights
for
Success

LBS Market: Current Status
People Tracker
6%
Map Data Overlay
1%
Mobile Maps
Search
2% Other LBS
4%
Global LBS Revenues 2009 - $1 billion
• LBS has been over–hyped in the past
• CDMA markets more advanced than GSM
• US carriers controlling LBS
www.strategyanalytics.com 4
Mobile Maps
1%
Pedestrian TBT Nav.
3%
In Car TBT Nav.
83%
• US carriers controlling LBS
• Revenues dominated by TBT Navigation:
• Navitime: +4 million subscribers (July 09)
• NIM: 3.5 million licenses end 2008
• Telmap: 400k paying customers (2Q08)
• Other LBS contribute to <20% of revenues

Opportunity for LBS is Expanding
GPS on handsets set to
expand significantly
• GSM markets
• WiFi
Cell Tower databases
• Google, Skyhook,
Spotigo, Nokia30%
40%
50%
60%
70%
80%
GP
S P
en
etr
ati
on
of
Ha
nd
sets
So
ld (
%)
www.strategyanalytics.com 5
Spotigo, Nokia
Application Stores
• Off portal
distribution0%
10%
20%
2007
2008
2009
2010
2011
2012
2013
2014GP
S P
en
etr
ati
on
of
Ha
nd
sets
So
ld (
%)
North America Western Europe Asia Pacific
Central & LatAm CE Europe Africa Middle East
Total
Source: Strategy Analytics Global Wireless Practice Jun-09

GPS Beyond the Wireless Handset
100
150
200
250
Sh
ipm
en
ts (
m)
Non Mobile Phones devices
offer GPS Opportunities too
• MIDs and Netbooks
• Cameras
Connected PNDs and Other
Devices Emerging
• WiFi and Cellular
www.strategyanalytics.com 6
0
50
100
2007
2008
2009
2010
2011
2012
2013
2014
Sh
ipm
en
ts (
m)
Digital Camera Portable iPod/MP3 Player
Portable Media Player Mobile Internet Device (MID)
Netbook Portable Nav Device (PND)
• WiFi and Cellular
• 23% of PNDs connected in
2014
• 15% of cameras WiFi in 2014
GPS offers good combination
technology
• robust technology, next
generation development
limited
• $0.50 cost point in in
mainstream handset markets
Source: Strategy Analytics Digital Consumer Practice May-09

Other Consumer Market Drivers
Consumer data package adoption
• Rising mobile data adoption
• Mobile browsing, access to social
networks e.g MySpace, Facebook,
‘All you can eat data’ plans
Monthly Data Plan Adoption as a Penetration of Total Cellular Users
15%
20%
25%
30%
35%
mo
nth
ly d
ata
pla
n p
en
etr
ati
on
of
cell
. u
sers
(%)
www.strategyanalytics.com 7
Source: Strategy Analytics
• iPhone model has been catalyst
• Japan leads, NA and Europe strong
Increasing consumer use of
application stores
• Apple, Android Market and Nokia
Ovi Store
• +60% Apple users and +50%
Blackberry users downloaded
‘majority of their apps for free’
0%
5%
10%
15%
2008 2009 2010 2011 2012 2013mo
nth
ly d
ata
pla
n p
en
etr
ati
on
of
cell
. u
sers
(%)
W.Europe N.America C.E.Europe CALA
APAC MEA Japan

Consumer Interest in LBS
US Interest in Location Enabled Services
36%
24%
24%
21%
20%
16%
Business Search
News
Friend Finder
Picture Geo-Tagging
Time Tables
Sports Tracker
So
cia
l Ap
ps
www.strategyanalytics.com 8
53%
49%
43%
41%
39%
37%
36%
0% 10% 20% 30% 40% 50% 60%
Routes
Maps
Weather
Traffic
Car Locator
City Guide
Business Search
interest (%)
Wireless Media Labs, End-User Survey, July 2009
Pra
ctic
al A
pp
s
IP Owner
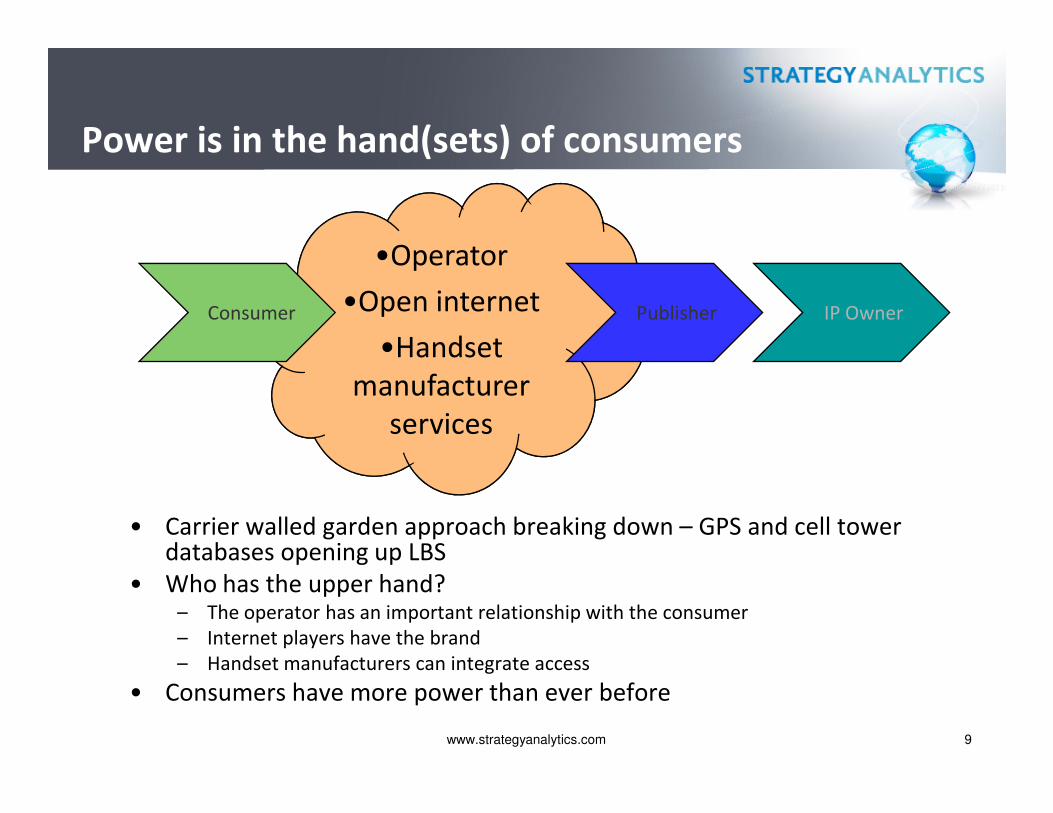
Power is in the hand(sets) of consumers
Network
Operator
•Operator
•Open internet
•Handset
manufacturer
services
PublisherConsumer
www.strategyanalytics.com 9
• Carrier walled garden approach breaking down – GPS and cell tower databases opening up LBS
• Who has the upper hand?– The operator has an important relationship with the consumer
– Internet players have the brand
– Handset manufacturers can integrate access
• Consumers have more power than ever before
services

Mobile LBS Competitor Positioning
Role Within Location Services
Location Acquisition Retailing LBS Own LBS Apps
Internet
Companies��
Google MyLocationGoogle MyLocation
������
Extend internet apps to mobileExtend internet apps to mobile
Strong competition within LBS apps retailing and own LBS applications
www.strategyanalytics.com 10
Operators ������
Network location dataNetwork location data
����
Portal, app storesPortal, app stores
����
White label premium appsWhite label premium apps
Handset
Vendors����
Enabling GPS, location APIsEnabling GPS, location APIs
������
App stores & on deviceApp stores & on device
����
NokiaNokia
PND ����
Extend navigation to handsetsExtend navigation to handsets
App
Developers����
Focus on own LBS appsFocus on own LBS apps

Operators remain a strong player in LBS as they leverage their strengths:
• Preinstall, bundle and zero-rate own applications
• Developing own app stores and take share of billing revenues
Handset vendors increasingly important for LBS distribution:
• Application stores & device integration
Who Will Win?
www.strategyanalytics.com 11
• Application stores & device integration
• Preinstall own or partner applications – e.g. Wayfinder and Sony Ericsson
Independent provider with strong brands will gain traction in mobile:
• Strong brand recognition e.g. Google, TomTom– Smaller players without brand likely to struggle
• Branded players good partner for operators and handset vendors

Smartphone App Stores A New Route To Market
Growth in LBS availability though application stores has been impressive:
• 2.8k location aware applications in Apple App Store
• 400 location enabled apps in Android Marketplace,
• 23 location enabled apps in Nokia Ovi Store.
• Operators typically offering a handful of location enabled applications.
www.strategyanalytics.com 12
Company Application Type Pricing Model
Networks in
Motion
Gokivo Navigation &
Local Search
$0.99 application download with $9.99 per month for voice
guidance through App Store.
Intermap AccuTerra Outdoor Terrain
Maps
$0.59 per application with additional map bundles purchased
in application through App Store
uLocate Where LBS Aggregation Free application available through App Store, App World and
for Palm Pre.
TomTom TomTom Navigation £60-£80 for a lifetime user license.
Yelp Yelp Local Search Free. Internet model based on advertising.

Off Portal Application Stores Gaining Upper Hand
App Stores: Volume Market Share 2008 - Global
Get Jar, 10%
Nokia Stores,
9%
Handango,
2%
App Stores: Volume Market Share 1H09 - Global
Nokia Stores,
Handango,
3%
Android, 3%RIM, 1%
Palm, 1%
www.strategyanalytics.com 13
Source: Strategy Analytics
Apple App
Store, 12%
Get Jar, 10%
Operators,
67%
Get Jar, 12%
Apple App
Store, 29%
Nokia Stores,
11%
Operators,
40%

Clear LBS Applications Opportunities Emerging
300
350
400
450
500
LBS U
sers
(m
)
www.strategyanalytics.com 14
0
50
100
150
200
250
2007
2008
2009
2010
2011
2012
2013
LBS U
sers
(m
)
In Car Navigation Pedestrian Navigation Maps
Map Data Overlay People Tracker Other LBS

Show me the money –
Pricing varies by application
Subs A la Carte Rental Ads Free
Maps/
RoutingIntermapIntermap
Nokia, Google Nokia, Google
Vodafone, OrangeVodafone, Orange
Navigation
(TBT)Nokia Nokia TomTom, TomTom,
GarminGarmin
Verizon Verizon
WirelessWireless
locationet,locationet,
SkrobblerSkrobbler
�� �� �� ��
����
www.strategyanalytics.com 15
Social
LocationLoopt, Where, Loopt, Where,
GyPSiiGyPSii
GyPSiiGyPSii Loopt, Where, Loopt, Where,
GyPSiiGyPSii
Safety
LocationVZW, AT&T, Sprint VZW, AT&T, Sprint
Search
Yelp, GoogleYelp, Google Yelp, GoogleYelp, Google
Utility LBS
Verizon WirelessVerizon Wireless GG--ParkPark
����
��
����
��
�� ��

Pricing options include free, freemium, a la carte, subscription and advertising:
– Subscription: Preferred model for carriers. However, adoption has been low and willingness to pay is segmented.
– Free & Freemium: Ideal for driving downloads, promoting other channels and awareness building. Nokia Maps a major example of this. Challenge to up sell and provide value-add.
Monetization Challenges
www.strategyanalytics.com 16
provide value-add.
– A la carte: Low ($0.5-3.0) price points proving ideal for impulse purchase within application stores. Not ideal for applications generating ongoing costs, e.g. TBT navigation.
– Advertising: Currently nascent and experimental. Unproven on mobile.

Other Pricing Strategy Considerations
Other factors to consider:
• Costs?
• User segment?
• Competition/ substitutes?
• Willingness to pay?
• Frequency of use?
• Ease of use?
Va
lue
to u
ser
High
People
Tracking
(Safety)
TBT
Vehicle
Nav.
www.strategyanalytics.com 17
Location Accuracy
City Local 5-20 meters
Va
lue
to u
ser
Med
Low Buddy Finder
(Social)
Car LocatorCity Guide
Sports
Tracker
Local
Map
Routing
Local
Search & AdvertisingNews &
Weather

Different monetization models will co-exist, but SA predicts:
• Increased bundling together of distinct location applications
improves value-add.– uLocate’s WHERE application
– Google Maps Layers
• Use of freemium type models will gain traction. Hybrid examples:
Monetization Conclusions
www.strategyanalytics.com 18
• Use of freemium type models will gain traction. Hybrid examples:
– Gokivo - $0.99 for basic application with $9.99 per month for navigation
– Intermap - $0.59 application with additional charge for additional map
bundles
• Revenues from advertising will generate over $3.5 billion for LBS,
the vast majority through location enabled search. – Advertising linked to location enabled search represents a strong proposition for
local advertisers.

LBS Search and Advertising – the Hot Topic
• Location enabled search will drive LBS advertising
• But still need to prove effectiveness to advertisers
• Opportunities for local advertising– Customised solutions emerging – Yelp, Sherpa, Cha Cha
• Growing momentum behind connecting mobile advertising with
www.strategyanalytics.com 19
• Growing momentum behind connecting mobile advertising with
location enabled services– Navteq acquires location based advertising network Acuity (Sept 09)
– Alcatel Lucent (location and messaging platform) and 1020 Placecast (advertising
engine) launch a hosted service to wireless operators (May-09)
– Advertising network Quattro Wireless teams up with uLocate to deliver ad targeted
units into uLocate’s WHERE iPhone application

$7.5B Global LBS Revenue Opportunity in 2013
4,000
5,000
6,000
7,000
8,000
LBS R
evenues
($m
)
Other LBS
Location Enabled Search
People Tracker/ Locator
Spending
Map Data Overlay
Mobile Maps
www.strategyanalytics.com 20
0
1,000
2,000
3,000
2007
2008
2009
2010
2011
2012
2013
LBS R
evenues
($m
)
Mobile Maps
Pedestrian Navigation
In Car Navigation
• Location enabled search including advertising will emerge quickly: approach $3.6B in 2013
• Navigation and map applications will remain strong: $2.9B in 2013
• Monetization key challenge impacting rate of market development

Revenue Flows in the Value-Chain
• Subscription
• A la Carte
• Freemium• Google
• Nokia (Ovi Maps)
• TCS
• DeCarta
Content
Providers
LBS APP
Developer/
Publisher
LBS RetailDigital
Maps
LBS
Platform
• Advertising
• TeleAtlas
• NavTeq
• Intermap
• InfoUSA
• ViaMIchellin
• Inrix
• uLocate
• Wavemarket
• Nokia
• Operator
• Device Vendor
• D2C
Location
Acquisition
• Operator
• Skyhook
37%63%
www.strategyanalytics.com 21
• Retailing LBS will generate almost $1.3B (37%) by 2013: Operators and device vendors in strong position to capture this opportunity.
• LBS publishers will generate just over $2B (63%) by 2013: Navigation the primary opportunity. Revenue distributed across other value-chain partners.
• Search will drive location advertising revenues to reach $3.6B: Search giants Google, Yahoo and MSFT well positioned.
• DeCarta • Google

Conclusions
• Opportunity is large– Navigation and search will drive total LBS revenue to $7.5B by 2013.
• Routes to market are changing – Carrier wall garden around LBS has broken down
• Application stores are becoming a significant route to market
• Operators remain strong retail partner
www.strategyanalytics.com 22
• Monetizing LBS remains complex outside navigation and search– Maps, Navigation & Routing will generate $2.9B
– Search will generate $3.6B by 2013, dominated by giants Google, Yahoo/MSFT
– Other categories hindered by lack of established business models
• Companies have to be responsive and nimble over the next
couple of years as the market matures to make the most of the
opportunity.