david & goliath - credit suisse
TRANSCRIPT

DISCLOSURE APPENDIX CONTAINS ANALYST CERTIFICATIONS AND THE STATUS OF NON-US ANALYSTS. FOR OTHER IMPORTANT DISCLOSURES, visit www.credit-suisse.com/ researchdisclosures or call +1 (877) 291-2683. U.S. Disclosure: Credit Suisse does and seeks to do business with companies covered in its research reports. As a result, investors should be aware that the Firm may have a conflict of interest that could affect the objectivity of this report. Investors should consider this report as only a single factor in making their investment decision.
14 September 2012
Asia Pacific
Equity Research
Small Cap Companies
David & Goliath WEEKLY ANALYSIS
Raising hope on low expectations
Share price performance of China small caps, which run their businesses in one
of the world’s fastest growing economies, has been heartrending in the past
three years – they have underperformed in the region for three consecutive
years with a negative return of 31% since 2010. The 2012 consensus earnings
growth has been revised from a growth of 22% to a decline of 13% so far.
Although the lagging sell-side analysts should not have done their earnings
downgrades for 2012, D&G believes the forward-looking market has. In view of
a few more metrics that D&G keeps score of, D&G has turned bullish on China
small caps, as explained in his new report “Hope and Recovery” (link to report).
On the back of fuelling expectations of a Fed easing environment, some laggard
markets, like Korea and HK are catching up, while the outperformance of
ASEAN markets peaked in late July. In view of the high proportion of 66% of
small caps trading below book and easier earnings comparison in 4Q12 and
1H13 with lower bases, D&G expects China small caps to catch up next.
Amid an uncertain economic outlook, fundamental analysis continues to lag the
stock price movement in the current market scenario, making D&G’s buy lists in the
report look feebly convincing to some investors, and thus subject to scepticism.
D&G understands that favourable risk-reward attributes after a significant stock
price decline usually work exceptionally well during a market rebound. D&G also
understands that when the fundamentals of small caps are confirmed to improve,
their share prices may have already been moving for two months.
As a small-cap analyst, D&G is lonely, as always. D&G also fears of being
popular as it usually denotes a market peaking.
Charts of the week
Returns of MSCI large and small-caps (%) China small caps look attractive 2012 YTD -2M
Market Small MSCI Small MSCI
Thailand 31.8 19.2 11.1 2.8 Sing 28.7 22.0 8.3 4.4 Taiwan 17.3 8.1 6.3 8.6 India 14.6 11.9 -2.6 3.9 AxJ 9.8 9.0 3.9 5.7 Malaysia 8.4 6.5 0.1 2.4 HK 7.7 14.1 5.5 7.1 Korea 2.1 10.6 9.7 9.6 China -1.8 1.7 -1.7 2.6 Indonesia -4.2 -0.6 -7.1 3.9
S'pore
HK
IndoAxJ
Korea
M'siaChina
Taiwan
Thailand
India
-40
-20
0
20
40
60
-2.0 0.0 2.0 4.0 6.0
P/E
dis
coun
t (%
)
PEG (x)
Source: Datastream, Credit Suisse estimates
Davids of the week:
Hong Kong: Chow Sang Sang – we initiate coverage of the jeweler with margin
improvement from the rising gold prices; 8.5x 13E P/E, 17% potential upside (p. 10)
Taiwan: Spreadtrum – we raise our forecasts and target price on smartphones and modest GM recovery; 10.1x 13E P/E, 28% potential upside (p. 81)
Research Analysts
Kenny Lau, CFA
852 2101 7914
Eva Wang
852 2101 7365
Anantha Narayan
91 22 67773730
Teddy Oetomo
6221 2553 7911
Minseok Sinn
822 3707 8898
Loke Foong Wai
603 2723 2082
Su Tye Chua
65 6212 3014
Chai Techakumpuch
662 614 6211

14 September 2012
David & Goliath 2
The tales of Davids
Hong Kong
Luk Fook – Major beneficiary of QE3 10
Chow Sang Sang – Most stable earnings growth, but cheapest valuation 10
Pacific Textiles – 1HFY3/13 Preview: Cash cow 11
Texwinca – 1H FY3/13E preview: Waiting for the worst to be over 11
Pacific Basin Shipping – New report: RoRo exit a step in the right direction 12
China
Green Dragon Gas – New report: Darkest before dawn 20
Lonking – Comment on August sales 20
India
Multi Commodity Exchange of India – MCX-SX's equity product kicks off 30
Emami – Key concerns to abate 30
Hexaware Technologies – Management discussions indicate that the company remains well placed 31
Gujarat State Petronet – The new tariff order limits downside. Volume growth key to upside 31
Indonesia
ACE Hardware – ACES expects no impact from the recent regulation changes 45
Mitra Adiperkasa – MAPI’s F&B business may have limited impact from recent regulation 45
Lippo Cikarang – Mixing industrial with residential 46
Surya Semesta Internusa – Additional land bank is the key 46
Bekasi Fajar Industrial Estate – BEST is getting even better 47
Kawasan Industri Jababeka – Offering additional facilities 47
Korea
Shinsegae – Weak trends so far due to time difference in Choosuk holiday 53
Malaysia
SP Setia – Lower earnings forecasts from dilution of proposed placement 65
Singapore
CDL Hospitality Trusts – Industry 7M12 REVPAR up strongly, by 9.4% YoY 72
Taiwan
E Ink – ePaper shipment recovery to drive the year-end rally 79
Hiwin – Inventory remains an issue 79
Novatek – New report: Resolution migration, mid-sized devices, and share gains driving future growth 80
Lextar – Uncertain synergy from the Wellypower acquisition 80
Spreadtrum Communication – New report: Smartphone ramp gains momentum 81

14 September 2012
David & Goliath 3
Taiwan Surface Mounting Tech – Softer outlook ahead with slower-than-expected margin expansion 81
Thailand
Major Cineplex – Ticket sales likely to fall YoY again in 3Q 95

14 September 2012
David & Goliath 4
Small-cap index performance Figure 1: Non-Japan Asia Figure 2: China
80
90
100
110
09/11 12/11 03/12 06/12 09/12
MSCI AxJ Small Caps MSCI Asia Ex-Japan
70
80
90
100
110
09/11 12/11 03/12 06/12 09/12
MSCI China Small Caps MSCI AxJ Small Caps MSCI China
Figure 3: Hong Kong Figure 4: India
65
75
85
95
105
09/11 12/11 03/12 06/12 09/12
MSCI HK Small Caps MSCI AxJ Small Caps MSCI HK
75
85
95
105
115
09/11 12/11 03/12 06/12 09/12
MSCI India Small Caps MSCI AxJ Small Caps MSCI India
Figure 5: Indonesia Figure 6: South Korea
70
80
90
100
110
120
09/11 12/11 03/12 06/12 09/12
MSCI Indonesia Small Caps MSCI AxJ Small Caps MSCI Indonesia
80
90
100
110
120
09/11 12/11 03/12 06/12 09/12
MSCI Korea Small Caps MSCI AxJ Small Caps MSCI Korea
Figure 7: Malaysia Figure 8: Singapore
80
90
100
110
120
09/11 12/11 03/12 06/12 09/12
MSCI Malaysia Small Caps MSCI AxJ Small Caps MSCI Malaysia
80
90
100
110
09/11 12/11 03/12 06/12 09/12
MSCI Singapore Small Caps MSCI AxJ Small Caps MSCI Singapore
Figure 9: Taiwan Figure 10: Thailand
75
85
95
105
115
09/11 12/11 03/12 06/12 09/12
MSCI Taiwan Small Caps MSCI AxJ Small Caps MSCI Taiwan
75
85
95
105
115
125
09/11 12/11 03/12 06/12 09/12
MSCI Thailand Small Caps MSCI AxJ Small Caps MSCI Thailand
Source: MSCI, Credit Suisse estimates Source: MSCI, Credit Suisse estimates

14 September 2012
David & Goliath 5
Small-cap index valuation and sector performance Figure 11: Valuation
Index Net profit Book value Trailing Index performance Country/ weighting (US$ mn) (US$ mn) P/E (x) P/B (x) Yield (local currency term)
region (%) 2011 2012 2011 2012 2011 2012 2011 2012 (%) 1W 1M 3M 6M 1Y 2Y
China 13.7 20,867 18,035 180,798 203,076 7.5 8.7 0.9 0.8 2.9 4.5 1.2 (2.9) (17.0) (8.1) (34.7) Hong Kong 7.8 8,686 8,811 103,921 111,590 10.3 10.1 0.9 0.8 3.4 2.8 2.6 3.3 (11.3) (5.9) (20.1) India 16.9 12,585 15,135 127,921 146,011 15.3 12.7 1.5 1.3 1.6 2.4 1.1 3.8 (4.9) (0.2) (27.3) Indonesia 7.4 5,315 6,223 42,322 47,493 16.0 13.7 2.0 1.8 1.8 1.5 0.2 2.1 (1.5) 8.9 37.1 Korea 15.3 8,554 13,736 157,276 168,445 20.4 12.7 1.1 1.0 1.3 2.2 5.1 10.0 (4.7) 0.9 (5.2) Malaysia 7.9 6,182 6,429 57,834 61,662 14.6 14.0 1.6 1.5 3.2 (0.3) (3.2) 2.6 1.2 14.0 16.8 Singapore 8.2 7,830 7,243 81,117 88,611 12.0 13.0 1.2 1.1 3.2 2.8 4.1 10.7 2.3 9.9 (8.6) Taiwan 15.8 7,528 8,422 136,793 143,247 24.0 21.5 1.3 1.3 3.8 2.7 2.1 4.5 (8.4) 1.6 (17.3) Thailand 7.0 3,310 4,314 40,684 43,568 24.1 18.5 2.0 1.8 2.7 1.7 6.5 13.5 14.5 27.8 28.7 NJA 100.0 80,857 88,347 928,666 1,013,702 14.1 12.9 1.2 1.1 2.6 2.9 2.6 6.0 (7.7) (1.6) (16.2)
Source: DataStream, Credit Suisse estimates
Index Net profit Book value Index performance Non-Japan Asia weighting (US$ mn) (US$ mn) P/E (x) P/B (x) (US$ term)
Sector (%) 2011 2012 2011 2012 2011 2012 2011 2012 1W 1M 3M 6M 1Y 2Y
Consumer Discretionary 19.4 15,224 16,847 136,775 150,811 14.6 13.2 1.6 1.5 2.9 3.4 6.5 (6.6) (0.9) (2.7) Consumer Staples 10.4 7,732 8,358 66,771 72,383 15.4 14.3 1.8 1.6 1.6 2.2 10.0 3.0 9.9 4.4 Energy 3.2 1,907 3,100 29,981 35,694 19.4 11.9 1.2 1.0 3.0 (0.4) (0.7) (21.4) (16.6) (28.8) Financials 18.8 25,556 24,592 247,110 272,557 8.4 8.7 0.9 0.8 3.4 2.3 5.7 (4.5) 2.6 (16.2) Health Care 5.0 2,653 3,001 25,739 28,457 21.5 19.0 2.2 2.0 2.2 3.8 17.4 11.5 13.9 (7.6) Industrials 15.5 8,123 11,437 155,086 167,769 21.8 15.5 1.1 1.1 3.0 1.5 3.2 (13.2) (6.8) (27.0) Information Technology 12.0 5,152 6,517 104,504 111,757 26.6 21.1 1.3 1.2 4.0 4.7 4.5 (11.1) 0.2 (23.9) Materials 11.2 12,507 11,533 125,237 133,753 10.2 11.1 1.0 1.0 2.9 1.7 3.9 (15.1) (13.3) (19.7) Telecommunication Services 1.7 (261) 83 8,998 9,460 (72.2) 226.1 2.1 2.0 2.3 7.4 14.8 3.4 2.5 (9.8) Utilities 2.8 2,264 2,879 28,463 31,061 14.2 11.2 1.1 1.0 2.4 1.8 4.7 (10.5) (6.9) (32.4)
Source: DataStream, Credit Suisse estimates
Index Net profit Book value Index performance China weighting (US$ mn) (US$ mn) P/E (x) P/B (x) (US$ term)
Sector (%) 2011 2012 2011 2012 2011 2012 2011 2012 1W 1M 3M 6M 1Y 2Y
Consumer Discretionary 21.8 3,708 3,883 26,498 29,990 9.2 8.8 1.3 1.1 4.0 1.9 (5.2) (25.6) (17.9) (41.0) Consumer Staples 8.8 1,340 1,360 12,221 13,785 10.3 10.2 1.1 1.0 2.5 (1.4) (6.6) (18.0) (15.3) (42.2) Energy 4.4 605 618 5,262 6,026 11.3 11.1 1.3 1.1 4.8 3.1 (1.5) (29.8) (7.0) (48.0) Financials 18.8 6,717 5,039 55,041 62,348 4.4 5.8 0.5 0.5 6.2 1.9 1.4 6.8 15.7 (14.4) Health Care 6.3 545 674 4,889 5,473 18.0 14.6 2.0 1.8 1.7 1.3 11.2 4.7 17.2 (35.8) Industrials 14.6 3,146 2,533 29,467 33,917 7.2 9.0 0.8 0.7 6.1 0.6 (7.7) (20.6) (9.0) (33.3) Information Technology 5.7 536 563 10,188 10,872 16.6 15.8 0.9 0.8 4.7 2.5 (2.8) (25.8) (22.9) (47.2) Materials 14.0 3,704 2,465 28,834 31,505 5.9 8.8 0.8 0.7 4.2 (0.0) (8.3) (29.8) (21.3) (37.2) Telecommunication Services 0.3 59 62 410 436 7.8 7.5 1.1 1.1 2.1 (2.6) 7.1 (15.2) (14.8) (46.0) Utilities 5.3 506 838 7,988 8,725 16.4 9.9 1.0 1.0 4.7 3.5 8.4 (5.1) 14.8 (21.4)
Source: DataStream, Credit Suisse estimates

14 September 2012
David & Goliath 6
Index Net profit Book value Index performance Hong Kong weighting (US$ mn) (US$ mn) P/E (x) P/B (x) (US$ term)
Sector (%) 2011 2012 2011 2012 2011 2012 2011 2012 1W 1M 3M 6M 1Y 2Y
Consumer Discretionary 40.4 3,428 3,315 27,690 30,970 10.5 10.9 1.3 1.2 2.7 3.7 5.1 (9.9) (3.4) 7.9 Consumer Staples 4.4 274 315 2,272 2,508 14.5 12.6 1.7 1.6 0.9 (1.7) 1.0 (0.0) 8.4 (10.3) Energy 2.9 (353) (73) 3,198 3,329 (7.3) (34.9) 0.8 0.8 1.7 (13.1) (20.6) (43.2) (49.1) (63.9) Financials 18.8 2,381 2,353 34,473 36,830 7.1 7.1 0.5 0.5 3.6 4.9 6.1 (7.7) 1.8 (26.5) Health Care 2.1 39 72 1,503 1,626 48.7 26.7 1.3 1.2 1.5 10.6 34.7 1.7 7.4 (51.2) Industrials 12.0 1,172 915 15,250 15,407 9.1 11.7 0.7 0.7 4.6 4.7 2.5 (10.8) (11.9) (25.2) Information Technology 6.6 941 924 10,737 11,462 6.3 6.4 0.5 0.5 6.7 3.7 3.1 (22.4) (22.7) (51.6) Materials 6.7 437 577 5,084 5,554 13.7 10.4 1.2 1.1 0.7 (4.7) (4.7) (23.8) (14.6) (48.0) Telecommunication Services 4.0 275 311 2,474 2,632 13.0 11.5 1.4 1.4 (2.1) (0.9) (2.2) (1.3) 13.5 33.6 Utilities 2.1 91 103 1,240 1,273 20.8 18.5 1.5 1.5 (0.5) 4.9 8.7 20.5 42.8 69.9
Source: DataStream, Credit Suisse estimates
Index Net profit Book value Index performance
India weighting (US$ mn) (US$ mn) P/E (x) P/B (x) (US$ term)
Sector (%) 2011 2012 2011 2012 2011 2012 2011 2012 1W 1M 3M 6M 1Y 2Y
Consumer Discretionary 12.7 1,099 1,339 12,054 13,984 22.3 18.3 2.0 1.8 2.1 1.0 5.8 (0.5) (2.2) (16.9) Consumer Staples 9.6 519 577 4,797 4,649 35.7 32.1 3.9 4.0 (0.0) 5.7 15.1 19.1 16.4 5.2 Energy 4.1 41 471 6,663 7,223 192.3 16.9 1.2 1.1 1.9 (1.9) (0.9) (11.5) (6.0) (49.5) Financials 18.9 4,980 5,502 43,092 50,383 7.3 6.6 0.8 0.7 2.9 (1.9) (5.4) (18.8) (9.1) (41.5) Health Care 9.5 753 902 7,183 7,866 24.2 20.2 2.5 2.3 3.1 5.0 18.8 24.9 28.2 20.2 Industrials 17.8 1,869 2,372 21,897 25,091 18.4 14.5 1.6 1.4 2.6 (2.1) (3.3) (16.9) (14.9) (47.1) Information Technology 6.6 1,070 1,264 5,197 6,320 11.9 10.1 2.4 2.0 7.0 9.0 14.4 15.0 31.4 (0.6) Materials 13.2 2,053 2,385 14,910 17,051 12.4 10.7 1.7 1.5 2.3 4.2 8.8 0.2 8.9 (8.3) Telecommunication Services 1.2 (691) (582) 1,859 1,882 (3.2) (3.8) 1.2 1.2 (0.3) (3.5) 3.1 (10.3) (12.1) (48.3) Utilities 6.3 891 904 10,269 11,564 13.5 13.3 1.2 1.0 0.3 (3.5) (7.2) (25.6) (26.0) (51.8)
Source: DataStream, Credit Suisse estimates
Index Net profit Book value Index performance Indonesia weighting (US$ mn) (US$ mn) P/E (x) P/B (x) (US$ term)
Sector (%) 2011 2012 2011 2012 2011 2012 2011 2012 1W 1M 3M 6M 1Y 2Y
Consumer Discretionary 21.9 740 982 5,641 6,168 25.1 19.0 3.3 3.0 2.1 1.2 6.8 18.9 52.9 162.8 Consumer Staples 15.7 754 838 3,976 4,532 17.7 15.9 3.4 2.9 2.3 0.7 8.3 5.3 10.7 36.8 Energy 9.5 666 851 5,742 6,675 12.1 9.5 1.4 1.2 3.6 (6.5) (6.1) (39.9) (43.0) (34.1) Financials 25.0 1,686 2,035 12,914 14,746 12.6 10.4 1.6 1.4 1.0 (0.4) (2.8) (5.0) (0.3) 20.3 Health Care 3.0 139 155 751 791 18.1 16.4 3.4 3.2 5.7 7.8 12.2 32.0 21.4 96.2 Industrials 9.0 473 558 3,908 4,378 16.3 13.8 2.0 1.8 (2.2) 4.6 7.0 9.0 37.7 92.6 Information Technology 1.0 41 59 281 323 19.7 13.7 2.9 2.5 0.9 (3.5) 16.9 29.6 27.3 209.3 Materials 9.6 823 682 8,164 8,841 9.9 12.0 1.0 0.9 2.4 (1.1) 1.5 (18.8) (17.2) (26.4) Telecommunication Services 5.4 (6) 62 946 1,040 (765.9) 73.5 4.8 4.4 (0.2) (0.2) (1.7) (12.0) (40.5) 15.5
Source: DataStream, Credit Suisse estimates
Index Net profit Book value Index performance Korea weighting (US$ mn) (US$ mn) P/E (x) P/B (x) (US$ term)
Sector (%) 2011 2012 2011 2012 2011 2012 2011 2012 1W 1M 3M 6M 1Y 2Y
Consumer Discretionary 23.9 2,467 3,384 26,905 29,335 16.9 12.3 1.5 1.4 1.7 7.8 8.4 1.8 2.5 23.3 Consumer Staples 12.3 1,432 1,878 18,404 19,409 15.1 11.5 1.2 1.1 1.9 7.9 19.5 23.7 24.3 40.6 Energy 0.5 111 137 877 908 8.4 6.8 1.1 1.0 2.5 2.5 28.5 19.4 14.3 71.5 Financials 10.0 1,823 1,993 22,902 24,484 9.6 8.8 0.8 0.7 2.6 0.9 4.6 (15.6) 3.0 (24.2) Health Care 5.1 370 271 4,988 5,389 24.1 32.8 1.8 1.7 0.7 5.6 21.5 18.3 6.8 (16.3) Industrials 17.0 (1,076) 1,310 31,582 33,094 (27.6) 22.7 0.9 0.9 2.8 2.9 10.4 (12.5) (5.5) (27.5) Information Technology 13.8 848 1,477 11,290 13,125 28.5 16.3 2.1 1.8 2.7 5.8 6.1 (6.3) 12.6 2.8 Materials 15.7 2,374 2,963 35,492 37,645 11.6 9.3 0.8 0.7 2.3 2.5 8.4 (14.7) (20.6) (9.7) Telecommunication Services 0.5 (13) 19 971 990 (75.6) 49.0 1.0 1.0 7.9 21.2 26.1 6.6 2.9 (32.0) Utilities 1.0 219 303 3,866 4,066 8.3 6.0 0.5 0.4 0.6 7.8 19.6 13.0 9.1 12.2
Source: DataStream, Credit Suisse estimates

14 September 2012
David & Goliath 7
Index Net profit Book value Index performance Malaysia weighting (US$ mn) (US$ mn) P/E (x) P/B (x) (US$ term)
Sector (%) 2011 2012 2011 2012 2011 2012 2011 2012 1W 1M 3M 6M 1Y 2Y
Consumer Discretionary 16.8 1,257 1,178 8,060 8,826 12.1 12.9 1.9 1.7 0.8 (1.4) 6.1 1.6 12.2 13.8 Consumer Staples 24.7 1,732 1,615 11,066 11,830 12.8 13.8 2.0 1.9 (1.2) (3.8) 3.6 4.1 25.9 51.4 Energy 2.6 51 146 2,045 2,145 46.8 16.2 1.2 1.1 (0.8) (3.0) (4.2) (5.2) 2.3 28.0 Financials 24.6 1,937 1,557 17,883 18,708 11.5 14.2 1.2 1.2 0.3 (2.0) 5.7 6.8 18.4 22.5 Health Care 5.1 263 298 1,586 1,783 17.4 15.3 2.9 2.6 (0.7) (3.8) 5.1 8.6 28.3 (0.3) Industrials 16.7 279 783 9,182 9,893 53.9 19.2 1.6 1.5 (0.5) (3.0) (1.5) (7.7) 0.8 (5.9) Information Technology 1.3 74 176 988 1,102 16.0 6.7 1.2 1.1 (0.4) (22.7) (26.6) (15.4) 15.2 (34.5) Materials 7.3 544 543 6,344 6,579 12.2 12.2 1.0 1.0 (0.9) (4.8) 1.2 0.4 6.8 9.7 Telecommunication Services 0.7 43 43 645 773 14.1 14.2 0.9 0.8 (2.1) (2.1) (1.5) (10.2) 12.1 (0.6) Utilities 0.2 3 89 35 23 66.0 2.0 5.0 7.5 0.8 1.5 0.8 (5.0) 9.1 (52.7)
Source: DataStream, Credit Suisse estimates
Index Net profit Book value Index performance Singapore weighting (US$ mn) (US$ mn) P/E (x) P/B (x) (US$ term)
Sector (%) 2011 2012 2011 2012 2011 2012 2011 2012 1W 1M 3M 6M 1Y 2Y
Consumer Discretionary 8.2 491 482 8,576 8,934 15.7 16.0 0.9 0.9 5.1 5.5 16.1 (0.6) 0.3 (18.2) Consumer Staples 16.5 1,160 1,232 9,628 10,665 13.3 12.6 1.6 1.5 1.4 0.7 12.4 (1.2) 11.7 (7.3) Energy 6.0 535 667 4,125 7,273 10.5 8.4 1.4 0.8 2.3 15.1 22.0 10.5 35.3 (10.1) Financials 31.5 2,825 2,498 31,838 33,334 10.5 11.8 0.9 0.9 3.3 5.1 13.3 12.4 17.0 2.7 Health Care 5.2 296 337 3,328 3,793 16.5 14.5 1.5 1.3 (0.6) (0.6) 6.2 (4.8) 3.7 19.0 Industrials 22.2 1,765 1,233 16,870 17,768 11.8 16.9 1.2 1.2 2.1 2.6 4.6 (6.7) 3.9 (19.7) Information Technology 5.1 302 381 4,056 4,003 16.0 12.6 1.2 1.2 4.8 5.2 4.0 (5.9) 10.2 (9.0) Materials 1.4 222 171 1,625 1,682 6.1 8.0 0.8 0.8 3.7 6.3 9.3 (13.7) (9.1) (55.7) Telecommunication Services 2.2 134 128 264 284 15.1 15.8 7.7 7.1 6.6 7.5 11.4 9.2 6.2 21.3 Utilities 1.7 100 113 808 874 15.9 13.9 2.0 1.8 2.9 0.5 9.2 (4.3) (7.8) (29.0)
Source: DataStream, Credit Suisse estimates
Index Net profit Book value Index performance Taiwan weighting (US$ mn) (US$ mn) P/E (x) P/B (x) (US$ term)
Sector (%) 2011 2012 2011 2012 2011 2012 2011 2012 1W 1M 3M 6M 1Y 2Y
Consumer Discretionary 15.7 1,460 1,568 16,132 16,748 19.5 18.1 1.8 1.7 3.3 0.0 9.9 (3.8) 6.7 6.4 Consumer Staples 2.2 173 168 1,992 2,118 23.0 23.7 2.0 1.9 3.5 0.9 15.9 0.2 6.1 27.2 Financials 13.1 2,229 2,299 20,444 22,053 10.6 10.3 1.2 1.1 3.2 6.4 10.8 (1.5) 5.8 (0.1) Health Care 1.2 122 135 942 1,051 18.5 16.6 2.4 2.1 1.4 0.2 2.9 1.9 24.4 7.7 Industrials 13.7 530 1,328 19,736 20,708 46.9 18.7 1.3 1.2 2.0 (0.6) 4.1 (8.8) 3.5 (11.1) Information Technology 41.9 1,181 1,413 59,693 62,403 64.1 53.6 1.3 1.2 2.7 3.2 1.4 (12.0) 0.9 (31.2) Materials 11.9 1,797 1,473 17,571 17,885 11.9 14.6 1.2 1.2 2.8 0.7 1.9 (8.4) (10.6) 2.8 Utilities 0.2 35 37 284 281 11.4 10.7 1.4 1.4 0.5 1.8 0.5 (14.3) 5.5 24.7
Source: DataStream, Credit Suisse estimates
Index Net profit Book value Index performance Thailand weighting (US$ mn) (US$ mn) P/E (x) P/B (x) (US$ term)
Sector (%) 2011 2012 2011 2012 2011 2012 2011 2012 1W 1M 3M 6M 1Y 2Y
Consumer Discretionary 19.3 574 716 5,220 5,856 26.9 21.5 3.0 2.6 1.0 5.5 11.5 17.2 37.2 71.9 Consumer Staples 8.0 348 374 2,415 2,888 18.3 17.0 2.6 2.2 1.6 5.3 16.2 29.7 57.7 94.3 Energy 3.4 252 282 2,070 2,116 10.8 9.6 1.3 1.3 2.2 0.5 1.3 (14.6) 7.6 45.5 Financials 22.3 977 1,316 8,525 9,672 18.2 13.5 2.1 1.8 1.5 4.2 9.9 12.1 12.6 1.2 Health Care 5.0 126 157 570 686 31.5 25.4 7.0 5.8 (1.4) 5.9 31.2 55.3 97.5 150.4 Industrials 13.6 (36) 404 7,193 7,513 (300.2) 26.9 1.5 1.4 1.7 8.2 10.9 5.8 19.8 2.1 Information Technology 3.9 160 260 2,075 2,147 19.2 11.9 1.5 1.4 2.7 6.7 9.6 1.1 10.8 (7.1) Materials 11.5 553 274 7,213 7,011 16.6 33.5 1.3 1.3 2.3 5.2 11.2 2.9 14.7 13.4 Telecommunication Services 5.5 (64) 40 1,430 1,423 (69.6) 111.7 3.1 3.1 4.7 25.9 42.7 38.7 50.1 50.9 Utilities 7.5 419 492 3,973 4,255 14.4 12.2 1.5 1.4 3.0 6.6 16.6 39.6 50.9 49.8
Source: DataStream, Credit Suisse estimates

14 September 2012
David & Goliath 8
D&G15 portfolio – the small-cap picks in the region
Mkt Cap Price Year P/E (x) Potential CS
Company Ticker (US$ mn) Cncy Price End FY1 FY2 TP Gain (%) Rating China/Hong Kong
ASM Pacific* 0522.HK 4,718 HKD 92.00 Dec 22.7 20.0 73.50 (20.1) U
Haitian* 1882.HK 1,624 HKD 7.89 Dec 11.0 10.9 6.50 (17.6) U
KWG Property 1813.HK 1,679 HKD 4.50 Dec 5.1 5.3 4.70 4.4 N
Lee & Man Paper* 2314.HK 1,935 HKD 3.20 Mar 10.4 9.0 2.75 (14.1) U
Skyworth 0751.HK 1,151 HKD 3.30 Mar 5.4 4.8 5.70 72.7 O
Techtronic* 0669.HK 2,981 HKD 12.68 Dec 14.7 13.2 9.65 (23.9) N
Varitronix 0710.HK 111 HKD 2.66 Dec 4.6 4.7 3.65 37.2 O
VTech 0303.HK 3,037 HKD 94.05 Mar 14.2 13.2 84.00 (10.7) N
Source: Company data, Credit Suisse estimates * ASM Pacific, Haitian, Lee & Man Paper, and Techtronic are SHORT ideas.

14 September 2012
David & Goliath 9
Hong Kong – Street talk * C C Land (1224.HK, HK$1.65, NR) announces Aug contracted sales. C C Land announced that it recorded contracted sales for the month Aug of Rmb645 mn, representing an increase of 185% YoY. (10-Sep)
40
60
80
100
120
09/11 12/11 03/12 06/12 09/12
C C Land MSCI Hong Kong
Yue Yuen (0551.HK, HK$24.60, N, TP HK$25.70) announces revenue for August. Yue Yuen announced that the net consolidated operating revenue for the month Aug 2012 was US$567 mn. And the net consolidated accumulative operating revenue for the eight months ended Aug 2012 amounted to US$4.81 bn. (11-Sep)
65
80
95
110
125
140
09/11 12/11 03/12 06/12 09/12
Yue Yuen Industrial Holding MSCI Hong Kong
Sunevision (8008.HK, HK$1.64, NR) announces final results. Sunvision recorded a profit attributable to owners of HK$450 mn for 1H12. The firm declared the payment of a final dividend of HK$0.082 per share in respect of the year. (12-Sep)
70
100
130
160
190
09/11 12/11 03/12 06/12 09/12
Sunevision Holdings MSCI Hong Kong
China Overseas Grand Oceans (0081.HK, HK$7.95, NR) sales value for August decreased by 8% to HK$1.06 bn. China Overseas Grand Oceans reported a property sales value of HK$1.06 bn for Aug, down 8% MoM. In the same month its property sales area jumped 33% MoM to 103,700 sqm. From Jan to Aug of this year the company reaped 695,700 sqm in property sales area and HK$10.22 bn in sales value, accounting for 79% of its yearly target of HK$13 bn. (13-Sep)
40
60
80
100
120
140
09/11 12/11 03/12 06/12 09/12
China Overseas Grand Oceans MSCI Hong Kong
*Source: China Press Digest, CIS, DataStream

14 September 2012
David & Goliath 10
Hong Kong – Company updates Luk Fook (0590.HK, HK$22.45, N [V], TP HK$23.30) Chow Sang Sang (0116.HK, HK$17.06, O, TP HK$20.00)
Major beneficiary of QE3
■ The low gold price hedging ratio of only 20% has led to a high
correlation between Luk Fook’s performance and the gold prices,
given 80% of the holding gain of inventory passes on directly to
the gross margin.
■ Therefore, we believe the less bearish gold price outlook should
justify the re-rating of Luk Fook from its current valuation of an 8-
9x CY13E P/E.
■ The worse-than-expected rental pressure has offset the benefits
from the recent positive gold price momentum. We have lowered
our FY3/13-FY3/14 earnings forecasts by 0.4-2.9%. Note,
potential gross margin improvement is not priced in yet, in our
view.
■ Luk Fook traded as high as a 16x CY13E P/E on the gold price
rally in July 2011. We set our target price of HK$23.3 based on a
10x CY13E P/E (previously 8x FY3/13E P/E), with the more
aggressive multiple assigned on the back of a less bearish gold
price outlook. However, with only 9% potential upside to our
target price, we maintain our NEUTRAL rating on the stock.
Most stable earnings growth, but cheapest valuation
■ We initiate coverage on Chow Sang Sang (CSS) with an
OUTPERFORM rating and a target price of HK$20.0 based on
10x CY2013 P/E, which implies 0.56x PEG. We like its stable
earnings outlook and 100% self-operated model which allows a
flexible expansion strategy as well as prudent inventory
management.
■ Despite the overall weakness in gold price as well as jewellery
demand, CSS still registered a solid SSSG of around 16% YoY in
June quarter 2012 in Hong Kong and outperformed the overall
Hong Kong market growth of 6.8% YoY. Stripping out the holding
gain/loss, net profits saw 10.6% YoY growth in 1H12.
■ With the negative YoY change in gold price narrowing, we expect
Chow Sang Sang’s earnings momentum to bottom out in 3Q2012
and recover from 4Q onward.
■ CSS is trading around lowest valuation range, which in our view
is not justified. We believe CSS stable earnings outlook deserves
to trade at least the same valuation of Luk Fook (~10x CY2013
P/E). Risks on CSS include unfavourable gold price movement
and strong reliance on mainland Chinese visitors to HK/Macau.
Bbg/RIC 21.35
23.30 (16.50)
589.11 9
3.4
8.5
Free float (%) 54.7 Performance 1M 3M 12M
Absolute (%) 12.1 42.9 (44.1)
Relativ e (%) 13.4 35.9 (43.6)
Year 03/11A 03/12A 03/13E 03/14E 03/15E
8,091 11,907 13,498 16,150 19,280
1,083 1,665 1,527 1,889 2,255
866 1,334 1,181 1,438 1,686
1.71 2.43 2.00 2.44 2.86
n.a. n.a. (3) 0 1
n.a. n.a. 2.15 2.56 3.01
58.3 42.0 -17.3 21.8 17.3
12.5 8.8 10.6 8.7 7.5
3.2 4.3 4.2 5.1 6.0
10.7 6.6 6.8 5.2 4.2
3.2 2.1 1.9 1.7 1.5
34.1 29.6 19.4 20.4 21.0
-27.9 -27.2 -32.8 -35.2 -36.2
38.2 - 14.7
12,577.5/ 1,621.6
ROE (%)
Note1:Luk Fook Holdings (International) Limited is an investment holding company. It is engaged in the sourcing, designing, wholesaling and retailing of a
range of gold jewellery, gold ornaments, gem-set jewellery, jadeite, gemstones, and other accessory items..
Mkt cap (HK$/US$ mn)Daily trad v al - 6m av g (US$ mn)
Major shareholders Luk Fook (Control) Limited
Net debt(cash)/equity (%)
Rev enue (HK$ mn)
52-w k range (HK$)
590 HK / 0590.HK
N (N) [V]
Daily trad v ol - 6m av g (mn)
Rating (prev. rating)
Shares outstanding (mn)
Price (07 Sep 12 , HK$)
TP (prev. TP HK$)
Est. pot. % chg. to TP
EBITDA (HK$ mn)
Net profit (HK$ mn)
EPS (HK$)
- Change from prev . EPS (%)
- Consensus EPS (HK$)
EPS grow th (%)
P/E (x )
Div idend y ield (%)
EV/EBITDA (x )
P/B (x )
Bbg/RIC 15.98
20.00 (NA)
676.92 25
0.8
1.8
Free float (%) 43.8 Performance 1M 3M 12M
Absolute (%) (1.4) 0.1 (38.9)
Relativ e (%) 0.0 (6.9) (38.3)
Year 12/10A 12/11A 12/12E 12/13E 12/14E
11,705 17,158 19,651 23,917 29,089
1,077 1,557 1,485 1,937 2,521
757 1,094 1,052 1,354 1,793
1.16 1.62 1.55 2.00 2.65
n.a. n.a. 0 0 0
n.a. n.a. 1.46 1.81 2.18
21.9 39.0 -3.8 28.7 32.5
13.7 9.9 10.3 8.0 6.0
2.7 3.8 3.9 5.0 6.6
10.8 7.9 8.4 6.2 5.1
1.8 1.7 1.5 1.3 1.1
15.8 18.2 15.5 17.3 19.8
14.8 23.0 21.6 14.7 19.3
26.2 - 15.0
10,817.2/ 1,394.6
ROE (%)
Note1:Chow Sang Sang mainly engaged in the manufacture and retail of gold, gem-set jewellery products and watches (> 70% of revenue in 2011),
wholesale of precious metals, securities and commodity broking, and gold bullion trading and property investment..
Mkt cap (HK$/US$ mn)Daily trad v al - 6m av g (US$ mn)
Major shareholders Ev erw in Co. Ltd. (17.73%)
Net debt(cash)/equity (%)
Rev enue (HK$ mn)
52-w k range (HK$)
116 HK / 0116.HK
O (NA)
Daily trad v ol - 6m av g (mn)
Rating (prev. rating)
Shares outstanding (mn)
Price (07 Sep 12 , HK$)
TP (prev. TP HK$)
Est. pot. % chg. to TP
EBITDA (HK$ mn)
Net profit (HK$ mn)
EPS (HK$)
- Change from prev . EPS (%)
- Consensus EPS (HK$)
EPS grow th (%)
P/E (x )
Div idend y ield (%)
EV/EBITDA (x )
P/B (x )
Price performance vs. MSCI Hong Kong Price performance vs. MSCI Hong Kong
30
50
70
90
110
09/11 11/11 01/12 03/12 05/12 07/12 09/12
Luk Fook MSCI Hong Kong
50
65
80
95
110
09/11 11/11 01/12 03/12 05/12 07/12 09/12
Chow Sang Sang MSCI Hong Kong
Gabriel Chan, CFA / Research Analyst / 852 2101 6523 /
Extracted from The Asian Daily 10 Sep 2012
Gabriel Chan, CFA / Research Analyst / 852 2101 6523 /
Extracted from The Asian Daily 10 Sep 2012
14 September 2012
David & Goliath 11
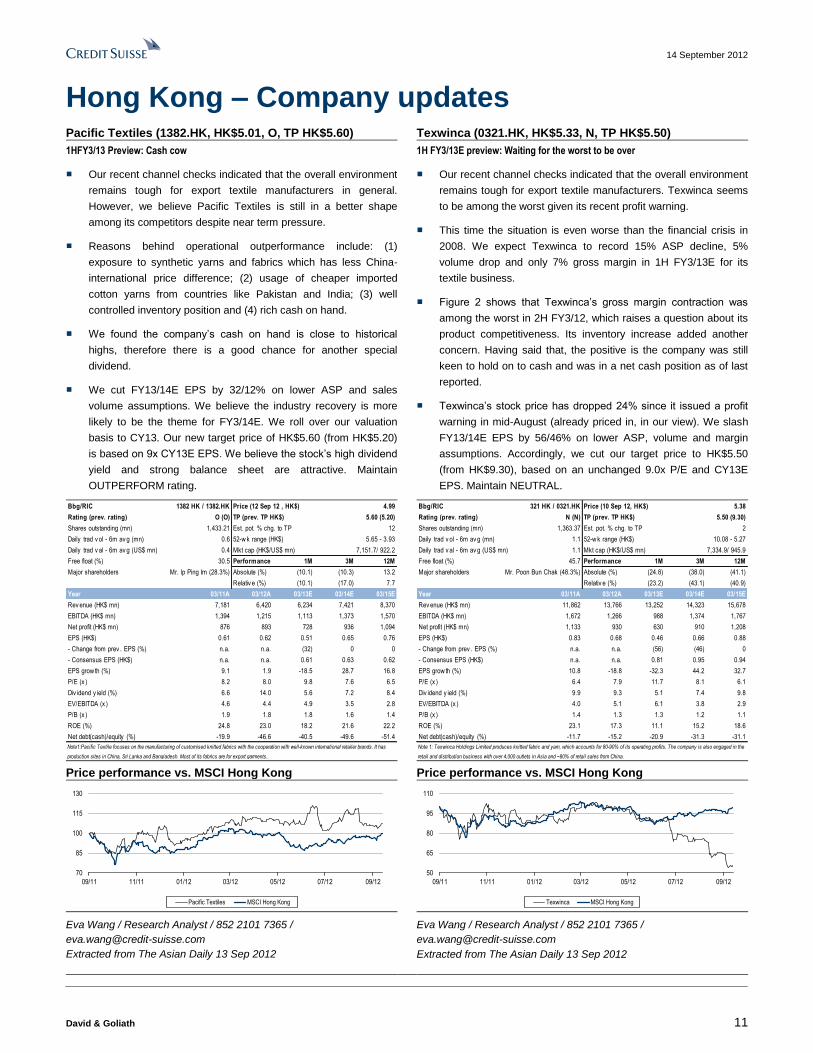
Hong Kong – Company updates Pacific Textiles (1382.HK, HK$5.01, O, TP HK$5.60) Texwinca (0321.HK, HK$5.33, N, TP HK$5.50)
1HFY3/13 Preview: Cash cow
■ Our recent channel checks indicated that the overall environment
remains tough for export textile manufacturers in general.
However, we believe Pacific Textiles is still in a better shape
among its competitors despite near term pressure.
■ Reasons behind operational outperformance include: (1)
exposure to synthetic yarns and fabrics which has less China-
international price difference; (2) usage of cheaper imported
cotton yarns from countries like Pakistan and India; (3) well
controlled inventory position and (4) rich cash on hand.
■ We found the company’s cash on hand is close to historical
highs, therefore there is a good chance for another special
dividend.
■ We cut FY13/14E EPS by 32/12% on lower ASP and sales
volume assumptions. We believe the industry recovery is more
likely to be the theme for FY3/14E. We roll over our valuation
basis to CY13. Our new target price of HK$5.60 (from HK$5.20)
is based on 9x CY13E EPS. We believe the stock’s high dividend
yield and strong balance sheet are attractive. Maintain
OUTPERFORM rating.
1H FY3/13E preview: Waiting for the worst to be over
■ Our recent channel checks indicated that the overall environment
remains tough for export textile manufacturers. Texwinca seems
to be among the worst given its recent profit warning.
■ This time the situation is even worse than the financial crisis in
2008. We expect Texwinca to record 15% ASP decline, 5%
volume drop and only 7% gross margin in 1H FY3/13E for its
textile business.
■ Figure 2 shows that Texwinca’s gross margin contraction was
among the worst in 2H FY3/12, which raises a question about its
product competitiveness. Its inventory increase added another
concern. Having said that, the positive is the company was still
keen to hold on to cash and was in a net cash position as of last
reported.
■ Texwinca’s stock price has dropped 24% since it issued a profit
warning in mid-August (already priced in, in our view). We slash
FY13/14E EPS by 56/46% on lower ASP, volume and margin
assumptions. Accordingly, we cut our target price to HK$5.50
(from HK$9.30), based on an unchanged 9.0x P/E and CY13E
EPS. Maintain NEUTRAL.
Bbg/RIC 4.99
5.60 (5.20)
1,433.21 12
0.6
0.4
Free float (%) 30.5 Performance 1M 3M 12M
Absolute (%) (10.1) (10.3) 13.2
Relativ e (%) (10.1) (17.0) 7.7
Year 03/11A 03/12A 03/13E 03/14E 03/15E
7,181 6,420 6,234 7,421 8,370
1,394 1,215 1,113 1,373 1,570
876 893 728 936 1,094
0.61 0.62 0.51 0.65 0.76
n.a. n.a. (32) 0 0
n.a. n.a. 0.61 0.63 0.62
9.1 1.9 -18.5 28.7 16.8
8.2 8.0 9.8 7.6 6.5
6.6 14.0 5.6 7.2 8.4
4.6 4.4 4.9 3.5 2.8
1.9 1.8 1.8 1.6 1.4
24.8 23.0 18.2 21.6 22.2
-19.9 -46.6 -40.5 -49.6 -51.4
- Consensus EPS (HK$)
EPS grow th (%)
P/E (x )
Div idend y ield (%)
EV/EBITDA (x )
P/B (x )
EBITDA (HK$ mn)
Net profit (HK$ mn)
EPS (HK$)
- Change from prev . EPS (%)
Price (12 Sep 12 , HK$)
TP (prev. TP HK$)
Est. pot. % chg. to TP
52-w k range (HK$)
1382 HK / 1382.HK
O (O)
Daily trad v ol - 6m av g (mn)
Rating (prev. rating)
Shares outstanding (mn)
5.65 - 3.93
7,151.7/ 922.2
ROE (%)
Note1:Pacific Textile focuses on the manufacturing of customised knitted fabrics with the cooperation with well-known international retailer brands. It has
production sites in China, Sri Lanka and Bangladesh. Most of its fabrics are for export garments..
Mkt cap (HK$/US$ mn)Daily trad v al - 6m av g (US$ mn)
Major shareholders Mr. lp Ping Im (28.3%)
Net debt(cash)/equity (%)
Rev enue (HK$ mn)
Bbg/RIC 5.38
5.50 (9.30)
1,363.37 2
1.1
1.1
Free float (%) 45.7 Performance 1M 3M 12M
Absolute (%) (24.8) (38.0) (41.1)
Relativ e (%) (23.2) (43.1) (40.9)
Year 03/11A 03/12A 03/13E 03/14E 03/15E
11,862 13,766 13,252 14,323 15,678
1,672 1,266 988 1,374 1,767
1,133 930 630 910 1,208
0.83 0.68 0.46 0.66 0.88
n.a. n.a. (56) (46) 0
n.a. n.a. 0.81 0.95 0.94
10.8 -18.8 -32.3 44.2 32.7
6.4 7.9 11.7 8.1 6.1
9.9 9.3 5.1 7.4 9.8
4.0 5.1 6.1 3.8 2.9
1.4 1.3 1.3 1.2 1.1
23.1 17.3 11.1 15.2 18.6
-11.7 -15.2 -20.9 -31.3 -31.1
- Consensus EPS (HK$)
EPS grow th (%)
P/E (x )
Div idend y ield (%)
EV/EBITDA (x )
P/B (x )
EBITDA (HK$ mn)
Net profit (HK$ mn)
EPS (HK$)
- Change from prev . EPS (%)
Price (10 Sep 12, HK$)
TP (prev. TP HK$)
Est. pot. % chg. to TP
52-w k range (HK$)
321 HK / 0321.HK
N (N)
Daily trad v ol - 6m av g (mn)
Rating (prev. rating)
Shares outstanding (mn)
10.08 - 5.27
7,334.9/ 945.9
ROE (%)
Note 1: Texwinca Holdings Limited produces knitted fabric and yarn, which accounts for 80-90% of its operating profits. The company is also engaged in the
retail and distribution business with over 4,000 outlets in Asia and ~80% of retail sales from China.
Mkt cap (HK$/US$ mn)Daily trad v al - 6m av g (US$ mn)
Major shareholders Mr. Poon Bun Chak (48.3%)
Net debt(cash)/equity (%)
Rev enue (HK$ mn)
Price performance vs. MSCI Hong Kong Price performance vs. MSCI Hong Kong
70
85
100
115
130
09/11 11/11 01/12 03/12 05/12 07/12 09/12
Pacific Textiles MSCI Hong Kong
50
65
80
95
110
09/11 11/11 01/12 03/12 05/12 07/12 09/12
Texwinca MSCI Hong Kong
Eva Wang / Research Analyst / 852 2101 7365 /
Extracted from The Asian Daily 13 Sep 2012
Eva Wang / Research Analyst / 852 2101 7365 /
Extracted from The Asian Daily 13 Sep 2012

14 September 2012
David & Goliath 12
Hong Kong – Company updates Pacific Basin Shipping (2343.HK, HK$3.84, U [V], TP
HK$3.40)
New report: RoRo exit a step in the right direction
■ Pacific Basin (PB) has sold its RoRo division for €153 mn—
essentially for book value and drawing a line under its unhappy
association with this attempt at diversification.
■ All six vessels are being sold to Grimaldi over a three-year
period, during which time those pending transfer will be employed
on bare-boat charters, which should eliminate the losses we had
baked into our estimates.
■ While this does not add value to the business, it does remove a
drag on earnings and eases concerns about further impairments:
we have lifted our estimates for FY12 and FY13 from US$27 mn
and US$158 mn, respectively, to US$32 mn and US$175 mn.
■ Excess supply and short-term demand pressures in its core
business remains unrelenting, however, and mean that—other
than perhaps a slight bounce on this news—PB’s stock price
performance is unlikely to startle this side of Christmas. We retain
our UNDERPERFORM rating, along with a barely changed
HK$3.40 price target, based on a 0.6x P/B.
Bbg/RIC 3.40
3.40 (3.30)
1,936.58 —
4.8
2.3
Free float (%) 90 Performance 1M 3M 12M
Absolute (%) (6.3) (0.6) (5.0)
Relativ e (%) (4.7) (5.1) (4.7)
Year 12/10A 12/11A 12/12E 12/13E 12/14E
1,269 1,343 1,363 1,530 1,598
203.4 168.8 132.4 274.5 324.0
119.5 57.8 31.8 174.8 229.2
0.06 0.03 0.02 0.09 0.12
n.a. n.a. 17 10 0
n.a. n.a. 0.00 0.03 0.04
2.0 -51.8 -45.0 450.7 31.1
7.1 14.7 26.7 4.8 3.7
5.7 1.5 0.0 8.4 12.2
5.0 6.1 8.2 4.1 3.1
0.5 0.6 0.6 0.6 0.6
8.0 3.8 2.3 12.9 15.6
11.0 12.2 18.2 18.8 9.3
4.45 - 2.82
6,584.4/ 849.0
ROE (%)
Note 1: ORD/ADR=20.00. Note 2: Pacific Basin Shipping Limited is an investment holding company. It is engaged in the provision of dry bulk (primarily
vessel owning and vessel chartering) and RoRo shipping services, and services to the energy and infrastructure sector.
Mkt cap (HK$/US$ mn)Daily trad v al - 6m av g (US$ mn)
Major shareholders Aberdeen - 10%, Mondrian -
Net debt(cash)/equity (%)
Rev enue (US$ mn)
52-w k range (HK$)
2343 HK / 2343.HK
U (U) [V]
Daily trad v ol - 6m av g (mn)
Rating (prev. rating)
Shares outstanding (mn)
Price (07 Sep 12 , HK$)
TP (prev. TP HK$)
Est. pot. % chg. to TP
EBITDRAF (US$ mn)
Net profit (US$ mn)
EPS (US$)
- Change from prev . EPS (%)
- Consensus EPS (US$)
EPS grow th (%)
P/E (x )
Div idend y ield (%)
EV/EBITDRAF (x )
P/B (x )
Price performance vs. MSCI Hong Kong
70
80
90
100
110
120
09/11 11/11 01/12 03/12 05/12 07/12 09/12
Pacific Basin Shipping MSCI Hong Kong
Timothy Ross / Research Analyst / 65 6212 3337 /
Extracted from The Asian Daily 10 Sep 2012

14 S
epte
mber 2
012
David
& G
olia
th
13
Valuations of Credit Suisse HK small-cap watch list*
Market CS target/ Potential Credit Year HOLT CFROI
Cap Price HOLT warranted return Suisse end CFROI Spread
Company RIC (US$ mn) (HK$) price (HK$) (%) Rating month 2011 2012 2011 2012 (%) (%) 1W 1M 3M
Aeon Credit 0900.HK 343 6.35 5.35 (15.7) Not rated Feb n.a. 9.1 n.a. 1.2 8.0 (1.5) 0.8 (0.8) (2.3)
AEON Stores 0984.HK 704 21.00 7.28 (65.3) Not rated Dec 13.5 18.0 3.5 3.2 6.5 (1.6) (4.5) (7.9) (6.7)
Alco Holdings 0328.HK 123 1.64 1.99 21.4 Not rated Mar n.a. 11.3 n.a. 0.5 2.3 (6.6) 1.2 (3.5) (27.1)
Allied Group 0373.HK 442 17.92 40.37 125.3 Not rated Dec 3.2 6.9 0.3 0.2 2.9 (6.4) (0.4) 1.2 2.4
Allied Properties 0056.HK 851 0.97 2.13 119.6 Not rated Dec 3.7 3.2 0.4 0.3 4.2 (5.0) 2.1 (1.0) 1.0
AMVIG 2300.HK 298 2.50 3.02 20.9 Not rated Dec 4.2 5.4 0.5 0.5 16.3 8.2 5.0 (27.1) (16.9)
Apollo Solar Energy 0566.HK 364 0.21 1.51 617.1 Not rated Dec 3.6 1.9 0.3 0.3 30.5 22.4 3.4 (7.5) (4.5)
Asia Financial 0662.HK 386 2.94 3.46 17.7 Not rated Dec (21.8) (21.7) 0.6 0.5 (4.9) (14.3) 1.4 7.7 5.8
Asia Sat. Telecom. 1135.HK 1,223 24.25 22.22 (8.4) Not rated Dec 11.5 10.3 1.4 1.3 9.6 1.6 (1.8) 9.2 12.8
ASM Pacific 0522.HK 4,718 92.00 73.50 (20.1) UNDERPERFORM Dec 12.4 22.7 5.8 5.0 21.5 15.0 2.2 5.1 (1.8)
Associated Int'l Hotels 0105.HK 789 17.00 20.92 23.1 Not rated Mar 22.1 12.0 n.a. 0.6 2.5 (5.6) (1.2) 1.2 6.3
Bonjour 0653.HK 394 1.02 0.48 (53.1) Not rated Dec 12.8 15.0 10.6 10.0 13.7 5.5 1.0 10.9 (12.1)
Brightoil Petroleum 0933.HK 1,639 1.45 1.31 (9.9) Not rated Jun 8.4 7.7 1.8 1.4 7.8 1.0 2.1 (1.4) 0.0
C C Land 1224.HK 551 1.65 1.67 1.1 Not rated Dec 14.0 8.3 0.3 0.3 0.9 (6.9) 2.5 (1.2) (10.8)
C.P. Pokphand 0043.HK 2,147 0.98 0.62 (36.6) Not rated Dec 13.4 12.6 2.7 2.3 13.1 5.9 0.0 (1.0) 6.5
Café De Coral 0341.HK 1,685 22.85 8.54 (62.6) Not rated Mar 26.7 25.0 4.1 3.8 5.7 (1.8) 2.5 4.6 15.2
Chaoy ue 0147.HK 1,216 0.50 0.01 (97.1) Not rated Mar n.a. (415.6) n.a. (79.9) (48.5) (56.5) (27.5) 63.9 185.7
Chen Hsong 0057.HK 169 2.08 2.68 28.9 Not rated Mar 6.4 9.7 0.5 0.4 3.6 (5.2) 1.5 (5.0) (12.2)
Chev alier 0025.HK 333 9.30 9.01 (3.1) Not rated Mar n.a. 6.0 n.a. 0.5 3.6 (4.9) (7.0) (1.6) 14.1
China Haidian 0256.HK 440 0.80 0.62 (21.9) Not rated Dec 12.9 14.3 1.1 0.9 6.8 (1.7) 5.3 1.3 2.6
China Motor Bus 0026.HK 365 62.00 99.22 60.0 Not rated Jun n.a. 4.8 n.a. 0.5 3.5 (5.3) (1.6) 1.7 6.0
China Oriental 0581.HK 676 1.79 2.63 46.9 Not rated Dec 3.5 11.8 0.5 0.4 8.2 0.8 3.5 (3.2) (10.5)
Chong Hing Bank 1111.HK 719 12.82 10.41 (18.8) Not rated Dec 9.9 13.9 0.8 0.8 5.1 (4.2) 1.1 0.9 3.9
Chow Sang Sang 0116.HK 1,489 17.06 20.00 17.2 OUTPERFORM Dec 10.6 11.0 1.8 1.6 9.5 2.4 9.8 6.9 6.1
City Telecom (HK) 1137.HK 208 1.99 2.89 45.4 Not rated Aug 5.3 6.5 0.8 1.2 9.6 1.2 (2.0) 14.4 (54.5)
CK Life Sciences 0775.HK 768 0.62 0.12 (80.7) Not rated Dec 47.3 34.0 1.1 1.1 6.5 (1.6) (1.6) 17.0 51.2
Comba Telecom Sys. 2342.HK 464 2.36 1.88 (20.5) NEUTRAL Dec 5.4 37.3 0.9 0.9 10.5 3.0 22.9 38.8 (30.0)
Convenience Retail 0831.HK 419 4.40 1.41 (68.0) Not rated Dec 19.4 18.3 3.4 3.2 6.1 (2.4) 2.1 (0.9) (2.0)
Cross-Harbour 0032.HK 304 6.33 6.48 2.3 Not rated Dec 9.7 9.4 0.8 0.7 (4.4) (13.1) 2.1 3.1 2.1
Dah Chong Hong 1828.HK 1,693 7.19 5.66 (21.3) Not rated Dec 9.9 9.7 1.7 1.5 7.5 0.4 2.6 2.9 (4.6)
Share price performance
HK$ term (%)P/B (x)P/E (x)
CalendarizedCalendarized
* Include the Hong Kong Industrial, consumer and media companies covered by Credit Suisse, and small-cap stocks in HOLT® database with market cap between US$150 mn and US$2 bn.
For stocks that are Not Rated, I/B/E/S consensus forecast are used. CFROI® is a registered trademark in the United States and other countries (excluding the United Kingdom) of Credit
Suisse or its subsidiaries or affiliates.
* Companies in bold and italic indicate constituents of Credit Suisse Hong Kong Small Cap Index

14 S
epte
mber 2
012
David
& G
olia
th
14
Valuations of Credit Suisse HK small-cap watch list*
Market CS target/ Potential Credit Year HOLT CFROI
Cap Price HOLT warranted return Suisse end CFROI Spread
Company RIC (US$ mn) (HK$) price (HK$) (%) Rating month 2011 2012 2011 2012 (%) (%) 1W 1M 3M
Dah Sing Banking 2356.HK 1,146 7.10 8.50 19.7 NEUTRAL Dec 8.1 7.7 0.6 0.6 4.2 (4.9) 2.2 (3.1) 4.9
Dah Sing Financial 0440.HK 994 26.00 29.00 11.5 NEUTRAL Dec 7.5 7.1 0.5 0.5 3.7 (5.5) 2.4 2.2 13.5
Dickson Concepts 0113.HK 198 4.13 2.72 (34.0) Not rated Mar n.a. 7.4 n.a. 0.6 4.1 (4.6) (0.2) (3.7) (1.4)
Embry 1388.HK 208 3.90 2.23 (42.7) Not rated Dec 10.0 11.1 1.3 1.1 7.2 (1.5) 1.3 14.7 6.8
Emperor Entertainment 0296.HK 257 1.54 3.41 121.2 Not rated Mar n.a. 5.1 n.a. 0.9 18.7 9.7 10.0 11.6 30.5
Emperor Watch & Jewellery 0887.HK 650 0.75 0.64 (15.0) Not rated Dec 7.7 9.1 1.3 1.0 11.2 3.5 5.6 (1.3) (6.3)
Epro 8086.HK 493 0.72 0.16 (77.7) Not rated Jun n.a. 39.0 n.a. 10.5 17.9 9.9 1.4 1.4 (10.0)
ERA Mining 8043.HK 638 0.87 0.25 (70.9) Not rated Dec (348.0) 34.8 3.8 3.6 4.9 (3.5) 0.0 0.0 0.0
EVA Precision 0838.HK 145 0.65 0.28 (56.2) Not rated Dec 5.1 13.3 0.6 0.4 5.7 (2.5) 6.6 1.6 (19.8)
Fairw ood 0052.HK 276 17.12 3.96 (76.9) Not rated Mar 18.2 15.0 n.a. 4.0 6.2 (2.8) 5.0 12.6 35.7
Fortune REIT 0778.HK 1,288 5.89 2.79 (52.6) Not rated Dec 2.9 22.5 0.7 0.7 2.7 (5.1) 0.7 8.7 34.2
Giordano 0709.HK 1,192 6.00 4.01 (33.1) Not rated Dec 12.4 11.8 3.3 3.1 8.4 0.8 (0.2) 9.9 14.5
Glorious Sun 0393.HK 310 2.27 -0.05 (102.3) Not rated Dec 7.6 13.2 1.0 1.0 3.6 (4.6) 1.8 (6.6) (4.6)
Goldlion 0533.HK 433 3.42 3.73 9.0 Not rated Dec 8.0 8.5 1.1 1.1 8.3 (0.2) (0.3) 5.6 11.4
Great Eagle 0041.HK 1,799 22.10 31.20 41.2 OUTPERFORM Dec 8.3 8.3 0.4 0.4 4.0 (3.3) 5.0 8.3 13.3
G-Resources 1051.HK 939 0.39 0.56 45.2 NEUTRAL Jun (37.1) 9.9 1.1 1.0 (13.2) (21.1) 1.3 (14.4) (14.4)
Harbour Centre Dev. 0051.HK 1,038 11.36 10.77 (5.2) Not rated Dec 7.3 22.3 0.7 0.6 2.1 (5.7) 3.3 15.4 22.2
Henderson Investment 0097.HK 216 0.55 0.50 (9.6) Not rated Dec 15.7 12.1 1.0 1.0 8.6 (0.3) 0.0 (5.2) (3.5)
Hi Sun Tech. (China) 0818.HK 279 0.81 0.71 (11.9) Not rated Dec (8.4) (20.6) 0.8 0.8 (9.0) (17.1) 47.3 (1.2) (13.8)
HKC 0190.HK 419 0.30 0.55 84.9 Not rated Dec 12.8 (179.5) 0.3 0.3 0.0 (8.2) 0.0 0.0 (9.2)
HKR 0480.HK 543 3.12 7.87 152.1 Not rated Mar 6.8 5.9 0.3 0.3 0.9 (7.0) 9.5 7.6 14.3
Honbridge 8137.HK 473 0.59 -0.02 (104.1) Not rated Dec (11.7) 214.2 6.6 6.6 3.2 (4.1) (1.7) (3.3) (23.4)
Hong Kong Ferry 0050.HK 309 6.73 10.73 59.4 Not rated Dec 4.2 7.9 0.5 0.5 4.0 (4.9) (0.1) 1.4 5.5
HK & S Hotels 0045.HK 1,792 9.25 14.67 58.6 Not rated Dec 6.1 32.5 0.4 0.4 1.6 (5.4) 1.5 (3.0) (7.9)
HongKong Chinese 0655.HK 298 1.16 3.97 241.9 Not rated Dec 2.6 2.2 0.3 0.2 7.1 (2.3) (1.7) 1.8 (3.3)
Hopewell Highway Infra. 0737.HK 1,505 3.94 2.87 (27.1) Not rated Jun 11.5 11.6 1.3 1.3 7.0 (0.1) 1.8 4.2 7.4
Huabao 0336.HK 1,705 4.20 4.55 8.3 NEUTRAL Mar 8.1 7.5 2.3 1.9 34.2 27.3 (2.8) 8.5 34.6
Hutchison Harbour Ring 0715.HK 763 0.66 0.40 (38.8) Not rated Dec 65.3 65.1 1.0 1.0 1.4 (6.4) 6.5 1.5 4.8
Hutchison Telecom HK 0215.HK 2,144 3.45 4.20 21.7 NEUTRAL Dec 16.3 13.4 1.6 1.5 6.8 (0.4) (2.3) (7.0) 1.5
I.T. 0999.HK 524 3.31 2.33 (29.7) Not rated Feb 8.7 8.0 1.8 1.5 7.9 0.2 (5.7) (7.0) 9.2
HK$ term (%)P/E (x) P/B (x)
Calendarized Calendarized Share price performance
* Include the Hong Kong Industrial, consumer and media companies covered by Credit Suisse, and small-cap stocks in HOLT® database with market cap between US$150 mn and US$2 bn.
For stocks that are Not Rated, I/B/E/S consensus forecast are used. CFROI® is a registered trademark in the United States and other countries (excluding the United Kingdom) of Credit
Suisse or its subsidiaries or affiliates.
* Companies in bold and italic indicate constituents of Credit Suisse Hong Kong Small Cap Index

14 S
epte
mber 2
012
David
& G
olia
th
15
Valuations of Credit Suisse HK small-cap watch list*
Market CS target/ Potential Credit Year HOLT CFROI
Cap Price HOLT warranted return Suisse end CFROI Spread
Company RIC (US$ mn) (HK$) price (HK$) (%) Rating month 2011 2012 2011 2012 (%) (%) 1W 1M 3M
Int'l Entertainment 1009.HK 160 1.05 0.73 (30.9) Not rated Mar n.a. 16.9 n.a. 0.7 0.9 (7.9) 0.0 5.0 (18.0)
IRC 1029.HK 257 0.57 1.49 161.5 Not rated Dec 245.0 (14.7) 0.3 0.3 (0.1) (8.2) 1.8 (18.6) (33.7)
Johnson Electric 0179.HK 2,317 4.98 4.80 (3.6) NEUTRAL Mar 12.6 11.8 1.6 1.5 10.6 3.5 7.1 13.7 6.2
Ju Teng 3336.HK 509 3.49 3.31 (5.2) Not rated Dec 15.4 7.2 0.8 0.8 1.2 (7.2) 2.3 19.1 90.7
K. Wah Int'l 0173.HK 1,159 3.44 6.97 102.8 Not rated Dec 7.1 3.0 0.7 0.6 6.1 (1.6) 5.8 20.3 14.3
Kingboard Chemical 0148.HK 1,869 16.96 17.80 5.0 NEUTRAL Dec 5.6 7.2 0.5 0.5 4.7 (2.0) 2.3 (1.3) 2.5
Kingboard Laminates 1888.HK 1,207 3.12 3.70 18.7 Not rated Dec 7.1 7.3 0.9 0.8 5.8 (1.4) 7.6 2.0 12.2
Kingston Financial 1031.HK 906 0.58 0.42 (27.6) Not rated Mar 3.3 8.6 n.a. 0.5 15.5 8.2 13.7 (26.6) (19.4)
Kosmopolito Hotels 2266.HK 487 1.89 0.31 (83.4) Not rated Mar 7.7 10.7 1.1 1.0 5.6 (2.8) 1.1 21.2 40.0
Kowloon Dev. 0034.HK 1,232 8.30 9.23 11.3 Not rated Dec 6.2 9.7 0.5 0.4 1.4 (5.9) 8.2 7.4 12.3
Le Saunda 0738.HK 161 1.95 2.10 7.5 Not rated Feb n.a. 6.4 n.a. 1.0 8.6 (0.2) 0.5 (4.4) (15.2)
Lee & Man Paper 2314.HK 1,935 3.20 2.75 (14.1) UNDERPERFORM Mar 10.1 10.6 1.1 1.1 5.0 (1.9) 2.9 (5.3) 1.9
Lee's Pharma. 0950.HK 340 5.08 3.00 (40.9) Not rated Dec 28.4 20.3 7.7 4.6 27.5 18.2 4.5 16.0 50.3
Lippo 0226.HK 207 3.24 11.07 241.6 Not rated Dec 2.7 4.1 0.2 0.2 2.7 (6.9) 3.2 6.9 14.1
Luk Fook 0590.HK 1,706 22.45 23.30 3.8 NEUTRAL Mar 10.0 10.6 2.4 2.1 17.0 9.9 12.3 15.1 47.7
Lung Kee 0255.HK 210 2.58 2.92 13.1 Not rated Dec 5.9 10.1 0.7 0.7 3.7 (5.0) 2.4 (3.7) (5.8)
Man Wah 1999.HK 389 3.35 2.54 (24.1) Not rated Mar 8.4 8.6 1.0 0.8 5.2 (2.5) 10.9 20.1 (9.0)
Media Chinese 0685.HK 803 3.69 2.44 (33.8) Not rated Mar n.a. 13.2 n.a. 2.0 12.8 4.5 (1.6) 2.5 40.3
Melco 0200.HK 1,018 6.40 4.30 (32.8) OUTPERFORM Dec 23.4 11.0 1.0 1.1 (4.0) (11.7) 7.9 11.5 2.1
Midland 1200.HK 408 4.41 5.34 21.1 OUTPERFORM Dec 23.9 12.0 2.1 1.9 3.9 (4.3) 2.6 2.8 12.8
Min Xin 0222.HK 252 4.26 6.31 48.2 Not rated Dec 6.5 6.0 0.7 0.6 8.8 (0.8) 0.9 6.5 5.4
Mingfa 0846.HK 1,729 2.20 0.94 (57.3) Not rated Dec 6.8 12.4 1.5 1.3 3.7 (3.5) 4.8 10.0 4.8
Miramar 0071.HK 692 9.30 23.78 155.7 Not rated Dec 4.0 3.6 0.5 0.5 12.2 4.2 4.5 9.2 14.7
Mongolia Energy 0276.HK 261 0.30 1.15 283.4 Not rated Mar (0.5) (1.4) n.a. 0.2 (402.1) (409.6) (1.6) (15.5) (31.8)
Nagacorp 3918.HK 1,179 4.39 4.44 1.2 Not rated Dec 12.8 11.3 3.3 3.0 24.2 15.8 12.6 10.0 38.1
Natural Beauty 0157.HK 253 0.98 0.61 (37.8) Not rated Dec 16.9 16.7 2.5 2.6 15.9 7.3 (6.7) (15.5) (22.8)
New World Dept. St. China 0825.HK 915 4.21 2.75 (34.7) Not rated Jun 9.9 9.8 1.4 1.2 5.4 (2.1) 0.5 0.5 (3.0)
Nex t Media 0282.HK 212 0.68 0.42 (38.6) Not rated Mar n.a. (2.0) n.a. 0.5 (20.3) (28.9) 3.0 41.7 23.6
Oriental Press 0018.HK 244 0.79 0.70 (11.9) Not rated Mar n.a. 23.4 n.a. 0.6 1.5 (7.3) 0.0 0.0 (13.2)
Oriental Watch 0398.HK 175 2.38 2.32 (2.4) Not rated Mar 7.4 6.8 0.7 0.6 6.4 (2.1) 4.8 (1.7) 6.2
Calendarized Calendarized Share price performance
P/E (x) P/B (x) HK$ term (%)
* Include the Hong Kong Industrial, consumer and media companies covered by Credit Suisse, and small-cap stocks in HOLT® database with market cap between US$150 mn and US$2 bn.
For stocks that are Not Rated, I/B/E/S consensus forecast are used. CFROI® is a registered trademark in the United States and other countries (excluding the United Kingdom) of Credit
Suisse or its subsidiaries or affiliates.
* Companies in bold and italic indicate constituents of Credit Suisse Hong Kong Small Cap Index

14 S
epte
mber 2
012
David
& G
olia
th
16
Valuations of Credit Suisse HK small-cap watch list*
Market CS target/ Potential Credit Year HOLT CFROI
Cap Price HOLT warranted return Suisse end CFROI Spread
Company RIC (US$ mn) (HK$) price (HK$) (%) Rating month 2011 2012 2011 2012 (%) (%) 1W 1M 3M
Pacific Andes 1174.HK 225 0.37 0.25 (32.7) Not rated Sep 4.1 6.9 0.2 0.3 6.5 (1.6) 1.4 (11.9) (21.3)
Pacific Basin 2343.HK 959 3.84 3.40 (11.5) UNDERPERFORM Dec 16.6 30.1 0.6 0.7 2.8 (4.6) 19.3 6.7 12.6
Pacific Textiles 1382.HK 926 5.01 5.60 11.8 OUTPERFORM Mar 8.1 9.3 1.8 1.8 12.8 4.8 1.8 (9.7) (10.1)
Paliburg 0617.HK 359 2.48 41.41 1,569.8 Not rated Dec 1.9 1.2 0.3 0.2 8.1 (0.5) 0.8 5.5 6.4
Phoenix Satellite 2008.HK 1,481 2.30 2.12 (7.8) Not rated Dec (171.6) 12.8 3.2 2.9 11.4 4.1 2.2 1.3 10.6
Pico Far East 0752.HK 276 1.76 1.76 (0.0) Not rated Oct 8.4 7.5 1.6 1.9 12.5 3.5 0.0 0.6 (4.3)
Polytec Asset 0208.HK 401 0.70 1.66 137.2 Not rated Dec 15.2 20.6 0.3 0.3 (1.7) (11.1) 1.4 (4.1) (7.9)
Pou Sheng 3813.HK 264 0.48 1.01 110.4 Not rated Sep 5.8 8.3 0.3 0.4 7.7 (0.4) (5.9) (15.8) (23.8)
Public Financial 0626.HK 496 3.50 2.47 (29.5) Not rated Dec 10.3 11.5 0.6 0.6 5.3 (4.0) 9.4 9.4 14.0
Regal Hotels 0078.HK 404 3.25 7.40 127.6 Not rated Dec 29.5 3.2 0.3 0.3 0.1 (8.2) 3.8 6.2 10.9
Regal REIT 1881.HK 819 1.95 1.91 (2.1) Not rated Dec 2.1 15.4 0.5 0.5 4.8 (2.9) (4.4) 1.0 14.0
RexLot 0555.HK 549 0.50 0.99 98.5 Not rated Dec 5.4 4.8 0.9 0.7 23.8 15.7 0.0 7.5 (16.7)
Road King Infra. 1098.HK 507 5.30 7.88 48.7 Not rated Dec 4.8 5.5 0.4 0.3 3.3 (6.1) 2.7 2.1 10.4
Royale Furniture 1198.HK 85 0.86 0.86 (0.3) Not rated Dec 2.8 3.0 0.5 0.4 10.0 1.1 10.3 (16.5) (46.9)
Sa Sa 0178.HK 1,794 4.93 5.00 1.4 OUTPERFORM Mar 21.5 17.3 8.9 7.4 15.2 7.9 0.4 5.8 19.1
SCMP 0583.HK 302 1.50 1.49 (0.8) Not rated Dec 6.3 12.3 0.9 0.8 4.6 (4.1) 1.4 4.9 4.9
Shui On Con. & Mats. 0983.HK 455 7.17 5.10 (28.9) Not rated Dec 3.9 27.8 0.4 0.3 1.9 (6.1) 1.1 (4.4) (7.1)
Shun Tak 0242.HK 1,105 2.87 4.13 43.9 OUTPERFORM Dec 8.0 16.4 0.4 0.5 1.7 (5.8) 2.5 3.2 1.8
Singamas Container 0716.HK 562 1.80 1.53 (14.9) Not rated Dec 4.0 7.3 1.0 0.8 13.1 5.2 7.1 4.7 (10.0)
Sino Hotels 1221.HK 298 2.48 3.58 44.5 Not rated Jun n.a. 11.9 n.a. 0.7 1.3 (7.5) 1.6 (0.8) 2.5
Sinofert 0297.HK 1,332 1.47 2.16 47.1 Not rated Dec 12.4 10.5 0.6 0.7 7.3 0.4 3.5 (8.7) 19.5
Sitoy 1023.HK 452 3.50 3.53 0.8 Not rated Jun n.a. 10.2 n.a. 3.2 40.8 34.2 0.3 7.7 0.6
Southgobi Resources 1878.HK 413 17.62 19.27 9.4 Not rated Dec 6.7 (16.8) 0.6 0.5 (0.8) (8.1) 3.3 (43.3) (55.8)
Stelux 0084.HK 201 1.49 0.98 (34.5) Not rated Mar 8.0 5.5 1.5 1.3 5.6 (3.4) (0.7) (6.3) (1.8)
Sun Hung Kai & Co. 0086.HK 995 3.62 4.92 36.0 Not rated Dec 7.4 6.7 0.6 0.6 6.4 (2.7) 0.3 (1.4) (8.4)
Sunev ision 8008.HK 491 1.64 1.58 (3.5) Not rated Jun 23.0 12.6 n.a. 1.3 8.5 (0.4) 1.2 9.3 42.6
Sunlight REIT 0435.HK 654 3.16 2.73 (13.7) Not rated Jun 5.5 4.8 0.6 0.6 5.6 (2.6) 0.6 8.2 26.4
Tan Chong 0693.HK 527 2.03 2.57 26.5 Not rated Dec 6.8 7.1 0.5 0.5 4.2 (4.1) 2.0 1.0 2.0
Tao Heung 0573.HK 553 4.20 2.31 (45.1) Not rated Dec 16.7 15.1 3.1 2.8 7.8 (0.7) 0.2 6.6 8.0
Techtronic 0669.HK 2,981 12.68 9.65 (23.9) NEUTRAL Dec 17.4 14.7 2.1 1.9 8.4 1.2 3.3 21.9 35.3
Calendarized Calendarized Share price performance
P/E (x) P/B (x) HK$ term (%)
* Include the Hong Kong Industrial, consumer and media companies covered by Credit Suisse, and small-cap stocks in HOLT® database with market cap between US$150 mn and US$2 bn.
For stocks that are Not Rated, I/B/E/S consensus forecast are used. CFROI® is a registered trademark in the United States and other countries (excluding the United Kingdom) of Credit
Suisse or its subsidiaries or affiliates.
* Companies in bold and italic indicate constituents of Credit Suisse Hong Kong Small Cap Index

14 S
epte
mber 2
012
David
& G
olia
th
17
Valuations of Credit Suisse HK small-cap watch list*
Market CS target/ Potential Credit Year HOLT CFROI
Cap Price HOLT warranted return Suisse end CFROI Spread
Company RIC (US$ mn) (HK$) price (HK$) (%) Rating month 2011 2012 2011 2012 (%) (%) 1W 1M 3M
Texwinca 0321.HK 937 5.33 5.50 3.2 NEUTRAL Mar 7.4 10.4 1.3 1.3 3.8 (3.4) (0.2) (24.8) (38.7)
Tian Teck Land 0266.HK 425 6.95 6.34 (8.8) Not rated Mar n.a. 24.4 n.a. 0.6 2.7 (5.9) (0.7) 2.2 8.6
Titan Petrochemicals 1192.HK 248 0.25 -0.23 (193.1) Not rated Dec (2.4) (2.8) 4.1 4.1 (5.3) (13.4) 0.0 0.0 13.9
TOM 2383.HK 412 0.82 -0.35 (142.6) Not rated Dec (6.4) (10.7) 2.8 3.2 (3.3) (11.5) (3.5) 6.5 22.4
Tomson Group 0258.HK 315 1.70 3.05 79.2 Not rated Dec 157.4 18.1 0.2 0.2 3.2 (5.0) 0.0 1.2 10.4
Tongda 0698.HK 172 0.28 0.55 97.0 Not rated Dec 5.2 4.2 0.7 0.6 10.5 1.4 1.8 (3.4) (3.4)
Towngas China 1083.HK 1,904 6.00 3.18 (47.1) Not rated Dec 20.8 18.5 1.5 1.5 7.2 (0.2) (0.5) 4.9 8.7
TPV 0903.HK 478 1.58 1.60 1.5 Not rated Dec 4.0 5.1 0.3 0.3 5.4 (2.2) 9.0 3.9 (6.0)
Transport Int'l 0062.HK 785 15.08 15.45 2.5 Not rated Dec 25.1 18.2 0.9 0.9 (0.5) (8.2) 0.7 0.0 7.4
Trinity 0891.HK 1,174 5.30 3.02 (42.9) Not rated Dec 17.5 16.1 2.8 2.8 14.3 6.8 4.5 (3.5) (9.1)
Truly 0732.HK 375 1.05 0.98 (6.7) UNDERPERFORM Dec 8.3 6.4 0.7 0.6 5.6 (1.5) 0.0 (3.7) (7.9)
United Energy 0467.HK 1,933 1.15 0.68 (40.8) Not rated Dec 27.6 23.5 2.6 2.4 2.3 (4.9) 0.0 (3.4) (5.0)
United Labs 3933.HK 799 3.81 1.53 (59.8) Not rated Dec 51.9 24.6 1.0 0.9 0.7 (6.6) 3.3 3.3 17.2
Value Partners 0806.HK 776 3.43 1.35 (60.8) Not rated Dec 36.1 29.8 2.6 2.1 2.5 (6.7) 3.3 (0.3) (6.0)
Varitronix 0710.HK 111 2.66 3.65 37.2 OUTPERFORM Dec 5.1 4.6 0.6 0.6 5.6 (3.6) 0.0 0.4 (16.4)
Victory City 0539.HK 156 0.78 1.24 59.1 Not rated Mar n.a. 4.1 n.a. 0.3 3.3 (5.4) 2.6 2.6 (1.3)
Vitasoy 0345.HK 919 6.97 3.78 (45.7) Not rated Mar 25.3 22.1 4.8 4.5 9.4 1.4 4.8 3.9 11.5
VST 0856.HK 235 1.47 1.94 32.1 Not rated Dec 4.0 3.7 0.7 0.6 10.3 1.7 1.4 14.0 2.8
VTech 0303.HK 3,037 94.05 84.00 (10.7) NEUTRAL Mar 15.5 14.5 5.5 5.3 14.2 7.1 (1.7) 2.3 5.6
Wing On 0289.HK 697 18.30 29.41 60.7 Not rated Dec 3.0 8.9 0.5 0.5 3.4 (4.8) 0.5 7.6 13.2
Wing Tai Properties 0369.HK 813 4.73 7.46 57.8 Not rated Dec 2.8 10.7 0.5 0.5 0.9 (8.5) 2.8 7.0 22.9
Winsor Properties 1036.HK 591 17.64 35.22 99.7 Not rated Dec 7.7 4.6 0.4 0.4 5.1 (3.1) 7.4 37.8 116.1
YGM Trading 0375.HK 374 17.48 11.28 (35.4) Not rated Mar 5.2 7.9 n.a. 1.3 8.3 (0.1) 3.1 2.8 (6.5)
Yip's Chemical 0408.HK 369 5.10 2.79 (45.3) Not rated Dec 14.0 11.4 1.1 1.0 4.2 (3.9) 4.1 0.8 2.0
Yue Yuen 0551.HK 5,231 24.60 25.70 4.5 NEUTRAL Sep 12.6 10.5 1.4 1.3 7.7 1.2 0.6 6.5 (0.2)
Calendarized Calendarized Share price performance
P/E (x) P/B (x) HK$ term (%)
* Include the Hong Kong Industrial, consumer and media companies covered by Credit Suisse, and small-cap stocks in HOLT® database with market cap between US$150 mn and US$2 bn.
For stocks that are Not Rated, I/B/E/S consensus forecast are used. CFROI® is a registered trademark in the United States and other countries (excluding the United Kingdom) of Credit
Suisse or its subsidiaries or affiliates.
* Companies in bold and italic indicate constituents of Credit Suisse Hong Kong Small Cap Index

14 S
epte
mber 2
012
David
& G
olia
th
18
Hong Kong – Screening Absolute price performance - top & bottom 10 companies Absolute price performance - top & bottom 10 companies Absolute price performance - top & bottom 10 companies
Price 1W return Price 1M return Price 3M return Company RIC (HK$) (%) Company RIC (HK$) (%) Company RIC (HK$) (%)
Winners Winners Winners Hi Sun Tech. (China) 0818.HK 0.81 47.3 Chaoyue 0147.HK 0.50 63.9 Chaoyue 0147.HK 0.50 185.7 Comba Telecom Sys. 2342.HK 2.36 22.9 Next Media 0282.HK 0.68 41.7 Winsor Properties 1036.HK 17.64 116.1 Pacific Basin 2343.HK 3.84 19.3 Comba Telecom Sys. 2342.HK 2.36 38.8 Ju Teng 3336.HK 3.49 90.7 Kingston Financial 1031.HK 0.58 13.7 Winsor Properties 1036.HK 17.64 37.8 CK Life Sciences 0775.HK 0.62 51.2 Nagacorp 3918.HK 4.39 12.6 Techtronic 0669.HK 12.68 21.9 Lee's Pharma. 0950.HK 5.08 50.3 Luk Fook 0590.HK 22.45 12.3 Kosmopolito Hotels 2266.HK 1.89 21.2 Luk Fook 0590.HK 22.45 47.7 Man Wah 1999.HK 3.35 10.9 K. Wah Int'l 0173.HK 3.44 20.3 Sunevision 8008.HK 1.64 42.6 Royale Furniture 1198.HK 0.86 10.3 Man Wah 1999.HK 3.35 20.1 Media Chinese 0685.HK 3.69 40.3 Emperor Entertainment 0296.HK 1.54 10.0 Ju Teng 3336.HK 3.49 19.1 Kosmopolito Hotels 2266.HK 1.89 40.0 Chow Sang Sang 0116.HK 17.06 9.8 CK Life Sciences 0775.HK 0.62 17.0 Nagacorp 3918.HK 4.39 38.1 Losers Losers Losers Chaoyue 0147.HK 0.50 (27.5) Southgobi Resources 1878.HK 17.62 (43.3) Southgobi Resources 1878.HK 17.62 (55.8) Chevalier 0025.HK 9.30 (7.0) AMVIG 2300.HK 2.50 (27.1) City Telecom (HK) 1137.HK 1.99 (54.5) Natural Beauty 0157.HK 0.98 (6.7) Kingston Financial 1031.HK 0.58 (26.6) Royale Furniture 1198.HK 0.86 (46.9) Pou Sheng 3813.HK 0.48 (5.9) Texwinca 0321.HK 5.33 (24.8) Texwinca 0321.HK 5.33 (38.7) I.T. 0999.HK 3.31 (5.7) IRC 1029.HK 0.57 (18.6) IRC 1029.HK 0.57 (33.7) AEON Stores 0984.HK 21.00 (4.5) Royale Furniture 1198.HK 0.86 (16.5) Mongolia Energy 0276.HK 0.30 (31.8) Regal REIT 1881.HK 1.95 (4.4) Pou Sheng 3813.HK 0.48 (15.8) Comba Telecom Sys. 2342.HK 2.36 (30.0) TOM 2383.HK 0.82 (3.5) Natural Beauty 0157.HK 0.98 (15.5) Alco Holdings 0328.HK 1.64 (27.1) Huabao 0336.HK 4.20 (2.8) Mongolia Energy 0276.HK 0.30 (15.5) Pou Sheng 3813.HK 0.48 (23.8) Hutchison Telecom HK 0215.HK 3.45 (2.3) G-Resources 1051.HK 0.39 (14.4) Honbridge 8137.HK 0.59 (23.4)
Price-to-earnings - most & least expensive 10 companies Price-to-book - most & least expensive 10 companies CFROI® Spread - top & bottom 10 companies
Price 12 P/E Price 12 P/B Price CFROI® Spread Company RIC (HK$) (x) Company RIC (HK$) (x) Company RIC (HK$) (%)
Winners Winners Winners Paliburg 0617.HK 2.48 1.2 Lippo 0226.HK 3.24 0.2 Sitoy 1023.HK 3.50 34.2 Apollo Solar Energy 0566.HK 0.21 1.9 Paliburg 0617.HK 2.48 0.2 Huabao 0336.HK 4.20 27.3 HongKong Chinese 0655.HK 1.16 2.2 Tomson Group 0258.HK 1.70 0.2 Apollo Solar Energy 0566.HK 0.21 22.4 K. Wah Int'l 0173.HK 3.44 3.0 HongKong Chinese 0655.HK 1.16 0.2 Lee's Pharma. 0950.HK 5.08 18.2 Royale Furniture 1198.HK 0.86 3.0 Mongolia Energy 0276.HK 0.30 0.2 Nagacorp 3918.HK 4.39 15.8 Regal Hotels 0078.HK 3.25 3.2 Allied Group 0373.HK 17.92 0.2 RexLot 0555.HK 0.50 15.7 Allied Properties 0056.HK 0.97 3.2 Apollo Solar Energy 0566.HK 0.21 0.3 ASM Pacific 0522.HK 92.00 15.0 Miramar 0071.HK 9.30 3.6 TPV 0903.HK 1.58 0.3 Epro 8086.HK 0.72 9.9 VST 0856.HK 1.47 3.7 Victory City 0539.HK 0.78 0.3 Luk Fook 0590.HK 22.45 9.9 Lippo 0226.HK 3.24 4.1 HKC 0190.HK 0.30 0.3 Emperor Entertainment 0296.HK 1.54 9.7 Losers Losers Losers Honbridge 8137.HK 0.59 214.2 Epro 8086.HK 0.72 10.5 Mongolia Energy 0276.HK 0.30 (409.6) Hutchison Harbour Ring 0715.HK 0.66 65.1 Bonjour 0653.HK 1.02 10.0 Chaoyue 0147.HK 0.50 (56.5) Epro 8086.HK 0.72 39.0 Sa Sa 0178.HK 4.93 7.4 Next Media 0282.HK 0.68 (28.9) Comba Telecom Sys. 2342.HK 2.36 37.3 Honbridge 8137.HK 0.59 6.6 G-Resources 1051.HK 0.39 (21.1) ERA Mining 8043.HK 0.87 34.8 VTech 0303.HK 94.05 5.3 Hi Sun Tech. (China) 0818.HK 0.81 (17.1) CK Life Sciences 0775.HK 0.62 34.0 ASM Pacific 0522.HK 92.00 5.0 Asia Financial 0662.HK 2.94 (14.3) HK & S Hotels 0045.HK 9.25 32.5 Lee's Pharma. 0950.HK 5.08 4.6 Titan Petrochemicals 1192.HK 0.25 (13.4) Pacific Basin 2343.HK 3.84 30.1 Vitasoy 0345.HK 6.97 4.5 Cross-Harbour 0032.HK 6.33 (13.1) Value Partners 0806.HK 3.43 29.8 Titan Petrochemicals 1192.HK 0.25 4.1 Melco 0200.HK 6.40 (11.7) Shui On Con. & Mats. 0983.HK 7.17 27.8 Fairwood 0052.HK 17.12 4.0 TOM 2383.HK 0.82 (11.5)
* For stocks that are not rated, I/B/E/S consensus forecast numbers are used. CFROI® Spread is the difference between CFROI® and market implied discount rate. A larger number indicates
that more value is created by a company

14 September 2012
David & Goliath 19
China – Street talk * Central China Real Estate (0832.HK, HK$1.89, NR) contracted sales drop by 35% YoY. Central China Real Estate, a Henan Province-based and Hong Kong-listed property developer, announced that its contracted sales in Aug sat at Rmb978 mn, up 22% MoM but down 35% YoY. In the month its property contracted sales area decreased 14% MoM and 36% YoY to 165,345 sqm. In the first eight months of this year the company's contracted sales totalled Rmb6.9 bn, up 8% YoY and accounting for 77% of its sales target of Rmb9 bn. Meanwhile, its contracted sales area hit 1.07 mn sqm, up 3% YoY. (10-Sep)
70
80
90
100
110
120
09/11 12/11 03/12 06/12 09/12
Central China Real Estate MSCI China
China Molybdenum (3993.HK, HK$3.43, NR) receives formal written approval from CSRC. China Molybdenum announced that it received the formal written approval from the CSRC for the A share issue on 7 Sep. The A share issue will comprise the allotment and issue of not more than 542,000,000 A shares to qualified public investors. (10-Sep)
50
65
80
95
110
09/11 12/11 03/12 06/12 09/12
China Molybdenum MSCI China
SMIC (0981.HK, HK$.30, N [V], TP HK$.41) revenue increases SMIC has reported that revenues for 2Q12 climbed 27% QoQ and 20% YoY to a record US$422 mn. SMIC credited the positive sales performance to rising sales generated from its 65nm/55nm process technologies, and specialty processes for the manufacture of power management ICs, EEPROM and others. (12-Sep)
40
60
80
100
120
09/11 12/11 03/12 06/12 09/12
SMIC MSCI China
China Tianyi (0756.HK, HK$1.18, NR) net profit climbs 63%. China Tianyi registered a profit attributable to owners of Rmb250 mn for the year ended Jun 2012, jumping approximately 63%. The firm did not declare the payment of a final dividend to shareholders in respect of the year. (13-Sep)
50
65
80
95
110
09/11 12/11 03/12 06/12 09/12
China Tianyi Holdings MSCI China
*Source: China Press Digest, CIS, DataStream

14 September 2012
David & Goliath 20
China – Company updates Green Dragon Gas (GDG.L, $4.10, O [V], TP $11.70) Lonking (3339.HK, HK$1.34, N [V], TP HK$1.80)
New report: Darkest before dawn
■ 1H12 results—still loss making: With no major production gain,
the first-half loss was unsurprising, but all eyes likely turn to the
balance sheet—to see that near cash (cash + ‘other financial
assets’) reduced by US$56 mn in the half to US$80 mn.
■ Production update I—more wells drilled: GDG recorded 8,789
metres of in-seam drilling in 1H12; we assume that eight lateral
wells were drilled in the half.
■ Production update II—exit production waiting to ramp: We
update our drill-up/production forecasts—now exiting 2012 at
2.1Bcf, and reaching 18Bcf in 3Q14, assuming additional funding
is introduced on a timely basis.
■ Reiterate OUTPERFORM, new TP at $11.7/share: A recent site
visit confirmed a significant increase in on-site activity; however,
GDG has slipped from our earlier growth forecast. We update our
drill-up/production model, but retain our valuation methodology
i.e. de-risking our GSS DCF forecast via a percentage of total
wells drilled. Our new TP is arrived at US$11.7/sh (from
US$15.1/sh) and we retain our OUTPERFORM rating.
Comment on August sales
■ Lonking released its August sales on 11 September. Wheel
loader sales at 1,810 units, fell 25.4% YoY, moderating from 37%
YoY decline in July and largely within expectations. Sequentially,
unit sales grew by 4% MoM. We estimate Lonking’s market share
will remain below 15%, declining from above 18% in 2011.
■ The company’s excavator sales were stronger than expected.
Excavator sales in August were at 242 units, recording a 14.7%
YoY increase. Sequentially, sales rose 18.6% MoM (versus 17%
MoM decline in August last year), driven by higher exports (44
units versus 12 units in July). Domestic unit sales grew modestly
by 3% MoM. Lonking’s market share in excavator market is
showing solid improvement: from low of 2.5% in 1Q12 to 3.8% in
August.
■ Trading at 0.7x P/B with overhang from convertible bond
redemption removed coupled with prudent risk management, we
believe Lonking’s shares are cheap.
■ But the stock could face further earnings cuts and re-rating
requires improvement in industry fundamentals, which is not yet
within sight. We maintain our NEUTRAL rating on the stock.
Bbg/RIC 4.15
11.70 (15.10)
136.54 182
0.0
0.1
Free float (%) 35 Performance 1M 3M 12M
Absolute (%) (19.4) (30.6) (50.8)
Relativ e (%) (15.7) (29.7) (48.3)
Year 12/10A 12/11A 12/12E 12/13E 12/14E
49.7 75.2 80.7 154.4 228.9
1.3 -13.0 -4.9 2.9 44.9
-13.2 -27.6 -15.1 -16.9 11.6
(0.11) (0.20) (0.11) (0.12) 0.08
n.a. n.a. n.m n.m (87)
n.a. n.a. 0.03 0.15 1.14
n.m. n.m. n.m. n.m. n.m.
n.m. n.m. n.m. n.m. 48.9
0.0 0.0 0.0 0.0 0.0
401.7 -42.8 -122.2 254.7 18.9
0.8 0.9 0.9 0.9 0.9
-2.2 -4.2 -2.4 -2.7 1.9
-8.2 -1.3 4.1 29.3 44.1
10.13 - 3.70
566.5
ROE (%)
Note1: Green Dragon Gas (GDG) is the largest independent CBM producer in China. GDG holds 6 PSCs in China on its upstream side, owns its
transportation fleet and pipelines in midstream distribution, and sells its gas through CNG stations on its downstream side.
Mkt cap (US$ mn)Daily trad v al - 6m av g (US$ mn)
Major shareholders Randeep Grew al 64%
Net debt(cash)/equity (%)
Rev enue (US$ mn)
52-w k range (US$)
GDG LN / GDG.L
O (O) [V]
Daily trad v ol - 6m av g (mn)
Rating (prev. rating)
Shares outstanding (mn)
Price (10 Sep 12 , US$)
TP (prev. TP US$)
Est. pot. % chg. to TP
EBITDA (US$ mn)
Net profit (US$ mn)
EPS (US$)
- Change from prev . EPS (%)
- Consensus EPS (US$)
EPS grow th (%)
P/E (x )
Div idend y ield (%)
EV/EBITDA (x )
P/B (x )
Bbg/RIC 1.30
1.80 (1.80)
4,280.10 38
20.6
4.6
Free float (%) 39.3 Performance 1M 3M 12M
Absolute (%) (17.2) (35.6) (57.1)
Relativ e (%) (13.4) (34.7) (54.6)
Year 12/10A 12/11A 12/12E 12/13E 12/14E
12,020 12,721 9,472 10,551 10,551
2,560 2,358 1,410 1,628 2,166
1,766 1,730 544 738 1,191
0.41 0.40 0.13 0.17 0.28
n.a. n.a. 0 0 0
n.a. n.a. 0.19 0.23 0.27
120.7 -2.0 -68.5 35.6 61.4
2.6 2.6 8.4 6.2 3.8
2.9 7.8 13.3 4.2 5.7
2.9 3.5 5.1 4.2 2.7
0.9 0.7 0.7 0.7 0.6
39.1 29.7 8.5 11.1 16.2
55.5 57.4 42.6 32.3 15.8
3.50 - 1.01
5,564.1/ 717.6
ROE (%)
Note1:ORD/ADR=50.00.Note2:Lonking Holdings Limited is engaged in the manufacture and distribution of wheel loaders, road rollers, excavators, fork lifts,
and other infrastructure machinery and the provision of finance lease for the infrastructure machinery..
Mkt cap (HK$/US$ mn)Daily trad v al - 6m av g (US$ mn)
Major shareholders China Longgong (30.66%)
Net debt(cash)/equity (%)
Rev enue (Rmb mn)
52-w k range (HK$)
3339 HK / 3339.HK
N (N) [V]
Daily trad v ol - 6m av g (mn)
Rating (prev. rating)
Shares outstanding (mn)
Price (11 Sep 12 , HK$)
TP (prev. TP HK$)
Est. pot. % chg. to TP
EBITDA (Rmb mn)
Net profit (Rmb mn)
EPS (Rmb)
- Change from prev . EPS (%)
- Consensus EPS (Rmb)
EPS grow th (%)
P/E (x )
Div idend y ield (%)
EV/EBITDA (x )
P/B (x )
Price performance vs. MSCI China Price performance vs. MSCI China
40
60
80
100
120
09/11 11/11 01/12 03/12 05/12 07/12 09/12
Green Dragon Gas MSCI China
30
50
70
90
110
09/11 11/11 01/12 03/12 05/12 07/12 09/12
Lonking MSCI China
David Hewitt / Research Analyst / +65 6212 3064 /
Extracted from The Asian Daily 12 Sep 2012
Yang Y. Song / Research Analyst / 852 2101 6550 /
Extracted from The Asian Daily 12 Sep 2012

14 S
ep
tem
ber 2
01
2
David
& G
olia
th
21
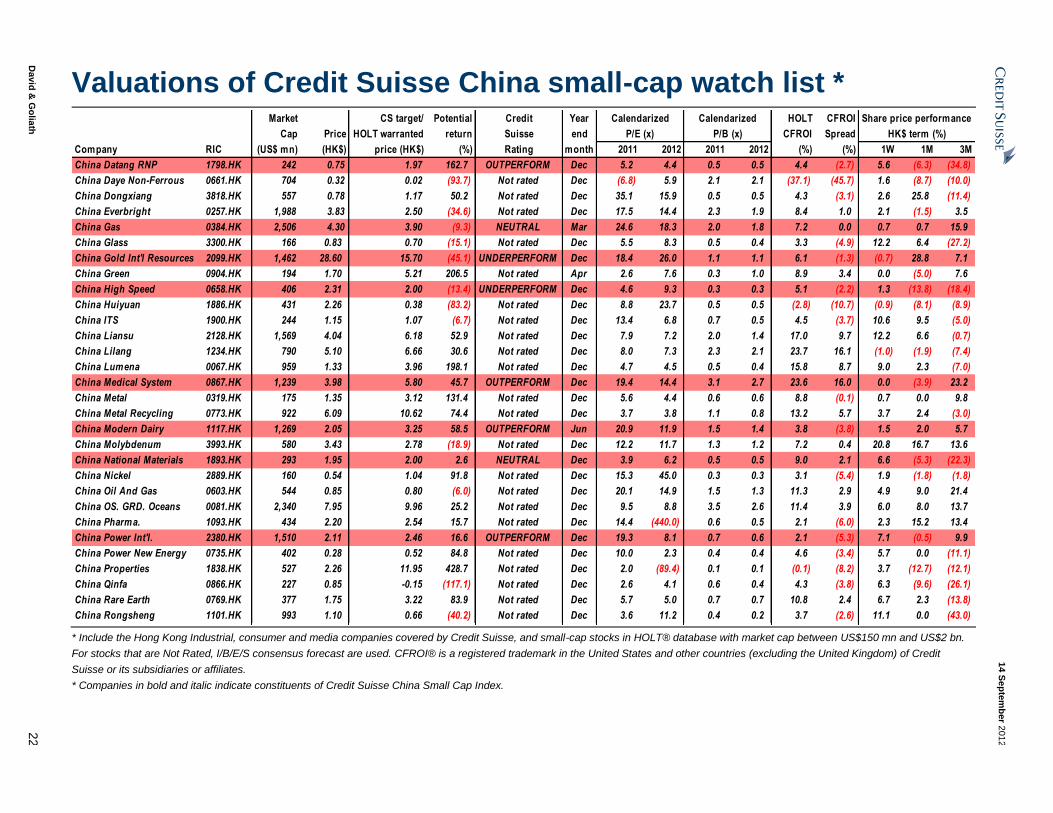
Valuations of Credit Suisse China small-cap watch list*
Market CS target/ Potential Credit Year HOLT CFROI
Cap Price HOLT warranted return Suisse end CFROI Spread
Company RIC (US$ mn) (HK$) price (HK$) (%) Rating month 2011 2012 2011 2012 (%) (%) 1W 1M 3M
361 Degrees 1361.HK 531 1.99 3.20 60.8 Not rated Jun n.a. 3.3 n.a. 0.7 24.6 16.8 5.9 2.1 1.0
Ajisen 0538.HK 735 5.31 6.16 15.9 NEUTRAL Dec 17.4 43.1 1.9 1.9 4.8 (2.5) 12.0 (0.4) (6.8)
Anhui Expressway 0995.HK 210 3.31 4.88 47.5 Not rated Dec 5.3 5.7 0.7 0.6 7.0 (1.6) 0.9 (6.5) (3.5)
Anta Sports 2020.HK 1,772 5.51 5.20 (5.6) NEUTRAL Dec 6.5 7.9 1.8 1.6 22.9 16.0 16.0 21.1 (7.6)
Anton Oilfield 3337.HK 530 1.94 1.13 (41.9) Not rated Dec 43.0 19.3 2.0 1.8 6.2 (2.4) 5.4 31.1 67.2
Asia Cement (China) 0743.HK 620 3.09 3.24 4.8 Not rated Dec 2.9 10.3 0.5 0.4 9.1 1.5 5.5 1.6 (9.4)
Asian Citrus 0073.HK 579 3.68 7.37 100.2 Not rated Jun 3.4 3.9 0.6 0.5 14.4 6.5 6.4 (3.2) (11.5)
AviChina Ind.& Tech. 2357.HK 924 3.04 1.90 (37.4) Not rated Dec 30.3 23.7 1.8 1.7 4.9 (2.2) 9.4 18.8 7.8
Baoxin Auto 1293.HK 1,200 3.68 4.51 22.6 Not rated Dec 11.1 7.2 2.5 1.4 11.3 4.2 (1.9) 1.1 (30.7)
Baoye 2355.HK 171 4.25 11.32 166.4 Not rated Dec 3.2 2.9 0.5 0.5 10.6 2.2 3.9 8.7 6.5
Bawang 1338.HK 225 0.60 0.28 (52.7) Not rated Dec (2.6) (8.3) 1.4 1.4 (63.7) (71.9) 3.4 7.1 (4.8)
Beijing Capital Land 2868.HK 290 2.20 1.23 (44.0) Not rated Dec 3.8 3.3 0.6 0.6 5.3 (2.6) 12.8 (10.2) (1.3)
Beijing Enterprises Water 0371.HK 521 1.72 0.40 (76.9) Not rated Dec 19.2 14.3 1.7 1.3 5.9 (1.3) 11.0 11.7 14.7
Beijing Jingkelong 0814.HK 88 3.74 1.39 (63.0) Not rated Dec 6.0 6.3 0.8 0.7 5.6 (2.6) (0.8) (25.3) (31.0)
Beijing Jingneng 0579.HK 355 1.68 1.28 (23.6) Not rated Dec 8.6 8.9 0.9 1.0 5.5 (1.1) 3.1 (6.1) 0.0
Besunyen 0926.HK 126 0.62 0.82 32.2 Not rated Dec (25.4) (29.9) 0.5 0.4 (1.8) (10.3) 0.0 (6.1) (21.5)
Billion Industiral 2299.HK 1,263 4.26 6.29 47.7 Not rated Dec 8.1 8.1 1.6 1.4 14.6 8.0 4.4 3.1 2.7
Biostime Intl 1112.HK 1,627 20.95 15.80 (24.6) Not rated Dec 19.5 15.2 5.2 4.4 22.1 14.3 5.9 15.4 12.6
Boshiwa 1698.HK 450 1.68 2.50 48.8 NEUTRAL Dec 9.1 6.5 0.9 0.8 7.5 2.6 0.0 0.0 0.0
Bosideng 3998.HK 2,375 2.30 1.98 (13.9) Not rated Mar 10.6 10.4 2.1 1.9 13.0 6.0 5.5 1.8 28.5
BYD Electronic 0285.HK 462 1.59 4.40 176.4 Not rated Dec 4.8 5.0 0.4 0.3 4.4 (3.4) 8.2 (1.9) (17.6)
Catic Shenzhen 0161.HK 96 2.69 2.16 (19.6) Not rated Dec 7.0 6.5 0.6 0.6 5.5 (3.0) 9.8 (6.3) (5.6)
Central China Real Estate 0832.HK 592 1.89 6.50 243.7 Not rated Dec 4.6 4.4 0.8 0.8 14.9 6.9 6.2 (5.5) 1.6
Chaowei Power 0951.HK 572 4.41 12.29 178.6 Not rated Dec 8.0 6.5 2.1 1.5 20.1 11.8 4.3 (4.1) 13.7
Chigo 0449.HK 186 0.17 0.19 9.0 Not rated Dec (8.4) 3.7 0.5 0.4 0.8 (7.2) 1.8 (13.6) (18.2)
Chiho-Tiande 0976.HK 524 3.89 1.70 (56.2) Not rated Dec 25.9 21.0 2.0 1.3 4.8 (3.1) 0.0 (1.5) (6.3)
China Aerospace 0031.HK 215 0.54 0.59 9.3 Not rated Dec 4.1 12.4 0.4 0.4 2.9 (5.8) 1.9 (5.3) (11.5)
China All Access 0633.HK 185 1.18 2.48 109.9 Not rated Dec 5.6 4.4 0.9 0.8 13.4 4.6 0.0 (22.9) (18.1)
China Aoyuan 3883.HK 327 0.97 0.77 (20.7) Not rated Dec 4.6 6.0 0.3 0.3 3.5 (4.7) 5.4 (3.0) (4.9)
China Automation 0569.HK 222 1.68 1.83 9.0 Not rated Dec 7.1 6.5 0.8 0.7 11.1 3.0 14.3 17.5 (15.2)
Share price performance
HK$ term (%)P/B (x)P/E (x)
CalendarizedCalendarized
* Include the China Industrial, consumer and media companies covered by Credit Suisse, and small-cap stocks in HOLT® database with market cap between US$150 mn and US$2 bn. For
stocks that are Not Rated, I/B/E/S consensus forecast are used. CFROI® is a registered trademark in the United States and other countries (excluding the United Kingdom) of Credit Suisse or
its subsidiaries or affiliates.
* Companies in bold and italic indicate constituents of Credit Suisse China Small Cap Index.
14 S
ep
tem
ber 2
01
2
David
& G
olia
th
22
Valuations of Credit Suisse China small-cap watch list *
Market CS target/ Potential Credit Year HOLT CFROI
Cap Price HOLT warranted return Suisse end CFROI Spread
Company RIC (US$ mn) (HK$) price (HK$) (%) Rating month 2011 2012 2011 2012 (%) (%) 1W 1M 3M
China Datang RNP 1798.HK 242 0.75 1.97 162.7 OUTPERFORM Dec 5.2 4.4 0.5 0.5 4.4 (2.7) 5.6 (6.3) (34.8)
China Daye Non-Ferrous 0661.HK 704 0.32 0.02 (93.7) Not rated Dec (6.8) 5.9 2.1 2.1 (37.1) (45.7) 1.6 (8.7) (10.0)
China Dongxiang 3818.HK 557 0.78 1.17 50.2 Not rated Dec 35.1 15.9 0.5 0.5 4.3 (3.1) 2.6 25.8 (11.4)
China Everbright 0257.HK 1,988 3.83 2.50 (34.6) Not rated Dec 17.5 14.4 2.3 1.9 8.4 1.0 2.1 (1.5) 3.5
China Gas 0384.HK 2,506 4.30 3.90 (9.3) NEUTRAL Mar 24.6 18.3 2.0 1.8 7.2 0.0 0.7 0.7 15.9
China Glass 3300.HK 166 0.83 0.70 (15.1) Not rated Dec 5.5 8.3 0.5 0.4 3.3 (4.9) 12.2 6.4 (27.2)
China Gold Int'l Resources 2099.HK 1,462 28.60 15.70 (45.1) UNDERPERFORM Dec 18.4 26.0 1.1 1.1 6.1 (1.3) (0.7) 28.8 7.1
China Green 0904.HK 194 1.70 5.21 206.5 Not rated Apr 2.6 7.6 0.3 1.0 8.9 3.4 0.0 (5.0) 7.6
China High Speed 0658.HK 406 2.31 2.00 (13.4) UNDERPERFORM Dec 4.6 9.3 0.3 0.3 5.1 (2.2) 1.3 (13.8) (18.4)
China Huiyuan 1886.HK 431 2.26 0.38 (83.2) Not rated Dec 8.8 23.7 0.5 0.5 (2.8) (10.7) (0.9) (8.1) (8.9)
China ITS 1900.HK 244 1.15 1.07 (6.7) Not rated Dec 13.4 6.8 0.7 0.5 4.5 (3.7) 10.6 9.5 (5.0)
China Liansu 2128.HK 1,569 4.04 6.18 52.9 Not rated Dec 7.9 7.2 2.0 1.4 17.0 9.7 12.2 6.6 (0.7)
China Lilang 1234.HK 790 5.10 6.66 30.6 Not rated Dec 8.0 7.3 2.3 2.1 23.7 16.1 (1.0) (1.9) (7.4)
China Lumena 0067.HK 959 1.33 3.96 198.1 Not rated Dec 4.7 4.5 0.5 0.4 15.8 8.7 9.0 2.3 (7.0)
China Medical System 0867.HK 1,239 3.98 5.80 45.7 OUTPERFORM Dec 19.4 14.4 3.1 2.7 23.6 16.0 0.0 (3.9) 23.2
China Metal 0319.HK 175 1.35 3.12 131.4 Not rated Dec 5.6 4.4 0.6 0.6 8.8 (0.1) 0.7 0.0 9.8
China Metal Recycling 0773.HK 922 6.09 10.62 74.4 Not rated Dec 3.7 3.8 1.1 0.8 13.2 5.7 3.7 2.4 (3.0)
China Modern Dairy 1117.HK 1,269 2.05 3.25 58.5 OUTPERFORM Jun 20.9 11.9 1.5 1.4 3.8 (3.8) 1.5 2.0 5.7
China Molybdenum 3993.HK 580 3.43 2.78 (18.9) Not rated Dec 12.2 11.7 1.3 1.2 7.2 0.4 20.8 16.7 13.6
China National Materials 1893.HK 293 1.95 2.00 2.6 NEUTRAL Dec 3.9 6.2 0.5 0.5 9.0 2.1 6.6 (5.3) (22.3)
China Nickel 2889.HK 160 0.54 1.04 91.8 Not rated Dec 15.3 45.0 0.3 0.3 3.1 (5.4) 1.9 (1.8) (1.8)
China Oil And Gas 0603.HK 544 0.85 0.80 (6.0) Not rated Dec 20.1 14.9 1.5 1.3 11.3 2.9 4.9 9.0 21.4
China OS. GRD. Oceans 0081.HK 2,340 7.95 9.96 25.2 Not rated Dec 9.5 8.8 3.5 2.6 11.4 3.9 6.0 8.0 13.7
China Pharma. 1093.HK 434 2.20 2.54 15.7 Not rated Dec 14.4 (440.0) 0.6 0.5 2.1 (6.0) 2.3 15.2 13.4
China Power Int'l. 2380.HK 1,510 2.11 2.46 16.6 OUTPERFORM Dec 19.3 8.1 0.7 0.6 2.1 (5.3) 7.1 (0.5) 9.9
China Power New Energy 0735.HK 402 0.28 0.52 84.8 Not rated Dec 10.0 2.3 0.4 0.4 4.6 (3.4) 5.7 0.0 (11.1)
China Properties 1838.HK 527 2.26 11.95 428.7 Not rated Dec 2.0 (89.4) 0.1 0.1 (0.1) (8.2) 3.7 (12.7) (12.1)
China Qinfa 0866.HK 227 0.85 -0.15 (117.1) Not rated Dec 2.6 4.1 0.6 0.4 4.3 (3.8) 6.3 (9.6) (26.1)
China Rare Earth 0769.HK 377 1.75 3.22 83.9 Not rated Dec 5.7 5.0 0.7 0.7 10.8 2.4 6.7 2.3 (13.8)
China Rongsheng 1101.HK 993 1.10 0.66 (40.2) Not rated Dec 3.6 11.2 0.4 0.2 3.7 (2.6) 11.1 0.0 (43.0)
Share price performance
HK$ term (%)
Calendarized Calendarized
P/E (x) P/B (x)
* Include the Hong Kong Industrial, consumer and media companies covered by Credit Suisse, and small-cap stocks in HOLT® database with market cap between US$150 mn and US$2 bn.
For stocks that are Not Rated, I/B/E/S consensus forecast are used. CFROI® is a registered trademark in the United States and other countries (excluding the United Kingdom) of Credit
Suisse or its subsidiaries or affiliates.
* Companies in bold and italic indicate constituents of Credit Suisse China Small Cap Index.

14 S
ep
tem
ber 2
01
2
David
& G
olia
th
23
Valuations of Credit Suisse China small-cap watch list *
Market CS target/ Potential Credit Year HOLT CFROI
Cap Price HOLT warranted return Suisse end CFROI Spread
Company RIC (US$ mn) (HK$) price (HK$) (%) Rating month 2011 2012 2011 2012 (%) (%) 1W 1M 3M
China Sanjiang Fine Chems. 2198.HK 269 2.07 1.49 (27.9) Not rated Dec 4.3 4.2 1.1 0.7 12.5 4.0 2.0 10.1 (1.4)
China SCE Property 1966.HK 600 1.63 1.43 (12.5) Not rated Dec 5.3 3.9 0.9 0.7 6.7 (1.2) (3.6) (9.4) (6.9)
China Shanshui Cement 0691.HK 1,587 4.37 4.90 12.1 NEUTRAL Dec 4.5 8.0 1.3 1.2 13.8 6.9 9.0 0.0 (27.5)
China Shineway Pharma. 2877.HK 1,180 11.06 12.44 12.5 Not rated Dec 9.9 10.1 2.0 1.8 16.6 9.2 0.5 (4.7) (3.5)
China Singyes Solar Techs. 0750.HK 277 3.40 3.74 10.0 Not rated Dec 5.9 4.7 1.1 0.9 12.0 3.5 16.8 20.1 6.3
China South City 1668.HK 851 1.09 1.58 44.6 Not rated Mar n.a. 4.6 n.a. 0.4 3.5 (4.1) 2.8 (8.4) 12.4
China Starch 3838.HK 156 0.21 0.41 100.9 Not rated Dec 4.2 3.5 0.6 0.5 9.0 0.1 2.0 (3.8) (14.6)
China Suntien 0956.HK 248 1.41 0.67 (52.1) Not rated Dec 8.3 6.5 0.7 0.6 4.5 (3.2) 2.2 4.4 1.4
China Tian Lun Gas 1600.HK 227 2.13 0.49 (77.0) Not rated Dec 17.4 14.5 2.3 2.0 8.5 (0.6) 1.4 0.9 11.5
China Travel 0308.HK 972 1.33 1.39 4.6 Not rated Dec 10.9 12.4 0.6 0.6 2.1 (5.6) 1.5 (7.6) (8.3)
China Vanadium Titano 0893.HK 313 1.17 1.58 35.1 Not rated Dec 3.3 5.3 0.6 0.5 17.0 8.8 5.4 (3.3) 0.0
China Water 0855.HK 399 2.13 1.50 (29.8) Not rated Mar 9.3 9.7 1.0 0.9 6.2 (2.1) 2.9 13.3 10.9
China Windpower 0182.HK 197 0.21 0.22 5.5 Not rated Dec 4.1 8.9 0.3 0.3 2.0 (6.2) 5.1 (7.6) (28.6)
China Wireless Techs. 2369.HK 418 1.55 0.86 (44.4) Not rated Dec 12.5 10.9 1.5 1.2 10.4 2.5 17.4 28.1 30.3
China Yurun 1068.HK 1,222 5.20 5.47 5.2 Not rated Dec 5.3 11.2 0.6 0.5 7.6 1.1 9.2 (7.1) (32.4)
China Zhengtong Auto 1728.HK 1,293 4.54 3.99 (12.2) Not rated Dec 14.7 10.3 1.3 1.2 16.4 9.3 7.6 18.5 (11.7)
Chinasoft 0354.HK 365 1.65 1.58 (4.3) Not rated Dec 16.5 12.0 1.3 1.1 12.6 4.3 1.2 (8.3) (15.4)
Chongqing Mch. & Elec. 2722.HK 140 0.99 1.39 40.9 Not rated Dec 4.0 4.3 0.6 0.6 6.2 (1.5) 6.5 (8.3) (27.7)
Chu Kong Steel Pipe 1938.HK 368 2.82 0.81 (71.3) Not rated Dec 10.0 7.7 1.1 0.8 4.4 (4.0) (0.7) 33.6 18.5
CIMC Enric 3899.HK 578 4.50 4.29 (4.6) Not rated Dec 12.1 10.8 0.9 0.8 11.2 2.5 6.4 16.3 3.9
CITIC Telecom. 1883.HK 462 1.50 2.03 35.3 Not rated Dec 7.8 7.5 1.1 1.1 13.9 5.7 2.0 (2.6) 7.1
Citic Dameng 1091.HK 285 0.73 0.08 (89.2) Not rated Dec 5.4 (9.7) 0.6 0.6 2.0 (5.9) (3.9) (15.1) (13.1)
Citic Resources 1205.HK 1,035 1.02 2.26 121.8 Not rated Dec 3.3 10.7 0.6 0.5 0.4 (6.9) 5.2 (8.9) (16.4)
Clear Media 0100.HK 280 4.10 7.02 71.1 Not rated Dec 11.6 10.7 0.7 0.7 6.5 (2.1) (1.2) (3.5) 0.0
COSCO 0517.HK 591 3.03 3.58 18.2 Not rated Dec 11.7 12.1 0.6 0.6 4.5 (3.6) 1.7 0.0 2.0
Costin New Materials 2228.HK 317 3.17 2.44 (23.1) Not rated Dec 8.2 7.0 2.0 1.6 13.1 4.9 1.3 (1.6) (4.2)
CPMC 0906.HK 573 5.35 0.82 (84.7) Not rated Dec 12.9 11.5 1.4 0.9 4.5 (3.7) 1.9 (0.4) 12.2
Credit China 8207.HK 187 0.68 0.64 (5.8) Not rated Dec 8.0 6.3 1.8 1.3 20.2 10.7 1.5 3.0 7.9
Da Ming 1090.HK 143 1.07 0.15 (85.9) Not rated Dec 8.8 5.1 0.6 0.5 3.8 (4.6) (7.0) 18.9 (17.7)
Dachan Food 3999.HK 144 1.10 3.83 248.1 Not rated Dec 4.6 2.3 0.5 0.5 7.6 (1.4) (4.3) (16.7) (23.1)
HK$ term (%)P/E (x) P/B (x)
Calendarized Calendarized Share price performance
* Include the Hong Kong Industrial, consumer and media companies covered by Credit Suisse, and small-cap stocks in HOLT® database with market cap between US$150 mn and US$2 bn.
For stocks that are Not Rated, I/B/E/S consensus forecast are used. CFROI® is a registered trademark in the United States and other countries (excluding the United Kingdom) of Credit
Suisse or its subsidiaries or affiliates.
* Companies in bold and italic indicate constituents of Credit Suisse China Small Cap Index. Valuations of Credit Suisse China small-cap watch list *

14 S
ep
tem
ber 2
01
2
David
& G
olia
th
24
Valuations of Credit Suisse China small-cap watch list *
Market CS target/ Potential Credit Year HOLT CFROI
Cap Price HOLT warranted return Suisse end CFROI Spread
Company RIC (US$ mn) (HK$) price (HK$) (%) Rating month 2011 2012 2011 2012 (%) (%) 1W 1M 3M
Dalian Port 2880.HK 208 1.52 0.53 (65.4) Not rated Dec 8.3 7.5 0.4 0.4 1.6 (5.6) 2.7 (9.0) (14.6)
Daphne 0210.HK 1,661 7.82 5.57 (28.8) Not rated Dec 13.7 13.2 3.2 2.7 9.0 1.7 3.3 2.1 (5.7)
Digital China 0861.HK 1,731 12.28 19.25 56.8 Not rated Mar 11.0 9.7 2.0 1.7 11.8 4.5 (1.3) (1.6) (10.8)
Dongyue 0189.HK 1,004 3.67 5.17 40.8 Not rated Dec 2.9 7.4 1.3 1.3 26.4 19.1 11.2 (15.0) (25.9)
Dynasty Fine Wines 0828.HK 211 1.31 0.91 (30.3) Not rated Dec 385.3 33.6 0.8 0.8 (0.7) (9.2) 1.6 9.2 (3.0)
Evergreen 0238.HK 199 1.63 1.46 (10.5) Not rated Dec 6.8 7.1 0.9 0.8 10.6 2.0 5.8 (1.8) (3.6)
Fantasia 1777.HK 524 0.78 0.77 (0.7) Not rated Dec 2.8 3.3 0.6 0.5 9.0 1.2 6.8 (2.5) (13.3)
First Tractor 0038.HK 300 5.79 5.55 (4.1) Not rated Dec 9.7 9.1 1.2 1.0 4.7 (3.2) 1.9 (7.5) (10.4)
Fufeng 0546.HK 626 2.79 2.83 1.3 Not rated Dec 6.5 6.3 1.1 0.9 9.0 1.5 3.7 7.7 (7.3)
Global Bio-chem 0809.HK 349 0.83 2.45 194.8 Not rated Dec 2.1 2.0 0.3 0.3 7.1 (0.6) 5.1 (21.7) (36.2)
Glorious Property 0845.HK 1,085 1.08 1.30 20.4 NEUTRAL Dec 4.1 4.4 0.4 0.4 4.8 (2.2) 2.9 (1.8) (12.2)
Golden Meditech 0801.HK 226 0.88 1.06 20.6 Not rated Mar n.a. 9.9 n.a. 0.4 0.7 (8.0) (1.1) (1.1) (1.1)
Goldin Properties 0283.HK 2,045 4.45 2.35 (47.2) Not rated Mar n.a. 363.8 n.a. 1.1 (2.2) (9.7) (0.7) (1.1) 45.9
Goodbaby 1086.HK 317 2.46 1.94 (21.3) Not rated Dec 13.7 12.9 1.5 1.4 6.8 (1.6) (2.0) 26.8 (2.8)
Great Wall Tech 0074.HK 80 1.36 0.85 (37.8) Not rated Dec 8.5 (6.0) 0.3 0.3 2.7 (5.5) 7.1 (0.7) (11.1)
Greatview Aseptic Pack. 0468.HK 705 4.10 2.33 (43.3) Not rated Dec 17.0 14.4 2.7 2.0 10.8 2.7 3.0 9.3 10.5
Greentown China 3900.HK 2,441 8.88 8.50 (4.3) NEUTRAL Dec 5.1 4.4 1.0 1.0 6.9 (0.3) 9.5 8.3 24.4
Guangzhou Pharma. 0874.HK 447 15.78 5.40 (65.8) Not rated Dec 36.4 30.2 2.7 2.7 2.8 (6.1) (1.1) 8.5 21.9
Guotai Junan Int'l 1788.HK 427 2.02 1.65 (18.4) Not rated Dec 11.5 12.0 1.0 0.9 5.4 (3.9) 6.9 (10.2) (25.5)
Hainan Meilian 0357.HK 140 4.78 7.61 59.2 Not rated Dec 6.4 6.9 0.8 0.8 10.3 1.9 2.4 6.2 7.9
Haitian 1882.HK 1,624 7.89 6.50 (17.6) UNDERPERFORM Dec 9.3 11.0 2.2 1.9 15.2 7.8 3.3 7.8 (6.4)
Haitong Int'l Securities 0665.HK 301 2.55 1.91 (25.0) Not rated Dec 13.2 14.0 0.8 0.7 2.3 (7.0) 5.8 0.0 (6.9)
Harbin Power 1133.HK 547 6.28 8.20 30.6 OUTPERFORM Dec 5.7 5.3 0.7 0.6 3.3 (3.9) 6.4 (7.9) (13.3)
Hengdeli 3389.HK 1,246 2.20 1.57 (28.5) Not rated Dec 9.7 9.5 1.6 1.4 7.0 (0.0) 6.8 2.8 1.9
Hidili 1393.HK 456 1.71 1.30 (24.0) UNDERPERFORM Dec 4.0 6.3 0.4 0.4 6.0 (1.4) 8.9 (11.9) (23.3)
Hilong 1623.HK 371 1.81 1.29 (29.0) Not rated Dec 7.0 6.7 1.3 1.0 10.0 1.5 0.6 12.4 2.3
Honghua 0196.HK 611 1.47 1.34 (8.6) Not rated Dec 23.1 8.0 0.9 0.9 1.8 (6.7) 15.7 24.6 16.7
Hopson Dev. 0754.HK 1,211 5.41 3.94 (27.1) Not rated Dec 6.6 6.7 0.2 0.2 1.8 (5.3) 13.4 8.2 18.9
Hua Han Bio-Pharma. 0587.HK 454 1.46 2.12 45.5 Not rated Jun 9.9 6.6 1.5 0.9 10.6 2.2 (0.7) (8.8) 8.1
Hunan Nonferrous 2626.HK 486 2.31 0.50 (78.4) Not rated Dec 23.6 18.4 1.6 1.5 1.9 (5.5) 1.8 (2.1) (3.8)
Calendarized Calendarized Share price performance
P/E (x) P/B (x) HK$ term (%)
* Include the Hong Kong Industrial, consumer and media companies covered by Credit Suisse, and small-cap stocks in HOLT® database with market cap between US$150 mn and US$2 bn.
For stocks that are Not Rated, I/B/E/S consensus forecast are used. CFROI® is a registered trademark in the United States and other countries (excluding the United Kingdom) of Credit
Suisse or its subsidiaries or affiliates.
* Companies in bold and italic indicate constituents of Credit Suisse China Small Cap Index.

14 S
ep
tem
ber 2
01
2
David
& G
olia
th
25
Valuations of Credit Suisse China small-cap watch list *
Market CS target/ Potential Credit Year HOLT CFROI
Cap Price HOLT warranted return Suisse end CFROI Spread
Company RIC (US$ mn) (HK$) price (HK$) (%) Rating month 2011 2012 2011 2012 (%) (%) 1W 1M 3M
Intime Dept.Store 1833.HK 2,066 8.01 6.49 (18.9) Not rated Dec 15.2 14.3 2.0 1.7 7.1 0.2 2.7 4.7 1.6
Kaisa 1638.HK 892 1.41 2.05 45.4 OUTPERFORM Dec 3.9 3.6 0.5 0.5 6.2 (1.0) 4.4 (0.7) (10.2)
Kasen 0496.HK 198 1.32 0.87 (33.9) Not rated Dec 4.2 (40.7) 0.5 0.5 0.7 (8.1) (2.2) 14.8 20.0
Kingdee 0268.HK 412 1.27 0.51 (59.9) Not rated Dec 18.0 51.9 1.6 1.7 5.6 (2.1) 14.4 6.7 (3.8)
Kingsoft 3888.HK 618 4.09 3.61 (11.8) Not rated Dec 11.6 11.2 1.8 1.5 11.5 3.4 13.0 21.7 13.3
Kingway Brewery 0124.HK 505 2.29 1.47 (35.9) Not rated Dec 114.5 113.7 1.2 1.3 0.7 (7.7) (0.9) (6.9) (9.5)
KWG Property 1813.HK 1,679 4.50 4.70 4.4 NEUTRAL Dec 5.7 5.1 0.8 0.7 10.0 2.9 11.9 1.6 (9.3)
Leoch Technology 0842.HK 177 1.03 0.81 (21.3) Not rated Dec 4.0 7.0 0.5 0.4 7.1 (1.2) 1.0 1.0 (33.1)
Li Ning 2331.HK 541 3.97 4.30 8.3 NEUTRAL Dec 8.9 (18.3) 1.0 1.0 6.3 (1.0) 5.9 (11.0) (22.0)
Lianhua Supermarket 0980.HK 301 6.27 3.85 (38.7) Not rated Dec 9.2 9.5 1.7 1.6 4.7 (2.1) 1.8 (15.7) (25.0)
Lijun Int'l Pharma. 2005.HK 727 2.31 1.07 (53.8) Not rated Dec (135.9) 22.4 2.5 2.4 4.4 (4.0) 4.1 26.9 12.7
Lingbao Gold 3330.HK 128 3.35 2.90 (13.4) NEUTRAL Dec 6.8 9.9 0.9 0.8 6.0 (2.1) 3.1 12.8 (5.4)
Lonking 3339.HK 740 1.34 1.80 34.3 NEUTRAL Dec 2.7 8.6 0.7 0.7 15.1 8.1 32.7 (9.5) (33.7)
Magic Holdings 1633.HK 342 2.63 1.83 (30.3) Not rated Jun n.a. 14.9 n.a. 1.5 12.7 4.2 1.9 (7.4) (9.0)
Maoye 0848.HK 997 1.44 1.18 (18.2) Not rated Dec 9.8 7.9 1.2 1.0 7.1 (0.1) 8.3 18.0 (5.3)
Microport 0853.HK 646 3.52 4.20 19.3 NEUTRAL Dec 13.1 12.4 2.0 1.7 14.2 6.3 9.3 5.7 5.7
MIEH 1555.HK 676 1.98 3.41 72.3 Not rated Dec 3.9 5.2 1.4 1.3 10.0 2.3 4.8 (5.3) 1.5
Minmetals Land 0230.HK 396 0.92 2.30 149.9 Not rated Dec 5.0 4.7 0.5 0.4 6.3 (3.0) 1.1 (6.1) (8.9)
Minth 0425.HK 1,267 9.12 10.06 10.3 Not rated Dec 10.2 9.1 1.3 1.1 9.6 2.1 7.0 8.6 4.6
Nan Hai 0680.HK 248 0.03 -0.01 (122.4) Not rated Dec (3.8) (4.1) 0.6 0.6 (1.5) (9.7) 0.0 (9.7) (12.5)
NetDragon Websoft 0777.HK 488 7.50 4.14 (44.9) Not rated Dec 23.7 14.9 2.1 1.9 4.5 (4.2) 5.0 20.6 23.2
Nine Dragons 2689.HK 2,297 3.82 4.05 6.0 UNDERPERFORM Jun 7.9 8.0 0.7 0.6 4.4 (2.0) 10.7 (7.1) (18.9)
NVC 2222.HK 570 1.40 2.33 66.3 Not rated Dec 6.5 6.0 1.0 0.9 16.5 8.9 2.2 (0.7) (19.5)
O-Net Comms. 0877.HK 170 1.73 1.54 (10.8) Not rated Dec 10.8 10.4 1.0 0.9 9.4 0.8 3.0 0.6 (9.9)
Pacific Online 0543.HK 345 2.46 2.21 (10.2) Not rated Dec 9.5 9.5 3.1 3.2 23.7 15.4 3.4 (2.8) (14.6)
PCD Stores 0331.HK 304 0.56 0.16 (70.9) Not rated Dec 6.2 5.7 0.8 0.7 6.0 (1.7) 3.7 (5.1) (26.3)
Peak Sports 1968.HK 333 1.23 1.50 22.0 NEUTRAL Dec 2.7 5.0 0.5 0.5 16.2 8.4 2.5 (7.5) (14.0)
Poly (HK) 0119.HK 1,996 4.29 5.50 28.2 OUTPERFORM Dec 7.7 6.9 0.6 0.6 4.1 (2.6) 13.2 2.4 5.9
Ports Design 0589.HK 436 6.00 4.89 (18.5) Not rated Dec 6.5 6.9 1.5 1.4 8.4 0.8 (2.4) (25.1) (30.5)
Powerlong Real Estate 1238.HK 689 1.32 2.28 73.0 Not rated Dec 1.3 4.7 0.3 0.2 3.8 (3.8) 5.6 (1.5) (2.2)
Calendarized Share price performance
P/E (x) P/B (x) HK$ term (%)
Calendarized
* Include the Hong Kong Industrial, consumer and media companies covered by Credit Suisse, and small-cap stocks in HOLT® database with market cap between US$150 mn and US$2 bn.
For stocks that are Not Rated, I/B/E/S consensus forecast are used. CFROI® is a registered trademark in the United States and other countries (excluding the United Kingdom) of Credit
Suisse or its subsidiaries or affiliates.
* Companies in bold and italic indicate constituents of Credit Suisse China Small Cap Index.

14 S
ep
tem
ber 2
01
2
David
& G
olia
th
26
Valuations of Credit Suisse China small-cap watch list *
Market CS target/ Potential Credit Year HOLT CFROI
Cap Price HOLT warranted return Suisse end CFROI Spread
Company RIC (US$ mn) (HK$) price (HK$) (%) Rating month 2011 2012 2011 2012 (%) (%) 1W 1M 3M
Prince Frog 1259.HK 334 2.57 2.36 (8.2) Not rated Dec 9.9 7.0 2.2 1.6 17.6 11.1 7.1 4.5 (11.4)
Qingling Motors 1122.HK 270 1.69 2.35 39.2 Not rated Dec 9.9 11.2 0.5 0.5 1.3 (6.8) 6.3 (6.1) (11.1)
Real Nutriceutical 2010.HK 340 2.35 5.59 137.7 Not rated Dec 3.9 3.5 0.7 0.6 16.5 8.3 6.3 12.4 25.7
Renhe Commercial 1387.HK 832 0.31 1.77 479.4 Not rated Dec 1.0 3.2 0.3 0.2 1.7 (5.0) (3.2) (3.2) (21.8)
Samson 0531.HK 369 0.94 0.91 (3.6) Not rated Dec 202.0 12.1 0.7 0.7 0.1 (8.2) 0.0 1.1 1.1
Sany International 0631.HK 1,680 4.19 4.34 3.5 Not rated Dec 13.7 11.4 2.0 1.7 11.7 4.8 8.8 (0.9) (6.7)
Sateri 1768.HK 736 1.67 1.85 10.8 NEUTRAL Dec 4.8 14.1 0.4 0.4 8.4 1.3 (0.6) (7.2) (0.6)
SMIC 0981.HK 1,237 0.30 0.41 36.7 NEUTRAL Dec (4.3) (33.9) 0.5 0.5 (8.7) (15.6) 5.3 5.3 17.6
Shandong Chenming Paper 1812.HK 130 2.58 -5.17 (300.4) Not rated Dec 7.3 11.2 0.3 0.3 (2.0) (10.6) 5.3 (4.4) (15.4)
Shanghai Ind. Urban Dev. 0563.HK 788 1.27 1.87 47.6 Not rated Dec (12.8) 63.5 0.5 0.5 (0.3) (7.7) 1.6 (5.2) (20.1)
Shanghai Jin Jiang 2006.HK 185 1.03 1.10 6.3 Not rated Dec 8.7 18.3 0.6 0.6 2.3 (5.4) 2.0 2.0 0.0
Shanghai Prime Mch. 2345.HK 97 0.99 1.25 26.3 NEUTRAL Dec 5.2 6.0 0.4 0.4 1.4 (7.2) 0.0 (5.7) (13.9)
Shengli Oil & Gas Pipe 1080.HK 211 0.66 0.93 40.8 Not rated Dec 14.3 21.6 0.7 0.6 1.4 (7.2) 15.8 15.8 (10.8)
Shenguan 0829.HK 1,805 4.21 5.11 21.3 Not rated Dec 16.6 14.8 5.9 4.9 31.9 24.6 2.7 (3.2) (3.9)
Shenyin Wanguo (HK) 0218.HK 139 2.03 1.38 (32.2) Not rated Dec 14.6 13.5 0.9 0.9 2.2 (7.3) 6.8 (2.4) (10.2)
Shenzhen Expressway 0548.HK 266 2.76 4.48 62.5 Not rated Dec 5.6 6.6 0.5 0.5 5.9 (2.5) 0.7 (0.7) (6.4)
Shenzhen Int'l. 0152.HK 1,119 0.53 0.93 76.0 Not rated Dec 5.0 5.6 0.8 0.7 8.5 1.0 1.9 3.9 14.0
Shenzhen Invest. 0604.HK 856 1.83 2.15 17.7 Not rated Dec 7.0 4.7 0.5 n.a. 4.4 (1.9) 5.8 4.6 1.1
Shenzhou 2313.HK 2,295 13.38 14.60 9.1 OUTPERFORM Dec 8.0 8.0 2.2 1.8 18.8 11.4 (0.3) (0.7) (8.6)
Shougang Concord Int'l 0697.HK 404 0.35 0.83 136.4 Not rated Dec 19.7 7.3 0.3 0.3 (6.5) (14.1) 2.9 (5.4) (2.8)
Shougang Fushan 0639.HK 1,422 2.08 3.30 58.7 OUTPERFORM Dec 4.7 6.7 0.6 0.6 14.1 7.1 4.0 (5.0) (13.0)
Shui On Land 0272.HK 2,309 3.00 2.76 (7.9) Not rated Dec 3.7 8.9 0.5 0.4 3.3 (3.6) 6.4 (3.8) (6.0)
Sichuan Expressway 0107.HK 248 2.15 3.26 51.5 Not rated Dec 4.1 4.5 0.6 0.5 5.3 (2.0) (0.9) (4.9) (24.6)
Sihuan Pharm. 0460.HK 1,942 2.91 4.50 54.6 OUTPERFORM Dec 14.9 12.9 1.8 1.6 16.7 9.6 (0.3) (4.9) 6.2
Sijia Group 1863.HK 176 1.60 3.31 107.1 Not rated Dec 3.3 2.9 0.7 0.4 17.1 8.6 (0.6) (12.1) (28.9)
Silv er Base 0886.HK 508 3.23 34.84 978.8 Not rated Mar 6.3 3.2 n.a. 1.7 25.1 17.4 5.6 (4.9) (1.8)
Sino Biopharm. 1177.HK 1,963 3.08 3.60 16.9 OUTPERFORM Dec 33.0 20.7 4.0 3.7 18.2 10.7 3.4 6.2 15.8
SinoCom Software 0299.HK 154 1.07 0.72 (32.6) Not rated Dec 6.4 14.3 1.6 1.3 10.6 0.9 0.0 0.0 (1.8)
Sinolink Worldwide 1168.HK 233 0.51 1.26 147.8 Not rated Dec 4.8 10.8 0.3 0.2 2.1 (6.5) 4.1 2.0 (1.9)
Sinomedia 0623.HK 232 3.22 4.65 44.5 Not rated Dec 6.2 5.9 1.4 1.3 21.5 12.3 4.5 (0.6) (1.2)
Share price performance
P/E (x) P/B (x) HK$ term (%)
Calendarized Calendarized
* Include the Hong Kong Industrial, consumer and media companies covered by Credit Suisse, and small-cap stocks in HOLT® database with market cap between US$150 mn and US$2 bn.
For stocks that are Not Rated, I/B/E/S consensus forecast are used. CFROI® is a registered trademark in the United States and other countries (excluding the United Kingdom) of Credit
Suisse or its subsidiaries or affiliates.
* Companies in bold and italic indicate constituents of Credit Suisse China Small Cap Index.
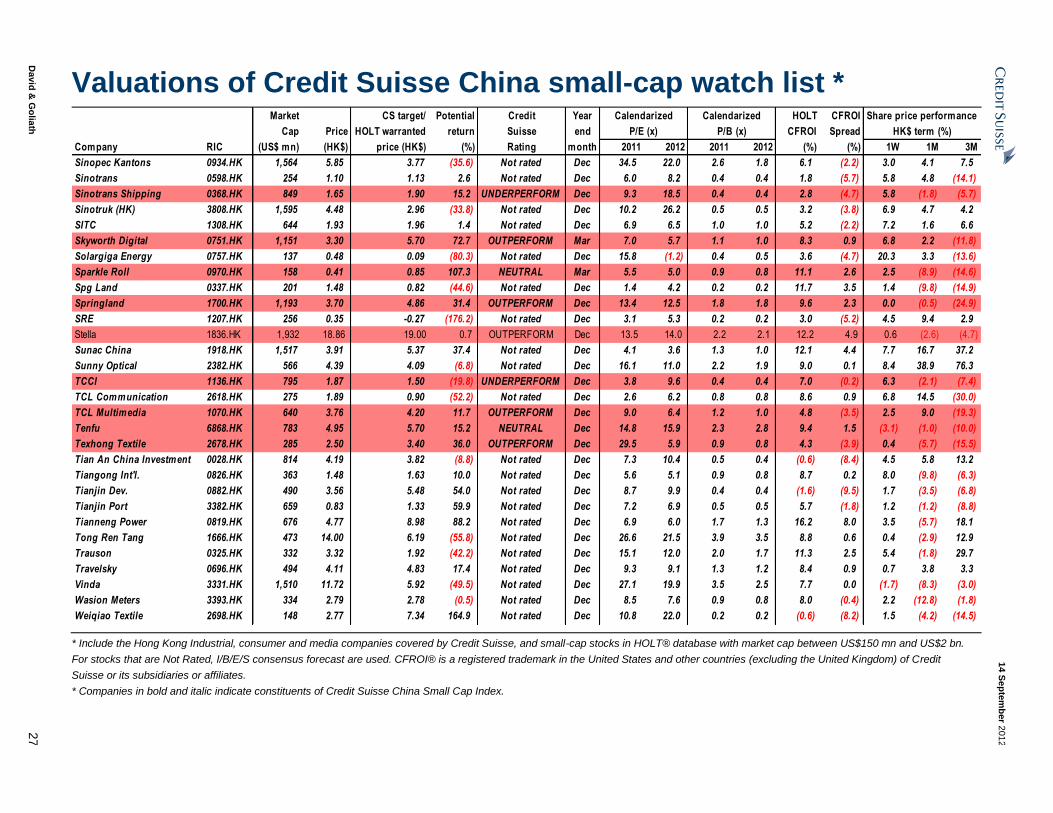
14 S
ep
tem
ber 2
01
2
David
& G
olia
th
27
Valuations of Credit Suisse China small-cap watch list *
Market CS target/ Potential Credit Year HOLT CFROI
Cap Price HOLT warranted return Suisse end CFROI Spread
Company RIC (US$ mn) (HK$) price (HK$) (%) Rating month 2011 2012 2011 2012 (%) (%) 1W 1M 3M
Sinopec Kantons 0934.HK 1,564 5.85 3.77 (35.6) Not rated Dec 34.5 22.0 2.6 1.8 6.1 (2.2) 3.0 4.1 7.5
Sinotrans 0598.HK 254 1.10 1.13 2.6 Not rated Dec 6.0 8.2 0.4 0.4 1.8 (5.7) 5.8 4.8 (14.1)
Sinotrans Shipping 0368.HK 849 1.65 1.90 15.2 UNDERPERFORM Dec 9.3 18.5 0.4 0.4 2.8 (4.7) 5.8 (1.8) (5.7)
Sinotruk (HK) 3808.HK 1,595 4.48 2.96 (33.8) Not rated Dec 10.2 26.2 0.5 0.5 3.2 (3.8) 6.9 4.7 4.2
SITC 1308.HK 644 1.93 1.96 1.4 Not rated Dec 6.9 6.5 1.0 1.0 5.2 (2.2) 7.2 1.6 6.6
Skyworth Digital 0751.HK 1,151 3.30 5.70 72.7 OUTPERFORM Mar 7.0 5.7 1.1 1.0 8.3 0.9 6.8 2.2 (11.8)
Solargiga Energy 0757.HK 137 0.48 0.09 (80.3) Not rated Dec 15.8 (1.2) 0.4 0.5 3.6 (4.7) 20.3 3.3 (13.6)
Sparkle Roll 0970.HK 158 0.41 0.85 107.3 NEUTRAL Mar 5.5 5.0 0.9 0.8 11.1 2.6 2.5 (8.9) (14.6)
Spg Land 0337.HK 201 1.48 0.82 (44.6) Not rated Dec 1.4 4.2 0.2 0.2 11.7 3.5 1.4 (9.8) (14.9)
Springland 1700.HK 1,193 3.70 4.86 31.4 OUTPERFORM Dec 13.4 12.5 1.8 1.8 9.6 2.3 0.0 (0.5) (24.9)
SRE 1207.HK 256 0.35 -0.27 (176.2) Not rated Dec 3.1 5.3 0.2 0.2 3.0 (5.2) 4.5 9.4 2.9
Stella 1836.HK 1,932 18.86 19.00 0.7 OUTPERFORM Dec 13.5 14.0 2.2 2.1 12.2 4.9 0.6 (2.6) (4.7)
Sunac China 1918.HK 1,517 3.91 5.37 37.4 Not rated Dec 4.1 3.6 1.3 1.0 12.1 4.4 7.7 16.7 37.2
Sunny Optical 2382.HK 566 4.39 4.09 (6.8) Not rated Dec 16.1 11.0 2.2 1.9 9.0 0.1 8.4 38.9 76.3
TCCI 1136.HK 795 1.87 1.50 (19.8) UNDERPERFORM Dec 3.8 9.6 0.4 0.4 7.0 (0.2) 6.3 (2.1) (7.4)
TCL Communication 2618.HK 275 1.89 0.90 (52.2) Not rated Dec 2.6 6.2 0.8 0.8 8.6 0.9 6.8 14.5 (30.0)
TCL Multimedia 1070.HK 640 3.76 4.20 11.7 OUTPERFORM Dec 9.0 6.4 1.2 1.0 4.8 (3.5) 2.5 9.0 (19.3)
Tenfu 6868.HK 783 4.95 5.70 15.2 NEUTRAL Dec 14.8 15.9 2.3 2.8 9.4 1.5 (3.1) (1.0) (10.0)
Texhong Textile 2678.HK 285 2.50 3.40 36.0 OUTPERFORM Dec 29.5 5.9 0.9 0.8 4.3 (3.9) 0.4 (5.7) (15.5)
Tian An China Investment 0028.HK 814 4.19 3.82 (8.8) Not rated Dec 7.3 10.4 0.5 0.4 (0.6) (8.4) 4.5 5.8 13.2
Tiangong Int'l. 0826.HK 363 1.48 1.63 10.0 Not rated Dec 5.6 5.1 0.9 0.8 8.7 0.2 8.0 (9.8) (6.3)
Tianjin Dev. 0882.HK 490 3.56 5.48 54.0 Not rated Dec 8.7 9.9 0.4 0.4 (1.6) (9.5) 1.7 (3.5) (6.8)
Tianjin Port 3382.HK 659 0.83 1.33 59.9 Not rated Dec 7.2 6.9 0.5 0.5 5.7 (1.8) 1.2 (1.2) (8.8)
Tianneng Power 0819.HK 676 4.77 8.98 88.2 Not rated Dec 6.9 6.0 1.7 1.3 16.2 8.0 3.5 (5.7) 18.1
Tong Ren Tang 1666.HK 473 14.00 6.19 (55.8) Not rated Dec 26.6 21.5 3.9 3.5 8.8 0.6 0.4 (2.9) 12.9
Trauson 0325.HK 332 3.32 1.92 (42.2) Not rated Dec 15.1 12.0 2.0 1.7 11.3 2.5 5.4 (1.8) 29.7
Travelsky 0696.HK 494 4.11 4.83 17.4 Not rated Dec 9.3 9.1 1.3 1.2 8.4 0.9 0.7 3.8 3.3
Vinda 3331.HK 1,510 11.72 5.92 (49.5) Not rated Dec 27.1 19.9 3.5 2.5 7.7 0.0 (1.7) (8.3) (3.0)
Wasion Meters 3393.HK 334 2.79 2.78 (0.5) Not rated Dec 8.5 7.6 0.9 0.8 8.0 (0.4) 2.2 (12.8) (1.8)
Weiqiao Textile 2698.HK 148 2.77 7.34 164.9 Not rated Dec 10.8 22.0 0.2 0.2 (0.6) (8.2) 1.5 (4.2) (14.5)
Share price performance
P/E (x) P/B (x) HK$ term (%)
Calendarized Calendarized
* Include the Hong Kong Industrial, consumer and media companies covered by Credit Suisse, and small-cap stocks in HOLT® database with market cap between US$150 mn and US$2 bn.
For stocks that are Not Rated, I/B/E/S consensus forecast are used. CFROI® is a registered trademark in the United States and other countries (excluding the United Kingdom) of Credit
Suisse or its subsidiaries or affiliates.
* Companies in bold and italic indicate constituents of Credit Suisse China Small Cap Index.

14 S
ep
tem
ber 2
01
2
David
& G
olia
th
28
Valuations of Credit Suisse China small-cap watch list *
Market CS target/ Potential Credit Year HOLT CFROI
Cap Price HOLT warranted return Suisse end CFROI Spread
Company RIC (US$ mn) (HK$) price (HK$) (%) Rating month 2011 2012 2011 2012 (%) (%) 1W 1M 3M
Welling 0382.HK 353 0.97 2.34 141.5 Not rated Dec 4.5 4.1 1.1 0.9 19.7 11.5 (7.6) (16.4) (17.8)
West China Cement 2233.HK 762 1.30 1.11 (14.7) Not rated Dec 6.9 8.9 1.1 0.8 10.1 2.6 6.6 7.4 (25.7)
Winsway Coking Coal 1733.HK 487 1.00 0.60 (40.0) UNDERPERFORM Dec 3.6 (8.1) 0.5 0.6 9.7 2.3 7.5 (9.9) (23.1)
Xiamen Int'l Port 3378.HK 101 0.79 1.21 53.3 Not rated Dec 6.2 6.9 0.4 0.4 4.0 (4.3) 5.3 (1.3) (4.8)
Xingda Int'l 1899.HK 437 2.22 2.56 15.4 Not rated Dec 6.6 8.6 0.6 0.5 5.5 (2.0) (0.4) (15.6) (22.1)
Xinhua Winshare 0811.HK 211 3.71 6.14 65.6 Not rated Dec 6.6 5.3 0.7 0.7 8.4 0.1 1.6 1.1 13.1
Xinjiang Xinxin Mining 3833.HK 138 1.41 1.47 4.2 Not rated Dec 13.3 29.6 0.5 0.5 (0.5) (8.3) 6.0 (7.8) (19.0)
Xinyi Glass 0868.HK 1,670 3.43 2.90 (15.3) Not rated Dec 9.8 11.1 1.5 1.2 9.7 2.8 4.6 (13.2) (23.3)
Xtep 1368.HK 735 2.62 4.18 59.6 Not rated Dec 4.8 5.1 1.2 1.0 18.7 11.0 4.4 2.7 (20.6)
Yashili 1230.HK 695 1.53 1.26 (17.5) Not rated Dec 14.4 10.4 1.1 1.0 6.2 (1.7) 2.0 23.4 26.4
Yingde Gases 2168.HK 1,440 6.18 4.47 (27.7) Not rated Dec 11.0 11.8 1.8 1.8 10.6 3.2 (0.2) (3.1) (15.5)
Youyuan 2268.HK 242 1.88 2.41 28.4 Not rated Dec 5.6 5.1 0.9 0.8 10.4 2.0 7.4 24.5 19.0
Yuexiu Property 0123.HK 2,301 1.92 2.23 16.2 Not rated Dec 2.8 7.4 0.7 0.7 2.7 (4.3) 6.1 3.8 0.0
Yuex iu REIT 0405.HK 522 3.80 3.42 (10.0) Not rated Dec 2.5 13.2 0.6 0.6 8.9 0.7 5.0 4.4 6.1
Yuexiu Transport Infra. 1052.HK 768 3.56 4.18 17.5 Not rated Dec 8.7 10.2 0.6 0.6 5.6 (2.3) 4.4 0.8 (2.2)
Yuzhou Properties 1628.HK 665 1.79 2.97 66.0 Not rated Dec 4.5 4.2 0.8 0.6 5.6 (2.3) (0.6) (2.7) 15.5
Zhong An Real Estate 0672.HK 244 0.80 0.57 (29.3) Not rated Dec 4.4 6.3 0.3 0.3 3.2 (5.1) (2.4) (5.9) (9.1)
Zhongy u Gas 3633.HK 381 1.17 0.50 (57.1) Not rated Dec 30.6 16.0 2.6 2.2 9.0 0.0 1.7 20.6 30.0
Calendarized Calendarized Share price performance
P/E (x) P/B (x) HK$ term (%)
* Include the Hong Kong Industrial, consumer and media companies covered by Credit Suisse, and small-cap stocks in HOLT® database with market cap between US$150 mn and US$2 bn.
For stocks that are Not Rated, I/B/E/S consensus forecast are used. CFROI® is a registered trademark in the United States and other countries (excluding the United Kingdom) of Credit
Suisse or its subsidiaries or affiliates.
* Companies in bold and italic indicate constituents of Credit Suisse China Small Cap Index.

14 S
ep
tem
ber 2
01
2
David
& G
olia
th
29
China – Screening Absolute price performance - top & bottom 10 companies Absolute price performance - top & bottom 10 companies Absolute price performance - top & bottom 10 companies
Price 1W return Price 1M return Price 3M return Company RIC (HK$) (%) Company RIC (HK$) (%) Company RIC (HK$) (%)
Winners Winners Winners Lonking 3339.HK 1.34 32.7 Sunny Optical 2382.HK 4.39 38.9 Sunny Optical 2382.HK 4.39 76.3 China Molybdenum 3993.HK 3.43 20.8 Chu Kong Steel Pipe 1938.HK 2.82 33.6 Anton Oilfield 3337.HK 1.94 67.2 Solargiga Energy 0757.HK 0.48 20.3 Anton Oilfield 3337.HK 1.94 31.1 Goldin Properties 0283.HK 4.45 45.9 China Wireless Techs. 2369.HK 1.55 17.4 China Gold Int'l Resources 2099.HK 28.60 28.8 Sunac China 1918.HK 3.91 37.2 China Singyes Solar Techs. 0750.HK 3.40 16.8 China Wireless Techs. 2369.HK 1.55 28.1 China Wireless Techs. 2369.HK 1.55 30.3 Anta Sports 2020.HK 5.51 16.0 Lijun Int'l Pharma. 2005.HK 2.31 26.9 Zhongyu Gas 3633.HK 1.17 30.0 Shengli Oil & Gas Pipe 1080.HK 0.66 15.8 Goodbaby 1086.HK 2.46 26.8 Trauson 0325.HK 3.32 29.7 Honghua 0196.HK 1.47 15.7 China Dongxiang 3818.HK 0.78 25.8 Bosideng 3998.HK 2.30 28.5 Kingdee 0268.HK 1.27 14.4 Honghua 0196.HK 1.47 24.6 Yashili 1230.HK 1.53 26.4 China Automation 0569.HK 1.68 14.3 Youyuan 2268.HK 1.88 24.5 Real Nutriceutical 2010.HK 2.35 25.7
Losers Losers Losers Welling 0382.HK 0.97 (7.6) Beijing Jingkelong 0814.HK 3.74 (25.3) China Rongsheng 1101.HK 1.10 (43.0) Da Ming 1090.HK 1.07 (7.0) Ports Design 0589.HK 6.00 (25.1) Global Bio-chem 0809.HK 0.83 (36.2) Dachan Food 3999.HK 1.10 (4.3) China All Access 0633.HK 1.18 (22.9) China Datang RNP 1798.HK 0.75 (34.8) Citic Dameng 1091.HK 0.73 (3.9) Global Bio-chem 0809.HK 0.83 (21.7) Lonking 3339.HK 1.34 (33.7) China SCE Property 1966.HK 1.63 (3.6) Dachan Food 3999.HK 1.10 (16.7) Leoch Technology 0842.HK 1.03 (33.1) Renhe Commercial 1387.HK 0.31 (3.2) Welling 0382.HK 0.97 (16.4) China Yurun 1068.HK 5.20 (32.4) Tenfu 6868.HK 4.95 (3.1) Lianhua Supermarket 0980.HK 6.27 (15.7) Beijing Jingkelong 0814.HK 3.74 (31.0) Ports Design 0589.HK 6.00 (2.4) Xingda Int'l 1899.HK 2.22 (15.6) Baoxin Auto 1293.HK 3.68 (30.7) Zhong An Real Estate 0672.HK 0.80 (2.4) Citic Dameng 1091.HK 0.73 (15.1) Ports Design 0589.HK 6.00 (30.5) Kasen 0496.HK 1.32 (2.2) Dongyue 0189.HK 3.67 (15.0) TCL Communication 2618.HK 1.89 (30.0)
Price-to-earnings - most & least expensive 10 companies Price-to-book - most & least expensive 10 companies CFROI® Spread - top & bottom 10 companies
Price 12 P/E Price 12 P/B Price CFROI® Spread Company RIC (HK$) (x) Company RIC (HK$) (x) Company RIC (HK$) (%)
Winners Winners Winners Global Bio-chem 0809.HK 0.83 2.0 China Properties 1838.HK 2.26 0.1 Shenguan 0829.HK 4.21 24.6 China Power New Energy 0735.HK 0.28 2.3 SRE 1207.HK 0.35 0.2 Dongyue 0189.HK 3.67 19.1 Dachan Food 3999.HK 1.10 2.3 Weiqiao Textile 2698.HK 2.77 0.2 Silver Base 0886.HK 3.23 17.4 Baoye 2355.HK 4.25 2.9 Renhe Commercial 1387.HK 0.31 0.2 361 Degrees 1361.HK 1.99 16.8 Sijia Group 1863.HK 1.60 2.9 Spg Land 0337.HK 1.48 0.2 China Lilang 1234.HK 5.10 16.1 Renhe Commercial 1387.HK 0.31 3.2 Hopson Dev. 0754.HK 5.41 0.2 China Medical System 0867.HK 3.98 16.0 Silver Base 0886.HK 3.23 3.2 China Rongsheng 1101.HK 1.10 0.2 Anta Sports 2020.HK 5.51 16.0 Beijing Capital Land 2868.HK 2.20 3.3 Powerlong Real Estate 1238.HK 1.32 0.2 Pacific Online 0543.HK 2.46 15.4 Fantasia 1777.HK 0.78 3.3 Sinolink Worldwide 1168.HK 0.51 0.2 Biostime Intl 1112.HK 20.95 14.3 361 Degrees 1361.HK 1.99 3.3 Global Bio-chem 0809.HK 0.83 0.3 Sinomedia 0623.HK 3.22 12.3 Losers Losers Losers Goldin Properties 0283.HK 4.45 363.8 Shenguan 0829.HK 4.21 4.9 Bawang 1338.HK 0.60 (71.9) Kingway Brewery 0124.HK 2.29 113.7 Biostime Intl 1112.HK 20.95 4.4 China Daye Non-Ferrous 0661.HK 0.32 (45.7) Shanghai Ind. Urban Dev. 0563.HK 1.27 63.5 Sino Biopharm. 1177.HK 3.08 3.7 SMIC 0981.HK 0.30 (15.6) Kingdee 0268.HK 1.27 51.9 Tong Ren Tang 1666.HK 14.00 3.5 Shougang Concord Int'l 0697.HK 0.35 (14.1) China Nickel 2889.HK 0.54 45.0 Pacific Online 0543.HK 2.46 3.2 China Huiyuan 1886.HK 2.26 (10.7) Ajisen 0538.HK 5.31 43.1 Tenfu 6868.HK 4.95 2.8 Shandong Chenming Paper 1812.HK 2.58 (10.6) Dynasty Fine Wines 0828.HK 1.31 33.6 China Medical System 0867.HK 3.98 2.7 Besunyen 0926.HK 0.62 (10.3) Guangzhou Pharma. 0874.HK 15.78 30.2 Guangzhou Pharma. 0874.HK 15.78 2.7 Nan Hai 0680.HK 0.03 (9.7) Xinjiang Xinxin Mining 3833.HK 1.41 29.6 Daphne 0210.HK 7.82 2.7 Goldin Properties 0283.HK 4.45 (9.7) Sinotruk (HK) 3808.HK 4.48 26.2 China OS. GRD. Oceans 0081.HK 7.95 2.6 Tianjin Dev. 0882.HK 3.56 (9.5)
* For stocks that are not rated, I/B/E/S consensus forecast numbers are used. CFROI® Spread is the difference between CFROI® and market implied discount rate. A larger number indicates
that more value is created by a company

14 September 2012
David & Goliath 30
India – Company updates Multi Commodities Exchange of India (MCEI.BO,
Rs1255.10, O [V], TP Rs1450.00)
Emami (EMAM.BO, Rs505.05, O, TP Rs619.00)
MCX-SX's equity product kicks off
■ MCX-SX has kickstarted roadshows for brokers across the
country for its equity products with its Mumbai roadshow being
extremely well attended. It plans to launch its first products in
November to coincide with the Diwali festival in India.
■ MCX has a 38% economic interest in MCX-SX (5% equity + 33%
warrants). MCX-SX started with currency derivatives in October
2008 and recently obtained regulatory approvals for its equity
products. Besides currency and equity products, MCX-SX will
have wholesale debt and interest rate products as well.
■ MCX-SX has announced 30-50% lower transaction fees as
compared to the NSE. It has also introduced discounted
membership fees until 18 October. Details of the number of
companies that will be initially listed and exact products are not
known at this stage.
■ We have not assumed any value for the MCX-SX holding at this
point. We continue to see MCX as an attractive stock and MCX-
SX represents an option value.
Key concerns to abate
■ Key concerns to abate in 2H. We expect key concerns on Emami
like mentha price inflation and declining international business to
be put to rest going into 2H FY13.
■ Mentha price correction driven by fundamentals. Emami saw
250% inflation in mentha oil prices in 15 months leading up to
March 2012. Prices have come off in the past six months by 40%
driven by fundamental supply side response as farmers have
increased acreage on the crop. With inventory levels at the peak
and commodity futures quoting much lower than spot, we could
see further reduction in prices and significant upside to our
earnings estimates.
■ International business decline to stem. Emami’s international
business decline is likely to stem in 2H as the base of
discontinuation of brands in Africa catches up. The
commissioning of Bangladesh and Egypt factories would be key
drivers in FY14.
■ Domestic business to deliver strong growth. Emami is seeing no
risks in delivering domestic growth of 18-20% in FY13.
Bbg/RIC 1,168.55
1,450 (1,450)
51.00 24
0.3
5.7
Free float (%) 74 Performance 1M 3M 12M
Absolute (%) 2.9 13.8 —
Relativ e (%) 1.7 8.6 —
Year 03/11A 03/12A 03/13E 03/14E 03/15E
3,689 5,262 5,857 6,921 8,184
1,918 3,347 3,787 4,625 5,609
1,757 2,862 3,366 4,063 4,862
34.60 56.40 66.30 80.00 95.80
n.a. n.a. 0 0 0
n.a. n.a. 64.50 70.80 81.50
-20.3 62.8 17.6 20.7 19.7
33.8 20.7 17.6 14.6 12.2
0.4 2.1 2.6 3.4 4.3
25.8 13.6 11.5 8.8 6.7
7.0 6.0 5.1 4.5 3.9
22.7 31.0 31.3 32.7 34.2
-119.5 -139.9 -139.6 -142.8 -143.9
1306.9 - 862.1
59,594.1/ 1,074.9
ROE (%)
Note 1: MCX is India's biggest multi commodity futures exchange.
Mkt cap (Rs/US$ mn)Daily trad v al - 6m av g (US$ mn)
Major shareholders Promoter (26%)
Net debt(cash)/equity (%)
Rev enue (Rs mn)
52-w k range (Rs)
MCX IN / MCEI.BO
O (O) [V]
Daily trad v ol - 6m av g (mn)
Rating (prev. rating)
Shares outstanding (mn)
Price (10 Sep 12 , Rs)
TP (prev. TP Rs)
Est. pot. % chg. to TP
EBITDA (Rs mn)
Net profit (Rs mn)
EPS (Rs)
- Change from prev . EPS (%)
- Consensus EPS (Rs)
EPS grow th (%)
P/E (x )
Div idend y ield (%)
EV/EBITDA (x )
P/B (x )
Bbg/RIC 509.20
619.00
151.31 22
0.1
0.6
Free float (%) 30 Performance 1M 3M 12M
Absolute (%) 5.1 5.0 11.0
Relativ e (%) 3.3 (2.6) 2.1
Year 03/11A 03/12A 03/13E 03/14E 03/15E
12,590 14,535 17,291 20,537 24,446
2,534 2,968 3,342 4,170 5,181
2,287 2,588 3,108 3,712 4,468
15.10 17.10 20.50 24.50 29.50
n.a. n.a. 0 0 0
n.a. n.a. 20.40 24.20 28.10
34.8 13.2 20.1 19.4 20.4
33.7 29.8 24.8 20.8 17.2
0.7 1.6 1.6 1.9 2.3
30.5 25.6 22.4 17.6 13.8
11.2 10.9 8.8 7.2 5.9
34.8 37.1 39.3 38.2 37.5
2.7 -16.2 -24.3 -34.1 -42.7
- Consensus EPS (Rs)
EPS grow th (%)
P/E (x )
Div idend y ield (%)
EV/EBITDA (x )
P/B (x )
EBITDA (Rs mn)
Net profit (Rs mn)
EPS (Rs)
- Change from prev . EPS (%)
Price (11 Sep 12 , Rs)
TP (prev. TP Rs)
Est. pot. % chg. to TP
52-w k range (Rs)
HMN IN / EMAM.BO
O (O)
Daily trad v ol - 6m av g (mn)
Rating (prev. rating)
Shares outstanding (mn)
509.2 - 327.5
77,047.9/ 1,394.3
ROE (%)
Note1:Emami is a player in the fast moving consumer goods company in India with market leadership in niche catgeories like cooling oils, balms and boro
creams..
Mkt cap (Rs/US$ mn)Daily trad v al - 6m av g (US$ mn)
Major shareholders Promoter
Net debt(cash)/equity (%)
Rev enue (Rs mn)
Price performance vs. MSCI India Price performance vs. MSCI India
65
75
85
95
105
03/12 04/12 05/12 06/12 07/12 08/12 09/12
Multi Commodities Exchange of India MSCI India
70
80
90
100
110
120
09/11 11/11 01/12 03/12 05/12 07/12 09/12
Emami MSCI India
Anantha Narayan / Research Analyst / 91 22 67773730 /
Extracted from The Asian Daily 12 Sep 2012
Arnab Mitra / Research Analyst / 91 22 6777 3806 /
Extracted from The Asian Daily 13 Sep 2012

14 September 2012
David & Goliath 31
India – Company updates Hexaware Technologies (HEXT.BO, Rs137.55, O, TP
Rs160.00)
Gujarat State Petronet (GSPT.BO, Rs78.40, O, TP
Rs110.00)
Management discussions indicate that the company remains well placed
■ Discussions with management indicate that Hexaware remains
well placed. The company seems on course to meet its 20%+
revenue growth guidance for 2012, has a decent pipeline for
2013 and near-term margins seem stable.
■ Hexaware management has reiterated that it has five large deals
in the pipeline and expects one of them to be signed in the next
two months. It expects little risk to revenue from top clients and
Peoplesoft 9.2 can be a catalyst.
■ It expects steady near-term margins. The available margin levers
are utilisation, the employee pyramid and G&A benefits.
However, it may reinvest in larger sales front-end, more domain
experts and investments in areas such as cloud technologies.
■ While the stock has risen by over 20% over the past six weeks,
we continue to consider this stock as our top midcap idea in the
sector. Revenue visibility is one of the most important criteria for
us in the case of midcaps and we have the most comfort with
Hexaware at this point of time. Valuations are attractive as well at
under 10x forward earnings and 4%+ dividend yield.
The new tariff order limits downside. Medium-term volume growth key to
upside
■ The PNGRB has published provisional interim tariffs of
Rs24/mmbtu for GSPL’s high pressure networks. This is 12%
below that realised since 3Q FY09 (including system use gas
recovery) and may lead to a Rs2.9 bn one-time reversal, we
think.
■ These are levelised tariffs. GSPL will have to apportion these into
tariff zones based on volume assumptions. Differences between
assumed zonal volumes and actuals can cause variance in
reported tariffs, though this should be adjusted upon review.
■ This order removes the large downside risk to earnings and cash
flow near term and allows the market to focus on the potential for
longer term volume growth at GSPL, which if not through a
reversal of domestic gas output, will be led by increased LNG.
■ We update our model for the annual report, roll forward the DCF,
assume new tariffs and reduce near- and long-term volume
assumptions. FY13E EPS falls materially due to the assumed
one-off reversal. We cut TP to Rs110; Maintain OUTPERFORM.
Bbg/RIC 137.15
160.00
295.33 17
1.6
3.5
Free float (%) 71.8 Performance 1M 3M 12M
Absolute (%) 15.9 11.1 91.1
Relativ e (%) 14.7 4.1 82.7
Year 12/10A 12/11A 12/12E 12/13E 12/14E
10,545 14,505 19,634 22,991 26,660
938 2,646 4,548 5,288 6,052
1,077 2,668 3,712 4,239 4,734
3.60 8.90 12.30 14.10 15.70
n.a. n.a. 0 0 0
n.a. n.a. 11.70 13.10 14.20
-19.6 146.8 38.2 14.2 11.7
37.9 15.4 11.1 9.7 8.7
2.0 2.9 4.3 4.1 4.7
38.2 13.6 7.8 6.5 5.5
4.1 4.0 3.5 3.0 2.5
11.7 26.6 33.9 33.0 31.2
-46.9 -45.3 -42.9 -42.8 -42.4
- Consensus EPS (Rs)
EPS grow th (%)
P/E (x )
Div idend y ield (%)
EV/EBITDA (x )
P/B (x )
EBITDA (Rs mn)
Net profit (Rs mn)
EPS (Rs)
- Change from prev . EPS (%)
Price (11 Sep 12 , Rs)
TP (prev. TP Rs)
Est. pot. % chg. to TP
52-w k range (Rs)
HEXW IN / HEXT.BO
O (O)
Daily trad v ol - 6m av g (mn)
Rating (prev. rating)
Shares outstanding (mn)
137.2 - 71.8
40,505.0/ 733.1
ROE (%)
Note1:Hexaware is a mid-sized Indian IT services company with a niche positioning in implementation of Peoplesoft..
Mkt cap (Rs/US$ mn)Daily trad v al - 6m av g (US$ mn)
Major shareholders Promoters - 28.2%
Net debt(cash)/equity (%)
Rev enue (Rs mn)
Bbg/RIC 77.80
110.00
562.70 41
1.5
1.9
Free float (%) 61 Performance 1M 3M 12M
Absolute (%) 7.6 21.3 (28.0)
Relativ e (%) 6.1 15.1 (35.7)
Year 03/11A 03/12A 03/13E 03/14E 03/15E
10,391 11,153 9,098 10,084 10,861
9,616 10,253 8,154 9,081 9,795
5,064 5,221 1,913 4,220 4,571
9.00 9.30 3.40 7.50 8.10
n.a. n.a. (65) (40) (41)
n.a. n.a. 8.60 8.60 9.10
22.4 3.1 -63.4 120.6 8.3
8.6 8.4 22.9 10.4 9.6
1.3 1.3 1.1 1.2 1.1
5.8 5.1 6.6 5.9 5.4
2.2 1.8 1.7 1.5 1.3
28.4 23.3 7.5 15.2 14.5
62.0 36.0 39.2 33.7 27.0
108.0 - 62.5
43,778.0/ 792.2
ROE (%)
Note 1: Gujarat State Petronet Ltd (GSPL), an India-based company, operates the gas transmission network in Gujarat totalling about 1,666 km. It has two
segments: gas transportation and windmill.
Mkt cap (Rs/US$ mn)Daily trad v al - 6m av g (US$ mn)
Major shareholders GSPC (38%)
Net debt(cash)/equity (%)
Rev enue (Rs mn)
52-w k range (Rs)
GUJS IN / GSPT.BO
O (O)
Daily trad v ol - 6m av g (mn)
Rating (prev. rating)
Shares outstanding (mn)
Price (12 Sep 12 , Rs)
TP (prev. TP Rs)
Est. pot. % chg. to TP
EBITDA (Rs mn)
Net profit (Rs mn)
EPS (Rs)
- Change from prev . EPS (%)
- Consensus EPS (Rs)
EPS grow th (%)
P/E (x )
Div idend y ield (%)
EV/EBITDA (x )
P/B (x )
Price performance vs. MSCI India Price performance vs. MSCI India
90
110
130
150
170
190
09/11 11/11 01/12 03/12 05/12 07/12 09/12
Hexaware Technologies MSCI India
60
75
90
105
120
09/11 11/11 01/12 03/12 05/12 07/12 09/12
Gujarat State Petronet MSCI India
Anantha Narayan / Research Analyst / 91 22 67773730 /
Extracted from The Asian Daily 13 Sep 2012
Sanjay Mookim / Research Analyst / 65 6212 3017 /
Extracted from The Asian Daily 14 Sep 2012

14 S
ep
tem
ber 2
01
2
David
& G
olia
th
32
Valuations of Credit Suisse India small-cap watch list* Market CS target/ Potential Credit Year HOLT CFROI
Cap Price HOLT warranted return Suisse end CFROI Spread
Company RIC (US$ mn) (Rs) price (Rs) (%) Rating month 2011 2012 2011 2012 (%) (%) 1W 1M 3M
3M India TMIN.NS 824 4045.85 1830.39 (54.8) Not rated Mar n.a. 60.6 n.a. 6.3 6.8 2.4 0.2 4.0 9.4
Aban Offshore ABAN.NS 325 413.95 614.00 48.3 OUTPERFORM Mar 6.1 4.8 0.7 0.6 8.8 2.3 (2.6) 2.3 17.8
Abbott India ABOT.NS 608 1583.75 1035.40 (34.6) Not rated Dec 28.0 29.0 6.2 5.3 13.4 9.1 (0.0) 2.4 6.9
ABG Shipyard ABGS.NS 309 336.35 511.41 52.0 Not rated Mar 8.9 9.0 0.9 3.3 5.0 (0.5) (1.1) (6.0) (11.0)
Hubtow n HUBT.NS 214 163.00 558.03 242.4 Not rated Mar 5.4 20.6 0.6 2.4 8.9 4.3 (2.6) (5.9) (9.8)
Adani Power ADAN.NS 1,619 41.10 40.00 (2.7) UNDERPERFORM Mar 151.7 39.9 1.5 1.6 (2.3) (9.2) (2.3) (2.8) (13.6)
Aditya Birla ABRL.NS 1,561 761.05 379.21 (50.2) Not rated Mar 11.3 9.3 1.2 1.0 16.7 6.7 0.6 (1.9) (2.3)
ATFL AGRO.NS 187 424.35 411.60 (3.0) Not rated Mar 29.4 24.3 5.1 4.3 11.3 7.1 (2.7) (7.7) (7.7)
AIA Engineering AIAE.NS 594 348.55 430.55 23.5 Not rated Mar 18.1 16.3 2.8 2.3 9.5 5.2 3.4 9.2 1.9
Akzo Nobel AKZO.NS 750 889.65 909.74 2.3 Not rated Mar 20.4 20.7 2.4 2.1 6.2 1.7 (0.1) 3.5 1.1
Alembic Pharm. ALEM.NS 250 73.50 128.49 74.8 Not rated Mar 15.8 10.6 5.2 15.6 6.5 2.2 (0.2) 23.5 43.4
Allahabad Bank ALBK.NS 1,089 120.55 225.55 87.1 Not rated Mar 3.2 3.0 n.a. 0.5 10.9 0.8 1.0 (4.8) (16.1)
Allcargo Logistics ACLL.NS 309 133.55 348.90 161.2 Not rated Mar 7.1 7.5 1.2 1.0 10.8 5.3 1.2 (4.4) 13.0
Alok Industries ALOK.NS 163 10.95 56.96 420.2 Not rated Mar 2.3 2.2 0.3 1.0 4.6 (2.3) (6.8) (31.8) (40.0)
Alstom Projects ALSM.NS 446 366.80 484.85 32.2 Not rated Mar 14.6 16.3 3.7 3.2 10.8 6.3 (3.6) (1.3) 3.2
Amara Raja AMAR.NS 586 379.95 569.94 50.0 Not rated Mar n.a. 13.4 n.a. 3.4 14.1 9.6 (0.8) 19.4 24.6
AAL AMTK.NS 348 87.40 379.16 333.8 Not rated Jun 6.4 5.0 0.4 0.3 2.4 (4.4) (1.6) (9.1) (15.4)
AIL AMTI.NS 491 98.10 137.36 40.0 Not rated Jun n.a. 22.6 n.a. 1.4 3.0 (3.1) (0.9) 0.6 (1.8)
ARIL ANRA.NS 238 44.55 202.67 354.9 Not rated Mar 7.5 5.3 0.3 1.2 2.9 (0.8) 2.8 (7.0) (8.7)
Andhra Bank ADBK.NS 911 90.10 127.63 41.7 Not rated Mar 3.7 4.0 0.7 0.6 12.3 1.7 0.1 (5.2) (22.2)
Apollo Hosps.Enterprise APLH.NS 1,696 674.70 452.15 (33.0) Not rated Mar 41.6 33.1 3.8 3.3 4.4 (0.7) 7.0 9.9 4.1
Apollo Tyres APLO.NS 909 99.85 77.00 (22.9) UNDERPERFORM Mar 11.4 10.5 1.8 1.6 5.3 (1.1) 9.1 14.8 23.3
Alston T&D ALST.NS 775 179.35 122.50 (31.7) Not rated Mar n.a. 25.7 n.a. 4.3 5.7 1.1 (0.2) (4.9) (2.2)
Arvind ARVN.NS 328 70.25 186.79 165.9 Not rated Mar 6.9 6.7 0.9 3.7 3.6 (2.2) 6.3 1.2 (7.9)
Asahi India Glass AISG.NS 197 68.15 56.43 (17.2) Not rated Mar (24.2) (16.7) 6.5 6.9 (0.4) (6.7) (3.7) 3.0 12.5
Ashok Leyland ASOK.NS 1,014 21.10 30.00 42.2 OUTPERFORM Mar 9.8 9.6 1.4 1.3 10.4 4.8 1.9 (8.3) (22.6)
Asian Star ASAN.BO 182 629.00 518.47 (17.6) Not rated Mar 24.9 97.6 2.3 8.8 3.8 (0.6) 0.8 4.8 (6.9)
Astrazeneca Pharma ASTR.NS 805 1782.65 234.11 (86.9) Not rated Mar n.a. 132.9 n.a. 21.9 5.9 1.7 1.9 6.9 (3.2)
Aurobindo Pharma ARBN.NS 675 128.40 237.17 84.7 Not rated Mar 98.6 15.2 1.6 1.4 3.9 (1.8) 7.6 22.3 21.4
Av entis Pharma SANO.NS 947 2276.45 1408.65 (38.1) Not rated Dec 27.4 30.6 4.7 4.1 15.8 11.5 3.7 3.5 7.7
Calendarized Calendarized Share price performance
P/E (x) P/B (x) Rs term (%)
* Include the small-cap stocks in HOLT® database with market cap between US$150 mn and US$2 bn. For stocks that are Not Rated, I/B/E/S consensus forecast are used. CFROI® is a
registered trademark in the United States and other countries (excluding the United Kingdom) of Credit Suisse or its subsidiaries or affiliates.
* Companies in bold and italic indicate constituents of Credit Suisse India Small Cap Index.

14 S
ep
tem
ber 2
01
2
David
& G
olia
th
33
Valuations of Credit Suisse India small-cap watch list* Market CS target/ Potential Credit Year HOLT CFROI
Cap Price HOLT warranted return Suisse end CFROI Spread
Company RIC (US$ mn) (Rs) price (Rs) (%) Rating month 2011 2012 2011 2012 (%) (%) 1W 1M 3M
Bajaj Electricals BJEL.NS 314 174.60 389.25 122.9 Not rated Mar 14.0 12.4 2.6 2.2 11.3 6.5 2.7 (0.4) (8.7)
Bajaj Finance BJFN.NS 809 1081.80 468.23 (56.7) Not rated Mar 10.8 9.4 2.3 2.0 14.0 2.0 3.6 (0.7) 23.3
Bajaj Hindusthan BJHN.NS 344 29.75 2.61 (91.2) Not rated Sep (46.1) (5.0) 0.3 0.7 1.6 (5.7) (0.8) (10.9) 7.0
BHIL BJAT.NS 1,519 755.20 858.79 13.7 Not rated Mar n.a. 4.3 n.a. 0.8 13.5 3.3 0.6 (5.4) (1.7)
Balkrishna Industries BLKI.NS 481 275.30 531.10 92.9 Not rated Mar 10.4 8.3 2.6 9.8 8.2 4.0 (3.0) (2.6) 5.3
BILT BILT.NS 232 19.60 66.90 66.9 Not rated Jun 6.1 7.6 0.5 0.5 2.1 (4.4) 1.3 6.2 (10.1)
Balmer Law rie BLMR.NS 169 575.80 1877.38 226.0 Not rated Mar 6.5 25.3 1.2 4.6 7.3 3.7 (6.8) (4.4) (0.3)
Balrampur Chini Mills BACH.NS 292 66.25 152.69 130.5 Not rated Mar 100.5 15.2 1.1 4.2 3.2 (1.6) (1.3) (1.9) 36.3
Bank Of Maharashtra BMBK.NS 466 43.70 41.34 (5.4) Not rated Mar n.a. 5.6 n.a. 0.5 5.1 (6.7) 0.9 (4.3) (19.5)
Basf India BASF.NS 520 664.35 972.40 46.4 Not rated Mar 21.6 83.0 2.4 9.1 5.1 1.8 2.9 6.6 14.7
Bata India BATA.NS 1,097 944.70 596.68 (36.8) Not rated Dec 23.5 26.8 10.6 9.7 10.2 5.3 8.0 3.4 14.3
Bayer Cropscience BAYE.NS 714 999.90 1174.88 17.5 Not rated Mar 23.6 18.0 4.6 17.1 11.1 8.2 1.9 8.2 23.3
BEML BEML.NS 204 271.75 1194.76 339.7 Not rated Mar 14.2 5.3 0.5 0.5 2.3 (3.1) (2.5) (6.3) (27.9)
Berger Paints BRGR.NS 866 138.50 129.31 (6.6) Not rated Mar 27.8 23.6 6.3 5.4 11.9 7.1 (1.0) 0.7 (7.5)
BGR Energy BGRE.NS 342 262.30 497.22 89.6 Not rated Mar 7.8 9.3 1.5 5.5 12.5 8.7 2.8 (5.0) (9.9)
Bharat Electronics BAJE.NS 1,701 1176.80 2265.29 92.5 Not rated Mar 11.0 10.7 1.7 1.5 7.4 2.7 (4.4) (7.0) (6.7)
Bharat Forge BFRG.NS 1,186 281.95 332.78 18.0 Not rated Mar 17.3 14.3 3.1 2.7 5.4 0.1 2.3 (7.3) (8.4)
Bhushan Steel BSSL.NS 1,771 461.65 -306.46 (166.4) Not rated Mar 10.9 10.0 1.3 4.7 (1.9) (8.1) (0.1) (2.0) 2.0
Biocon BION.NS 964 266.70 324.14 21.5 Not rated Mar 15.0 15.3 2.4 2.1 7.9 3.1 0.9 10.6 21.8
Birla BRLC.NS 292 210.05 693.20 230.0 Not rated Mar 6.2 6.0 0.7 0.6 3.6 (1.9) 1.7 (5.3) (11.1)
Blue Dart Ex press BLDT.NS 733 1710.60 1496.02 (12.5) Not rated Dec 32.7 27.5 6.1 5.1 10.1 5.6 0.1 (14.3) (13.7)
Blue Star BLUS.NS 270 166.10 173.68 4.6 Not rated Mar (57.5) 41.8 3.5 3.4 (7.1) (11.9) (3.0) (12.3) 1.2
BOC India BOC.NS 710 460.70 208.93 (54.6) Not rated Dec 32.3 31.0 3.1 3.4 1.6 (3.6) 5.2 9.2 11.3
Bombay Dy eing BDYN.NS 325 435.80 746.10 71.2 Not rated Mar n.a. 36.4 n.a. 1.0 3.9 (2.0) 1.7 (12.1) (13.7)
Bombay Ray on BRFL.NS 599 246.45 311.07 26.2 Not rated Mar 12.7 48.6 0.8 3.0 3.7 (1.5) (0.7) 1.4 1.8
Britannia BRIT.NS 1,053 487.95 306.72 (37.1) Not rated Mar 31.3 24.9 13.9 13.3 11.5 6.7 (3.4) 6.9 (9.5)
CUMI CRBR.NS 498 146.95 193.57 31.7 Not rated Mar 13.6 13.6 3.1 2.7 10.4 5.7 2.0 (0.4) (0.7)
Central Bank Of India CBI.NS 830 62.40 133.06 113.2 Not rated Mar 5.0 5.8 0.3 0.3 4.1 (6.2) (2.4) (10.2) (23.3)
Century Plyboards CNTP.NS 212 52.80 103.22 95.5 Not rated Mar 8.2 7.7 1.6 5.9 8.5 4.5 3.7 5.0 (2.5)
Century Textiles CNTY.NS 583 346.50 291.50 (15.9) Not rated Mar 41.9 24.5 1.7 1.5 (3.3) (9.9) 8.5 6.4 24.9
Calendarized Calendarized Share price performance
P/E (x) P/B (x) Rs term (%)
* Include the small-cap stocks in HOLT® database with market cap between US$150 mn and US$2 bn. For stocks that are Not Rated, I/B/E/S consensus forecast are used. CFROI® is a
registered trademark in the United States and other countries (excluding the United Kingdom) of Credit Suisse or its subsidiaries or affiliates.
* Companies in bold and italic indicate constituents of Credit Suisse India Small Cap Index.

14 S
ep
tem
ber 2
01
2
David
& G
olia
th
34
Valuations of Credit Suisse India small-cap watch list* Market CS target/ Potential Credit Year HOLT CFROI
Cap Price HOLT warranted return Suisse end CFROI Spread
Company RIC (US$ mn) (Rs) price (Rs) (%) Rating month 2011 2012 2011 2012 (%) (%) 1W 1M 3M
CESC CESC.NS 665 294.50 627.01 112.9 Not rated Mar 12.0 10.4 0.7 0.7 0.6 (6.5) (0.8) (3.5) 4.5
Chambal CHMB.NS 529 70.40 109.03 54.9 Not rated Mar 9.9 8.6 1.7 6.4 2.7 (2.3) 5.5 (0.1) (7.8)
Chennai Petroleum CHPC.NS 334 123.95 328.70 165.2 Not rated Mar 10.6 37.7 0.5 0.5 0.6 (5.7) 2.9 (2.4) (1.6)
Chettinad Cement CHET.NS 550 796.70 951.23 19.4 Not rated Mar 57.7 268.8 2.7 10.2 0.6 (3.5) 3.2 3.5 (4.9)
CIFCL CHLA.NS 525 219.05 50.09 (77.1) Not rated Mar n.a. 12.5 n.a. 1.7 6.1 (6.5) 5.4 0.9 28.9
City Union Bank CTBK.NS 377 50.90 38.36 (24.6) Not rated Mar 8.1 6.6 1.7 6.2 12.5 3.1 (2.1) (0.1) 2.7
Clariant Chems. CLAC.NS 303 629.70 882.38 40.1 Not rated Dec 5.5 10.8 3.5 3.1 12.9 8.7 4.2 1.9 3.8
CMC CMC.NS 607 1109.15 1433.53 29.2 Not rated Mar 21.2 16.4 5.1 3.9 10.9 6.6 14.6 18.2 29.5
Container CCRI.NS 2,252 958.95 1369.79 42.8 Not rated Mar 14.5 13.0 2.3 2.0 10.8 6.4 4.1 0.1 11.9
CORE CORE.NS 699 338.60 610.14 80.2 Not rated Mar 12.9 10.2 2.1 7.7 13.9 10.1 10.1 16.6 9.7
Coromandel CORF.NS 1,418 277.45 261.05 (5.9) Not rated Mar 12.0 11.4 3.4 2.9 9.0 3.6 (6.9) 11.2 10.3
Corporation Bank CRBK.NS 989 369.35 616.18 66.8 Not rated Mar 3.6 3.7 0.7 0.6 12.6 2.3 0.4 (4.8) (15.9)
Cox & Kings COKI.NS 325 131.80 170.00 29.0 OUTPERFORM Mar 32.2 8.5 1.5 1.3 8.1 4.4 3.5 (10.8) 4.9
CRISIL CRSL.NS 1,194 929.40 738.20 (20.6) Not rated Dec 31.9 27.9 16.0 14.1 30.5 26.1 0.5 6.3 (12.4)
Crompton Greaves CROM.NS 1,225 105.70 92.00 (13.0) UNDERPERFORM Mar 13.2 13.6 1.9 1.7 7.1 2.2 (0.3) (9.6) (9.1)
D B Corp DBCL.NS 629 189.90 244.09 28.5 Not rated Mar 16.1 16.1 3.7 14.4 17.0 13.9 (5.5) 1.6 3.4
D B Realty DBRL.NS 311 70.75 312.57 341.8 Not rated Mar 3.8 5.7 0.4 1.5 8.0 4.9 1.8 (9.1) (18.4)
Deepak DPFE.NS 205 128.60 458.99 256.9 Not rated Mar 5.5 5.2 1.0 0.8 5.9 0.2 1.8 (3.0) (1.7)
Delta Corp DELT.NS 266 65.85 210.98 220.4 Not rated Mar 7.1 28.4 1.9 7.2 16.6 13.5 8.2 10.4 3.4
DEN Networks DENN.NS 344 143.25 176.51 23.2 Not rated Mar 61.4 43.7 2.2 8.6 7.5 4.4 5.1 16.2 39.2
Dena Bank DENA.NS 591 93.45 142.59 52.6 Not rated Mar n.a. 3.7 n.a. 0.6 14.4 2.5 8.7 6.5 (6.6)
Development Credit Bank DCBA.NS 177 40.70 8.37 (79.4) Not rated Mar n.a. 13.2 n.a. 1.1 1.4 (12.1) (0.5) 0.5 (3.0)
Dewan Housing Finance DWNH.NS 354 167.20 117.70 (29.6) Not rated Mar n.a. 4.8 n.a. 0.7 12.9 0.9 2.1 1.7 (2.6)
Dish TV DSTV.NS 1,424 74.05 75.00 1.3 OUTPERFORM Mar (47.3) (148.7) (144.1) (73.6) (6.5) (11.6) 3.4 0.8 27.3
Divis Lab DIVI.NS 2,679 1117.20 915.04 (18.1) Not rated Mar 29.2 23.1 7.2 6.1 15.2 10.8 (1.6) (1.4) 21.9
Eclerx ECLE.NS 469 888.70 1797.55 102.3 Not rated Mar 17.2 14.0 8.1 5.9 32.6 28.3 12.9 15.8 44.2
Educomp Solutions EDSO.NS 321 148.70 245.00 64.8 NEUTRAL Mar 6.7 4.9 0.7 0.6 11.4 7.6 (0.9) (5.4) 10.2
Eicher Motors EICH.NS 1,092 2238.20 2909.00 30.0 Not rated Dec 19.6 16.7 4.0 3.3 12.6 8.3 8.4 7.6 7.3
EID Parry EIDP.NS 720 229.25 402.85 75.7 Not rated Mar 16.0 8.3 1.9 1.5 6.5 0.4 0.9 5.1 31.9
EIH EIHO.NS 817 79.10 99.05 25.2 Not rated Mar 48.8 34.9 1.7 1.6 2.8 (2.0) 4.0 (0.4) 1.9
Calendarized Calendarized Share price performance
P/E (x) P/B (x) Rs term (%)
* Include the small-cap stocks in HOLT® database with market cap between US$150 mn and US$2 bn. For stocks that are Not Rated, I/B/E/S consensus forecast are used. CFROI® is a
registered trademark in the United States and other countries (excluding the United Kingdom) of Credit Suisse or its subsidiaries or affiliates.
* Companies in bold and italic indicate constituents of Credit Suisse India Small Cap Index.

14 S
ep
tem
ber 2
01
2
David
& G
olia
th
35
Valuations of Credit Suisse India small-cap watch list* Market CS target/ Potential Credit Year HOLT CFROI
Cap Price HOLT warranted return Suisse end CFROI Spread
Company RIC (US$ mn) (Rs) price (Rs) (%) Rating month 2011 2012 2011 2012 (%) (%) 1W 1M 3M
ELGI Equipments ELGE.NS 229 80.00 116.83 46.0 Not rated Mar n.a. 14.4 n.a. 2.8 9.6 5.4 1.3 (7.1) 1.9
Emami EMAM.NS 1,387 507.50 619.00 22.0 OUTPERFORM Mar 30.6 25.8 10.9 9.2 33.9 29.5 (0.1) 4.7 5.2
Engineers India ENGI.NS 1,418 236.30 362.11 53.2 Not rated Mar 12.9 11.9 4.4 3.4 27.0 22.7 9.9 (0.6) 9.4
Entertainment Net.India ENIL.NS 203 235.75 248.74 5.5 Not rated Mar 22.1 18.9 2.6 2.5 11.4 7.1 7.0 8.7 12.0
Era Infra ERCI.NS 439 133.70 208.94 56.3 Not rated Mar 12.0 14.9 1.2 4.3 7.0 2.1 (0.7) (1.1) (5.5)
Essar Oil ESRO.NS 1,193 48.35 53.00 9.6 NEUTRAL Mar (2.2) (24.4) 2.0 2.1 4.7 (0.4) (0.1) (10.1) (10.4)
Essar Ports ESRS.NS 664 85.85 62.00 (27.8) NEUTRAL Mar 34.9 18.5 1.5 1.4 n.a. n.a. (1.4) (11.4) (3.6)
F D C FDC.NS 304 92.10 218.93 137.7 Not rated Mar n.a. 11.3 n.a. 2.1 12.7 8.6 8.4 8.5 18.4
FAG India FAGB.NS 461 1535.60 2396.17 56.0 Not rated Dec 14.5 13.5 3.5 2.9 11.9 7.8 (3.2) (2.3) 3.2
Federal Bank FED.NS 1,259 406.80 299.55 (26.4) Not rated Mar 9.8 8.3 1.3 1.1 6.4 (4.1) 1.3 (5.0) (5.1)
Fert.& Chems.Trav ancore FCTL.NS 326 27.85 45.88 64.7 Not rated Mar (47.0) (207.4) 12.9 51.7 3.0 (0.7) 9.2 2.6 0.5
Financial Techs. FITE.NS 756 907.85 393.86 (56.6) Not rated Mar (68.2) (463.2) 2.2 8.2 (4.3) (8.0) 8.5 8.4 40.5
Fortis Healthcare FOHE.NS 707 96.50 90.97 (5.7) Not rated Mar 51.6 151.5 1.0 3.9 (0.2) (3.8) 2.8 (2.9) (5.2)
Fresenius FRES.NS 266 93.20 182.45 95.8 Not rated Mar n.a. 25.7 n.a. 2.2 5.5 1.0 8.8 0.6 (1.4)
Gateway GATE.NS 279 142.55 252.92 77.4 Not rated Mar 12.5 10.8 2.1 1.9 8.5 3.3 4.6 5.2 4.5
Gillette India GILE.NS 1,268 2153.45 551.71 (74.4) Not rated Jun 95.2 76.4 n.a. 10.9 7.5 3.2 (1.7) (10.7) (8.4)
Gitanjali Gems GTGM.NS 566 340.55 695.21 104.1 Not rated Mar 6.7 5.9 0.9 3.5 7.5 1.9 (0.7) (0.4) 12.9
GlaxoSmithKline GLSM.NS 2,340 3078.80 3428.00 11.3 OUTPERFORM Dec 36.5 30.1 11.3 9.5 16.7 12.3 5.4 10.6 16.4
Glenmark Pharma GLEN.NS 2,126 434.75 430.00 (1.1) OUTPERFORM Mar 25.5 20.2 5.1 4.2 14.0 8.8 2.6 4.7 19.9
Glodyne Technoserve GLDY.NS 75 92.45 1059.07 1,045.6 Not rated Mar 1.9 1.4 0.6 2.1 24.4 20.6 12.4 (26.0) (75.8)
GMR Infrastructure GMRI.NS 1,403 19.95 -24.75 (224.0) Not rated Mar (16.0) (275.2) 1.1 0.9 (2.1) (9.3) 3.4 (7.0) (12.1)
Godfrey Phillips India GDFR.NS 607 3232.70 4614.81 42.8 Not rated Mar n.a. 16.6 n.a. 3.2 10.0 5.3 2.0 1.1 4.4
Godrej Industries GODI.NS 1,749 276.00 179.31 (35.0) Not rated Mar 30.0 25.6 n.a. 3.6 1.9 (3.4) 7.7 11.1 17.2
Godrej Properties GODR.NS 774 549.10 432.97 (21.1) Not rated Mar 36.2 30.9 3.2 2.1 5.8 0.4 5.5 8.1 (6.0)
Gokul Refoils GOKU.NS 101 42.25 159.58 277.7 Not rated Mar 7.0 27.1 1.0 3.6 11.4 7.6 (1.5) (12.2) (46.8)
Graphite GRPH.NS 293 83.10 208.68 151.1 Not rated Mar 7.8 7.0 1.0 0.9 4.3 (0.8) 5.0 0.9 (5.5)
Great Eastern GESC.NS 677 246.05 452.48 83.9 Not rated Mar 10.6 11.0 0.6 0.6 1.1 (5.7) (0.8) (6.4) (4.8)
Greaves Cotton GRVL.NS 297 67.30 124.90 85.6 Not rated Mar 9.5 10.5 2.7 2.2 13.0 8.7 2.0 3.5 (3.1)
Grindwell Norton GRNN.NS 250 250.05 531.91 112.7 Not rated Mar n.a. 12.0 n.a. 2.7 12.6 8.4 1.3 (0.4) 1.4
GACL GALK.NS 167 126.00 665.43 428.1 Not rated Mar 5.9 5.1 0.6 2.1 0.4 (3.6) (1.0) (1.9) 5.9
Calendarized Calendarized Share price performance
P/E (x) P/B (x) Rs term (%)
* Include the small-cap stocks in HOLT® database with market cap between US$150 mn and US$2 bn. For stocks that are Not Rated, I/B/E/S consensus forecast are used. CFROI® is a
registered trademark in the United States and other countries (excluding the United Kingdom) of Credit Suisse or its subsidiaries or affiliates.
* Companies in bold and italic indicate constituents of Credit Suisse India Small Cap Index.

14 S
ep
tem
ber 2
01
2
David
& G
olia
th
36
Valuations of Credit Suisse India small-cap watch list* Market CS target/ Potential Credit Year HOLT CFROI
Cap Price HOLT warranted return Suisse end CFROI Spread
Company RIC (US$ mn) (Rs) price (Rs) (%) Rating month 2011 2012 2011 2012 (%) (%) 1W 1M 3M
Gujarat Narmada GNFC.NS 221 78.65 367.22 366.9 Not rated Mar 4.4 17.3 0.5 1.8 0.7 (3.8) 2.7 (8.5) (3.9)
Gujarat State GSFC.NS 536 372.45 1357.58 264.5 Not rated Mar 3.9 5.0 0.9 0.8 6.8 1.9 2.5 3.2 (10.4)
Gujarat Flourochemicals GFLR.NS 731 368.05 1915.85 420.5 Not rated Mar n.a. 4.2 n.a. 1.3 16.2 11.0 3.6 7.8 (11.2)
Gujarat Gas GGAS.NS 684 295.30 409.42 38.6 Not rated Dec 13.9 14.3 4.8 4.0 16.0 11.5 (0.4) (2.5) (5.1)
Gujarat Inds.Power GJIP.NS 184 67.15 238.38 255.0 Not rated Mar 7.3 6.6 0.7 2.5 2.0 (2.6) (6.1) 0.1 4.1
Gujarat Mrl.Dev. GMDC.NS 1,093 190.20 210.00 10.4 OUTPERFORM Mar 12.3 9.0 3.1 2.4 11.5 8.6 2.8 (4.7) 9.1
Gujarat NRE Coke GJNC.NS 156 16.45 57.08 247.0 Not rated Mar 10.8 6.8 0.5 1.8 4.1 (0.2) 0.6 (4.1) (8.1)
Gujarat Pipavav GPPL.NS 445 50.95 65.00 27.6 OUTPERFORM Dec 51.6 26.7 2.7 1.9 5.5 0.5 4.0 1.6 (13.6)
Gujarat State Petronet GSPT.NS 798 78.45 110.00 40.2 OUTPERFORM Mar 8.5 16.1 1.9 1.7 9.6 5.8 5.1 8.5 19.9
GVK Power &.Infr. GVKP.NS 315 11.05 1.81 (83.6) Not rated Mar 20.6 (86.7) 0.5 0.5 (1.3) (8.1) (0.9) (13.3) (23.8)
HCL HCLI.NS 165 41.05 164.73 301.3 Not rated Jun 5.4 7.0 0.5 0.5 7.0 1.7 8.0 2.9 (1.1)
Hathway Cable HAWY.NS 550 213.00 140.50 (34.0) Not rated Mar (201.4) (250.6) 2.9 10.8 (0.3) (3.6) (0.0) 17.5 15.8
Hatsun Agro HAPL.BO 165 85.05 87.52 2.9 Not rated Mar n.a. 33.1 n.a. 7.5 7.4 2.1 (1.2) (10.1) 3.4
Havell's India HVEL.NS 1,293 573.45 578.24 0.8 Not rated Mar 20.2 16.9 8.1 7.0 9.2 3.7 3.5 3.5 4.1
Hexaware Techs. HEXT.NS 739 138.15 160.00 15.8 OUTPERFORM Dec 15.5 11.2 4.1 3.5 15.8 11.3 7.3 16.8 13.0
Himadri HMCH.NS 204 29.30 58.91 101.1 Not rated Mar 8.3 31.5 0.9 3.4 5.1 1.0 12.3 (3.1) (5.5)
Hindustan Construction HCNS.NS 175 16.00 41.63 160.2 Not rated Mar (2.6) (14.9) 1.0 1.1 2.7 (4.4) 1.6 (7.2) (18.8)
Hindustan Media HINS.NS 158 118.80 253.49 113.4 Not rated Mar 13.7 11.9 2.0 7.4 11.1 8.2 1.9 1.4 (7.3)
Hindustan Oil HOEX.NS 275 116.45 305.64 162.5 Not rated Mar 44.6 25.2 1.1 4.2 5.3 1.8 0.3 (4.8) (3.6)
Hindustan Petroleum HPCL.NS 1,884 307.90 261.00 (15.2) UNDERPERFORM Mar 9.8 16.2 0.8 0.8 0.0 (7.4) (0.4) (4.3) 2.1
HNG HNGI.NS 318 201.65 255.75 26.8 Not rated Mar 37.3 14.5 n.a. 1.4 0.1 (6.3) 0.9 1.4 (0.4)
Hnywell.Automation HONE.NS 396 2480.85 3555.27 43.3 Not rated Dec 20.5 15.5 3.5 3.0 12.1 7.9 3.2 1.1 (2.5)
Hotel Leela HTLE.NS 207 29.50 55.84 89.3 Not rated Mar (4.0) (4.2) 0.8 0.7 (2.3) (9.3) 5.9 (3.9) (10.3)
Housing Dev.&.Infra. HDIL.NS 525 69.30 379.70 447.9 Not rated Mar 3.5 3.2 0.3 0.2 8.3 2.3 0.8 (19.3) (7.8)
HSIL HSNT.NS 150 125.85 339.95 170.1 Not rated Mar 8.1 7.6 1.1 4.0 5.0 0.6 7.8 (1.1) (10.5)
HT Media HTML.NS 368 86.65 157.87 82.2 Not rated Mar 12.0 11.3 1.6 1.3 6.8 2.0 0.6 0.2 (9.7)
I N G Vysya Bank VYSA.NS 1,005 370.15 460.00 24.3 OUTPERFORM Mar 12.1 9.6 1.4 1.3 6.5 (4.6) (1.1) (4.1) 9.0
Icra ICRA.NS 213 1176.95 1542.00 31.0 Not rated Mar 22.4 17.8 4.1 3.5 11.7 7.5 2.1 1.2 (4.2)
IDBI Bank IDBI.NS 2,023 87.60 129.36 47.7 Not rated Mar 4.9 5.5 0.5 1.9 6.5 (0.1) 0.8 3.0 (6.1)
Il&FS ILFT.NS 553 157.50 455.96 189.5 Not rated Mar 6.4 5.9 1.2 0.9 16.4 9.4 (2.7) (4.5) (17.9)
Calendarized Calendarized Share price performance
P/E (x) P/B (x) Rs term (%)
* Include the small-cap stocks in HOLT® database with market cap between US$150 mn and US$2 bn. For stocks that are Not Rated, I/B/E/S consensus forecast are used. CFROI® is a
registered trademark in the United States and other countries (excluding the United Kingdom) of Credit Suisse or its subsidiaries or affiliates.
* Companies in bold and italic indicate constituents of Credit Suisse India Small Cap Index.

14 S
ep
tem
ber 2
01
2
David
& G
olia
th
37
Valuations of Credit Suisse India small-cap watch list* Market CS target/ Potential Credit Year HOLT CFROI
Cap Price HOLT warranted return Suisse end CFROI Spread
Company RIC (US$ mn) (Rs) price (Rs) (%) Rating month 2011 2012 2011 2012 (%) (%) 1W 1M 3M
India Cements ICMN.NS 451 81.30 117.00 43.9 OUTPERFORM Mar 10.3 7.8 0.6 0.6 3.8 (2.5) 0.4 (4.6) 1.9
India Infoline IIFL.NS 310 59.35 21.27 (64.2) Not rated Mar 11.8 10.8 1.0 0.9 0.4 (12.2) 9.7 5.8 0.4
Indiabulls Finl. Svs. IBUL.NS 1,099 195.00 175.89 (9.8) Not rated Mar 6.5 5.4 1.3 1.1 12.6 1.5 2.1 (4.8) (14.4)
Indiabulls Power INDP.NS 530 11.10 13.64 22.9 Not rated Mar 64.6 50.5 0.5 1.8 (3.9) (7.3) (0.4) (7.5) (9.0)
Indiabulls Real Estate INRL.NS 371 45.75 153.61 235.8 Not rated Mar 10.7 9.4 0.2 0.7 0.3 (4.1) 4.9 (14.9) (20.8)
Indian Bank INBA.NS 1,261 162.35 272.29 67.7 Not rated Mar 4.1 4.1 0.7 0.6 11.9 1.8 5.7 (5.9) (8.8)
Indian Hotels IHTL.NS 878 60.20 70.19 16.6 Not rated Mar (225.0) 54.9 1.5 1.4 1.5 (4.4) 1.7 (0.8) 9.2
Indian Overseas Bank IOBK.NS 973 67.60 71.00 5.0 UNDERPERFORM Mar 7.9 4.5 0.5 0.4 7.6 (2.4) 2.1 (5.0) (23.5)
Indraprastha Gas IGAS.NS 650 256.90 524.33 104.1 Not rated Mar 12.2 11.0 3.1 2.6 11.4 6.5 7.0 (0.3) 6.3
Info Edge INED.NS 671 340.20 255.22 (25.0) Not rated Mar 38.2 32.3 7.3 6.3 16.5 12.2 2.4 (3.6) (7.5)
Infotech Enterprises INFE.NS 398 197.80 403.52 104.0 Not rated Mar 14.1 10.2 2.0 1.7 8.7 4.3 8.1 13.1 23.2
Ingersoll-Rand INGR.NS 264 463.20 706.64 52.6 Not rated Mar n.a. 15.8 n.a. 1.7 7.1 2.9 2.4 1.4 3.6
Ipca Lab IPCA.NS 1,021 447.95 549.11 22.6 Not rated Mar 20.4 16.3 4.7 3.9 9.3 4.5 1.8 11.0 30.9
IRB Infr.Developers IRBI.NS 739 123.05 128.29 4.3 Not rated Mar 8.4 8.0 1.4 5.1 9.4 4.8 (0.1) 1.5 (3.5)
IVRCL IVRC.NS 215 38.70 45.00 16.3 NEUTRAL Mar 13.0 18.0 0.5 0.5 3.3 (1.8) (0.8) (15.1) (21.5)
JM Financial JMSH.NS 199 14.65 6.90 (52.9) Not rated Mar 8.2 7.4 0.6 0.5 (1.2) (14.0) 1.4 6.2 15.4
Jagran Prakashan JAGP.NS 524 91.70 130.54 42.4 Not rated Mar 14.7 14.3 3.3 12.5 15.0 11.9 1.6 0.6 5.5
Jai Corp JAIC.NS 177 54.90 299.73 446.0 Not rated Mar 8.6 35.8 0.3 1.2 2.6 (0.2) 2.7 (5.1) (5.7)
Jain Irrigation Systems JAIR.NS 418 60.00 111.13 85.2 Not rated Mar 7.5 8.3 1.2 4.6 6.8 2.4 (1.8) (30.8) (19.9)
Jaiprakash Power JAPR.NS 1,432 30.20 43.00 42.4 NEUTRAL Mar 23.1 18.6 1.5 1.4 0.9 (4.4) 13.5 (4.9) (18.4)
Jammu & Kashmir Bank JKBK.NS 783 893.80 1250.00 39.9 OUTPERFORM Mar 5.7 4.8 1.1 0.9 13.1 1.6 (0.7) (3.4) (2.6)
Jaypee Infratech JYPE.NS 1,186 47.25 28.76 (39.1) Not rated Mar 5.1 5.9 0.9 3.3 10.7 6.0 7.8 (2.8) (1.3)
JBF Industries JBFI.NS 182 139.20 588.26 322.6 Not rated Mar 2.9 3.6 0.5 2.0 15.5 9.8 0.9 5.1 17.3
Jet Airways JET.NS 563 361.15 1217.33 237.1 Not rated Mar (2.9) (6.3) 3.4 34.3 (1.9) (9.5) 9.9 (7.2) (5.3)
Jindal Saw JIND.NS 579 116.10 281.67 142.6 Not rated Mar 9.4 8.7 0.6 2.4 4.6 0.3 0.1 (3.9) (8.5)
Jindal Stainless JIST.NS 242 70.40 -180.79 (356.8) Not rated Mar 4.7 19.8 0.5 1.8 0.8 (6.0) (2.0) 7.9 (3.0)
JK Cement JKCE.NS 275 217.85 698.64 220.7 Not rated Mar 10.4 6.8 n.a. 0.9 6.3 (0.1) 4.0 (0.8) 50.1
JSW Energy JSWE.NS 1,451 48.95 61.68 26.0 Not rated Mar 23.7 15.6 1.4 1.2 3.0 (3.2) 2.9 (4.6) 3.3
JSW Ispat Steel JSWI.NS 421 9.25 18.94 104.7 Not rated Jun n.a. (1.4) n.a. 2.1 (0.9) (7.7) 2.2 (9.3) (11.9)
Jubilant Foodworks JUBI.NS 1,428 1212.95 598.78 (50.6) Not rated Mar 82.5 55.2 29.2 20.9 14.8 10.2 (1.8) 0.4 (3.3)
Calendarized Calendarized Share price performance
P/E (x) P/B (x) Rs term (%)
* Include the small-cap stocks in HOLT® database with market cap between US$150 mn and US$2 bn. For stocks that are Not Rated, I/B/E/S consensus forecast are used. CFROI® is a
registered trademark in the United States and other countries (excluding the United Kingdom) of Credit Suisse or its subsidiaries or affiliates.
* Companies in bold and italic indicate constituents of Credit Suisse India Small Cap Index.
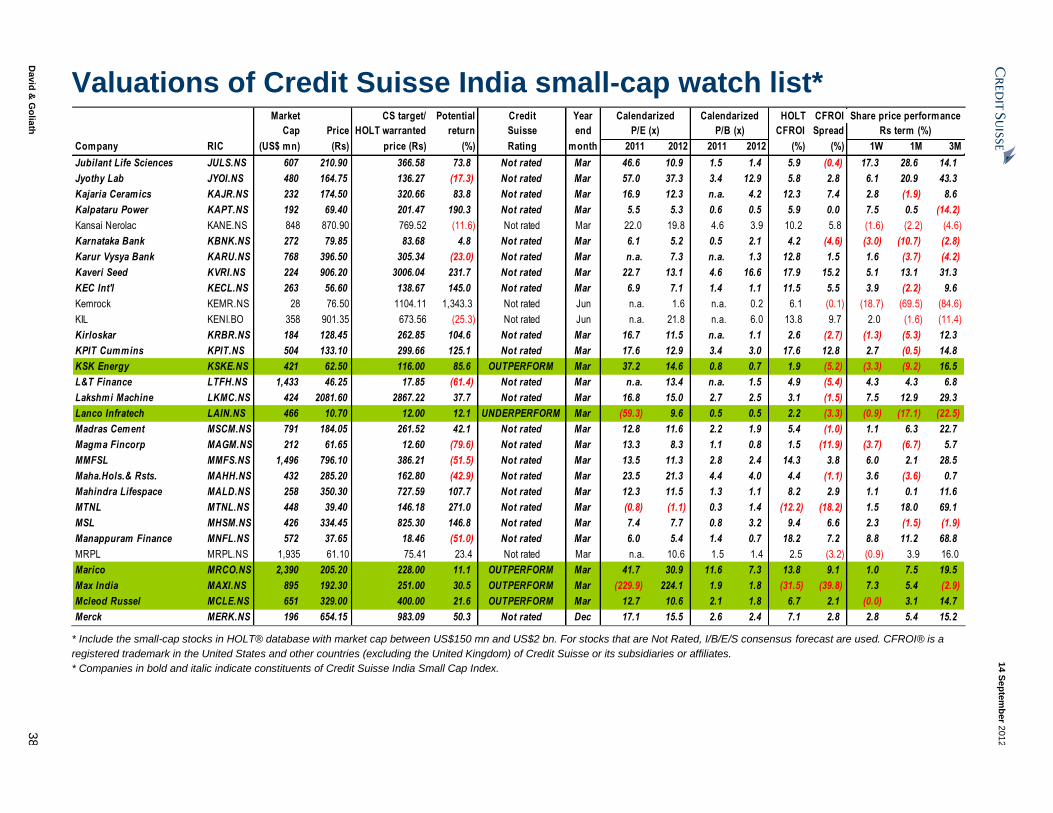
14 S
ep
tem
ber 2
01
2
David
& G
olia
th
38
Valuations of Credit Suisse India small-cap watch list* Market CS target/ Potential Credit Year HOLT CFROI
Cap Price HOLT warranted return Suisse end CFROI Spread
Company RIC (US$ mn) (Rs) price (Rs) (%) Rating month 2011 2012 2011 2012 (%) (%) 1W 1M 3M
Jubilant Life Sciences JULS.NS 607 210.90 366.58 73.8 Not rated Mar 46.6 10.9 1.5 1.4 5.9 (0.4) 17.3 28.6 14.1
Jyothy Lab JYOI.NS 480 164.75 136.27 (17.3) Not rated Mar 57.0 37.3 3.4 12.9 5.8 2.8 6.1 20.9 43.3
Kajaria Ceramics KAJR.NS 232 174.50 320.66 83.8 Not rated Mar 16.9 12.3 n.a. 4.2 12.3 7.4 2.8 (1.9) 8.6
Kalpataru Power KAPT.NS 192 69.40 201.47 190.3 Not rated Mar 5.5 5.3 0.6 0.5 5.9 0.0 7.5 0.5 (14.2)
Kansai Nerolac KANE.NS 848 870.90 769.52 (11.6) Not rated Mar 22.0 19.8 4.6 3.9 10.2 5.8 (1.6) (2.2) (4.6)
Karnataka Bank KBNK.NS 272 79.85 83.68 4.8 Not rated Mar 6.1 5.2 0.5 2.1 4.2 (4.6) (3.0) (10.7) (2.8)
Karur Vysya Bank KARU.NS 768 396.50 305.34 (23.0) Not rated Mar n.a. 7.3 n.a. 1.3 12.8 1.5 1.6 (3.7) (4.2)
Kaveri Seed KVRI.NS 224 906.20 3006.04 231.7 Not rated Mar 22.7 13.1 4.6 16.6 17.9 15.2 5.1 13.1 31.3
KEC Int'l KECL.NS 263 56.60 138.67 145.0 Not rated Mar 6.9 7.1 1.4 1.1 11.5 5.5 3.9 (2.2) 9.6
Kemrock KEMR.NS 28 76.50 1104.11 1,343.3 Not rated Jun n.a. 1.6 n.a. 0.2 6.1 (0.1) (18.7) (69.5) (84.6)
KIL KENI.BO 358 901.35 673.56 (25.3) Not rated Jun n.a. 21.8 n.a. 6.0 13.8 9.7 2.0 (1.6) (11.4)
Kirloskar KRBR.NS 184 128.45 262.85 104.6 Not rated Mar 16.7 11.5 n.a. 1.1 2.6 (2.7) (1.3) (5.3) 12.3
KPIT Cummins KPIT.NS 504 133.10 299.66 125.1 Not rated Mar 17.6 12.9 3.4 3.0 17.6 12.8 2.7 (0.5) 14.8
KSK Energy KSKE.NS 421 62.50 116.00 85.6 OUTPERFORM Mar 37.2 14.6 0.8 0.7 1.9 (5.2) (3.3) (9.2) 16.5
L&T Finance LTFH.NS 1,433 46.25 17.85 (61.4) Not rated Mar n.a. 13.4 n.a. 1.5 4.9 (5.4) 4.3 4.3 6.8
Lakshmi Machine LKMC.NS 424 2081.60 2867.22 37.7 Not rated Mar 16.8 15.0 2.7 2.5 3.1 (1.5) 7.5 12.9 29.3
Lanco Infratech LAIN.NS 466 10.70 12.00 12.1 UNDERPERFORM Mar (59.3) 9.6 0.5 0.5 2.2 (3.3) (0.9) (17.1) (22.5)
Madras Cement MSCM.NS 791 184.05 261.52 42.1 Not rated Mar 12.8 11.6 2.2 1.9 5.4 (1.0) 1.1 6.3 22.7
Magma Fincorp MAGM.NS 212 61.65 12.60 (79.6) Not rated Mar 13.3 8.3 1.1 0.8 1.5 (11.9) (3.7) (6.7) 5.7
MMFSL MMFS.NS 1,496 796.10 386.21 (51.5) Not rated Mar 13.5 11.3 2.8 2.4 14.3 3.8 6.0 2.1 28.5
Maha.Hols.& Rsts. MAHH.NS 432 285.20 162.80 (42.9) Not rated Mar 23.5 21.3 4.4 4.0 4.4 (1.1) 3.6 (3.6) 0.7
Mahindra Lifespace MALD.NS 258 350.30 727.59 107.7 Not rated Mar 12.3 11.5 1.3 1.1 8.2 2.9 1.1 0.1 11.6
MTNL MTNL.NS 448 39.40 146.18 271.0 Not rated Mar (0.8) (1.1) 0.3 1.4 (12.2) (18.2) 1.5 18.0 69.1
MSL MHSM.NS 426 334.45 825.30 146.8 Not rated Mar 7.4 7.7 0.8 3.2 9.4 6.6 2.3 (1.5) (1.9)
Manappuram Finance MNFL.NS 572 37.65 18.46 (51.0) Not rated Mar 6.0 5.4 1.4 0.7 18.2 7.2 8.8 11.2 68.8
MRPL MRPL.NS 1,935 61.10 75.41 23.4 Not rated Mar n.a. 10.6 1.5 1.4 2.5 (3.2) (0.9) 3.9 16.0
Marico MRCO.NS 2,390 205.20 228.00 11.1 OUTPERFORM Mar 41.7 30.9 11.6 7.3 13.8 9.1 1.0 7.5 19.5
Max India MAXI.NS 895 192.30 251.00 30.5 OUTPERFORM Mar (229.9) 224.1 1.9 1.8 (31.5) (39.8) 7.3 5.4 (2.9)
Mcleod Russel MCLE.NS 651 329.00 400.00 21.6 OUTPERFORM Mar 12.7 10.6 2.1 1.8 6.7 2.1 (0.0) 3.1 14.7
Merck MERK.NS 196 654.15 983.09 50.3 Not rated Dec 17.1 15.5 2.6 2.4 7.1 2.8 2.8 5.4 15.2
Calendarized Calendarized Share price performance
P/E (x) P/B (x) Rs term (%)
* Include the small-cap stocks in HOLT® database with market cap between US$150 mn and US$2 bn. For stocks that are Not Rated, I/B/E/S consensus forecast are used. CFROI® is a
registered trademark in the United States and other countries (excluding the United Kingdom) of Credit Suisse or its subsidiaries or affiliates.
* Companies in bold and italic indicate constituents of Credit Suisse India Small Cap Index.
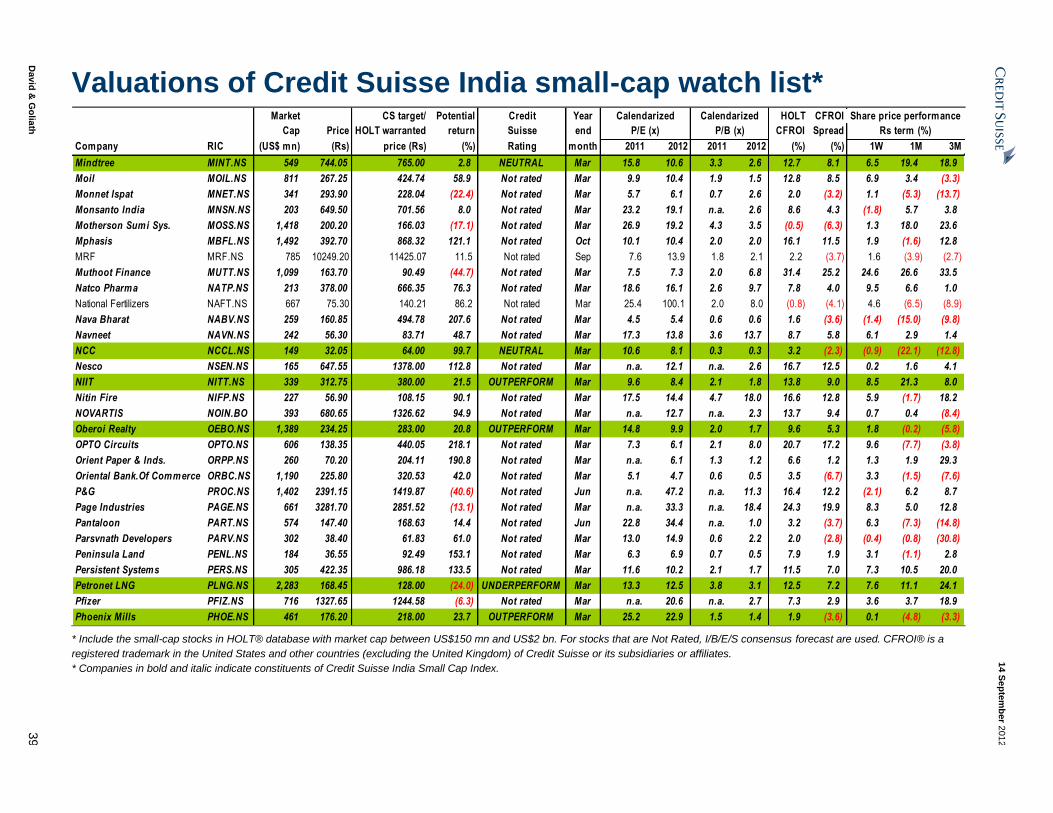
14 S
ep
tem
ber 2
01
2
David
& G
olia
th
39
Valuations of Credit Suisse India small-cap watch list* Market CS target/ Potential Credit Year HOLT CFROI
Cap Price HOLT warranted return Suisse end CFROI Spread
Company RIC (US$ mn) (Rs) price (Rs) (%) Rating month 2011 2012 2011 2012 (%) (%) 1W 1M 3M
Mindtree MINT.NS 549 744.05 765.00 2.8 NEUTRAL Mar 15.8 10.6 3.3 2.6 12.7 8.1 6.5 19.4 18.9
Moil MOIL.NS 811 267.25 424.74 58.9 Not rated Mar 9.9 10.4 1.9 1.5 12.8 8.5 6.9 3.4 (3.3)
Monnet Ispat MNET.NS 341 293.90 228.04 (22.4) Not rated Mar 5.7 6.1 0.7 2.6 2.0 (3.2) 1.1 (5.3) (13.7)
Monsanto India MNSN.NS 203 649.50 701.56 8.0 Not rated Mar 23.2 19.1 n.a. 2.6 8.6 4.3 (1.8) 5.7 3.8
Motherson Sumi Sys. MOSS.NS 1,418 200.20 166.03 (17.1) Not rated Mar 26.9 19.2 4.3 3.5 (0.5) (6.3) 1.3 18.0 23.6
Mphasis MBFL.NS 1,492 392.70 868.32 121.1 Not rated Oct 10.1 10.4 2.0 2.0 16.1 11.5 1.9 (1.6) 12.8
MRF MRF.NS 785 10249.20 11425.07 11.5 Not rated Sep 7.6 13.9 1.8 2.1 2.2 (3.7) 1.6 (3.9) (2.7)
Muthoot Finance MUTT.NS 1,099 163.70 90.49 (44.7) Not rated Mar 7.5 7.3 2.0 6.8 31.4 25.2 24.6 26.6 33.5
Natco Pharma NATP.NS 213 378.00 666.35 76.3 Not rated Mar 18.6 16.1 2.6 9.7 7.8 4.0 9.5 6.6 1.0
National Fertilizers NAFT.NS 667 75.30 140.21 86.2 Not rated Mar 25.4 100.1 2.0 8.0 (0.8) (4.1) 4.6 (6.5) (8.9)
Nava Bharat NABV.NS 259 160.85 494.78 207.6 Not rated Mar 4.5 5.4 0.6 0.6 1.6 (3.6) (1.4) (15.0) (9.8)
Navneet NAVN.NS 242 56.30 83.71 48.7 Not rated Mar 17.3 13.8 3.6 13.7 8.7 5.8 6.1 2.9 1.4
NCC NCCL.NS 149 32.05 64.00 99.7 NEUTRAL Mar 10.6 8.1 0.3 0.3 3.2 (2.3) (0.9) (22.1) (12.8)
Nesco NSEN.NS 165 647.55 1378.00 112.8 Not rated Mar n.a. 12.1 n.a. 2.6 16.7 12.5 0.2 1.6 4.1
NIIT NITT.NS 339 312.75 380.00 21.5 OUTPERFORM Mar 9.6 8.4 2.1 1.8 13.8 9.0 8.5 21.3 8.0
Nitin Fire NIFP.NS 227 56.90 108.15 90.1 Not rated Mar 17.5 14.4 4.7 18.0 16.6 12.8 5.9 (1.7) 18.2
NOVARTIS NOIN.BO 393 680.65 1326.62 94.9 Not rated Mar n.a. 12.7 n.a. 2.3 13.7 9.4 0.7 0.4 (8.4)
Oberoi Realty OEBO.NS 1,389 234.25 283.00 20.8 OUTPERFORM Mar 14.8 9.9 2.0 1.7 9.6 5.3 1.8 (0.2) (5.8)
OPTO Circuits OPTO.NS 606 138.35 440.05 218.1 Not rated Mar 7.3 6.1 2.1 8.0 20.7 17.2 9.6 (7.7) (3.8)
Orient Paper & Inds. ORPP.NS 260 70.20 204.11 190.8 Not rated Mar n.a. 6.1 1.3 1.2 6.6 1.2 1.3 1.9 29.3
Oriental Bank.Of Commerce ORBC.NS 1,190 225.80 320.53 42.0 Not rated Mar 5.1 4.7 0.6 0.5 3.5 (6.7) 3.3 (1.5) (7.6)
P&G PROC.NS 1,402 2391.15 1419.87 (40.6) Not rated Jun n.a. 47.2 n.a. 11.3 16.4 12.2 (2.1) 6.2 8.7
Page Industries PAGE.NS 661 3281.70 2851.52 (13.1) Not rated Mar n.a. 33.3 n.a. 18.4 24.3 19.9 8.3 5.0 12.8
Pantaloon PART.NS 574 147.40 168.63 14.4 Not rated Jun 22.8 34.4 n.a. 1.0 3.2 (3.7) 6.3 (7.3) (14.8)
Parsvnath Developers PARV.NS 302 38.40 61.83 61.0 Not rated Mar 13.0 14.9 0.6 2.2 2.0 (2.8) (0.4) (0.8) (30.8)
Peninsula Land PENL.NS 184 36.55 92.49 153.1 Not rated Mar 6.3 6.9 0.7 0.5 7.9 1.9 3.1 (1.1) 2.8
Persistent Systems PERS.NS 305 422.35 986.18 133.5 Not rated Mar 11.6 10.2 2.1 1.7 11.5 7.0 7.3 10.5 20.0
Petronet LNG PLNG.NS 2,283 168.45 128.00 (24.0) UNDERPERFORM Mar 13.3 12.5 3.8 3.1 12.5 7.2 7.6 11.1 24.1
Pfizer PFIZ.NS 716 1327.65 1244.58 (6.3) Not rated Mar n.a. 20.6 n.a. 2.7 7.3 2.9 3.6 3.7 18.9
Phoenix Mills PHOE.NS 461 176.20 218.00 23.7 OUTPERFORM Mar 25.2 22.9 1.5 1.4 1.9 (3.6) 0.1 (4.8) (3.3)
Calendarized Calendarized Share price performance
P/E (x) P/B (x) Rs term (%)
* Include the small-cap stocks in HOLT® database with market cap between US$150 mn and US$2 bn. For stocks that are Not Rated, I/B/E/S consensus forecast are used. CFROI® is a
registered trademark in the United States and other countries (excluding the United Kingdom) of Credit Suisse or its subsidiaries or affiliates.
* Companies in bold and italic indicate constituents of Credit Suisse India Small Cap Index.

14 S
ep
tem
ber 2
01
2
David
& G
olia
th
40
Valuations of Credit Suisse India small-cap watch list* Market CS target/ Potential Credit Year HOLT CFROI
Cap Price HOLT warranted return Suisse end CFROI Spread
Company RIC (US$ mn) (Rs) price (Rs) (%) Rating month 2011 2012 2011 2012 (%) (%) 1W 1M 3M
Pidilite PIDI.NS 1,910 208.25 123.80 (40.6) Not rated Mar 33.1 28.0 8.3 7.3 13.2 8.6 5.6 15.2 26.1
Pipavav Defence PIPA.NS 958 75.65 84.57 11.8 Not rated Mar 104.0 17.0 2.3 8.5 (2.2) (6.4) 6.5 31.9 (8.8)
Piramal Healthcare PIRA.NS 1,473 472.30 252.30 (46.6) Not rated Mar 53.8 (204.2) 0.7 0.7 (8.2) (18.6) 0.8 (12.1) 4.4
Plethico Pharma PLPH.NS 179 290.45 611.49 110.5 Not rated Dec 6.0 5.8 0.7 0.6 6.0 (0.0) 4.2 (14.1) (19.1)
Polaris Financial Tech. POLF.NS 251 139.90 493.26 252.6 Not rated Mar 6.4 5.8 1.1 4.2 11.6 8.6 15.2 22.7 19.8
Praj Industries PRAJ.NS 130 40.60 75.69 86.4 Not rated Mar 11.6 12.1 1.3 1.2 8.9 4.7 (5.3) (23.8) (28.0)
Prestige Estates Projects PREG.NS 670 113.05 117.00 3.5 OUTPERFORM Mar 21.5 13.8 1.7 1.5 4.8 0.5 (5.8) (0.2) (4.3)
Prism Cement PRIS.NS 450 49.45 56.17 13.6 Not rated Mar n.a. (154.1) n.a. 1.8 2.0 (3.9) (7.0) (2.7) (1.3)
PTC India PTCI.NS 284 53.20 254.74 378.8 Not rated Mar 8.9 7.4 0.5 1.9 7.2 4.5 (1.2) (13.1) (10.4)
Punj Lloyd PUJL.NS 285 47.50 127.63 168.7 Not rated Mar 28.1 17.5 0.5 0.5 3.1 (3.7) 6.5 (8.2) (1.2)
Puravankara Projects PPRO.NS 247 64.10 221.66 245.8 Not rated Mar 10.6 8.7 0.8 0.7 9.6 3.8 0.2 (7.6) 1.7
Radico Khaitan RADC.NS 284 118.45 161.58 36.4 Not rated Mar 19.9 16.7 2.1 7.9 6.3 2.7 3.6 11.6 (3.9)
Rain Commodities RACL.NS 232 37.30 130.38 249.6 Not rated Dec 2.0 2.0 0.6 0.6 13.9 6.9 2.1 (1.6) 0.3
Rajesh Ex ports REXP.NS 644 120.75 193.77 60.5 Not rated Mar 12.5 48.1 1.5 5.6 7.8 2.9 (0.1) (4.6) (7.4)
Rallis India RALL.NS 480 136.50 155.45 13.9 Not rated Mar 25.1 19.6 6.2 4.5 11.9 7.4 (0.4) 9.7 2.0
Rashtriy a Chems. RSTC.NS 531 53.25 129.45 143.1 Not rated Mar 11.2 43.8 1.3 5.0 2.5 (0.7) 2.8 (3.3) (8.4)
Raymond RYMD.NS 394 355.05 537.00 51.2 Not rated Mar 16.7 13.5 1.6 1.5 4.1 (2.2) 4.3 (0.7) (6.3)
Redington REDI.NS 527 73.15 139.87 91.2 Not rated Mar 10.6 8.7 2.3 1.8 10.8 5.0 3.8 8.3 (6.2)
Reliance Capital RLCP.NS 1,508 339.70 183.73 (45.9) Not rated Mar 20.0 13.5 0.8 0.7 (1.3) (11.0) 3.3 (4.0) (1.4)
Rolta India ROLT.NS 216 74.20 196.34 164.6 Not rated Jun 3.5 3.7 0.7 0.6 9.0 3.1 14.7 12.3 (0.5)
Ruchi Soy a Industries RCSY.NS 486 80.70 107.78 33.6 Not rated Mar 11.4 45.3 0.9 3.5 4.0 (1.5) (2.8) (6.0) (13.9)
SKNL SKMK.NS 97 18.10 139.75 672.1 Not rated Mar 1.4 1.3 0.2 1.1 7.9 2.2 1.4 (21.3) (49.7)
Sadbhav Engineering SADE.NS 356 130.95 62.60 (52.2) Not rated Mar 15.6 15.9 1.7 6.1 3.8 (1.5) 1.5 (1.1) (4.9)
SAOL SNWR.NS 286 45.55 31.82 (30.1) Not rated Mar 44.7 169.2 5.2 19.0 5.9 2.4 4.6 19.9 38.4
SJVN SJVN.NS 1,409 18.85 37.61 99.5 Not rated Mar 7.6 7.4 1.0 0.9 6.5 1.3 (1.3) (8.0) (1.8)
Satyam Computer Services SATY.NS 2,247 105.65 92.00 (12.9) NEUTRAL Mar 13.2 10.2 4.7 3.2 14.9 9.8 7.0 12.8 38.6
Shipping Corp. SCI.NS 432 51.35 97.71 90.3 Not rated Mar (14.1) (4.1) 0.4 0.3 (4.9) (11.9) 2.7 (4.6) (1.7)
Shopper's Stop SHOP.NS 527 351.85 104.38 (70.3) Not rated Mar 114.1 87.4 7.2 4.7 2.2 (3.6) 1.0 (2.6) 14.6
Shree Cement SHCM.NS 2,180 3463.30 5515.93 59.3 Not rated Mar 42.0 20.0 5.1 19.5 6.0 2.1 2.5 8.1 29.8
Shree Renuka Sugars SRES.NS 392 32.35 46.32 43.2 Not rated Mar n.a. 14.1 n.a. 0.8 4.7 (2.3) 1.9 (1.8) 16.4
Calendarized Calendarized Share price performance
P/E (x) P/B (x) Rs term (%)
* Include the small-cap stocks in HOLT® database with market cap between US$150 mn and US$2 bn. For stocks that are Not Rated, I/B/E/S consensus forecast are used. CFROI® is a
registered trademark in the United States and other countries (excluding the United Kingdom) of Credit Suisse or its subsidiaries or affiliates.
* Companies in bold and italic indicate constituents of Credit Suisse India Small Cap Index.

14 S
ep
tem
ber 2
01
2
David
& G
olia
th
41
Valuations of Credit Suisse India small-cap watch list* Market CS target/ Potential Credit Year HOLT CFROI
Cap Price HOLT warranted return Suisse end CFROI Spread
Company RIC (US$ mn) (Rs) price (Rs) (%) Rating month 2011 2012 2011 2012 (%) (%) 1W 1M 3M
Simplex Infra. SINF.NS 166 185.40 240.00 29.4 NEUTRAL Mar 8.7 8.0 0.8 0.8 4.4 (2.2) (3.0) (6.7) (13.2)
Sintex Industries SNTX.NS 282 57.10 158.35 177.3 Not rated Mar 4.0 4.6 0.6 2.1 7.2 2.5 3.3 (6.3) (2.2)
SKF India SKFB.NS 621 651.90 1065.32 63.4 Not rated Dec 16.5 14.2 3.4 2.9 7.4 3.2 6.2 7.0 5.0
Sobha Developers SOBH.NS 583 328.80 334.00 1.6 OUTPERFORM Mar 16.4 13.4 1.6 1.5 7.0 1.4 (2.0) (6.2) 8.4
Solar Industries SLIN.NS 322 984.90 1725.15 75.2 Not rated Mar n.a. 14.1 n.a. 3.5 11.9 7.0 1.6 1.3 12.9
South Indian Bank SIBK.NS 443 21.60 22.78 5.4 Not rated Mar n.a. 5.4 n.a. 1.0 15.6 3.4 1.2 (5.7) (9.1)
SpiceJet SPJT.BO 289 33.05 63.36 91.7 Not rated Mar (5.5) (14.0) 15.3 538.5 5.7 0.5 13.4 (6.8) (1.6)
Srei Infra. SREI.NS 205 22.55 11.54 (48.8) Not rated Mar n.a. 9.3 n.a. 0.3 (2.8) (14.4) (1.1) (1.1) 3.4
SRF SRFL.NS 229 220.30 1291.44 486.2 Not rated Mar 3.2 2.8 0.7 0.6 6.2 0.4 3.3 2.6 7.0
State Bank Of My sore SBKM.NS 389 460.15 490.40 6.6 Not rated Mar n.a. 5.2 n.a. 0.5 2.5 (9.5) (0.9) (0.0) (7.2)
State Bank Of Trav ancore SBKT.NS 440 486.95 513.92 5.5 Not rated Mar n.a. 4.1 n.a. 0.6 5.9 (5.9) 1.2 (0.6) (3.7)
State BankOf Bin.& Jaipur SBKB.NS 424 334.95 544.39 62.5 Not rated Mar n.a. 3.2 n.a. 0.5 13.6 1.8 1.7 (5.5) (9.5)
State Trdg.Corp.Of India STCI.NS 290 267.95 160.01 (40.3) Not rated Mar (42.6) (93.0) 2.2 8.5 3.7 (0.8) 2.3 (3.7) 4.9
Sterlite Technologies STTE.NS 216 30.40 60.51 99.0 Not rated Mar 15.5 13.8 0.9 3.4 3.9 0.2 8.8 (2.6) (3.5)
Strides Arcolab STAR.NS 962 906.25 984.63 8.6 Not rated Dec 23.4 19.1 3.9 4.2 13.0 6.6 5.8 16.2 28.1
SPARC SPRC.NS 337 78.85 33.79 (57.2) Not rated Mar n.a. (23.0) n.a. (20.9) (3.5) (7.8) 9.6 3.7 15.5
Sun TV Network SUTV.NS 2,182 306.50 402.05 31.2 Not rated Mar 16.7 16.7 4.1 15.3 41.4 38.4 0.8 1.5 20.4
Sundram SNFS.NS 164 43.15 101.08 134.3 Not rated Mar 7.5 29.4 1.4 5.4 4.2 (0.4) (4.2) (9.9) (11.1)
Supreme SUPI.NS 655 285.55 392.64 37.5 Not rated Jun 16.6 14.3 5.8 4.8 14.9 11.7 1.0 5.7 34.9
Suzlon Energy SUZL.NS 512 15.95 5.71 (64.2) Not rated Mar (4.5) (3.9) 0.5 0.6 4.1 (2.8) 4.9 (9.9) (10.6)
Swan Energy SWAN.NS 240 139.85 72.13 (48.4) Not rated Mar 28.7 28.4 7.5 29.2 14.1 11.0 6.3 2.6 4.8
Sy ndicate Bank SBNK.NS 1,008 92.65 97.18 4.9 Not rated Mar 4.2 3.7 n.a. 0.5 2.4 (8.4) (1.4) (1.9) (9.5)
TVS Motor TVSM.NS 332 38.65 81.29 110.3 Not rated Mar 12.6 10.1 n.a. 2.5 4.5 (1.0) 1.7 (2.9) 15.4
Tata Chemicals TTCH.NS 1,480 321.45 433.86 35.0 Not rated Mar 10.3 9.2 1.3 1.3 7.1 0.9 2.4 4.3 2.7
Tata Communications TATA.NS 1,223 237.55 9.74 (95.9) Not rated Mar (8.6) (9.8) 2.6 2.9 (3.6) (10.7) 4.0 0.1 6.7
Tata Global Beverages TAGL.NS 1,496 133.90 77.66 (42.0) Not rated Mar 25.0 21.5 1.9 1.8 8.4 3.5 (1.3) (0.9) 23.4
Tata Inv estment TINV.NS 428 429.75 136.05 (68.3) Not rated Mar n.a. 13.8 n.a. 1.1 1.6 (10.4) 0.9 (2.0) (4.4)
Tata Tele Ma TTML.NS 370 10.80 1.84 (83.0) Not rated Mar (5.6) (4.1) (2.8) (10.8) (19.5) (24.8) (2.3) (12.2) (23.1)
Td Power Systems TDPS.NS 150 249.20 416.94 67.3 Not rated Mar n.a. 12.8 n.a. 1.5 9.9 5.6 (7.5) (9.9) (15.5)
Calendarized Calendarized Share price performance
P/E (x) P/B (x) Rs term (%)
* Include the small-cap stocks in HOLT® database with market cap between US$150 mn and US$2 bn. For stocks that are Not Rated, I/B/E/S consensus forecast are used. CFROI® is a
registered trademark in the United States and other countries (excluding the United Kingdom) of Credit Suisse or its subsidiaries or affiliates.
* Companies in bold and italic indicate constituents of Credit Suisse India Small Cap Index.

14 S
ep
tem
ber 2
01
2
David
& G
olia
th
42
Valuations of Credit Suisse India small-cap watch list* Market CS target/ Potential Credit Year HOLT CFROI
Cap Price HOLT warranted return Suisse end CFROI Spread
Company RIC (US$ mn) (Rs) price (Rs) (%) Rating month 2011 2012 2011 2012 (%) (%) 1W 1M 3M
Texmaco Rail TEXA.NS 182 55.35 147.00 165.6 Not rated Mar 10.1 9.2 1.9 7.0 15.4 12.5 12.6 7.3 (1.2)
Thermax THMX.NS 1,059 491.80 414.07 (15.8) Not rated Mar 14.7 16.7 3.8 3.1 14.4 9.9 1.3 (1.7) 8.2
Thomas Cook THOM.NS 221 57.35 84.65 47.6 Not rated Dec 21.6 17.5 3.1 2.8 9.6 4.4 (2.2) (5.4) (9.4)
Time Tech TIME.NS 152 40.15 102.09 154.3 Not rated Mar 8.2 8.0 1.1 4.0 7.0 2.8 10.9 (4.2) (13.9)
Timken TIMK.NS 226 196.60 316.17 60.8 Not rated Mar n.a. 14.9 n.a. 3.6 8.7 4.5 0.2 (0.2) (2.9)
Torrent Pharma TORP.NS 1,074 702.45 745.00 6.1 OUTPERFORM Mar 17.2 15.0 5.2 4.2 8.8 4.0 (0.2) 2.4 15.3
Torrent Power TOPO.NS 1,385 162.25 273.13 68.3 Not rated Mar 6.4 8.3 1.4 1.2 10.0 4.3 (9.8) 3.9 (14.3)
Trent TREN.NS 617 1053.20 391.81 (62.8) Not rated Mar n.a. (811.7) n.a. 2.1 (1.6) (7.1) 2.3 (0.6) 15.3
TTK Prestige TTKL.NS 697 3408.45 2968.76 (12.9) Not rated Mar 36.4 28.4 14.8 10.6 20.5 16.1 2.0 (8.2) 12.7
Tube Investments Of India TUBE.NS 531 157.80 213.95 35.6 Not rated Mar 12.3 9.8 2.4 1.7 8.1 1.0 (0.3) 2.1 13.7
Tulip Telecom TULP.NS 180 68.75 113.84 65.6 Not rated Mar 3.2 7.4 0.6 2.4 9.2 4.5 (22.0) (35.4) (25.4)
UCO Bank UCBK.NS 796 66.25 107.98 63.0 Not rated Mar 4.5 4.0 0.6 0.5 10.0 (0.9) 3.8 (1.3) (17.0)
Unichem Lab UNLB.NS 319 194.95 329.92 69.2 Not rated Mar 21.6 17.7 2.3 8.8 8.2 5.4 5.9 16.2 50.6
Unitech UNTE.NS 960 20.30 30.00 47.8 NEUTRAL Mar 9.8 8.0 0.4 0.4 4.4 (0.1) 10.3 (5.6) (11.2)
United Bank Of India UBOI.NS 352 54.00 81.95 51.8 Not rated Mar 3.4 3.0 0.4 0.4 6.7 (5.3) 5.8 (0.2) (20.2)
United Brew eries UBBW.NS 2,975 622.75 193.61 (68.9) Not rated Mar 97.0 77.8 13.0 49.7 5.9 2.6 (1.0) 9.9 20.8
United Phosphorus UNPO.NS 1,024 124.35 207.25 66.7 Not rated Mar 10.3 8.4 1.4 1.3 6.8 1.1 2.1 3.6 9.1
United Spirits UNSP.NS 2,250 951.95 326.99 (65.7) Not rated Mar 29.3 32.7 2.8 11.1 10.1 5.6 (3.8) 3.4 40.3
Usha Martin USBL.NS 126 22.95 83.16 262.4 Not rated Mar 18.9 17.6 0.4 0.3 1.7 (5.0) 2.0 (14.7) (8.2)
VIP Industries VIPI.NS 210 82.20 76.18 (7.3) Not rated Mar 14.4 17.9 5.2 19.9 11.4 8.1 10.8 2.1 3.5
Va Tech Wabag VATE.NS 217 453.00 878.60 94.0 Not rated Mar 17.3 14.2 n.a. 1.5 8.2 3.3 (1.6) (6.5) 3.9
Vardhman Textiles VART.NS 263 228.95 585.12 155.6 Not rated Mar 5.8 6.4 0.7 0.6 1.3 (5.3) 8.0 (2.0) 5.7
Videocon Industries VEDI.NS 1,038 180.30 -158.74 (188.0) Not rated Dec (4.0) (4.0) 0.7 0.6 (1.9) (9.4) 3.9 6.5 3.8
Vijaya Bank VJBK.NS 428 47.75 56.25 17.8 Not rated Mar 5.0 4.7 0.6 0.5 7.4 (4.2) 2.4 (8.3) (19.4)
Voltas VOLT.NS 668 111.80 83.00 (25.8) UNDERPERFORM Mar 10.7 12.0 2.6 2.2 11.0 6.2 2.1 2.7 7.5
VST Industries VSTI.NS 477 1711.10 2055.27 20.1 Not rated Mar 20.2 16.3 9.3 8.2 24.4 20.2 2.6 (4.2) (7.1)
WABCO WABC.NS 549 1601.80 1995.85 24.6 Not rated Mar 20.7 17.8 6.2 4.9 16.0 11.7 0.1 6.7 4.3
Welspun WGSR.NS 416 100.05 254.03 153.9 Not rated Mar 5.3 7.2 0.5 2.0 8.0 3.0 2.8 (1.9) (17.3)
Whirlpool Of India WHIR.NS 573 249.90 289.64 15.9 Not rated Mar n.a. 21.3 n.a. 5.8 8.8 4.2 (1.7) (1.5) 23.7
Wockhardt WCKH.NS 2,642 1336.20 1676.84 25.5 Not rated Mar n.a. 15.6 n.a. 23.0 16.6 10.6 4.4 11.1 55.3
P/E (x) P/B (x) Rs term (%)
Calendarized Calendarized Share price performance
* Include the small-cap stocks in HOLT® database with market cap between US$150 mn and US$2 bn. For stocks that are Not Rated, I/B/E/S consensus forecast are used. CFROI® is a
registered trademark in the United States and other countries (excluding the United Kingdom) of Credit Suisse or its subsidiaries or affiliates.
* Companies in bold and italic indicate constituents of Credit Suisse India Small Cap Index.

14 S
ep
tem
ber 2
01
2
David
& G
olia
th
43
Valuations of Credit Suisse India small-cap watch list* Market CS target/ Potential Credit Year HOLT CFROI
Cap Price HOLT warranted return Suisse end CFROI Spread
Company RIC (US$ mn) (Rs) price (Rs) (%) Rating month 2011 2012 2011 2012 (%) (%) 1W 1M 3M
Wy eth WLED.NS 406 989.15 2246.84 127.1 Not rated Mar n.a. 12.8 n.a. 4.1 18.8 14.6 5.8 7.6 16.3
Yes Bank YESB.NS 2,179 339.05 320.00 (5.6) UNDERPERFORM Mar 13.0 11.8 2.7 2.0 14.4 4.5 3.7 (6.3) (2.0)
Zensar Technologies ZENT.NS 220 279.60 688.27 146.2 Not rated Mar 8.0 6.3 2.2 1.9 14.3 8.5 12.1 6.2 20.5
Zydus Wellness ZYDS.NS 291 412.30 422.61 2.5 Not rated Mar 24.5 22.0 9.2 6.3 29.0 24.8 4.5 (1.7) 4.2
Calendarized Calendarized Share price performance
P/E (x) P/B (x) Rs term (%)
* Include the small-cap stocks in HOLT® database with market cap between US$150 mn and US$2 bn. For stocks that are Not Rated, I/B/E/S consensus forecast are used. CFROI® is a
registered trademark in the United States and other countries (excluding the United Kingdom) of Credit Suisse or its subsidiaries or affiliates.
* Companies in bold and italic indicate constituents of Credit Suisse India Small Cap Index.

14 S
ep
tem
ber 2
01
2
David
& G
olia
th
44
India – Screening Absolute price performance - top & bottom 10 companies Absolute price performance - top & bottom 10 companies Absolute price performance - top & bottom 10 companies
Price 1W return Price 1M return Price 3M return Company RIC (Rs) (%) Company RIC (Rs) (%) Company RIC (Rs) (%)
Winners Winners Winners Muthoot Finance MUTT.NS 163.70 24.6 Pipavav Defence PIPA.NS 75.65 31.9 MTNL MTNL.NS 39.40 69.1 Jubilant Life Sciences JULS.NS 210.90 17.3 Jubilant Life Sciences JULS.NS 210.90 28.6 Manappuram Finance MNFL.NS 37.65 68.8 Polaris Financial Tech. POLF.NS 139.90 15.2 Muthoot Finance MUTT.NS 163.70 26.6 Wockhardt WCKH.NS 1,336.20 55.3 Rolta India ROLT.NS 74.20 14.7 Alembic Pharm. ALEM.NS 73.50 23.5 Unichem Lab UNLB.NS 194.95 50.6 CMC CMC.NS 1,109.15 14.6 Polaris Financial Tech. POLF.NS 139.90 22.7 JK Cement JKCE.NS 217.85 50.1 Jaiprakash Power JAPR.NS 30.20 13.5 Aurobindo Pharma ARBN.NS 128.40 22.3 Eclerx ECLE.NS 888.70 44.2 SpiceJet SPJT.BO 33.05 13.4 NIIT NITT.NS 312.75 21.3 Alembic Pharm. ALEM.NS 73.50 43.4 Eclerx ECLE.NS 888.70 12.9 Jyothy Lab JYOI.NS 164.75 20.9 Jyothy Lab JYOI.NS 164.75 43.3 Texmaco Rail TEXA.NS 55.35 12.6 SAOL SNWR.NS 45.55 19.9 Financial Techs. FITE.NS 907.85 40.5 Glodyne Technoserve GLDY.NS 92.45 12.4 Amara Raja AMAR.NS 379.95 19.4 United Spirits UNSP.NS 951.95 40.3
Losers Losers Losers Tulip Telecom TULP.NS 68.75 (22.0) Kemrock KEMR.NS 76.50 (69.5) Kemrock KEMR.NS 76.50 (84.6) Kemrock KEMR.NS 76.50 (18.7) Tulip Telecom TULP.NS 68.75 (35.4) Glodyne Technoserve GLDY.NS 92.45 (75.8) Torrent Power TOPO.NS 162.25 (9.8) Alok Industries ALOK.NS 10.95 (31.8) SKNL SKMK.NS 18.10 (49.7) Td Power Systems TDPS.NS 249.20 (7.5) Jain Irrigation Systems JAIR.NS 60.00 (30.8) Gokul Refoils GOKU.NS 42.25 (46.8) Prism Cement PRIS.NS 49.45 (7.0) Glodyne Technoserve GLDY.NS 92.45 (26.0) Alok Industries ALOK.NS 10.95 (40.0) Coromandel CORF.NS 277.45 (6.9) Praj Industries PRAJ.NS 40.60 (23.8) Parsvnath Developers PARV.NS 38.40 (30.8) Alok Industries ALOK.NS 10.95 (6.8) NCC NCCL.NS 32.05 (22.1) Praj Industries PRAJ.NS 40.60 (28.0) Balmer Lawrie BLMR.NS 575.80 (6.8) SKNL SKMK.NS 18.10 (21.3) BEML BEML.NS 271.75 (27.9) Gujarat Inds.Power GJIP.NS 67.15 (6.1) Housing Dev.&.Infra. HDIL.NS 69.30 (19.3) Tulip Telecom TULP.NS 68.75 (25.4) Prestige Estates Projects PREG.NS 113.05 (5.8) Lanco Infratech LAIN.NS 10.70 (17.1) GVK Power &.Infr. GVKP.NS 11.05 (23.8)
Price-to-earnings - most & least expensive 10 companies Price-to-book - most & least expensive 10 companies CFROI® Spread - top & bottom 10 companies
Price 12 P/E Price 12 P/B Price CFROI® Spread Company RIC (Rs) (x) Company RIC (Rs) (x) Company RIC (Rs) (%)
Winners Winners Winners SKNL SKMK.NS 18.10 1.3 Kemrock KEMR.NS 76.50 0.2 Sun TV Network SUTV.NS 306.50 38.4 Glodyne Technoserve GLDY.NS 92.45 1.4 Housing Dev.&.Infra. HDIL.NS 69.30 0.2 Emami EMAM.NS 507.50 29.5 Kemrock KEMR.NS 76.50 1.6 AAL AMTK.NS 87.40 0.3 Eclerx ECLE.NS 888.70 28.3 Rain Commodities RACL.NS 37.30 2.0 NCC NCCL.NS 32.05 0.3 CRISIL CRSL.NS 929.40 26.1 Alok Industries ALOK.NS 10.95 2.2 Shipping Corp. SCI.NS 51.35 0.3 Muthoot Finance MUTT.NS 163.70 25.2 SRF SRFL.NS 220.30 2.8 Usha Martin USBL.NS 22.95 0.3 Zydus Wellness ZYDS.NS 412.30 24.8 United Bank Of India UBOI.NS 54.00 3.0 Srei Infra. SREI.NS 22.55 0.3 Engineers India ENGI.NS 236.30 22.7 Allahabad Bank ALBK.NS 120.55 3.0 Central Bank Of India CBI.NS 62.40 0.3 Glodyne Technoserve GLDY.NS 92.45 20.6 State Bank Of Bin.& Jaipur SBKB.NS 334.95 3.2 United Bank Of India UBOI.NS 54.00 0.4 VST Industries VSTI.NS 1,711.10 20.2 Housing Dev.&.Infra. HDIL.NS 69.30 3.2 Unitech UNTE.NS 20.30 0.4 Page Industries PAGE.NS 3,281.70 19.9
Losers Losers Losers Chettinad Cement CHET.NS 796.70 268.8 SpiceJet SPJT.BO 33.05 538.5 Max India MAXI.NS 192.30 (39.8) Max India MAXI.NS 192.30 224.1 Fert.& Chems.Travancore FCTL.NS 27.85 51.7 Tata Tele Ma TTML.NS 10.80 (24.8) SAOL SNWR.NS 45.55 169.2 United Breweries UBBW.NS 622.75 49.7 Piramal Healthcare PIRA.NS 472.30 (18.6) Fortis Healthcare FOHE.NS 96.50 151.5 Jet Airways JET.NS 361.15 34.3 MTNL MTNL.NS 39.40 (18.2) Astrazeneca Pharma ASTR.NS 1,782.65 132.9 Swan Energy SWAN.NS 139.85 29.2 Srei Infra. SREI.NS 22.55 (14.4) National Fertilizers NAFT.NS 75.30 100.1 Wockhardt WCKH.NS 1,336.20 23.0 JM Financial JMSH.NS 14.65 (14.0) Asian Star ASAN.BO 629.00 97.6 Astrazeneca Pharma ASTR.NS 1,782.65 21.9 India Infoline IIFL.NS 59.35 (12.2) Shopper's Stop SHOP.NS 351.85 87.4 Jubilant Foodworks JUBI.NS 1,212.95 20.9 Development Credit Bank DCBA.NS 40.70 (12.1) Basf India BASF.NS 664.35 83.0 VIP Industries VIPI.NS 82.20 19.9 Blue Star BLUS.NS 166.10 (11.9) United Breweries UBBW.NS 622.75 77.8 Shree Cement SHCM.NS 3,463.30 19.5 Magma Fincorp MAGM.NS 61.65 (11.9)
* For stocks that are not rated, I/B/E/S consensus forecast numbers are used. CFROI® Spread is the difference between CFROI® and market implied discount rate. A larger number indicates
that more value is created by a company.

14 September 2012
David & Goliath 45
Indonesia – Company updates ACE Hardware (ACES.JK, Rp6250.00, N, TP Rp5500.00) Mitra Adiperkasa (MAPI.JK, Rp7100.00, O [V], TP
Rp8400.00)
Consistently delivering results
■ We recently met with the ACE’s management and found that the
new franchise regulation launched last week will not be
applicable to it as it operates under license agreement, and not
as a franchise.
■ Although the situation might change, for now, ACES assures that
the business is not affected.
■ We are still waiting for another regulation to be issued that will
control company-owned outlets, and manage sub-franchise
arrangements. The new planned regulation will limit number of
company-owned outlets to 100-150 franchise outlets, for example
as of July 2012, ACES owned around 67 stores, with a total store
area of 188,000 sqm. Based on Antara news, (3 September
2012), this planned regulation is still being discussed between
the Ministry of Trade and industry players. Thus, we are waiting
for more clarity.
■ We maintain our NEUTRAL rating on the stock, and maintain our
target price of Rp5,500, implying 25.7x FY12E P/E and 0.88x
FY12E PEG ratio, on the back of 22% earnings CAGR 2012-14E.
MAPI’s F&B business may have limited impact from recent regulation
■ We recently spoke to the management on the recent changes on
franchise regulation. We found that most of MAPI’s brands are
under license agreement, except its F&B brands that hold
franchise agreement. Thus, we believe impact would be limited.
■ Under the new regulation, MAPI would need to meet the required
80% minimum of local content. The company believes they have
met most of the criteria required, and if needed, they may request
for special permit from the minister to be exempted. Thus, we
believe the impact would be relatively limited and manageable.
■ We still await another regulation that will control the company-
owned outlet, and manage sub-franchise arrangement to be
issued, in which it will limit the number of company-owned
franchise outlets at maximum between 100 and 150. It is still
under discussion between the Ministry of Trade and the industry
players. Thus, we are waiting for more clarity.
■ We maintain our OUTPERFORM rating and our target price of
Rp8,400, implying 28.3x FY12E P/E, 0.77x FY12E PEG ratio,
with 23% earnings CAGR over 2012–14E.
Bbg/RIC 6,000.00
5,500 (5,500)
1,715.00 (8)
1.1
—
Free float (%) 33.9 Performance 1M 3M 12M
Absolute (%) (1.6) 16.5 87.5
Relativ e (%) (3.1) 8.0 83.9
Year 12/10A 12/11A 12/12E 12/13E 12/14E
1,690 2,495 3,104 3,821 4,589
248 416 536 655 790
171.0 285.1 367.4 452.8 546.9
100 166 214 264 319
n.a. n.a. 0 0 0
n.a. n.a. 205 259 325
10.6 66.8 28.8 23.3 20.8
60.2 36.1 28.0 22.7 18.8
0.2 0.9 0.4 0.5 0.7
40.0 24.2 18.6 15.0 12.2
10.2 8.5 6.7 5.3 4.3
18.3 25.7 26.8 26.2 25.2
-35.8 -17.1 -20.3 -24.1 -28.6
6200.0 - 3100.0
10,290.0/ 1.1
ROE (%)
Note1:Ace Hardware Indonesia retails tools, home improvement products, lawn and garden supplies, plumbing, furniture, sporting goods and pet supplies..
Mkt cap (Rp/US$ bn)Daily trad v al - 6m av g (US$ mn)
Major shareholders PT Kaw an Lama Sejahtera
Net debt(cash)/equity (%)
Rev enue (Rp bn)
52-w k range (Rp)
ACES IJ / ACES.JK
N (N)
Daily trad v ol - 6m av g (mn)
Rating (prev. rating)
Shares outstanding (mn)
Price (06 Sep 12 , Rp)
TP (prev. TP Rp)
Est. pot. % chg. to TP
EBITDA (Rp bn)
Net profit (Rp bn)
EPS (Rp)
- Change from prev . EPS (%)
- Consensus EPS (Rp)
EPS grow th (%)
P/E (x )
Div idend y ield (%)
EV/EBITDA (x )
P/B (x )
Bbg/RIC 7,050.00
8,400 (8,400)
1,660.00 19
2.6
—
Free float (%) 42.4 Performance 1M 3M 12M
Absolute (%) (3.4) 3.7 49.2
Relativ e (%) (4.7) (4.6) 45.8
Year 12/10A 12/11A 12/12E 12/13E 12/14E
4,712 5,890 7,301 8,691 10,245
711 898 1,091 1,273 1,484
201.1 360.4 493.3 605.5 751.2
121 217 297 365 453
n.a. n.a. 0 0 0
n.a. n.a. 283 359 444
22.6 79.3 36.9 22.7 24.1
58.2 32.5 23.7 19.3 15.6
0.2 0.3 0.5 0.7 0.9
17.5 14.0 11.4 9.6 8.0
8.0 6.5 5.2 4.2 3.4
14.6 22.1 24.5 24.3 24.4
49.7 46.2 30.7 20.4 6.4
7750.0 - 4000.0
11,703.0/ 1.2
ROE (%)
Note 1: ORD/ADR=50.00. Note 2: Mitra Adiperkasa Tbk operates department stores and specialty stores selling a broad range of goods.
Mkt cap (Rp/US$ bn)Daily trad v al - 6m av g (US$ mn)
Major shareholders PT Saty a Mulia Gema
Net debt(cash)/equity (%)
Rev enue (Rp bn)
52-w k range (Rp)
MAPI IJ / MAPI.JK
O (O) [V]
Daily trad v ol - 6m av g (mn)
Rating (prev. rating)
Shares outstanding (mn)
Price (07 Sep 12 , Rp)
TP (prev. TP Rp)
Est. pot. % chg. to TP
EBITDA (Rp bn)
Net profit (Rp bn)
EPS (Rp)
- Change from prev . EPS (%)
- Consensus EPS (Rp)
EPS grow th (%)
P/E (x )
Div idend y ield (%)
EV/EBITDA (x )
P/B (x )
Price performance vs. MSCI Indonesia Price performance vs. MSCI Indonesia
80
110
140
170
200
09/11 11/11 01/12 03/12 05/12 07/12 09/12
ACE Hardware MSCI Indonesia
80
110
140
170
200
09/11 11/11 01/12 03/12 05/12 07/12 09/12
Mitra Adiperkasa MSCI Indonesia
Dian Haryokusumo / Research Analyst / 62 21 255 37974 /
Extracted from The Asian Daily 10 Sep 2012
Dian Haryokusumo / Research Analyst / 62 21 255 37974 /
Extracted from The Asian Daily 10 Sep 2012

14 September 2012
David & Goliath 46
Indonesia – Company updates Lippo Cikarang (LPCK.JK, Rp3750.00, O [V], TP
Rp4500.00)
Surya Semesta Internusa (SSIA.JK, Rp1260.00, O [V], TP
Rp1580.00)
Mixing industrial with residential
■ We initiate coverage on LPCK with an OUTPERFORM rating and
a target price of Rp4,500/share. LPCK pursues a strategy of
township, providing water treatment, residential estates and other
facilities to its industrial land bank.
■ LPCK pursues a township strategy, which includes residential
estates and facilities including shopping mall, commercial centre
and international school, built in proximity to its industrial land
bank. Currently, it has 207 ha of residential land bank and 465 ha
of industrial land bank.
■ LPCK stands to benefit from increasing demand for industrial
estate on the back of upswing in Indonesia’s investment. The
company also benefits from higher purchasing power of
Indonesia on the back of the country’s robust economic growth,
supporting the demand and selling price of its residential estate.
■ Our target price for LPCK is based on its RNAV, derived from
DCF of its future cash flow. Our target price for LPCK implies
7.4x 2012E P/E and 6.2x 2013E P/E.
Additional land bank is the key
■ We initiate coverage of SSIA with an OUTPERFORM rating and
a target price of Rp1,580. We believe that the positive outlook of
industrial estates benefit SSIA with EBITDA contributions from
industrial estate increasing from 33% in 2010 to 75% by 2013E.
■ We expect EBITDA contribution from industrial land sales to
increase to 75% by 2013E on the back of surging demand for
industrial land bank. The other divisions, construction and
hospitality will benefit from Indonesia’s investment uptrend and
robust purchasing power growth.
■ The company has a solid reputation as an industrial estate
developer with high profile tenants. Our estimates assume the
company successfully adds 1,400ha net additional industrial land
bank in Bekasi by 2015. We believe that securing additional land
is imperative for SSIA.
■ Our target price for SSIA is based on the RNAV of the company,
derived from the DCF of its future cash flow. Our target price for
SSIA implies 11.6x 2012E P/E and 9.7x 2013E P/E.
Bbg/RIC 3,550.00
4,500 (NA)
696.00 27
6.1
2.0
Free float (%) 57.8 Performance 1M 3M 12M
Absolute (%) (2.1) 14.5 56.0
Relativ e (%) (3.4) 6.2 52.6
Year 12/10A 12/11A 12/12E 12/13E 12/14E
117.6 311.5 514.7 576.4 717.1
65.3 257.7 425.5 502.0 651.4
94 370 611 721 936
n.a. n.a. 0 0 0
n.a. n.a. 668 1,097 1,280
26.3 294.6 65.1 18.0 29.8
37.8 9.6 5.8 4.9 3.8
0.0 0.0 0.0 0.0 0.0
20.7 8.3 4.4 3.0 1.7
12.3 37.2 41.1 33.5 31.4
-6.3 12.5 -14.8 -41.4 -52.5
— — — — —
— — — — —
EPS grow th (%)
P/E (x )
Div idend y ield (%)
EV/EBITDA (x )
ROE (%)
Net debt(cash)/equity (%)
Net profit (Rp bn)
EPS (Rp)
- Change from prev . EPS (%)
- Consensus EPS (Rp)
Price (07 Sep 12 , Rp)
TP (prev. TP Rp)
Est. pot. % chg. to TP
52-w k range (Rp)
LPCK IJ / LPCK.JK
O (NA) [V]
Daily trad v ol - 6m av g (mn)
Rating (prev. rating)
Shares outstanding (mn)
4175.0 - 1240.0
2,470.8/ 0.3
NAV per share (Rp)
Note1:PT Lippo Cikarang Tbk operates in the industrial and real estate development activities. Through its subsidiaries, the company also provides public
transportation and recreational services..
Mkt cap (Rp/US$ bn)Daily trad v al - 6m av g (US$ mn)
Major shareholders PT. Kemuning Satiatama
Disc./(prem.) to NAV (%)
EBITDA (Rp bn)
Bbg/RIC 1,250.00
1,580 (NA)
4,705.25 26
35.3
3.9
Free float (%) 61.9 Performance 1M 3M 12M
Absolute (%) 11.6 40.4 194.1
Relativ e (%) 10.3 32.1 190.7
Year 12/10A 12/11A 12/12E 12/13E 12/14E
223.0 541.0 920.0 1,117.0 1,533.0
116.0 257.0 642.0 765.0 1,124.0
25 55 136 163 239
n.a. n.a. 0 0 0
n.a. n.a. 123 161 193
556.8 122.8 149.3 19.1 47.0
50.9 22.8 9.2 7.7 5.2
0.0 0.4 0.9 1.1 1.6
27.9 10.7 6.3 4.5 3.0
14.2 26.0 45.7 37.3 38.5
35.7 -7.3 -4.9 -34.4 -32.7
— — — — —
— — — — —
EPS grow th (%)
P/E (x )
Div idend y ield (%)
EV/EBITDA (x )
ROE (%)
Net debt(cash)/equity (%)
Net profit (Rp bn)
EPS (Rp)
- Change from prev . EPS (%)
- Consensus EPS (Rp)
Price (07 Sep 12 , Rp)
TP (prev. TP Rp)
Est. pot. % chg. to TP
52-w k range (Rp)
SSIA IJ / SSIA.JK
O (NA) [V]
Daily trad v ol - 6m av g (mn)
Rating (prev. rating)
Shares outstanding (mn)
1250.0 - 285.0
5,881.6/ 0.6
NAV per share (Rp)
Note1: PT Surya Semesta Internusa and its subsidiaries develop and manage industrial and residential real estates, provide construction services, and
manufacture building materials. The company also operates hotels and provides IT-related businesses.
Mkt cap (Rp/US$ bn)Daily trad v al - 6m av g (US$ mn)
Major shareholders PT Union Sampoerna
Disc./(prem.) to NAV (%)
EBITDA (Rp bn)
Price performance vs. MSCI Indonesia Price performance vs. MSCI Indonesia
60
100
140
180
220
09/11 11/11 01/12 03/12 05/12 07/12 09/12
Lippo Cikarang MSCI Indonesia
60
110
160
210
260
310
09/11 11/11 01/12 03/12 05/12 07/12 09/12
Surya Semesta Internusa MSCI Indonesia
Teddy Oetomo / Research Analyst / 6221 2553 7911 /
Extracted from The Asian Daily 11 Sep 2012
Teddy Oetomo / Research Analyst / 6221 2553 7911 /
Extracted from The Asian Daily 11 Sep 2012

14 September 2012
David & Goliath 47
Indonesia – Company updates Bekasi Fajar Industrial Estate (BEST.JK, Rp660.00, O [V],
TP Rp770.00)
Kawasan Industri Jababeka (KIJA.JK, Rp200.00, O, TP
Rp250.00)
BEST is getting even better
■ We initiate coverage on Bekasi Fajar with an OUTPERFORM
rating and a target price of Rp770/share. BEST is the purest play
in industrial estate in our coverage, and its primary land bank
should benefit from potential additional access ahead.
■ BEST’s industrial estate exhibits the qualities of best land bank
as it is closest to Soekarno Hatta International Airport, Tanjung
Priok ports, and Jakarta CBD. It also has the largest industrial
estate in the greater Jakarta area. We foresee robustness in its
industrial estate given the potential additional access.
■ As a pure play in industrial estate in our coverage, BEST is most
leveraged to the robust outlook of Indonesia’s investment cycle.
We foresee the potential for robust and sustainable growth in
selling price of industrial estate given the investment uptrend in
Indonesia.
■ Our TP is based on the RNAV of the company, derived from DCF
of its future cash flow. Our target price for BEST implies 16.6x
12E P/E and 8x 13E P/E. We believe its premium valuation to
local peers is justified, given its robust outlook and fundamentals.
Offering additional facilities
■ We initiate coverage on KIJA with an OUTPERFORM rating and
a target price of Rp250/share. As one of the oldest players in the
industry, KIJA’s industrial estate offers additional facilities (a
power plant and a dry port) hardly found with other competitors.
■ KIJA owns the largest gross industrial land bank (1,270ha)
among its peers. However, 570ha of its land bank is located in
Cilegon, 85 km west of Jakarta. Kota Jababeka, Cikarang, offers
one of the most complete facilities to its tenant. Arguably, it is the
only industrial estate with a power plant and a dry port.
■ We expect KIJA’s power plant to come on stream in 2012E,
which will provide additional income and support to the selling
price of its industrial land bank. Given its strategically-located
land bank and excellent additional facilities, KIJA is well-
positioned to benefit from the higher demand for industrial estate
as Indonesia’s investment uptrend continues.
■ Our target price for KIJA is based on its RNAV, derived from DCF
of its future cash flow. Our target price for KIJA implies 12.4x
2012E P/E and 8.6x 2013E P/E.
Bbg/RIC 640.00
770.00 (NA)
8,765.00 20
20.3
1.1
Free float (%) 20.1 Performance 1M 3M 12M
Absolute (%) 1.6 40.7 —
Relativ e (%) 0.3 32.3 —
Year 12/10A 12/11A 12/12E 12/13E 12/14E
100.0 161.0 499.0 937.0 1,083.0
109.0 119.6 407.4 842.2 991.2
12 14 46 96 113
n.a. n.a. 0 0 0
n.a. n.a. 48 86 107
1.8 9.7 240.7 106.7 17.7
51.5 46.9 13.8 6.7 5.7
0.0 0.0 1.8 4.1 4.9
57.7 36.0 11.9 5.6 4.0
16.1 14.5 38.9 56.0 45.8
21.3 21.3 25.9 -18.0 -49.1
— — — — —
— — — — —
EPS grow th (%)
P/E (x )
Div idend y ield (%)
EV/EBITDA (x )
ROE (%)
Net debt(cash)/equity (%)
Net profit (Rp bn)
EPS (Rp)
- Change from prev . EPS (%)
- Consensus EPS (Rp)
Price (07 Sep 12 , Rp)
TP (prev. TP Rp)
Est. pot. % chg. to TP
52-w k range (Rp)
BEST IJ / BEST.JK
O (NA) [V]
Daily trad v ol - 6m av g (mn)
Rating (prev. rating)
Shares outstanding (mn)
640.0 - 285.0
5,609.6/ 0.6
NAV per share (Rp)
Note1:PT Bekasi Fajar Industrial Estate is a real estate development and management company that develops industrial parks in Indonesia..
Mkt cap (Rp/US$ bn)Daily trad v al - 6m av g (US$ mn)
Major shareholders PT Argo Manunggal Land
Disc./(prem.) to NAV (%)
EBITDA (Rp bn)
Bbg/RIC 191.00
250.00 (NA)
19,817.00 31
59.3
1.3
Free float (%) 76.5 Performance 1M 3M 12M
Absolute (%) 1.6 (1.0) (3.0)
Relativ e (%) 0.3 (9.4) (6.5)
Year 12/10A 12/11A 12/12E 12/13E 12/14E
177.0 503.0 683.0 940.0 1,046.0
62.8 327.1 400.9 579.9 690.9
4.60 16.50 20.20 29.30 34.90
n.a. n.a. 0 0 0
n.a. n.a. 18.80 23.50 25.50
n.m. 262.3 22.6 44.6 19.1
41.9 11.6 9.4 6.5 5.5
0.0 0.0 0.0 0.0 0.0
28.1 10.2 7.1 4.4 3.4
3.8 12.7 10.8 13.8 14.3
70.6 39.1 27.0 8.7 -3.8
— — — — —
— — — — —
EPS grow th (%)
P/E (x )
Div idend y ield (%)
EV/EBITDA (x )
ROE (%)
Net debt(cash)/equity (%)
Net profit (Rp bn)
EPS (Rp)
- Change from prev . EPS (%)
- Consensus EPS (Rp)
Price (07 Sep 12 , Rp)
TP (prev. TP Rp)
Est. pot. % chg. to TP
52-w k range (Rp)
KIJA IJ / KIJA.JK
O (NA)
Daily trad v ol - 6m av g (mn)
Rating (prev. rating)
Shares outstanding (mn)
245.0 - 121.0
3,785.0/ 0.4
NAV per share (Rp)
Note1:PT Kawasan Industri Jababeka Tbk develops and sells industrial estates and its related facilities and services as well as develops and installs
water treatment plants, waste water management, utilities, and other facilities..
Mkt cap (Rp/US$ bn)Daily trad v al - 6m av g (US$ mn)
Major shareholders Meadow ood capital (23.5%)
Disc./(prem.) to NAV (%)
EBITDA (Rp bn)
Price performance vs. MSCI Indonesia Price performance vs. MSCI Indonesia
80
120
160
200
240
04/12 05/12 06/12 07/12 08/12 09/12
Bekasi Fajar Industrial Estate MSCI Indonesia
60
80
100
120
140
09/11 11/11 01/12 03/12 05/12 07/12 09/12
Kawasan Industri Jababeka MSCI Indonesia
Teddy Oetomo / Research Analyst / 6221 2553 7911 /
Extracted from The Asian Daily 11 Sep 2012
Teddy Oetomo / Research Analyst / 6221 2553 7911 /
Extracted from The Asian Daily 11 Sep 2012

14 S
ep
tem
ber 2
01
2
David
& G
olia
th
48
Valuations of Credit Suisse Indonesia small-cap watch list* Market CS target/ Potential Credit Year HOLT CFROI
Cap Price HOLT warranted return Suisse end CFROI Spread
Company RIC (US$ mn) (Rp) price (Rp) (%) Rating month 2011 2012 2011 2012 (%) (%) 1W 1M 3M
Ace Hardware ACES.JK 1,119 6,250 5,500 (12.0) NEUTRAL Dec 37.6 29.2 8.9 7.0 13.5 8.4 4.2 4.2 23.8
Adhi Karya ADHI.JK 173 920 989 7.5 Not rated Dec 8.9 8.7 1.6 1.6 7.0 (0.1) (1.1) 0.0 (1.1)
Adira Dinamika Finance ADMF.JK 1,060 10,150 27,033 166.3 Not rated Dec 6.4 4.9 2.3 1.9 29.0 20.4 (0.5) 1.5 1.5
Agung Podomoro Land APLN.JK 717 335 167 (50.1) Not rated Dec 11.8 9.5 1.6 1.3 5.4 (1.1) 1.5 4.7 3.1
AKR Corporindo AKRA.JK 1,538 3,825 2,811 (26.5) Not rated Dec 23.7 20.1 4.3 3.8 7.6 2.3 3.4 7.7 2.7
Alam Sutera Realty ASRI.JK 944 460 645 40.2 Not rated Dec 13.7 8.9 3.0 2.2 15.2 9.9 10.8 2.2 (16.4)
Aneka Tambang ANTM.JK 1,344 1,350 1,574 16.6 Not rated Dec 6.7 10.6 1.2 1.1 6.6 1.4 7.1 11.6 11.6
Asahimas Flat Glass AMFG.JK 310 6,850 8,423 23.0 Not rated Dec 8.8 80.2 1.4 1.3 2.4 (2.6) 3.0 12.3 28.0
Astra Graphia ASGR.JK 192 1,360 1,243 (8.6) Not rated Dec 13.2 10.9 3.3 3.3 7.0 1.6 3.8 4.6 10.6
Astra Otoparts AUTO.JK 1,550 3,850 2,538 (34.1) Not rated Dec 14.8 13.1 3.4 3.2 6.3 1.3 2.7 5.5 14.1
Bakrie & Brothers BNBR.JK 489 50 63 26.5 Not rated Dec 10.4 8.6 0.4 0.4 15.2 7.5 0.0 0.0 0.0
Bakrie Sumatera UNSP.JK 188 131 185 41.1 Not rated Dec 2.4 3.8 0.2 0.2 1.3 (6.3) 5.6 (9.0) (30.7)
Bakrie Telecom BTEL.JK 326 102 137 34.3 UNDERPERFORM Dec (3.7) (3.8) 0.7 0.8 (6.1) (12.8) (24.4) (34.2) (52.6)
Bakrieland Dev. ELTY.JK 232 51 28 (44.7) Not rated Dec (106.3) 53.5 0.2 0.2 (1.8) (8.7) 2.0 0.0 (35.4)
Bank Bukopin BBKP.JK 511 620 817 31.8 Not rated Dec 6.5 6.0 1.1 1.0 11.3 2.4 (1.6) (7.5) (3.1)
Bank Mayapada MAYA.JK 636 1,990 543 (72.7) Not rated Dec 35.9 31.8 3.7 3.2 4.4 (4.5) (0.5) (0.5) (20.4)
Bank Mega MEGA.JK 1,187 3,150 2,795 (11.3) Not rated Dec 10.0 9.0 2.4 1.8 15.5 6.8 (0.8) 1.6 (4.5)
Bank OCBC NISP NISP.JK 1,043 1,180 887 (24.8) Not rated Dec 11.6 11.8 1.3 1.2 6.5 (2.2) 5.4 9.3 3.5
Bank Pan Indonesia PNBN.JK 1,643 660 672 1.8 Not rated Dec 8.7 9.0 1.1 1.0 7.0 (1.5) (4.3) (1.5) (13.2)
Bank Jabar Banten BJBR.JK 1,092 1,090 1,200 10.1 OUTPERFORM Dec 11.0 8.8 2.0 1.9 11.0 2.4 0.9 10.1 25.3
Bank Permata BNLI.JK 1,307 1,400 1,183 (15.5) Not rated Dec 10.9 9.3 1.4 1.2 6.1 (2.4) (1.4) (2.1) (4.1)
Bank Tabungan Negara BBTN.JK 1,161 1,270 1,300 2.4 NEUTRAL Dec 9.9 9.5 1.7 1.4 9.0 0.4 (3.1) (5.9) 5.0
Barito Pacific BRPT.JK 361 495 3,217 549.9 Not rated Dec (37.0) (24.1) 0.5 0.5 (5.3) (11.7) 1.0 (2.9) (8.3)
Benakat Petroleum BIPI.JK 659 180 124 (31.3) Not rated Dec (88.2) 496.3 1.7 1.4 11.6 6.5 (0.6) (7.7) (5.8)
Bentoel Int'l. RMBA.JK 431 570 522 (8.5) Not rated Dec 13.5 12.7 1.8 1.9 6.0 (0.2) (1.7) (6.6) (1.7)
Berau Coal Energy BRAU.JK 714 196 1,131 477.3 Not rated Dec 5.4 2.4 1.7 1.8 25.6 19.8 (1.5) (33.6) (39.7)
Bhakti Investama BHIT.JK 1,417 405 138 (65.9) Not rated Dec 47.6 40.1 2.1 2.0 6.8 (2.0) 1.3 2.5 2.5
BISI BISI.JK 354 1,130 848 (25.0) Not rated Dec 23.1 14.1 2.6 2.5 6.8 1.8 6.6 (2.6) 44.9
Bno.Lumbung Energi &Mtl. BORN.JK 896 485 605 24.8 Not rated Dec 4.7 5.7 1.0 0.8 12.3 7.1 (3.0) 0.0 (11.8)
Share price performance
Rp term (%)P/B (x)P/E (x)
CalendarizedCalendarized
* Include the small-cap stocks in HOLT® database with market cap between US$150 mn and US$2 bn. For stocks that are Not Rated, I/B/E/S consensus forecast are used. CFROI® is a
registered trademark in the United States and other countries (excluding the United Kingdom) of Credit Suisse or its subsidiaries or affiliates.
* Companies in bold and italic indicate constituents of Credit Suisse Indonesia Small Cap Index

14 S
ep
tem
ber 2
01
2
David
& G
olia
th
49
Valuations of Credit Suisse Indonesia small-cap watch list* Market CS target/ Potential Credit Year HOLT CFROI
Cap Price HOLT warranted return Suisse end CFROI Spread
Company RIC (US$ mn) (Rp) price (Rp) (%) Rating month 2011 2012 2011 2012 (%) (%) 1W 1M 3M
Bumi Resources Minerals BRMS.JK 1,308 490 163 (66.8) Not rated Dec 17.8 455.8 0.9 0.8 (1.9) (7.2) 15.3 4.3 10.1
Bumi Serpong Damai BSDE.JK 1,827 1,000 1,277 27.7 Not rated Dec 20.8 15.7 2.5 2.4 7.7 2.8 2.0 (5.7) (21.3)
BW Plantation BWPT.JK 637 1,510 1,780 17.9 OUTPERFORM Dec 19.0 15.8 4.3 3.5 6.0 (0.1) 11.9 2.0 11.0
Ciputra Dev. CTRA.JK 1,061 670 438 (34.6) Not rated Dec 31.9 22.7 2.0 1.8 3.3 (1.9) 4.7 8.1 (5.6)
Citra Marga CMNP.JK 433 2,075 2,176 4.9 Not rated Dec 11.6 11.5 2.0 1.8 4.8 (1.3) 2.5 0.0 2.5
Clipan Finance CFIN.JK 156 395 560 41.8 Not rated Dec 4.1 4.6 0.7 0.6 9.8 0.8 (3.7) (8.1) 17.9
Delta Dunia Petroindo DOID.JK 209 245 (590) (340.9) Not rated Dec (12.0) 7.1 2.1 2.0 (1.1) (8.1) 4.3 (14.0) (30.0)
Energi Mega ENRG.JK 386 91 536 489.4 Not rated Dec 53.8 10.2 0.6 0.6 (3.2) (10.2) 11.0 (18.8) (32.1)
Enseval Putera EPMT.JK 469 1,660 1,886 13.6 Not rated Dec 12.3 11.1 1.8 1.8 9.6 4.4 3.1 2.5 32.8
Erajaya Swasembada ERAA.JK 621 2,050 2,000 (2.4) NEUTRAL Dec 23.3 14.8 2.8 2.3 10.3 4.6 0.0 (5.7) 13.3
Fajar Surya Wisesa FASW.JK 582 2,250 1,283 (43.0) Not rated Dec 42.1 35.4 3.1 3.0 (0.1) (5.8) 5.9 7.1 (6.3)
Fast Food FAST.JK 673 14,000 5,605 (60.0) Not rated Dec 27.7 23.6 7.8 6.3 9.9 3.4 12.9 0.0 7.7
Gajah Tunggal GJTL.JK 855 2,350 3,433 46.1 Not rated Dec 12.0 8.4 1.8 1.6 1.5 (4.6) (2.1) (6.9) 2.2
Garuda GIAA.JK 1,466 620 (36) (105.8) Not rated Dec 17.0 11.6 1.9 1.6 2.7 (5.5) 5.1 (8.8) (10.1)
Global Mediacom BMTR.JK 2,746 1,890 1,655 (12.4) Not rated Dec 32.6 20.3 3.1 3.0 7.2 1.9 5.0 6.2 39.0
Gozco Plantations GZCO.JK 132 210 103 (50.8) Not rated Dec 7.6 7.1 0.9 0.9 (0.2) (7.1) (2.3) (6.7) (2.9)
Greenwood GWSA.JK 195 240 318 32.4 Not rated Dec 9.1 4.6 1.6 0.9 9.4 3.8 4.3 (4.0) 9.1
Harum Energy HRUM.JK 1,764 6,250 8,000 28.0 OUTPERFORM Dec 10.6 9.2 5.3 2.6 35.2 30.6 5.0 5.0 14.7
Hero Supermarket HERO.JK 1,032 3,000 1,505 (49.8) Not rated Dec 36.1 29.2 6.9 6.0 6.6 (0.0) 1.7 (0.8) 2.6
Hexindo Adiperkasa HEXA.JK 697 7,950 8,567 7.8 Not rated Mar 10.4 11.1 4.2 3.0 22.9 17.7 (3.0) 13.6 (9.7)
Holcim SMCB.JK 2,060 2,575 2,800 8.7 NEUTRAL Dec 18.6 16.3 2.6 2.3 3.3 (1.8) 0.0 (7.2) 7.3
Indah Kiat Pulp & Paper INKP.JK 623 1,090 (1,042) (195.6) Not rated Dec 38.9 44.9 0.3 0.3 (1.2) (9.8) 5.8 (7.6) 7.9
Indika Energy INDY.JK 849 1,560 1,228 (21.3) Not rated Dec 7.3 6.3 1.3 1.1 0.2 (5.6) 0.0 (7.7) (8.2)
Indomobil Sukses Intsl. IMAS.JK 1,660 5,750 4,838 (15.9) Not rated Dec 16.5 14.5 3.4 3.1 6.0 0.3 (1.7) (6.5) (26.3)
Inov isi Infracom INVS.JK 1,717 6,400 2,137 (66.6) Not rated Dec 64.6 n.a. 10.2 n.a. 8.3 3.9 (0.8) 1.6 21.9
Intiland Development DILD.JK 346 320 584 82.4 Not rated Dec 22.9 7.7 0.9 0.8 3.6 (2.5) 6.7 4.9 (11.1)
Jakarta Int'l Hotels & Dev. JIHD.JK 165 680 859 26.3 Not rated Dec 74.1 17.2 0.8 0.7 0.3 (5.8) 0.0 (1.4) 13.3
Jakarta Setiabudi JSPT.JK 182 750 1,622 116.2 Not rated Dec 12.3 12.5 1.4 1.3 1.5 (5.0) 0.0 0.0 0.0
Japfa Comfeed JPFA.JK 957 4,300 3,872 (9.9) Not rated Dec 14.4 10.0 2.7 2.3 6.1 0.2 0.6 2.4 0.6
Calendarized Calendarized Share price performance
P/E (x) P/B (x) Rp term (%)
* Include the small-cap stocks in HOLT® database with market cap between US$150 mn and US$2 bn. For stocks that are Not Rated, I/B/E/S consensus forecast are used. CFROI® is a
registered trademark in the United States and other countries (excluding the United Kingdom) of Credit Suisse or its subsidiaries or affiliates.
* Companies in bold and italic indicate constituents of Credit Suisse Indonesia Small Cap Index

14 S
ep
tem
ber 2
01
2
David
& G
olia
th
50
Valuations of Credit Suisse Indonesia small-cap watch list* Market CS target/ Potential Credit Year HOLT CFROI
Cap Price HOLT warranted return Suisse end CFROI Spread
Company RIC (US$ mn) (Rp) price (Rp) (%) Rating month 2011 2012 2011 2012 (%) (%) 1W 1M 3M
Jaya Konstruksi JKON.JK 484 1,580 545 (65.5) Not rated Dec 34.4 30.7 5.5 5.1 6.8 1.2 (3.7) 0.0 2.6
Kawasan Indri.Jababeka KIJA.JK 414 200 250 25.0 OUTPERFORM Dec 12.1 9.9 1.1 1.0 4.6 (1.9) 4.7 8.1 11.7
Kimia Farma KAEF.JK 296 510 480 (5.8) Not rated Dec 16.5 15.0 2.3 2.1 5.5 0.2 2.0 2.0 5.2
Krakatau Steel KRAS.JK 1,087 660 474 (28.1) Not rated Dec 10.2 15.1 1.0 1.0 (0.8) (6.9) 0.0 (5.7) (10.8)
Lippo Karawaci LPKR.JK 2,193 910 719 (21.0) Not rated Dec 28.8 22.8 2.4 2.1 4.0 (1.6) 0.0 (7.1) 23.0
London Sumatra LSIP.JK 1,781 2,500 3,500 40.0 OUTPERFORM Dec 10.0 10.9 2.9 2.5 13.4 8.8 2.0 (9.1) 0.0
Mandom Indonesia TCID.JK 178 8,500 8,859 4.2 Not rated Dec 12.2 10.8 1.7 1.6 5.5 0.3 0.0 0.6 (5.6)
Matahari Putra MPPA.JK 856 1,470 693 (52.9) Not rated Dec 73.5 65.4 1.4 1.3 0.7 (5.6) 3.5 25.6 54.7
Mayora Indah MYOR.JK 1,829 22,850 11,681 (48.9) Not rated Dec 37.2 26.4 7.4 6.2 5.2 (0.5) 4.8 10.9 2.2
Medco Energi MEDC.JK 564 1,620 297 (81.7) Not rated Dec 5.9 12.1 0.6 0.5 0.5 (7.1) 0.0 (4.1) (11.5)
Merck MERK.JK 355 152,000 149,025 (2.0) Not rated Dec 14.7 17.6 6.9 8.2 25.2 20.2 0.0 3.6 4.8
Mitra Adiperkasa MAPI.JK 1,231 7,100 8,400 18.3 OUTPERFORM Dec 32.7 23.9 6.6 5.3 5.7 (1.0) 4.4 0.0 (0.7)
Multi Bintang MLBI.JK 1,560 709,000 343,801 (51.5) Not rated Dec 29.5 25.3 28.2 19.9 34.7 29.8 0.0 0.1 2.8
Multistrada Arah Sarana MASA.JK 384 400 89 (77.8) Not rated Dec 17.1 18.7 1.4 1.2 0.5 (6.7) 0.0 (13.0) (19.2)
Nippon Indosari ROTI.JK 544 5,150 3,334 (35.3) Not rated Dec 45.0 31.3 9.5 7.8 11.7 6.6 (1.0) 3.5 34.6
Nusantara Infra. META.JK 293 205 71 (65.2) Not rated Dec (103.5) (103.0) 2.9 3.1 0.4 (5.4) 0.0 6.2 0.0
Pabrik Kertas Tjiwi Kimia TKIM.JK 345 2,475 (1,759) (171.1) Not rated Dec 4.9 5.0 0.5 0.4 1.3 (7.4) (4.8) (7.5) (10.8)
Pakuwon Jati PWON.JK 1,131 225 216 (3.8) Not rated Dec 26.1 15.0 4.9 4.0 8.5 2.9 0.0 2.3 23.6
Panin Financial PNLF.JK 360 123 279 127.2 Not rated Dec 3.2 3.3 0.5 0.4 8.5 (0.4) (3.9) (4.7) 0.8
Pembangunan Jaya Ancol PJAA.JK 154 920 1,264 37.4 Not rated Dec 9.1 8.3 1.3 1.2 4.5 (1.2) (1.1) (4.2) (8.9)
Pembangunan Perumahan PTPP.JK 319 630 569 (9.7) Not rated Dec 12.6 11.0 2.1 2.0 10.4 3.6 5.0 (3.1) 12.5
Plaza Indonesia Realty PLIN.JK 686 1,850 448 (75.8) Not rated Dec 72.4 33.5 2.9 2.8 (1.5) (7.0) 0.0 0.0 19.4
Polaris Investama PLAS.JK 168 1,360 92 (93.2) Not rated Dec 680.0 551.5 8.4 8.2 (3.7) (12.9) 0.7 0.7 0.0
Polychem Indonesia ADMG.JK 126 310 583 88.1 Not rated Dec 4.2 3.0 0.5 0.5 (1.4) (8.4) 0.0 (13.9) (22.5)
Ciputra Property CTRP.JK 385 600 991 65.1 Not rated Dec 23.1 18.8 1.0 1.0 1.2 (4.2) 5.3 3.4 (10.4)
Dian Swastatika DSSA.JK 1,046 13,000 13,067 0.5 Not rated Dec 31.6 24.1 1.4 1.3 3.0 (2.1) 0.0 0.0 0.0
Malindo Feedmill MAIN.JK 251 1,420 2,051 44.4 Not rated Dec 11.7 7.6 5.7 4.9 12.4 5.9 0.0 (4.1) 12.7
Selamat Sempurna SMSM.JK 338 2,250 1,663 (26.1) Not rated Dec 16.1 14.0 5.3 4.3 9.0 3.4 4.7 11.1 20.3
Surya Esa ESSA.JK 251 2,400 558 (76.8) Not rated Dec 13.3 24.2 10.1 23.9 21.3 15.7 1.1 (4.0) (10.3)
Ramayana RALS.JK 793 1,070 847 (20.9) Not rated Dec 20.1 16.5 2.7 2.7 4.7 (0.8) 1.9 (6.1) 12.6
Calendarized Calendarized Share price performance
P/E (x) P/B (x) Rp term (%)
* Include the small-cap stocks in HOLT® database with market cap between US$150 mn and US$2 bn. For stocks that are Not Rated, I/B/E/S consensus forecast are used. CFROI® is a
registered trademark in the United States and other countries (excluding the United Kingdom) of Credit Suisse or its subsidiaries or affiliates.
* Companies in bold and italic indicate constituents of Credit Suisse Indonesia Small Cap Index

14 S
ep
tem
ber 2
01
2
David
& G
olia
th
51
Valuations of Credit Suisse Indonesia small-cap watch list* Market CS target/ Potential Credit Year HOLT CFROI
Cap Price HOLT warranted return Suisse end CFROI Spread
Company RIC (US$ mn) (Rp) price (Rp) (%) Rating month 2011 2012 2011 2012 (%) (%) 1W 1M 3M
Resource Alam KKGI.JK 300 2,875 12,702 341.8 Not rated Dec 6.4 5.9 4.4 3.9 41.6 36.7 (4.2) (14.8) (18.4)
Sampoerna Agro SGRO.JK 557 2,825 4,000 41.6 OUTPERFORM Dec 9.9 9.6 2.2 1.9 10.0 4.8 4.6 0.9 4.6
Sarana Menara TOWR.JK 2,163 20,300 19,500 (3.9) OUTPERFORM Dec 73.0 47.2 13.6 11.3 5.1 (1.3) (14.0) 11.5 31.0
Sumber Alfaria AMRT.JK 2,266 5,750 4,407 (23.3) Not rated Dec 54.7 40.6 13.5 7.4 12.6 7.4 0.9 4.5 15.0
Summarecon Agung SMRA.JK 1,170 1,630 656 (59.8) Not rated Dec 28.6 21.4 4.5 4.1 7.6 1.1 7.9 0.6 4.5
Surya Semesta SSIA.JK 619 1,260 1,580 25.4 OUTPERFORM Dec 23.0 9.2 5.3 3.5 8.3 1.9 1.6 17.8 29.9
Tempo Scan Pacific TSPC.JK 1,410 3,000 2,289 (23.7) Not rated Dec 23.8 19.4 4.5 4.1 11.4 6.5 9.1 12.1 10.1
Timah TINS.JK 757 1,440 1,569 8.9 Not rated Dec 8.1 10.9 1.6 1.6 7.8 2.8 11.6 9.9 7.5
Tower Bersama Infra. TBIG.JK 2,091 4,175 3,800 (9.0) NEUTRAL Dec 40.1 20.7 7.0 4.8 8.5 2.6 5.0 8.4 27.5
Tunas Baru Lampung TBLA.JK 268 520 564 8.5 Not rated Dec 5.9 5.4 1.6 1.4 5.5 (1.4) (3.7) 2.0 0.0
Tunas Ridean TURI.JK 489 840 758 (9.8) Not rated Dec 14.5 12.9 3.2 2.7 12.3 6.8 7.7 (3.4) 7.7
Ultrajaya Milk Ind. & Trco. ULTJ.JK 353 1,170 624 (46.7) Not rated Dec 33.4 27.0 2.4 2.4 (0.0) (5.4) 10.4 5.4 12.5
Wijaya Karya WIKA.JK 716 1,130 784 (30.6) Not rated Dec 18.6 15.4 3.2 2.7 5.7 (0.4) 1.8 3.7 15.3
Wintermar Offshore Marine WINS.JK 154 415 436 5.1 Not rated Dec 11.1 8.7 1.2 1.1 4.3 (2.6) (1.2) (3.5) 0.0
Calendarized Calendarized Share price performance
P/E (x) P/B (x) Rp term (%)
* Include the small-cap stocks in HOLT® database with market cap between US$150 mn and US$2 bn. For stocks that are Not Rated, I/B/E/S consensus forecast are used. CFROI® is a
registered trademark in the United States and other countries (excluding the United Kingdom) of Credit Suisse or its subsidiaries or affiliates.
* Companies in bold and italic indicate constituents of Credit Suisse Indonesia Small Cap Index

14 S
ep
tem
ber 2
01
2
David
& G
olia
th
52
Indonesia – Screening Absolute price performance - top & bottom 10 companies Absolute price performance - top & bottom 10 companies Absolute price performance - top & bottom 10 companies
Price 1W return Price 1M return Price 3M return Company RIC (Rp) (%) Company RIC (Rp) (%) Company RIC (Rp) (%)
Winners Winners Winners Bumi Resources Minerals BRMS.JK 490.00 15.3 Matahari Putra MPPA.JK 1,470.00 25.6 Matahari Putra MPPA.JK 1,470.00 54.7 Fast Food FAST.JK 14,000.00 12.9 Surya Semesta SSIA.JK 1,260.00 17.8 BISI BISI.JK 1,130.00 44.9 BW Plantation BWPT.JK 1,510.00 11.9 Hexindo Adiperkasa HEXA.JK 7,950.00 13.6 Global Mediacom BMTR.JK 1,890.00 39.0 Timah TINS.JK 1,440.00 11.6 Asahimas Flat Glass AMFG.JK 6,850.00 12.3 Nippon Indosari ROTI.JK 5,150.00 34.6 Energi Mega ENRG.JK 91.00 11.0 Tempo Scan Pacific TSPC.JK 3,000.00 12.1 Enseval Putera EPMT.JK 1,660.00 32.8 Alam Sutera Realty ASRI.JK 460.00 10.8 Aneka Tambang ANTM.JK 1,350.00 11.6 Sarana Menara TOWR.JK 20,300.00 31.0 Ultrajaya Milk Ind. & Trco. ULTJ.JK 1,170.00 10.4 Sarana Menara TOWR.JK 20,300.00 11.5 Surya Semesta SSIA.JK 1,260.00 29.9 Tempo Scan Pacific TSPC.JK 3,000.00 9.1 Selamat Sempurna SMSM.JK 2,250.00 11.1 Indosiar Karya Media IDKM.JK 5,550.00 29.1 Summarecon Agung SMRA.JK 1,630.00 7.9 Mayora Indah MYOR.JK 22,850.00 10.9 Asahimas Flat Glass AMFG.JK 6,850.00 28.0 Tunas Ridean TURI.JK 840.00 7.7 Bank Jabar Banten BJBR.JK 1,090.00 10.1 Tower Bersama Infra. TBIG.JK 4,175.00 27.5 Losers Losers Losers Bakrie Telecom BTEL.JK 102.00 (24.4) Bakrie Telecom BTEL.JK 102.00 (34.2) Bakrie Telecom BTEL.JK 102.00 (52.6) Sarana Menara TOWR.JK 20,300.00 (14.0) Berau Coal Energy BRAU.JK 196.00 (33.6) Berau Coal Energy BRAU.JK 196.00 (39.7) Pabrik Kertas Tjiwi Kimia TKIM.JK 2,475.00 (4.8) Energi Mega ENRG.JK 91.00 (18.8) Bakrieland Dev. ELTY.JK 51.00 (35.4) Bank Pan Indonesia PNBN.JK 660.00 (4.3) Resource Alam KKGI.JK 2,875.00 (14.8) Energi Mega ENRG.JK 91.00 (32.1) Resource Alam KKGI.JK 2,875.00 (4.2) Delta Dunia Petroindo DOID.JK 245.00 (14.0) Bakrie Sumatera UNSP.JK 131.00 (30.7) Panin Financial PNLF.JK 123.00 (3.9) Polychem Indonesia ADMG.JK 310.00 (13.9) Delta Dunia Petroindo DOID.JK 245.00 (30.0) Tunas Baru Lampung TBLA.JK 520.00 (3.7) Multistrada Arah Sarana MASA.JK 400.00 (13.0) Indomobil Sukses Intsl. IMAS.JK 5,750.00 (26.3) Clipan Finance CFIN.JK 395.00 (3.7) London Sumatra LSIP.JK 2,500.00 (9.1) Polychem Indonesia ADMG.JK 310.00 (22.5) Jaya Konstruksi JKON.JK 1,580.00 (3.7) Bakrie Sumatera UNSP.JK 131.00 (9.0) Bumi Serpong Damai BSDE.JK 1,000.00 (21.3) Bank Tabungan Negara BBTN.JK 1,270.00 (3.1) Garuda GIAA.JK 620.00 (8.8) Bank Mayapada MAYA.JK 1,990.00 (20.4)
Price-to-earnings - most & least expensive 10 companies Price-to-book - most & least expensive 10 companies CFROI® Spread - top & bottom 10 companies
Price 12 P/E Price 12 P/B Price CFROI® Spread Company RIC (Rp) (x) Company RIC (Rp) (x) Company RIC (Rp) (%)
Winners Winners Winners Berau Coal Energy BRAU.JK 196.00 2.4 Bakrie Sumatera UNSP.JK 131.00 0.2 Resource Alam KKGI.JK 2,875.00 36.7 Polychem Indonesia ADMG.JK 310.00 3.0 Bakrieland Dev. ELTY.JK 51.00 0.2 Surya Citra Media SCMA.JK 10,500.00 32.9 Panin Financial PNLF.JK 123.00 3.3 Indah Kiat Pulp & Paper INKP.JK 1,090.00 0.3 Harum Energy HRUM.JK 6,250.00 30.6 Bakrie Sumatera UNSP.JK 131.00 3.8 Bakrie & Brothers BNBR.JK 50.00 0.4 Multi Bintang MLBI.JK 709,000.00 29.8 Greenwood GWSA.JK 240.00 4.6 Panin Financial PNLF.JK 123.00 0.4 Adira Dinamika Finance ADMF.JK 10,150.00 20.4 Clipan Finance CFIN.JK 395.00 4.6 Pabrik Kertas Tjiwi Kimia TKIM.JK 2,475.00 0.4 Merck MERK.JK 152,000.00 20.2 Adira Dinamika Finance ADMF.JK 10,150.00 4.9 Polychem Indonesia ADMG.JK 310.00 0.5 Berau Coal Energy BRAU.JK 196.00 19.8 Pabrik Kertas Tjiwi Kimia TKIM.JK 2,475.00 5.0 Barito Pacific BRPT.JK 495.00 0.5 Hexindo Adiperkasa HEXA.JK 7,950.00 17.7
Tunas Baru Lampung TBLA.JK 520.00 5.4 Medco Energi MEDC.JK 1,620.00 0.5 Surya Esa ESSA.JK 2,400.00 15.7
Bno.Lumbung Energi &Mtl. BORN.JK 485.00 5.7 Energi Mega ENRG.JK 91.00 0.6 Alam Sutera Realty ASRI.JK 460.00 9.9 Losers Losers Losers Polaris Investama PLAS.JK 1,360.00 551.5 Surya Esa ESSA.JK 2,400.00 23.9 Polaris Investama PLAS.JK 1,360.00 (12.9) Benakat Petroleum BIPI.JK 180.00 496.3 Multi Bintang MLBI.JK 709,000.00 19.9 Bakrie Telecom BTEL.JK 102.00 (12.8) Bumi Resources Minerals BRMS.JK 490.00 455.8 Indosiar Karya Media IDKM.JK 5,550.00 19.9 Indosiar Karya Media IDKM.JK 5,550.00 (12.5) Asahimas Flat Glass AMFG.JK 6,850.00 80.2 Surya Citra Media SCMA.JK 10,500.00 12.8 Barito Pacific BRPT.JK 495.00 (11.7) Matahari Putra MPPA.JK 1,470.00 65.4 Sarana Menara TOWR.JK 20,300.00 11.3 Energi Mega ENRG.JK 91.00 (10.2) Bakrieland Dev. ELTY.JK 51.00 53.5 Merck MERK.JK 152,000.00 8.2 Indah Kiat Pulp & Paper INKP.JK 1,090.00 (9.8) Sarana Menara TOWR.JK 20,300.00 47.2 Polaris Investama PLAS.JK 1,360.00 8.2 Bakrieland Dev. ELTY.JK 51.00 (8.7) Indah Kiat Pulp & Paper INKP.JK 1,090.00 44.9 Nippon Indosari ROTI.JK 5,150.00 7.8 Polychem Indonesia ADMG.JK 310.00 (8.4) Sumber Alfaria AMRT.JK 5,750.00 40.6 Sumber Alfaria AMRT.JK 5,750.00 7.4 Delta Dunia Petroindo DOID.JK 245.00 (8.1) Bhakti Investama BHIT.JK 405.00 40.1 Ace Hardware ACES.JK 6,250.00 7.0 Pabrik Kertas Tjiwi Kimia TKIM.JK 2,475.00 (7.4)
* For stocks that are not rated, I/B/E/S consensus forecast numbers are used. CFROI® Spread is the difference between CFROI® and market implied discount rate. A larger number indicates
that more value is created by a company

14 September 2012
David & Goliath 53
Korea – Company updates Shinsegae (004170.KS, W217,000, N, TP W250,000)
Weak trends so far due to time difference in Choosuk holiday
■ Due to the Choosuk holiday time difference, it is difficult to read
the August YoY results as a trend. Also, Shinsegae partly
renovated its cosmetics and luxury sections at its Gangnam and
Gyunggi branches which could have hurt the sales trends.
Hence, the SSS was -5% YoY in August and OP margins fell 60
bp YoY.
■ The new stores launched are stated to have exceeded
expectations. We think some of the new stores benefited as a
few of the nearby department stores or malls were being
renovated.
■ Risks: (1) Shinsegae could be a laggard department stores play
as it has weaker and slower expansion schedules than its
competitors; and (2) consensus numbers could fall on dim
anticipation of margin improvement from mix, with a high portion
of its online business that continues to erode margins.
■ It should benefit if the overall department stores sector
strengthens on high recovery expectations. However, we
maintain NEUTRAL on Shinsegae, as we believe margins have
not been strong enough and will not improve soon. We also find
its new stores pipeline less exciting than peers.
Bbg/RIC 216,000.00
250,000
9.85 16
0.0
7.0
Free float (%) 72.8 Performance 1M 3M 12M
Absolute (%) (0.2) (2.0) (26.5)
Relativ e (%) 1.1 (5.3) (32.4)
Year 12/10A 12/11A 12/12E 12/13E 12/14E
14,645 3,912 4,295 4,665 5,124
1,325 337 361 400 450
1,077 202 194 218 260
28,548 20,478 19,699 22,159 26,396
n.a. n.a. 0 0 0
n.a. n.a. 19,551 21,942 24,005
89.6 -28.3 -3.8 12.5 19.1
7.6 10.5 11.0 9.7 8.2
1.2 0.6 0.7 0.9 1.0
4.0 8.2 8.0 7.2 6.4
1.1 1.1 1.0 0.9 0.8
18.4 4.4 9.7 10.0 10.8
43.3 33.3 36.7 33.5 30.4
322500.0 - 183000.0
2,126.6/ 1.9
ROE (%)
Note 1: Shinsegae Co. is a Korea-based company engaged in the operation of department stores under two segments: Offline and online department stores.
Mkt cap (W/US$ bn)Daily trad v al - 6m av g (US$ mn)
Major shareholders Shinsegae Family ; 27.14%
Net debt(cash)/equity (%)
Rev enue (W bn)
52-w k range (W)
004170 KS / 004170.KS
N (N)
Daily trad v ol - 6m av g (mn)
Rating (prev. rating)
Shares outstanding (mn)
Price (11 Sep 12 , W)
TP (prev. TP W)
Est. pot. % chg. to TP
EBITDA (W bn)
Net profit (W bn)
EPS (W)
- Change from prev . EPS (%)
- Consensus EPS (W)
EPS grow th (%)
P/E (x )
Div idend y ield (%)
EV/EBITDA (x )
P/B (x )
Price performance vs. MSCI Korea
40
60
80
100
120
09/11 11/11 01/12 03/12 05/12 07/12 09/12
Shinsegae MSCI Korea
Sonia Kim / Research Analyst / 822 3707 3764 /
Extracted from The Asian Daily 12 Sep 2012

14 S
ep
tem
ber 2
01
2
David
& G
olia
th
54
Valuations of Credit Suisse Korea small-cap watch list* Market CS target/ Potential Credit Year HOLT CFROI
Cap Price HOLT warranted return Suisse end CFROI Spread
Company RIC (US$ mn) (W) price (W) (%) Rating month 2011 2012 2011 2012 (%) (%) 1W 1M 3M
Able C&C 078520.KS 738 80,400 77,606 (3.5) Not rated Dec 26.5 18.3 6.4 5.3 18.9 11.5 10.1 23.7 44.3
Actoz Soft 052790.KQ 333 40,050 19,506 (51.3) Not rated Dec 30.8 26.3 3.9 3.4 11.1 3.9 (4.3) 29.2 59.6
Aekyung Petrochem. 006840.KS 286 36,150 45,229 25.1 Not rated Dec 7.6 7.8 0.9 0.8 7.7 (0.1) 0.0 16.8 51.9
Agabang 013990.KQ 383 15,400 4,044 (73.7) Not rated Dec 61.0 48.3 2.9 2.7 2.4 (4.7) 13.2 14.9 13.2
AhnLab 053800.KQ 1,096 123,300 32,958 (73.3) Not rated Dec 89.2 73.2 8.0 6.9 3.8 (3.2) 3.2 4.4 9.1
AmoreG 002790.KS 3,107 438,500 320,011 (27.0) Not rated Dec 24.6 30.1 2.0 1.8 6.7 (0.3) (0.3) 13.9 38.8
Asia Cement 002030.KS 210 49,900 150,589 201.8 Not rated Dec 12.4 9.2 0.2 0.2 0.3 (7.7) 4.9 9.8 18.5
Asia Pacific Sys. 054620.KQ 203 10,600 15,616 47.3 Not rated Dec 19.4 7.5 3.0 2.6 13.3 6.0 (3.2) (2.3) (15.9)
Asiana Airline 020560.KS 1,197 6,910 6,750 (2.3) UNDERPERFORM Dec 4.2 12.0 1.5 1.3 5.7 (2.3) (6.7) (7.9) 0.0
BHI 083650.KQ 378 32,550 11,911 (63.4) Not rated Dec 48.1 16.1 4.3 3.4 6.3 (1.4) 9.6 21.2 42.8
Bing-Grae 005180.KS 787 90,000 69,747 (22.5) Not rated Dec 19.9 15.2 2.0 1.9 7.2 0.1 0.4 0.8 30.1
Bioland 052260.KQ 210 15,750 9,696 (38.4) Not rated Dec 17.4 21.5 2.5 2.2 8.7 1.5 3.3 18.4 25.5
Bukw ang Pharma. 003000.KS 323 12,850 14,145 10.1 Not rated Mar 12.1 47.5 1.6 6.4 11.3 3.4 0.8 (4.5) 16.8
Capro 006380.KS 549 15,450 11,124 (28.0) Not rated Dec 3.9 14.4 1.2 1.1 24.7 17.7 9.6 1.6 (5.2)
Chabio & Diostech 085660.KQ 524 9,120 2,317 (74.6) Not rated Dec (87.7) (107.7) 2.2 2.2 0.1 (6.9) 1.3 4.6 3.4
Cheil Worldwide 030000.KS 2,084 20,400 24,000 17.6 OUTPERFORM Dec 24.5 19.7 3.3 2.9 11.1 4.2 (2.9) 6.8 14.6
Chin Hung 002780.KS 375 941 (191) (120.3) Not rated Dec (0.3) (2.3) (5.4) (39.2) (38.8) (46.8) 4.0 (11.2) (14.1)
China Ocean Resources 900050.KS 257 3,855 50,301 1,204.8 Not rated Dec 4.3 1.8 0.8 0.7 22.1 15.0 2.1 (7.3) 6.1
Chong Kun Dang Pharma 001630.KS 289 24,900 49,571 99.1 Not rated Dec 5.7 9.2 0.9 0.8 10.2 2.6 (3.5) 5.3 58.1
Chosun Refractories 000480.KS 226 63,700 110,229 73.0 Not rated Dec 6.0 5.5 0.4 0.4 4.1 (3.8) 2.9 0.6 5.6
CJ 001040.KS 2,282 88,600 106,256 19.9 Not rated Dec 6.8 11.5 0.8 0.8 5.3 (2.5) 4.7 14.2 12.0
CJ CGV 079160.KS 537 29,350 22,363 (23.8) Not rated Dec 32.7 11.2 2.0 1.8 5.7 (2.2) 5.6 9.9 15.8
CJ E&M 130960.KQ 1,036 30,750 77,051 150.6 Not rated Dec 20.4 16.9 1.1 1.0 18.7 11.6 8.7 25.5 15.4
CJ Food System 051500.KQ 288 29,950 20,162 (32.7) Not rated Dec 17.5 17.0 3.1 2.9 8.9 1.3 1.7 21.3 46.5
CJ O Shopping 035760.KQ 1,256 228,100 220,000 (3.6) OUTPERFORM Dec 15.4 12.6 4.0 3.1 19.0 11.7 0.8 21.0 35.2
Com2us 078340.KQ 596 66,500 41,404 (37.7) Not rated Dec 125.2 33.1 8.9 7.9 7.6 0.5 13.5 35.0 74.1
Cosmax 044820.KS 463 38,400 13,126 (65.8) Not rated Dec 44.9 30.5 8.6 7.9 8.1 0.6 4.3 30.2 52.4
Credu 067280.KQ 202 40,500 15,943 (60.6) Not rated Dec 44.0 41.0 2.7 2.6 3.6 (3.5) 10.2 15.4 17.7
Crown Confectionery 005740.KS 225 172,000 119,401 (30.6) Not rated Dec 12.5 11.9 1.6 1.6 7.6 (0.6) (2.0) (3.6) 3.9
Crucialtec 114120.KQ 228 10,900 6,748 (38.1) Not rated Dec 14.4 15.6 2.3 1.2 14.6 7.4 (3.5) 18.5 32.9
CalendarizedCalendarized Share price performance
W term (%)P/B (x)P/E (x)
* Include the small-cap stocks in HOLT® database with market cap between US$150 mn and US$2 bn. For stocks that are Not Rated, I/B/E/S consensus forecast are used. CFROI® is a
registered trademark in the United States and other countries (excluding the United Kingdom) of Credit Suisse or its subsidiaries or affiliates.
* Companies in bold and italic indicate constituents of Credit Suisse Korea Small Cap Index.

14 S
ep
tem
ber 2
01
2
David
& G
olia
th
55
Valuations of Credit Suisse Korea small-cap watch list* Market CS target/ Potential Credit Year HOLT CFROI
Cap Price HOLT warranted return Suisse end CFROI Spread
Company RIC (US$ mn) (W) price (W) (%) Rating month 2011 2012 2011 2012 (%) (%) 1W 1M 3M
Daeduck Electronics 008060.KS 468 10,800 12,147 12.5 Not rated Dec 9.7 8.3 1.1 1.0 18.0 10.9 6.4 (5.3) 0.9
Daehan Floor Mills 001130.KS 171 114,000 173,615 52.3 Not rated Dec 32.8 31.9 0.3 0.3 0.0 (7.7) (0.9) (3.0) 1.8
Daewon Kang Up 000430.KS 355 6,440 5,923 (8.0) Not rated Dec 15.4 14.9 1.2 1.1 8.1 0.7 5.2 0.9 14.6
Daeduck GDS 004130.KS 254 13,900 20,925 50.5 Not rated Dec 12.6 7.8 0.9 0.8 4.0 (3.1) 6.5 (1.1) 11.2
Ko-One Energy 026870.KS 317 36,850 74,169 101.3 Not rated Dec 8.9 n.a. 0.8 n.a. 2.2 (5.8) 0.7 0.5 33.8
Daekyo 019680.KS 433 5,760 9,566 66.1 Not rated Dec 10.3 9.7 0.8 0.8 10.2 2.8 0.9 (0.5) 1.6
Daesang 001680.KS 613 20,050 14,862 (25.9) Not rated Dec 13.0 9.0 1.4 1.3 4.0 (4.0) 13.6 26.1 9.0
Daewoong Pharm. 069620.KS 309 30,800 82,303 167.2 Not rated Dec 5.8 14.6 0.8 0.8 15.9 8.7 11.4 14.1 33.6
Daishin Securities 003540.KS 387 8,590 9,926 15.5 Not rated Mar n.a. 6.3 n.a. 0.3 2.0 (8.0) 4.6 0.4 (2.2)
Daou Technology 023590.KS 598 15,000 11,774 (21.5) Not rated Dec 10.5 9.0 1.0 0.9 7.1 (0.6) 5.6 29.3 22.4
Daum Comm. 035720.KQ 1,301 108,500 140,000 29.0 OUTPERFORM Dec 14.0 14.2 3.2 2.7 19.8 12.9 (4.7) 4.8 10.5
DGB Financial 139130.KS 1,601 13,450 18,000 33.8 OUTPERFORM Dec 7.8 7.0 0.8 0.7 7.6 (2.4) 0.7 1.1 (6.3)
DongAH 007340.KS 298 14,150 14,459 2.2 Not rated Dec 9.9 11.2 0.7 0.6 5.1 (2.4) 3.3 11.9 25.2
Dongkuk Steel 001230.KS 898 16,350 (14,222) (187.0) Not rated Dec 132.3 (22.6) 0.4 0.3 0.8 (7.1) 3.5 (2.4) 7.6
Dongsuh 026960.KQ 835 31,550 28,046 (11.1) Not rated Dec 9.5 8.4 1.1 1.1 6.1 (0.8) (0.3) (0.9) 3.1
Dong-A Pharm. 000640.KS 943 95,400 90,042 (5.6) Not rated Dec 15.3 21.9 1.3 1.2 7.4 0.2 (0.2) 0.3 29.6
Dongbu Hitek 000990.KS 266 6,750 15,273 126.3 Not rated Dec (2.8) (13.3) 1.0 1.0 (9.6) (17.5) 1.0 (3.4) (10.9)
Dongbu Steel 016380.KS 224 4,970 (11,189) (325.1) Not rated Dec (1.2) (1.2) 0.2 0.2 (2.4) (10.7) 10.4 17.6 15.9
Dongkuk Inds. 005160.KQ 180 4,045 7,100 75.5 Not rated Dec 11.0 7.9 0.6 0.6 6.4 (1.3) 4.4 1.9 7.2
Dongkuk Stutr. & Con. 100130.KQ 187 3,695 2,446 (33.8) Not rated Dec (13.6) (13.7) 0.9 0.9 (10.2) (17.3) (2.0) 6.5 (7.6)
Dongwon F&B 049770.KS 222 64,800 67,947 4.9 Not rated Dec 6.6 6.6 0.6 0.6 5.0 (2.9) (0.2) 3.0 4.3
Dongwon Industries 006040.KS 717 240,000 423,723 76.6 Not rated Dec 10.4 7.4 1.7 1.7 13.7 6.2 0.8 6.9 27.0
Dongyang Mechatronics 013570.KS 357 12,700 14,870 17.1 Not rated Dec 9.3 7.8 1.3 1.2 6.5 (0.9) 3.7 (2.7) (1.2)
Doosan E&C 011160.KS 434 2,815 3,247 15.3 Not rated Dec (1.7) (11.3) 0.4 0.4 (5.3) (13.3) 2.9 (0.9) (6.6)
Doosan Engine 082740.KS 648 10,500 6,217 (40.8) Not rated Dec 3.2 6.8 2.2 n.a. 38.9 32.4 3.4 (2.3) 1.0
Duk San Hi Metal 077360.KQ 568 21,750 26,874 23.6 Not rated Dec 15.8 14.8 4.0 3.2 30.5 23.6 0.0 2.8 (9.6)
E1 017940.KS 365 59,900 144,762 141.7 Not rated Dec 5.5 3.7 0.4 0.4 6.2 (2.0) 0.0 6.2 26.6
EO Technics 039030.KQ 347 31,950 24,214 (24.2) Not rated Dec 26.3 19.9 2.2 1.9 7.9 0.8 (4.3) (10.0) (10.5)
Eugene 023410.KQ 189 2,835 3,611 27.4 Not rated Dec (1.9) (49.7) (84.6) (84.6) 0.8 (7.4) (1.0) (1.6) (21.6)
Eugene Technology 084370.KQ 289 15,900 71,828 351.7 Not rated Dec 12.2 6.6 4.2 3.0 30.6 23.5 8.2 (8.6) (15.0)
Share price performance
W term (%)
Calendarized Calendarized
P/E (x) P/B (x)
* Include the small-cap stocks in HOLT® database with market cap between US$150 mn and US$2 bn. For stocks that are Not Rated, I/B/E/S consensus forecast are used. CFROI® is a
registered trademark in the United States and other countries (excluding the United Kingdom) of Credit Suisse or its subsidiaries or affiliates.
* Companies in bold and italic indicate constituents of Credit Suisse Korea Small Cap Index.

14 S
ep
tem
ber 2
01
2
David
& G
olia
th
56
Valuations of Credit Suisse Korea small-cap watch list* Market CS target/ Potential Credit Year HOLT CFROI
Cap Price HOLT warranted return Suisse end CFROI Spread
Company RIC (US$ mn) (W) price (W) (%) Rating month 2011 2012 2011 2012 (%) (%) 1W 1M 3M
Pharmicell 005690.KS 247 6,650 0 (100.0) Not rated Dec (14.1) (15.3) 2.8 2.8 (56.6) (63.7) 0.9 (20.4) (3.1)
Fila Korea 081660.KS 631 71,500 139,065 94.5 Not rated Dec 311.4 6.4 2.2 1.8 22.2 14.7 1.1 2.1 (8.7)
Foosung 093370.KS 484 6,430 3,756 (41.6) Not rated Dec 27.5 13.7 4.1 3.6 8.0 0.8 0.3 14.8 23.9
Fursys 016800.KS 284 27,800 43,410 56.2 Not rated Dec 8.0 8.5 1.0 0.9 10.7 3.7 0.2 (4.3) (3.0)
GameHi 041140.KQ 276 9,130 8,114 (11.1) Not rated Dec 131.4 11.8 5.4 4.8 16.0 9.0 (1.3) (5.0) (7.8)
Gamevil 063080.KQ 500 101,500 85,429 (15.8) Not rated Dec 35.8 24.6 8.2 6.2 23.4 16.3 4.6 16.5 12.0
Gemvax & Kael 082270.KQ 925 42,250 783 (98.1) Not rated Dec (448.9) (477.2) 13.7 12.1 (0.6) (7.6) (1.7) 11.9 16.9
Genic 123330.KQ 255 57,900 35,314 (39.0) Not rated Dec 26.8 20.7 6.1 3.7 21.2 14.1 4.1 22.7 28.5
Global & Yuasa Battery 004490.KS 599 48,200 79,580 65.1 Not rated Dec 6.4 6.0 1.4 1.2 12.5 5.3 (0.6) (1.9) 4.8
Golfzon 121440.KQ 588 53,900 44,631 (17.2) Not rated Dec 14.2 8.4 1.9 1.1 13.2 6.2 1.3 (1.6) 2.3
Grand Korea Leisure 114090.KS 1,615 29,400 24,159 (17.8) Not rated Dec 28.7 14.6 8.2 7.7 20.1 13.2 5.0 25.4 43.1
Green Cross 006280.KS 1,354 150,500 135,339 (10.1) Not rated Dec 27.5 21.4 2.5 2.2 9.4 2.5 (3.2) 3.4 7.9
GS Global 001250.KS 277 13,850 (2,789) (120.1) Not rated Dec (50.2) 9.4 1.4 1.0 0.1 (7.9) 6.9 17.9 13.5
GS Home Shopping 028150.KQ 669 114,800 165,000 43.7 OUTPERFORM Dec 9.0 7.9 1.2 1.1 13.6 6.5 1.4 16.8 24.8
GS Retail 007070.KS 1,969 28,800 17,427 (39.5) Not rated Dec 23.7 18.5 1.6 1.5 5.2 (1.9) 1.1 15.7 17.6
Gwangju Shingsegae 037710.KS 316 222,500 336,971 51.4 Not rated Dec 6.8 6.5 1.1 1.0 12.7 5.4 (0.7) 2.8 3.5
Haansoft 030520.KQ 315 15,350 13,618 (11.3) Not rated Dec 25.3 17.8 2.9 2.4 20.4 13.3 10.0 25.3 38.3
HCC 018880.KS 2,275 24,000 27,441 14.3 Not rated Dec 11.5 10.9 2.1 1.9 11.7 4.8 0.0 (0.4) 17.4
Halla E&C 014790.KS 258 10,600 16,609 56.7 Not rated Dec 16.0 28.8 0.3 0.3 (3.9) (12.0) 6.0 7.5 22.0
Hanil E-WHA 007860.KS 301 8,600 15,004 74.5 Not rated Dec 5.0 5.3 0.8 0.7 3.6 (4.0) (0.7) (1.9) (2.3)
Hankook Shell Oil 002960.KS 271 234,500 220,450 (6.0) Not rated Dec 11.7 10.2 3.9 3.8 25.2 18.2 1.3 0.6 10.1
Hana Micron 067310.KQ 122 6,130 10,606 73.0 Not rated Dec 12.8 7.6 0.8 0.7 8.8 1.2 (2.5) (8.9) (31.0)
Hana Tour 039130.KS 571 55,400 50,286 (9.2) Not rated Dec 30.9 21.6 5.4 5.1 27.3 20.3 2.0 29.3 25.1
Hanall Biopharma 009420.KS 221 6,650 878 (86.8) Not rated Dec (16.7) (21.1) 4.9 4.6 (3.7) (10.9) (0.2) (7.6) (7.1)
Handsome 020000.KS 566 25,900 32,282 24.6 Not rated Dec 6.6 7.9 0.9 0.8 10.1 3.0 (3.0) 0.8 (1.3)
Hanil Cement 003300.KS 267 39,900 50,477 26.5 Not rated Dec 16.3 19.7 0.2 0.2 0.6 (7.4) (0.2) 16.0 10.2
Hanjin Heavy Holdings 003480.KS 203 7,740 34,089 340.4 Not rated Dec (19.1) (18.0) 0.2 0.2 0.2 (7.6) 8.1 2.8 5.6
Hanjin Heavy Inds. 097230.KS 540 12,600 14,629 16.1 Not rated Dec (6.3) 286.4 0.3 0.3 0.8 (7.2) 5.0 (4.5) (17.6)
Hanjin Shipping 117930.KS 1,715 15,450 9,173 (40.6) Not rated Dec (2.3) (13.2) 1.0 1.0 (8.8) (16.7) 4.7 8.4 14.4
Hanjin Shipping Holdings 000700.KS 258 6,630 12,664 91.0 Not rated Dec 2.4 n.a. 0.3 n.a. 4.9 (2.4) 8.9 15.5 7.1
P/E (x) P/B (x)
Share price performance
W term (%)
Calendarized Calendarized
* Include the small-cap stocks in HOLT® database with market cap between US$150 mn and US$2 bn. For stocks that are Not Rated, I/B/E/S consensus forecast are used. CFROI® is a
registered trademark in the United States and other countries (excluding the United Kingdom) of Credit Suisse or its subsidiaries or affiliates.
* Companies in bold and italic indicate constituents of Credit Suisse Korea Small Cap Index.

14 S
ep
tem
ber 2
01
2
David
& G
olia
th
57
Valuations of Credit Suisse Korea small-cap watch list* Market CS target/ Potential Credit Year HOLT CFROI
Cap Price HOLT warranted return Suisse end CFROI Spread
Company RIC (US$ mn) (W) price (W) (%) Rating month 2011 2012 2011 2012 (%) (%) 1W 1M 3M
Hanjin Transportation 002320.KS 202 19,000 10,155 (46.6) Not rated Dec (12.1) 59.9 0.3 0.3 1.0 (7.1) 2.4 0.5 8.9
Hankuk Glass 002000.KS 201 22,500 60,641 169.5 Not rated Dec 7.4 8.5 0.4 0.4 (0.1) (7.2) 0.7 (1.7) (0.9)
Hanmi Pharm 128940.KS 625 89,200 58,950 (33.9) Not rated Dec (82.3) 11,150.0 2.2 2.2 2.2 (5.3) 3.2 3.7 64.6
Hansol Chemical 014680.KS 214 21,300 21,598 1.4 Not rated Dec 16.1 7.8 1.5 1.4 5.6 (2.0) (1.4) 5.7 25.7
Hansol Paper 004150.KS 357 9,220 18,367 99.2 Not rated Dec (64.4) 5.9 0.5 0.5 2.5 (5.7) 4.8 2.2 32.1
Hanssem 009240.KS 390 18,650 17,047 (8.6) Not rated Dec 8.9 12.1 1.7 1.7 13.6 6.5 0.5 (1.6) 7.8
Hanw ha Securities 003530.KS 285 3,855 6,651 72.5 Not rated Mar 6.2 24.4 0.3 1.3 3.3 (6.1) 0.8 (3.6) (7.4)
Hanwha 000880.KS 2,263 34,000 46,160 35.8 Not rated Dec 8.5 6.9 0.9 n.a. 12.1 5.5 1.0 11.1 20.4
Himart 071840.KS 1,327 63,300 34,404 (45.6) Not rated Dec 10.6 14.5 1.0 1.1 18.9 11.5 0.5 14.1 10.7
Hitejinro Holdings 000140.KS 208 10,100 (7,201) (171.3) Not rated Dec 32.4 84.6 0.4 0.4 3.8 (4.4) (1.5) 1.2 14.1
Hotel Shilla 008770.KS 1,899 54,500 38,895 (28.6) Not rated Dec 38.2 17.5 3.6 3.1 5.4 (2.4) 3.8 13.7 (3.4)
Huchems Fine Chemical 069260.KS 871 24,000 14,440 (39.8) Not rated Dec 19.2 15.1 2.2 1.9 5.7 (1.4) (2.2) 0.8 12.7
Hwa Shin 010690.KS 288 9,280 15,589 68.0 Not rated Dec 9.3 6.1 1.0 0.8 4.4 (2.9) 1.3 (4.6) (8.6)
Hy-Lok 013030.KQ 269 22,250 26,920 21.0 Not rated Dec 12.9 9.4 1.9 1.7 9.9 2.6 10.4 15.3 14.1
HYOSUNG 004800.KS 1,936 62,100 38,877 (37.4) Not rated Dec (45.9) 13.0 0.7 0.7 0.6 (7.2) 2.3 7.1 15.4
Hyundai 011760.KS 442 22,300 8,234 (63.1) Not rated Dec 11.3 6.7 1.3 1.3 5.2 (2.5) 3.5 9.9 5.4
Hyundai Dev. 012630.KS 1,533 22,900 27,000 17.9 NEUTRAL Dec 7.5 18.4 0.7 0.7 5.2 (2.5) 7.5 4.6 4.1
Hyundai Elevator 017800.KS 889 93,300 39,465 (57.7) Not rated Dec (3.7) (3.7) 1.8 1.8 (16.6) (23.8) 2.5 (3.5) 7.6
Hyundai Green Food 005440.KS 1,596 18,400 12,339 (32.9) Not rated Dec 18.9 18.7 1.3 1.2 4.0 (3.0) 2.5 14.3 18.7
Hyundai Home Shop. Net. 057050.KS 1,241 116,500 173,000 48.5 OUTPERFORM Dec 9.6 8.1 1.7 1.4 16.0 9.1 (2.9) 12.6 5.9
Hyundai Securities 003450.KS 1,309 8,670 6,096 (29.7) Not rated Mar n.a. 12.6 n.a. 0.5 1.6 (8.4) 4.1 (5.8) (2.8)
ICD 040910.KQ 213 15,450 62,656 305.5 Not rated Sep 8.7 6.4 2.6 3.0 27.0 20.0 5.1 12.4 (8.8)
Ilsung Pharm. 003120.KS 198 84,000 158,114 88.2 Not rated Dec 3.3 25.1 0.4 0.3 0.9 (6.4) 3.8 2.4 7.0
Iljin Display 020760.KS 448 18,600 38,711 108.1 Not rated Dec 16.4 8.4 5.6 4.6 24.2 16.9 6.6 16.3 44.2
Iljin Materials 020150.KS 419 11,500 9,899 (13.9) Not rated Dec 33.1 20.0 1.4 1.1 1.3 (5.7) (2.1) 0.4 7.0
Il-Yang Pharm. 007570.KS 410 25,950 1,764 (93.2) Not rated Mar 161.0 622.7 2.7 10.8 2.5 (5.4) 0.2 9.5 9.5
iMarketKorea 122900.KS 836 26,200 13,503 (48.5) Not rated Dec 27.3 22.6 3.3 3.0 11.0 4.0 5.2 4.8 44.0
Infraware 041020.KQ 113 6,990 21,519 207.9 Not rated Dec 45.4 7.7 1.8 1.4 11.6 4.4 (3.3) (20.2) (21.2)
InnoChips Technology 080420.KQ 142 10,750 11,913 10.8 Not rated Dec 6.6 8.2 1.6 1.5 12.4 4.9 1.4 (10.0) (17.3)
Interflex 051370.KQ 869 70,000 51,178 (26.9) Not rated Dec 31.5 16.3 3.9 3.6 7.0 (0.3) (1.8) 14.4 29.9
P/E (x) P/B (x)
Share price performance
W term (%)
Calendarized Calendarized
* Include the small-cap stocks in HOLT® database with market cap between US$150 mn and US$2 bn. For stocks that are Not Rated, I/B/E/S consensus forecast are used. CFROI® is a
registered trademark in the United States and other countries (excluding the United Kingdom) of Credit Suisse or its subsidiaries or affiliates.
* Companies in bold and italic indicate constituents of Credit Suisse Korea Small Cap Index.

14 S
ep
tem
ber 2
01
2
David
& G
olia
th
58
Valuations of Credit Suisse Korea small-cap watch list* Market CS target/ Potential Credit Year HOLT CFROI
Cap Price HOLT warranted return Suisse end CFROI Spread
Company RIC (US$ mn) (W) price (W) (%) Rating month 2011 2012 2011 2012 (%) (%) 1W 1M 3M
Interpark 035080.KQ 373 6,910 4,633 (33.0) Not rated Dec (34.2) (43.3) 1.0 1.0 (3.9) (11.6) 3.4 21.2 39.3
IS Dongseo 010780.KS 286 12,600 12,409 (1.5) Not rated Dec 25.2 9.2 0.9 0.8 2.3 (5.4) 0.0 19.4 22.3
ISU Chemical 005950.KS 317 23,350 15,821 (32.2) Not rated Dec 16.2 11.8 0.7 0.6 4.9 (3.0) 0.4 5.2 7.4
Isupetasys 007660.KS 160 4,375 7,179 64.1 Not rated Dec 14.2 7.3 1.2 1.2 4.9 (2.5) (1.8) (7.6) (9.7)
Jahwa Electronics 033240.KS 203 12,800 17,412 36.0 Not rated Dec 18.1 9.1 1.4 1.3 5.0 (2.4) 2.0 3.2 19.6
Jeonbuk Bank 006350.KS 261 4,405 8,528 93.6 Not rated Dec 2.2 3.9 0.4 0.4 12.1 2.2 (1.0) (2.2) (1.2)
Hite Jinro 000080.KS 1,431 23,200 25,000 7.8 NEUTRAL Dec 16.5 12.0 1.1 1.1 (1.2) (8.6) 2.4 (3.9) 5.7
Jinsung TEC 036890.KQ 167 9,430 746 (92.1) Not rated Dec 11.7 8.8 3.8 3.7 6.0 (1.9) 7.2 13.8 (1.3)
Jusong Engineering 036930.KQ 226 7,340 3,454 (52.9) Not rated Dec (26.4) (7.7) 1.1 1.0 1.4 (6.1) 3.4 5.3 0.8
JVM 054950.KQ 225 39,950 8,158 (79.6) Not rated Dec 19.9 13.6 3.6 2.2 12.0 4.5 9.8 15.5 0.8
Kepco Plant Service 051600.KS 1,898 47,500 33,413 (29.7) Not rated Dec 20.4 17.7 4.3 4.0 13.7 6.8 (5.4) (5.2) 3.7
Kiswire 002240.KS 429 32,200 85,660 166.0 Not rated Dec 4.4 4.0 0.4 0.3 3.2 (4.2) (0.3) (6.8) (3.4)
Kisco 104700.KS 258 31,500 55,750 77.0 Not rated Dec (8.7) 9.7 0.4 0.4 (6.1) (13.4) (1.6) 8.6 52.9
Kiwoom Securities 039490.KS 1,217 62,000 37,503 (39.5) Not rated Mar 11.2 11.2 1.8 1.6 13.9 4.0 1.8 (4.8) 3.9
Koh Young Technology 098460.KQ 197 25,100 52,613 109.6 Not rated Dec 12.9 8.8 3.0 2.4 22.3 15.2 1.6 6.8 (2.7)
Kolon 002020.KS 202 18,850 65,172 245.7 Not rated Dec 5.5 n.a. 0.3 n.a. 6.7 (0.4) 0.3 (22.3) (17.7)
Kolon Global 003070.KS 289 3,960 4,904 23.8 Not rated Dec 26.3 4.8 0.2 0.2 0.7 (7.8) 1.3 (7.5) (21.1)
Kolon Industries 120110.KS 1,350 60,700 109,295 80.1 Not rated Dec 8.9 6.5 1.1 1.1 7.5 0.1 1.8 (10.5) (5.5)
Komipharm 041960.KQ 393 8,850 231 (97.4) Not rated Dec 18,507 24,149.7 11.0 9.6 (1.9) (8.9) (3.9) 5.4 0.8
Korea Circuit 007810.KS 288 17,300 20,320 17.5 Not rated Dec 26.9 7.7 1.7 1.6 0.5 (7.2) 5.8 8.5 39.5
Korea District Heating 071320.KS 662 64,400 85,890 33.4 Not rated Dec 47.4 8.8 0.5 0.5 0.9 (7.1) (2.7) 7.3 21.1
Korea Electric Terminal 025540.KS 227 24,600 56,229 128.6 Not rated Dec 9.1 6.1 0.7 0.7 7.3 0.2 3.8 6.7 17.7
Korea Express 000120.KS 1,880 92,800 75,429 (18.7) Not rated Dec 19.1 17.1 0.7 0.7 3.7 (3.8) 2.8 5.5 40.8
Korea Investment 071050.KS 1,821 36,800 33,928 (7.8) Not rated Mar 8.6 8.2 0.8 0.7 7.9 (2.0) 0.1 (3.5) 1.2
Korea Kolmar 024720.KS 350 13,650 9,282 (32.0) Not rated Mar 23.1 19.6 3.1 2.7 9.3 1.7 10.5 28.2 50.3
Korea Petrochem. 006650.KS 388 67,200 187,087 178.4 Not rated Dec 14.6 8.4 0.5 0.5 1.8 (5.6) 1.7 (7.2) (2.9)
Korean Reinsurance 003690.KS 1,211 11,550 14,567 26.1 Not rated Mar 23.8 8.2 1.4 5.6 13.0 3.9 4.5 6.0 0.0
KP Chemical 064420.KS 1,057 12,100 23,092 90.8 Not rated Dec 4.1 10.1 0.9 0.9 7.7 0.9 1.7 (5.5) (6.2)
KPX Chemical 025000.KS 217 50,500 132,844 163.1 Not rated Dec 4.8 3.9 0.8 0.7 11.6 4.4 1.0 0.2 7.7
KT Hitel 036030.KQ 172 5,630 3,133 (44.4) Not rated Dec (68.6) (54.6) 1.1 1.0 2.4 (4.7) (0.7) 5.2 3.1
P/E (x) P/B (x) W term (%)
Calendarized Calendarized Share price performance
* Include the small-cap stocks in HOLT® database with market cap between US$150 mn and US$2 bn. For stocks that are Not Rated, I/B/E/S consensus forecast are used. CFROI® is a
registered trademark in the United States and other countries (excluding the United Kingdom) of Credit Suisse or its subsidiaries or affiliates.
* Companies in bold and italic indicate constituents of Credit Suisse Korea Small Cap Index.

14 S
ep
tem
ber 2
01
2
David
& G
olia
th
59
Valuations of Credit Suisse Korea small-cap watch list* Market CS target/ Potential Credit Year HOLT CFROI
Cap Price HOLT warranted return Suisse end CFROI Spread
Company RIC (US$ mn) (W) price (W) (%) Rating month 2011 2012 2011 2012 (%) (%) 1W 1M 3M
KT Skylife 053210.KS 1,111 26,250 32,500 23.8 OUTPERFORM Dec 39.2 20.3 4.2 3.6 8.7 1.7 (0.8) 5.0 23.0
Kukdo Chemical 007690.KS 264 51,200 45,733 (10.7) Not rated Dec 12.2 10.6 1.0 0.9 2.2 (5.2) 6.7 13.5 16.1
Kumho Industrial 002990.KS 485 3,205 38,154 1,090.5 Not rated Dec 11.5 12.5 1.3 n.a. 3.9 (2.9) 6.8 (31.4) (49.9)
Kumho Tire 073240.KS 1,698 15,150 5,628 (62.9) Not rated Dec (48.0) (137.7) 3.6 3.6 4.3 (3.5) 0.0 (2.6) 0.7
Kwang Dong Pharm. 009290.KS 198 4,255 9,029 112.2 Not rated Dec 6.2 5.2 0.7 0.7 8.1 0.7 0.9 1.7 10.2
Kyungbang 000050.KS 188 102,000 93,132 (8.7) Not rated Dec (189.1) (153.4) 0.3 0.3 2.1 (6.0) 3.2 (1.0) 5.2
Kyungdong City Gas 012320.KS 216 69,900 172,546 146.8 Not rated Dec 4.9 4.1 0.6 0.5 8.1 0.6 7.0 8.5 21.6
Leeno Industrial 058470.KQ 197 27,600 39,349 42.6 Not rated Dec 11.5 8.7 2.1 2.1 15.9 8.8 (1.1) 12.9 21.6
LG Fashion 093050.KS 804 30,950 41,901 35.4 Not rated Dec 9.4 8.4 1.1 0.9 7.0 (0.6) 0.2 6.7 1.5
LG Hausys 108670.KS 578 72,600 16,291 (77.6) Not rated Dec 15.6 14.2 1.0 1.0 2.1 (5.6) 1.0 6.1 14.5
LG Innotek 011070.KS 1,551 86,600 58,000 (33.0) UNDERPERFORM Dec (12.0) (406.1) 1.4 1.4 3.2 (4.4) (0.5) (3.0) 0.5
LG Int'l. 001120.KS 1,561 45,350 65,891 45.3 Not rated Dec 7.1 9.2 1.3 1.2 13.4 5.8 15.5 13.9 13.7
LG Life Sciences 068870.KS 643 43,650 25,226 (42.2) Not rated Dec 126.6 259.8 3.0 2.7 3.4 (3.9) 7.1 18.6 42.4
LIG Insurance 002550.KS 1,369 25,700 25,551 (0.6) Not rated Mar 9.0 5.7 1.4 5.6 6.1 (3.0) 6.2 8.9 13.5
Lock&Lock 115390.KS 1,111 22,750 13,802 (39.3) Not rated Dec 24.5 17.1 2.2 1.9 6.3 (0.6) (8.1) (12.5) (29.7)
Lotte Chilsung 005300.KS 1,473 1,341,000 1,409,344 5.1 Not rated Dec 23.7 15.4 0.9 0.8 5.0 (2.4) (4.8) (2.0) (0.5)
Lotte Confectionery 004990.KS 2,074 1,643,000 1,628,274 (0.9) Not rated Dec 23.7 17.0 0.9 0.9 3.9 (3.2) 2.8 1.4 9.8
Lotte Midopa 004010.KS 740 12,800 11,850 (7.4) Not rated Dec 17.6 15.9 1.0 0.9 3.8 (3.1) (0.4) (3.0) (1.2)
Lotte Samkang 002270.KS 623 557,000 562,739 1.0 Not rated Dec 17.7 11.0 1.4 1.3 4.1 (3.3) 5.7 11.0 3.3
LS Industrial Sys. 010120.KS 1,798 67,500 59,521 (11.8) Not rated Dec 28.1 15.2 2.6 2.4 7.8 0.6 0.9 0.9 19.7
LS Networks 000680.KS 325 4,740 2,907 (38.7) Not rated Dec 29.4 25.0 0.5 0.4 4.7 (2.8) 6.8 9.7 13.4
Lumens 038060.KQ 266 7,410 13,742 85.5 Not rated Dec 19.9 11.4 2.4 2.2 15.4 8.2 6.6 10.6 38.8
Macquarie KR Infra. Fund 088980.KS 1,942 6,600 3,329 (49.6) Not rated Dec 20.7 18.4 1.3 n.a. 2.9 (6.0) 0.5 6.8 10.0
Maeil Dairy 005990.KQ 340 28,550 22,923 (19.7) Not rated Dec 71.4 15.9 1.3 1.2 0.4 (7.4) 17.2 38.6 52.3
Medipost 078160.KQ 643 101,000 4,801 (95.2) Not rated Dec 342.0 n.a. 10.4 n.a. 4.5 (3.7) (2.6) 5.9 5.1
Mega Study 072870.KQ 367 65,200 85,247 30.7 Not rated Dec 6.0 7.9 1.2 1.0 17.3 10.4 4.7 4.0 (15.9)
Melfas 096640.KQ 330 20,850 24,124 15.7 Not rated Dec 23.5 15.1 2.5 1.9 11.8 4.8 6.4 (0.7) 12.4
Meritz F&M 000060.KS 1,116 13,000 11,379 (12.5) Not rated Mar 9.4 6.7 1.7 6.7 12.9 3.6 1.6 11.1 22.1
Mirae Asset Securities 037620.KS 1,170 31,450 26,178 (16.8) Not rated Mar 9.6 10.4 0.7 2.6 3.0 (5.8) 1.5 (1.4) 0.8
Modetour Network 080160.KQ 258 23,050 15,195 (34.1) Not rated Dec 14.0 15.5 2.6 2.4 15.9 8.8 2.7 22.9 13.5
P/E (x) P/B (x) W term (%)
Calendarized Calendarized Share price performance
* Include the small-cap stocks in HOLT® database with market cap between US$150 mn and US$2 bn. For stocks that are Not Rated, I/B/E/S consensus forecast are used. CFROI® is a
registered trademark in the United States and other countries (excluding the United Kingdom) of Credit Suisse or its subsidiaries or affiliates.
* Companies in bold and italic indicate constituents of Credit Suisse Korea Small Cap Index.

14 S
ep
tem
ber 2
01
2
David
& G
olia
th
60
Valuations of Credit Suisse Korea small-cap watch list* Market CS target/ Potential Credit Year HOLT CFROI
Cap Price HOLT warranted return Suisse end CFROI Spread
Company RIC (US$ mn) (W) price (W) (%) Rating month 2011 2012 2011 2012 (%) (%) 1W 1M 3M
Moorim P&P 009580.KS 204 3,685 (2,418) (165.6) Not rated Dec 20.6 11.2 0.4 0.4 0.5 (7.4) 2.5 0.7 (13.2)
Motonic 009680.KS 265 9,050 15,070 66.5 Not rated Dec 8.0 7.5 0.6 0.6 6.4 (0.8) 8.4 13.1 28.4
Muhak 033920.KS 301 12,950 20,887 61.3 Not rated Dec 7.8 7.2 1.4 1.2 11.9 4.8 (3.0) 7.5 13.6
Namyang Dairy Products 003920.KS 589 922,000 1,187,100 28.8 Not rated Dec 14.8 10.0 1.0 0.9 2.2 (4.8) 11.6 13.0 18.4
Namehae Chemical 025860.KS 414 9,390 7,555 (19.5) Not rated Dec (53.9) (48.0) 1.2 1.2 (1.6) (8.9) 4.1 (0.3) 8.8
Neowiz Games 095660.KQ 505 25,950 23,700 (8.7) NEUTRAL Dec 7.5 7.0 1.8 1.5 19.1 12.0 5.1 4.4 0.4
Neowiz Internet 104200.KQ 177 14,700 20,070 36.5 Not rated Dec 25.9 18.0 4.8 3.9 10.3 3.1 14.8 38.0 (8.1)
Nepes 033640.KQ 334 17,250 13,438 (22.1) Not rated Dec (162.6) 12.0 2.7 2.5 7.2 (0.2) (3.1) 3.6 (7.3)
Nexen 005720.KS 324 71,800 157,256 119.0 Not rated Dec 5.5 4.7 0.7 0.7 2.8 (4.8) 0.3 6.7 15.1
Nexen Tire 002350.KS 1,660 19,700 6,514 (66.9) Not rated Dec 22.4 12.6 3.5 3.1 1.2 (6.2) 2.1 (5.3) (4.4)
Nexolon 110570.KS 220 2,155 (3,622) (268.1) Not rated Dec (9.4) (8.4) 1.2 0.8 (5.5) (13.4) (13.1) (21.5) (40.1)
NH Inv . & Securities 016420.KS 271 5,070 9,195 81.4 Not rated Mar 4.8 18.6 0.5 2.0 7.8 (1.6) 3.6 0.4 0.4
Nongshim 004370.KS 1,312 243,000 230,000 (5.3) NEUTRAL Dec 17.2 13.6 1.0 0.9 3.9 (3.1) (3.2) 1.7 19.1
Nong Woo Bio 054050.KQ 232 18,250 11,671 (36.0) Not rated Oct 17.5 18.7 2.7 n.a. 4.6 (3.8) 2.5 22.9 34.2
Nongshim Holdings 072710.KS 224 54,500 228,788 319.8 Not rated Dec 6.0 5.0 0.4 0.4 11.6 4.1 2.8 7.1 4.8
OCI Materials 036490.KQ 448 47,850 57,223 19.6 Not rated Dec 7.5 9.9 1.6 1.3 12.8 5.7 3.7 6.1 11.3
Osstem Implant 048260.KQ 320 25,400 15,125 (40.5) Not rated Dec 34.3 20.4 4.8 4.6 10.1 2.6 3.0 28.9 86.8
Ottogi 007310.KS 620 203,000 224,857 10.8 Not rated Dec 11.2 9.9 1.3 1.2 8.2 0.9 3.6 3.6 30.1
Paradise 034230.KQ 1,365 16,900 11,219 (33.6) Not rated Dec 40.3 19.2 2.4 2.3 5.3 (1.9) 9.7 30.0 26.1
Patron 091700.KQ 411 11,950 49,475 314.0 Not rated Dec 14.3 8.2 3.0 2.6 24.1 17.0 8.6 2.1 4.4
Poongsan 103140.KS 840 33,750 29,352 (13.0) Not rated Dec 23.2 11.0 1.0 1.0 1.9 (5.8) 14.2 9.6 26.9
POSCO Chemtech. 003670.KQ 808 154,000 187,733 21.9 Not rated Dec 9.8 10.6 2.8 2.5 14.5 7.5 3.7 10.4 25.7
Posco ICT 022100.KQ 896 7,360 4,022 (45.4) Not rated Dec 35.3 21.5 4.3 3.7 11.4 4.4 9.4 2.9 7.6
Busan City Gas 015350.KS 203 20,800 50,816 144.3 Not rated Dec 6.3 5.6 0.5 0.5 4.8 (2.5) 3.5 8.1 13.4
Pyeong Hwa Automotive 043370.KQ 319 17,100 22,737 33.0 Not rated Dec 8.2 7.2 1.2 1.0 8.4 1.1 1.5 (5.0) (7.1)
S&T Motiv 064960.KS 194 18,800 30,920 64.5 Not rated Dec 6.6 10.2 0.6 0.6 2.6 (4.6) 0.5 (7.2) (4.1)
S&T Dynamics 003570.KS 368 12,750 20,291 59.1 Not rated Dec 7.3 7.4 0.6 0.6 6.6 (0.5) 2.8 (6.3) 6.3
S1 012750.KS 2,176 64,500 44,292 (31.3) Not rated Dec 17.2 17.6 3.0 2.7 12.6 5.7 0.5 9.1 13.2
Sajo Industries 007160.KS 266 60,000 40,106 (33.2) Not rated Dec 5.6 7.3 1.0 1.0 5.9 (2.1) (0.5) 10.1 10.1
Samyang 000070.KS 408 59,600 182,135 205.6 Not rated Dec 2.0 1.8 0.3 0.3 3.6 (3.9) 7.2 3.3 18.7
Calendarized Calendarized Share price performance
P/E (x) P/B (x) W term (%)
* Include the small-cap stocks in HOLT® database with market cap between US$150 mn and US$2 bn. For stocks that are Not Rated, I/B/E/S consensus forecast are used. CFROI® is a
registered trademark in the United States and other countries (excluding the United Kingdom) of Credit Suisse or its subsidiaries or affiliates.
* Companies in bold and italic indicate constituents of Credit Suisse Korea Small Cap Index.

14 S
ep
tem
ber 2
01
2
David
& G
olia
th
61
Valuations of Credit Suisse Korea small-cap watch list* Market CS target/ Potential Credit Year HOLT CFROI
Cap Price HOLT warranted return Suisse end CFROI Spread
Company RIC (US$ mn) (W) price (W) (%) Rating month 2011 2012 2011 2012 (%) (%) 1W 1M 3M
Samchully 004690.KS 359 99,700 253,840 154.6 Not rated Dec 5.8 8.7 0.4 n.a. 1.7 (6.1) 2.3 9.6 11.4
Samkwang Glass 005090.KS 226 52,500 29,562 (43.7) Not rated Dec 11.2 10.2 1.1 1.1 (0.0) (7.7) (4.5) (7.1) 0.6
Samsung Fine Chemicals 004000.KS 1,533 66,900 56,110 (16.1) Not rated Dec 23.2 18.3 1.6 1.5 4.4 (2.5) 2.6 8.3 17.8
SBS Contents Hub 046140.KQ 307 16,100 24,094 49.7 Not rated Dec 15.1 11.8 3.1 2.5 27.1 20.1 19.3 45.0 43.1
SBS Media 101060.KS 702 5,650 3,091 (45.3) Not rated Dec 56.4 n.a. 1.5 n.a. (0.6) (8.4) 5.8 25.3 46.4
SeAH Besteel 001430.KS 1,038 32,600 60,267 84.9 Not rated Dec 5.2 6.3 0.9 0.9 9.2 2.1 (2.7) (4.0) (19.1)
SeAH 058650.KS 322 90,600 437,148 382.5 Not rated Dec 2.8 2.1 0.3 0.3 6.1 (1.7) 1.0 (4.6) (9.9)
SeAH Special Steel 019440.KS 166 21,750 19,199 (11.7) Not rated Dec 6.7 8.2 0.9 0.8 7.4 (0.1) 0.7 8.7 8.5
SeAH Steel 003030.KS 567 106,500 141,365 32.7 Not rated Dec 6.4 6.0 0.7 0.6 3.6 (4.2) 9.0 22.1 21.0
Seegene 096530.KQ 681 58,600 20,810 (64.5) Not rated Dec 81.9 47.3 18.8 11.8 15.8 8.8 (2.5) (1.5) 17.4
Sejong Industrial 033530.KS 222 12,450 30,072 141.5 Not rated Dec 8.2 5.1 1.0 0.9 8.9 1.6 (1.6) (6.7) (3.5)
Seobu T&D 006730.KQ 555 23,900 (4,654) (119.5) Not rated Dec 1,400.4 (5,284.9) 1.5 1.3 0.5 (6.9) (3.6) 5.3 (2.8)
Seoul Broadcasting 034120.KS 634 39,100 33,239 (15.0) Not rated Dec 12.1 14.7 1.3 1.3 5.6 (1.7) 0.9 17.9 13.2
Seoul City Gas 017390.KS 222 50,000 145,389 190.8 Not rated Dec 3.3 n.a. 0.4 n.a. 1.5 (6.7) (1.0) 5.9 11.2
Seoul Semiconductor 046890.KQ 1,206 23,300 13,000 (44.2) UNDERPERFORM Dec 52.1 69.0 2.2 2.1 2.9 (4.0) 4.5 5.4 8.1
SFA Engineering 056190.KQ 745 46,700 57,286 22.7 Not rated Dec 9.3 10.4 2.3 2.1 20.8 13.8 1.2 1.2 (14.0)
Shinyoung Securities 001720.KS 258 30,900 82,755 167.8 Not rated Mar n.a. 3.2 n.a. 0.2 5.7 (4.2) 5.6 5.1 3.7
Shinsegae 004170.KS 1,897 217,000 250,000 15.2 NEUTRAL Dec 10.6 11.0 1.1 1.0 7.8 0.9 0.9 0.7 (1.6)
Shinsegae Food 031440.KS 276 90,700 131,694 45.2 Not rated Dec 9.9 9.5 1.7 n.a. 12.4 4.4 (2.4) 3.4 23.4
Shinsegae Int'l 031430.KS 547 86,200 68,029 (21.1) Not rated Dec 13.3 12.6 1.7 1.5 8.6 1.6 0.9 17.3 4.9
Silicon Works 108320.KQ 440 30,450 49,338 62.0 Not rated Dec 14.3 9.9 2.2 1.8 15.9 8.9 4.3 2.4 12.2
Silla 004970.KS 238 16,750 31,701 89.3 Not rated Dec 9.0 5.6 0.8 0.7 3.7 (3.6) 0.3 0.9 15.5
Simmetch 036710.KQ 342 12,400 15,000 21.0 Not rated Dec 8.5 7.6 2.1 1.7 12.4 4.9 18.7 13.8 9.7
Sindoricoh 029530.KS 602 67,300 87,203 29.6 Not rated Dec 10.0 8.1 0.8 0.8 4.9 (2.1) 6.2 4.8 20.8
SK Broadband 033630.KQ 953 3,625 3,200 (11.7) NEUTRAL Dec (75.6) 49.0 1.0 1.0 1.7 (6.0) 7.9 21.2 26.1
SK Chemicals 006120.KS 1,140 61,600 83,258 35.2 Not rated Dec 8.2 9.9 1.0 0.9 4.7 (2.8) 2.2 1.5 18.5
SK Comm. 066270.KQ 364 9,450 11,000 16.4 UNDERPERFORM Dec 96.3 (384.4) 1.8 1.9 3.1 (3.9) 2.7 18.6 22.7
SK Gas 018670.KS 657 85,700 61,011 (28.8) Not rated Dec 7.5 5.9 0.8 0.8 5.1 (2.9) 3.0 3.3 38.0
SK Securities 001510.KS 375 1,320 719 (45.5) Not rated Mar (66.0) (39.0) n.a. 0.9 (5.0) (14.9) 6.0 (1.1) 16.3
SKC 011790.KS 1,380 42,900 24,155 (43.7) Not rated Dec 12.2 10.4 1.4 1.3 6.8 (0.6) (1.2) (6.7) (0.8)
Calendarized Calendarized Share price performance
P/E (x) P/B (x) W term (%)
* Include the small-cap stocks in HOLT® database with market cap between US$150 mn and US$2 bn. For stocks that are Not Rated, I/B/E/S consensus forecast are used. CFROI® is a
registered trademark in the United States and other countries (excluding the United Kingdom) of Credit Suisse or its subsidiaries or affiliates.
* Companies in bold and italic indicate constituents of Credit Suisse Korea Small Cap Index

14 S
ep
tem
ber 2
01
2
David
& G
olia
th
62
Valuations of Credit Suisse Korea small-cap watch list* Market CS target/ Potential Credit Year HOLT CFROI
Cap Price HOLT warranted return Suisse end CFROI Spread
Company RIC (US$ mn) (W) price (W) (%) Rating month 2011 2012 2011 2012 (%) (%) 1W 1M 3M
SL 005850.KS 493 16,400 25,253 54.0 Not rated Mar 5.9 5.1 1.2 4.8 7.5 (0.2) 1.9 (9.1) (27.3)
SM Entertainment 041510.KQ 1,041 57,400 137,313 139.2 Not rated Dec 64.9 19.2 9.9 8.3 20.1 13.2 2.3 21.6 32.0
S-MAC 097780.KQ 201 13,800 37,456 171.4 Not rated Dec 6.5 6.1 2.7 2.0 31.9 24.6 10.8 27.2 24.3
Songw on Ind. 004430.KS 260 12,200 11,057 (9.4) Not rated Dec 6.8 7.8 1.4 n.a. 4.5 (3.5) (1.6) 20.8 57.0
Ssangyong Cement 003410.KS 343 5,180 9,694 87.1 Not rated Dec (10.7) (8.8) 0.4 0.4 (2.2) (10.2) 2.8 10.2 26.3
Ssangyong Motor 003620.KS 566 5,200 13,007 150.1 Not rated Dec (5.6) (5.8) 0.7 0.7 (3.6) (11.0) 2.2 (4.1) (9.1)
STS Semicon. & Telecom. 036540.KQ 238 6,200 3,734 (39.8) Not rated Dec 23.9 14.4 1.3 1.2 4.2 (3.5) 11.5 6.9 11.9
STX 011810.KS 455 8,550 (48,154) (663.2) Not rated Dec 8.5 n.a. 0.1 n.a. 2.8 (4.2) 5.8 (8.7) (10.4)
STX Engine 077970.KS 235 9,210 9,975 8.3 Not rated Dec 3.9 8.3 0.4 0.3 4.2 (3.6) 5.0 (13.5) (11.0)
STX Shipbuilding 067250.KS 651 9,190 16,321 77.6 Not rated Dec 10.1 5.0 0.5 0.5 6.8 (1.1) 2.7 (11.6) (10.3)
STX Pan Ocean 028670.KS 673 3,680 (246) (106.7) Not rated Dec (170.9) (3.9) 0.3 0.3 (2.5) (10.3) 4.5 (12.0) (13.9)
Sung Jin Geotec 051310.KS 620 13,400 (848) (106.3) Not rated Dec (11.0) 35.8 5.7 4.3 (6.0) (13.6) 1.9 20.2 33.3
Sung Kwang 014620.KQ 604 23,800 19,135 (19.6) Not rated Dec 29.6 13.3 2.2 2.0 5.2 (1.9) (0.2) 5.5 33.7
Sungwoo Hitech 015750.KQ 577 13,000 18,848 45.0 Not rated Dec 12.7 4.7 1.0 0.9 4.2 (3.4) (4.8) 3.6 (5.5)
TK 023160.KQ 612 28,400 21,994 (22.6) Not rated Dec 24.0 14.5 1.9 1.7 5.3 (1.6) 2.9 6.2 29.1
Taekwang Ind. 003240.KS 898 908,000 4,285,688 372.0 Not rated Dec 2.6 2.1 0.3 0.3 8.7 1.5 3.7 0.9 15.2
Taewoong 044490.KQ 327 22,200 15,087 (32.0) Not rated Dec 23.9 20.8 0.8 0.8 0.7 (6.6) (0.2) 15.0 7.8
Taeyoung E&C 009410.KS 368 5,430 3,105 (42.8) Not rated Dec 10.6 12.9 0.4 0.4 3.0 (5.0) 1.7 8.4 27.3
Taihan Electric Wire 001440.KS 256 1,640 755 (54.0) Not rated Dec (0.4) n.a. 0.3 n.a. (5.0) (12.0) (1.5) (15.5) (41.6)
Tbroad Hanvit Broadcasting 043890.KQ 349 28,000 67,558 141.3 Not rated Dec 5.8 4.1 1.4 1.3 17.3 10.1 0.7 1.6 24.7
Soulbrain 036830.KQ 537 37,300 53,998 44.8 Not rated Dec 77.1 9.1 2.4 2.0 10.8 3.5 (4.2) 7.8 35.1
Tera Semicon 123100.KQ 179 24,900 22,642 (9.1) Not rated Dec 21.7 16.3 5.0 3.7 21.1 14.0 (3.7) (2.0) (21.2)
The Basic House 084870.KS 275 14,850 11,942 (19.6) Not rated Dec (206.8) 14.1 1.9 1.9 2.0 (5.5) (0.7) 17.4 38.1
Tong Yang Life Insurance 082640.KS 965 10,100 10,544 4.4 Not rated Mar 8.6 7.8 0.9 3.5 11.7 2.6 1.4 (2.4) 13.2
Tongyang Securities 003470.KS 448 4,040 5,303 31.3 Not rated Mar 4.5 8.4 0.3 1.2 (1.3) (10.4) 3.3 (0.9) 0.7
Tongyang 001520.KS 182 839 (436) (151.9) Not rated Dec (3.0) (3.9) 0.8 0.8 (1.4) (9.7) (2.1) (2.4) 3.8
Uju Electronics 065680.KQ 196 22,250 21,387 (3.9) Not rated Dec 21.8 12.5 1.5 1.2 3.9 (3.3) 5.0 (4.9) (6.3)
UNID 014830.KS 206 35,300 75,320 113.4 Not rated Dec 4.7 4.0 0.6 0.5 6.1 (1.5) 0.4 (7.0) (5.6)
Unison 018000.KQ 358 9,620 (1,381) (114.4) Not rated Dec (2.4) (10.1) 12.9 12.9 (1.6) (9.5) (0.8) 17.3 37.6
ViroMed 084990.KQ 348 28,350 385 (98.6) Not rated Dec (35.1) (69.7) 7.1 7.1 (15.1) (22.4) 2.7 20.1 31.9
Calendarized Calendarized Share price performance
P/E (x) P/B (x) W term (%)
* Include the small-cap stocks in HOLT® database with market cap between US$150 mn and US$2 bn. For stocks that are Not Rated, I/B/E/S consensus forecast are used. CFROI® is a
registered trademark in the United States and other countries (excluding the United Kingdom) of Credit Suisse or its subsidiaries or affiliates.
* Companies in bold and italic indicate constituents of Credit Suisse Korea Small Cap Index

14 S
ep
tem
ber 2
01
2
David
& G
olia
th
63
Valuations of Credit Suisse Korea small-cap watch list* Market CS target/ Potential Credit Year HOLT CFROI
Cap Price HOLT warranted return Suisse end CFROI Spread
Company RIC (US$ mn) (W) price (W) (%) Rating month 2011 2012 2011 2012 (%) (%) 1W 1M 3M
Webzen 069080.KQ 301 10,250 23,832 132.5 Not rated Dec 27.8 27.2 2.7 2.7 23.9 16.7 10.2 25.8 15.2
Wemade Entertainment 112040.KQ 813 54,500 56,503 3.7 Not rated Dec 37.7 22.7 3.3 2.8 17.1 10.1 0.4 14.0 (7.2)
Wonik IPS 030530.KQ 373 5,750 7,474 30.0 Not rated Dec 13.7 13.9 1.8 1.6 13.5 6.4 3.4 2.0 (15.8)
Woongjin Chemical 008000.KS 298 723 944 30.5 Not rated Dec 40.6 12.3 1.1 1.1 2.5 (5.0) 1.4 (2.8) (0.7)
Woongjin Energy 103130.KS 215 3,635 436 (88.0) Not rated Dec 10.5 (17.5) 0.7 0.4 3.3 (4.1) 11.0 (17.6) (30.4)
Woongjin Hldgs. 016880.KS 200 3,740 10,344 176.6 Not rated Dec (1.5) 11.4 0.3 0.3 6.0 (2.2) (3.7) (21.9) (32.0)
Woongjin Thinkbig 095720.KS 206 9,000 18,865 109.6 Not rated Dec 11.0 7.2 0.9 0.9 11.5 3.9 (0.3) 3.8 (5.4)
Wooree ETI 082850.KQ 206 5,610 4,025 (28.2) Not rated Dec (22.3) 28.2 1.2 1.2 (3.1) (10.2) 5.1 23.8 32.0
Woori Inv. & Securities 005940.KS 2,035 11,500 9,679 (15.8) Not rated Mar 12.7 11.8 0.6 2.4 1.0 (7.8) 5.0 (1.7) 7.5
Youl Chon Chemical 008730.KS 186 8,450 10,641 25.9 Not rated Dec 9.5 11.9 0.7 0.7 4.4 (2.8) 0.5 4.1 8.6
Yungjin Pharm. 003520.KS 273 1,730 349 (79.8) Not rated Dec 119.1 94.4 3.4 3.3 1.6 (5.7) 5.2 8.8 12.3
Young Poong 000670.KS 1,701 1,040,000 1,257,550 20.9 Not rated Dec 7.7 6.0 0.9 0.9 0.1 (6.9) 14.9 11.3 17.4
Youngone 111770.KS 1,297 35,800 51,524 43.9 Not rated Dec 12.5 10.6 2.7 2.3 15.5 8.4 9.1 22.8 11.9
Youngone 009970.KS 718 59,300 152,668 157.5 Not rated Dec 6.2 5.6 1.4 1.2 17.5 10.4 (2.6) (1.0) 3.7
Yuhan 000100.KS 1,332 134,500 109,514 (18.6) Not rated Dec 15.1 19.6 1.3 1.2 6.5 (0.4) 0.4 5.1 5.9
Calendarized Calendarized Share price performance
P/E (x) P/B (x) W term (%)
* Include the small-cap stocks in HOLT® database with market cap between US$150 mn and US$2 bn. For stocks that are Not Rated, I/B/E/S consensus forecast are used. CFROI® is a
registered trademark in the United States and other countries (excluding the United Kingdom) of Credit Suisse or its subsidiaries or affiliates.
* Companies in bold and italic indicate constituents of Credit Suisse Korea Small Cap Index
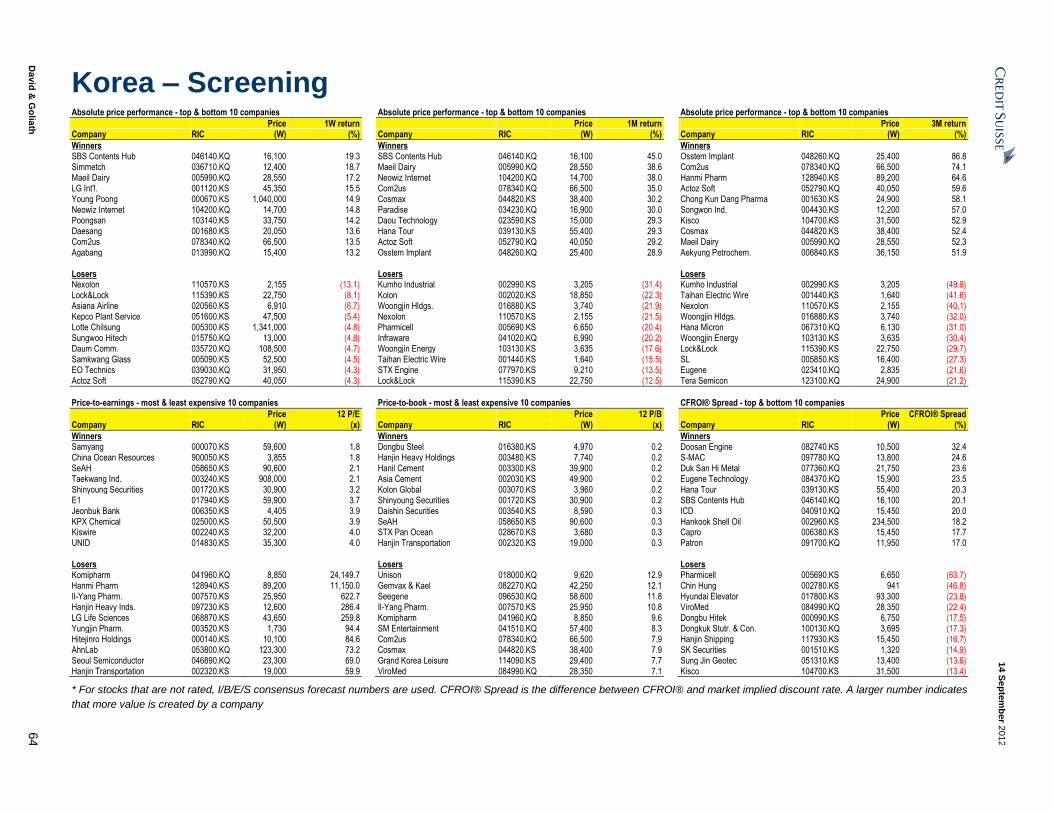
14 S
ep
tem
ber 2
01
2
David
& G
olia
th
64
Korea – Screening Absolute price performance - top & bottom 10 companies Absolute price performance - top & bottom 10 companies Absolute price performance - top & bottom 10 companies
Price 1W return Price 1M return Price 3M return Company RIC (W) (%) Company RIC (W) (%) Company RIC (W) (%)
Winners Winners Winners SBS Contents Hub 046140.KQ 16,100 19.3 SBS Contents Hub 046140.KQ 16,100 45.0 Osstem Implant 048260.KQ 25,400 86.8 Simmetch 036710.KQ 12,400 18.7 Maeil Dairy 005990.KQ 28,550 38.6 Com2us 078340.KQ 66,500 74.1 Maeil Dairy 005990.KQ 28,550 17.2 Neowiz Internet 104200.KQ 14,700 38.0 Hanmi Pharm 128940.KS 89,200 64.6 LG Int'l. 001120.KS 45,350 15.5 Com2us 078340.KQ 66,500 35.0 Actoz Soft 052790.KQ 40,050 59.6 Young Poong 000670.KS 1,040,000 14.9 Cosmax 044820.KS 38,400 30.2 Chong Kun Dang Pharma 001630.KS 24,900 58.1 Neowiz Internet 104200.KQ 14,700 14.8 Paradise 034230.KQ 16,900 30.0 Songwon Ind. 004430.KS 12,200 57.0 Poongsan 103140.KS 33,750 14.2 Daou Technology 023590.KS 15,000 29.3 Kisco 104700.KS 31,500 52.9 Daesang 001680.KS 20,050 13.6 Hana Tour 039130.KS 55,400 29.3 Cosmax 044820.KS 38,400 52.4 Com2us 078340.KQ 66,500 13.5 Actoz Soft 052790.KQ 40,050 29.2 Maeil Dairy 005990.KQ 28,550 52.3 Agabang 013990.KQ 15,400 13.2 Osstem Implant 048260.KQ 25,400 28.9 Aekyung Petrochem. 006840.KS 36,150 51.9 Losers Losers Losers Nexolon 110570.KS 2,155 (13.1) Kumho Industrial 002990.KS 3,205 (31.4) Kumho Industrial 002990.KS 3,205 (49.9) Lock&Lock 115390.KS 22,750 (8.1) Kolon 002020.KS 18,850 (22.3) Taihan Electric Wire 001440.KS 1,640 (41.6) Asiana Airline 020560.KS 6,910 (6.7) Woongjin Hldgs. 016880.KS 3,740 (21.9) Nexolon 110570.KS 2,155 (40.1) Kepco Plant Service 051600.KS 47,500 (5.4) Nexolon 110570.KS 2,155 (21.5) Woongjin Hldgs. 016880.KS 3,740 (32.0) Lotte Chilsung 005300.KS 1,341,000 (4.8) Pharmicell 005690.KS 6,650 (20.4) Hana Micron 067310.KQ 6,130 (31.0) Sungwoo Hitech 015750.KQ 13,000 (4.8) Infraware 041020.KQ 6,990 (20.2) Woongjin Energy 103130.KS 3,635 (30.4) Daum Comm. 035720.KQ 108,500 (4.7) Woongjin Energy 103130.KS 3,635 (17.6) Lock&Lock 115390.KS 22,750 (29.7) Samkwang Glass 005090.KS 52,500 (4.5) Taihan Electric Wire 001440.KS 1,640 (15.5) SL 005850.KS 16,400 (27.3) EO Technics 039030.KQ 31,950 (4.3) STX Engine 077970.KS 9,210 (13.5) Eugene 023410.KQ 2,835 (21.6) Actoz Soft 052790.KQ 40,050 (4.3) Lock&Lock 115390.KS 22,750 (12.5) Tera Semicon 123100.KQ 24,900 (21.2)
Price-to-earnings - most & least expensive 10 companies Price-to-book - most & least expensive 10 companies CFROI® Spread - top & bottom 10 companies
Price 12 P/E Price 12 P/B Price CFROI® Spread Company RIC (W) (x) Company RIC (W) (x) Company RIC (W) (%)
Winners Winners Winners Samyang 000070.KS 59,600 1.8 Dongbu Steel 016380.KS 4,970 0.2 Doosan Engine 082740.KS 10,500 32.4 China Ocean Resources 900050.KS 3,855 1.8 Hanjin Heavy Holdings 003480.KS 7,740 0.2 S-MAC 097780.KQ 13,800 24.6 SeAH 058650.KS 90,600 2.1 Hanil Cement 003300.KS 39,900 0.2 Duk San Hi Metal 077360.KQ 21,750 23.6 Taekwang Ind. 003240.KS 908,000 2.1 Asia Cement 002030.KS 49,900 0.2 Eugene Technology 084370.KQ 15,900 23.5 Shinyoung Securities 001720.KS 30,900 3.2 Kolon Global 003070.KS 3,960 0.2 Hana Tour 039130.KS 55,400 20.3 E1 017940.KS 59,900 3.7 Shinyoung Securities 001720.KS 30,900 0.2 SBS Contents Hub 046140.KQ 16,100 20.1 Jeonbuk Bank 006350.KS 4,405 3.9 Daishin Securities 003540.KS 8,590 0.3 ICD 040910.KQ 15,450 20.0 KPX Chemical 025000.KS 50,500 3.9 SeAH 058650.KS 90,600 0.3 Hankook Shell Oil 002960.KS 234,500 18.2 Kiswire 002240.KS 32,200 4.0 STX Pan Ocean 028670.KS 3,680 0.3 Capro 006380.KS 15,450 17.7 UNID 014830.KS 35,300 4.0 Hanjin Transportation 002320.KS 19,000 0.3 Patron 091700.KQ 11,950 17.0 Losers Losers Losers Komipharm 041960.KQ 8,850 24,149.7 Unison 018000.KQ 9,620 12.9 Pharmicell 005690.KS 6,650 (63.7) Hanmi Pharm 128940.KS 89,200 11,150.0 Gemvax & Kael 082270.KQ 42,250 12.1 Chin Hung 002780.KS 941 (46.8) Il-Yang Pharm. 007570.KS 25,950 622.7 Seegene 096530.KQ 58,600 11.8 Hyundai Elevator 017800.KS 93,300 (23.8) Hanjin Heavy Inds. 097230.KS 12,600 286.4 Il-Yang Pharm. 007570.KS 25,950 10.8 ViroMed 084990.KQ 28,350 (22.4) LG Life Sciences 068870.KS 43,650 259.8 Komipharm 041960.KQ 8,850 9.6 Dongbu Hitek 000990.KS 6,750 (17.5) Yungjin Pharm. 003520.KS 1,730 94.4 SM Entertainment 041510.KQ 57,400 8.3 Dongkuk Stutr. & Con. 100130.KQ 3,695 (17.3) Hitejinro Holdings 000140.KS 10,100 84.6 Com2us 078340.KQ 66,500 7.9 Hanjin Shipping 117930.KS 15,450 (16.7) AhnLab 053800.KQ 123,300 73.2 Cosmax 044820.KS 38,400 7.9 SK Securities 001510.KS 1,320 (14.9) Seoul Semiconductor 046890.KQ 23,300 69.0 Grand Korea Leisure 114090.KS 29,400 7.7 Sung Jin Geotec 051310.KS 13,400 (13.6) Hanjin Transportation 002320.KS 19,000 59.9 ViroMed 084990.KQ 28,350 7.1 Kisco 104700.KS 31,500 (13.4)
* For stocks that are not rated, I/B/E/S consensus forecast numbers are used. CFROI® Spread is the difference between CFROI® and market implied discount rate. A larger number indicates
that more value is created by a company

14 September 2012
David & Goliath 65
Malaysia – Company updates SP Setia (SETI.KL, RM3.78, N, TP RM3.60)
Lower earnings forecasts from dilution of proposed placement
■ SP Setia’s 9M FY12 net profit of RM267 mn rose 9% YoY and
was in line with market expectations. 3QFY12 EBIT margins rose
2.7 pp to 20.5% and were close to pre-GFC levels. Property
sales for 10MFY12 reached RM3.3 bn, up 43% YoY, and are on
track to meet the FY12 sales target of RM4 bn.
■ Phase 1 of Battersea is expected to have a GDV of £1 bn and is
mainly residential. Maiden profits from Battersea are only
expected in FY17, as the profits can only be recognised upon
completion.
■ SP Setia’s proposed placement of 15% of share capital (about
300 mn new shares) is expected to be completed by 4Q12 and
will allow them to comply with the required public spread of 25%
(vs 21% currently).
■ We maintain our NEUTRAL rating on SP Setia and have lowered
our FY12-14 earnings by 13-17% mainly due to dilution from the
proposed placement. Our new target price is RM3.60 (lowered
from RM3.95). SP Setia trades at an FY2013 PE of 20x, which is
fairly valued vs the market PE of 14x.
Bbg/RIC 3.78
3.60 (3.95)
2,001.03 (5)
0.9
1.1
Free float (%) 50 Performance 1M 3M 12M
Absolute (%) 8.3 1.1 21.2
Relativ e (%) 9.8 (2.0) 7.9
Year 10/10A 10/11A 10/12E 10/13E 10/14E
258.0 375.9 471.2 601.3 707.9
251.8 328.0 361.1 450.9 516.6
0.15 0.17 0.16 0.19 0.22
n.a. n.a. (17) (16) (13)
n.a. n.a. 0.20 0.23 0.27
42.4 9.3 (6.1) 24.1 14.2
24.8 22.7 24.2 19.5 17.1
4.0 2.8 2.8 3.2 3.7
31.6 19.9 18.3 15.1 13.3
11.9 11.6 8.7 9.3 10.4
26.4 -2.4 22.4 30.9 36.3
— — — — —
— — — — —
4.01 - 3.06
7,563.9/ 2,454.2
NAV per share (RM)
Note1:S P Setia Berhad is a Malaysia-based investment holding company engaged in business as building contractors. Its subsidiaries are engaged in
property development, property investment holding, project management and other different services..Note2:NAV = Book value.
Mkt cap (RM/US$ mn)Daily trad v al - 6m av g (US$ mn)
Major shareholders PNB
Disc./(prem.) to NAV (%)
EBITDA (RM mn)
52-w k range (RM)
SPSB MK / SETI.KL
N (N)
Daily trad v ol - 6m av g (mn)
Rating (prev. rating)
Shares outstanding (mn)
Price (13 Sep 12 , RM)
TP (prev. TP RM)
Est. pot. % chg. to TP
Net profit (RM mn)
EPS (RM)
- Change from prev . EPS (%)
- Consensus EPS (RM)
EPS grow th (%)
P/E (x )
Div idend y ield (%)
EV/EBITDA (x )
ROE (%)
Net debt(cash)/equity (%)
Price performance vs. MSCI Malaysia
75
85
95
105
115
09/11 11/11 01/12 03/12 05/12 07/12 09/12
SP Setia MSCI Malaysia
Tan Ting Min / Research Analyst / 603 2723 2080 /
Extracted from The Asian Daily 14 Sep 2012

14 S
ep
tem
ber 2
01
2
David
& G
olia
th
66
Valuations of Credit Suisse Malaysia small-cap watch list* Market CS target/ Potential Credit Year HOLT CFROI
Cap Price HOLT warranted return Suisse end CFROI Spread
Company RIC (US$ mn) (RM) price (RM) (%) Rating month 2011 2012 2011 2012 (%) (%) 1W 1M 3M
Aeon AEOM.KL 1,187 10.42 8.37 (19.7) Not rated Dec 18.7 17.7 2.8 2.6 6.1 (0.1) 4.2 4.2 11.3
Affin AFIN.KL 1,616 3.33 4.03 20.9 Not rated Dec 9.8 8.7 0.9 0.8 5.2 (3.5) (2.3) (6.5) 3.4
Alliance Financial ALFG.KL 2,045 4.07 4.65 14.3 OUTPERFORM Mar 13.6 11.8 1.8 1.6 11.4 2.8 0.5 (6.0) 1.0
Amway (MY) AMWA.KL 576 10.80 6.49 (39.9) Not rated Dec 19.7 18.3 9.2 7.9 36.4 30.6 (0.9) 2.9 11.3
Ann Joo ANNJ.KL 239 1.41 1.09 (22.7) Not rated Dec 11.5 12.8 0.7 0.7 1.0 (6.4) (3.4) (7.2) (15.6)
APM Automotive APMA.KL 325 4.97 8.46 70.3 Not rated Dec 8.1 7.7 1.2 1.1 9.1 2.8 (0.6) 0.0 3.5
Atlan ATLA.KL 358 4.35 2.76 (36.6) Not rated Feb n.a. 19.5 n.a. 2.8 4.3 (2.7) (0.7) (2.2) (2.2)
Bandar Raya BRDS.KL 461 2.85 2.33 (18.2) Not rated Dec 15.9 26.1 0.8 0.7 2.6 (4.7) 0.7 8.0 22.3
Berjay a Assets BERJ.KL 329 0.91 1.58 73.6 Not rated Jun n.a. 5.6 n.a. 0.5 3.3 (3.4) 1.1 0.0 9.6
Berjay a BGRO.KL 877 0.63 1.20 91.0 Not rated Apr 6.6 18.4 0.5 1.5 6.5 1.2 (3.1) (7.4) (16.0)
Berjay a Land BLAD.KL 1,282 0.79 1.05 32.6 Not rated Apr 49.3 155.9 0.8 2.4 3.2 (1.9) 0.0 (2.5) (6.0)
Berjaya Sports Toto BSTB.KL 1,903 4.34 4.75 9.4 NEUTRAL Apr 15.4 14.3 10.8 9.1 62.8 58.1 0.9 (1.1) 2.8
Bintulu Port BPOT.KL 928 7.15 7.02 (1.9) Not rated Dec 16.8 18.1 4.3 3.9 5.4 (1.2) 1.7 1.4 2.1
Boustead Heavy Inds. BHIB.KL 161 2.00 0.82 (58.8) Not rated Dec 38.9 37.7 1.2 1.2 2.7 (4.3) (2.4) (16.7) (29.3)
Boustead BOUS.KL 1,692 5.04 5.69 13.0 Not rated Dec 8.5 12.4 1.2 1.1 4.9 (1.3) (3.6) (6.0) (2.7)
Bursa Malaysia BMYS.KL 1,055 6.11 8.00 30.9 OUTPERFORM Dec 22.2 19.0 3.8 3.4 12.9 8.1 (1.8) (3.8) 0.3
Cahya Mata CMSM.KL 359 3.34 5.51 64.8 Not rated Dec 9.2 9.5 0.8 0.8 4.7 (2.6) 3.1 10.6 34.7
Capitamalls Malaysia CAMA.KL 999 1.74 1.75 0.6 OUTPERFORM Dec 23.6 21.8 1.3 1.5 6.0 (0.1) 3.0 (1.7) 6.7
Carlsberg (MY) CBMS.KL 1,194 11.94 6.39 (46.5) Not rated Dec 22.0 20.4 5.8 10.1 20.0 14.6 (0.7) (3.2) 8.0
CB Industrial Product CBIP.KL 235 2.66 4.07 53.1 Not rated Dec 6.8 8.4 2.8 1.5 21.9 15.1 (5.0) 0.4 7.3
Chemical Malaysia CLMS.KL 181 1.38 0.77 (44.1) Not rated Dec 25.1 41.6 0.7 0.7 2.1 (5.9) 2.2 (8.0) (6.8)
Chin Teck Plantations CTPB.KL 268 9.04 12.22 35.2 Not rated Aug 10.7 15.4 1.4 2.0 11.5 5.2 0.2 0.6 3.4
Coastal Contracts CTAL.KL 279 1.78 3.73 109.3 Not rated Dec 4.5 6.1 1.1 0.9 20.9 14.8 (0.6) (3.3) (2.7)
CSC Steel CSTH.KL 147 1.19 2.22 86.6 Not rated Dec 15.0 12.5 0.6 0.6 0.8 (5.9) (0.8) 2.6 (11.2)
Dayang Enterprise DEHB.KL 357 2.00 1.60 (20.1) Not rated Dec 13.0 11.5 2.1 1.6 9.0 2.1 0.0 0.0 0.0
Dialog DIAL.KL 1,797 2.30 1.13 (50.7) Not rated Jun 32.8 31.6 8.6 5.8 14.9 10.1 (2.1) (5.3) (3.4)
DRB-Hicom DRBM.KL 1,487 2.37 3.28 38.5 Not rated Mar 4.2 6.9 0.8 0.7 2.4 (4.1) (2.1) (7.8) (2.9)
Dutch Lady Milk DBMS.KL 878 42.24 44.45 5.2 Not rated Dec 25.0 21.3 10.4 11.1 22.7 16.9 (0.3) 3.5 26.0
Eastern & Oriental ENOB.KL 594 1.61 1.42 (12.0) Not rated Mar 17.5 14.4 1.2 1.1 2.6 (4.2) 2.5 4.5 15.0
ECM Libra Financial ECMA.KL 233 0.87 0.56 (34.8) Not rated Jan n.a. 23.7 n.a. 0.7 0.8 (8.3) 1.2 0.0 0.6
CalendarizedCalendarized Share price performance
RM term (%)P/B (x)P/E (x)
* Include the small-cap stocks in HOLT® database with market cap between US$150 mn and US$2 bn. For stocks that are Not Rated, I/B/E/S consensus forecast are used. CFROI® is a
registered trademark in the United States and other countries (excluding the United Kingdom) of Credit Suisse or its subsidiaries or affiliates.
* Companies in bold and italic indicate constituents of Credit Suisse Malaysia Small Cap Index

14 S
ep
tem
ber 2
01
2
David
& G
olia
th
67
Valuations of Credit Suisse Malaysia small-cap watch list* Market CS target/ Potential Credit Year HOLT CFROI
Cap Price HOLT warranted return Suisse end CFROI Spread
Company RIC (US$ mn) (RM) price (RM) (%) Rating month 2011 2012 2011 2012 (%) (%) 1W 1M 3M
Esso Malay sia PTMR.KL 245 2.80 6.02 115.0 Not rated Dec 4.9 3.8 0.9 0.8 4.3 (2.8) 0.4 (10.0) (16.2)
Faber FBMS.KL 156 1.32 2.10 58.8 Not rated Dec 7.8 7.7 1.0 0.9 9.8 2.9 (0.8) (0.8) (5.7)
Far East FEHS.KL 340 7.40 10.26 38.6 Not rated Dec 8.5 7.7 1.1 1.0 5.2 (0.9) (2.4) (3.3) (2.0)
Fraser & Neave FRAS.KL 2,282 19.40 9.27 (52.2) Not rated Sep 20.6 31.1 4.5 6.2 12.3 7.8 (0.8) (2.0) 5.4
Gamuda GAMU.KL 2,283 3.38 4.50 33.1 OUTPERFORM Jul 15.4 12.3 1.8 1.7 4.8 (0.0) (1.2) (3.7) (2.3)
Asiatic Dev. GENP.KL 2,286 9.28 10.50 13.1 OUTPERFORM Dec 15.9 18.6 2.2 1.9 9.0 4.3 0.0 (1.1) 1.3
Glenealy Plantations (MY) GLEN.KL 298 7.95 10.59 33.2 Not rated Jun 12.7 13.1 1.6 1.5 8.2 1.6 9.1 12.0 12.1
Glomac GLOM.KL 182 0.82 1.41 72.0 Not rated Apr 6.2 5.4 0.8 0.7 8.8 0.8 1.9 (2.4) 0.6
Goldis GLIS.KL 404 2.04 1.41 (30.9) Not rated Jan n.a. 16.6 n.a. 0.9 2.6 (6.4) 0.0 (5.6) (7.3)
Guan Chong GNCH.KL 314 2.02 2.61 29.4 Not rated Dec 7.7 7.1 3.6 2.8 14.5 7.1 0.0 (1.9) 12.2
Guinness Anchor GUMS.KL 1,498 15.28 9.99 (34.6) Not rated Jun 25.5 23.8 8.9 10.3 18.0 13.0 (0.7) 0.0 12.9
Guocoland (MY) GUOL.KL 171 0.75 0.29 (60.7) Not rated Jun n.a. 26.7 n.a. 0.7 0.1 (7.6) (1.3) (8.0) (3.8)
Hap Seng Consolidated HAPS.KL 1,136 1.60 2.28 42.5 Not rated Dec 8.5 10.6 1.1 1.0 6.1 0.1 0.6 (4.8) (5.9)
Hap Seng Plantations HAPP.KL 756 2.91 4.56 56.7 Not rated Dec 9.2 11.9 1.2 1.2 9.2 3.8 (2.7) (4.3) (2.3)
Hartalega HTHB.KL 1,045 4.40 4.35 (1.1) Not rated Mar 16.1 14.9 5.5 4.4 24.1 18.5 (0.5) (1.3) 12.5
Hock Seng Lee HSLB.KL 295 1.56 2.02 29.8 Not rated Dec 10.1 9.2 2.1 1.8 12.7 6.4 (1.3) (1.9) 4.7
Hong Leong Industries HLIB.KL 475 4.46 4.36 (2.3) Not rated Jun n.a. 7.8 1.0 1.4 3.3 (3.4) 3.7 3.5 12.6
IGB IGBS.KL 1,209 2.50 3.40 36.0 Not rated Dec 15.4 17.2 1.1 0.9 3.7 (2.0) 0.4 (7.4) (7.7)
IJM Land IJML.KL 993 2.18 2.30 5.5 NEUTRAL Mar 16.5 16.1 1.5 1.4 6.2 0.4 (4.8) (12.4) 5.8
IJM Plantations IJMP.KL 898 3.45 3.59 4.0 Not rated Mar 17.9 17.1 2.0 1.9 6.7 1.1 (2.3) (2.8) 9.2
Jaya Tiasa JTIA.KL 768 2.43 3.36 38.3 Not rated Apr 6.5 8.2 1.5 4.5 5.5 (1.6) 1.3 (6.2) (12.8)
JCY JCYI.KL 647 0.98 2.57 164.1 Not rated Sep 14.1 4.0 2.0 2.0 (1.2) (7.4) (1.0) (32.3) (32.8)
Jobstreet JOBT.KL 244 2.34 2.27 (2.9) Not rated Dec 17.2 16.6 4.0 3.3 25.2 18.8 4.0 6.4 1.7
JT Int'l. JTIN.KL 566 6.67 4.97 (25.4) Not rated Dec 14.2 13.6 3.8 4.5 13.0 7.2 (0.1) (4.7) (0.1)
Keck Seng (MY) KSMS.KL 459 3.91 5.99 53.2 Not rated Dec 18.6 15.1 0.8 0.8 2.4 (3.4) (1.0) (3.9) 1.3
KFC (MY) KFCK.KL 994 3.86 2.56 (33.6) Not rated Dec 21.2 21.0 2.8 2.5 5.4 (0.6) 1.0 1.6 0.8
Kian Joo Can KJCS.KL 346 2.40 3.41 42.1 Not rated Dec 10.2 9.4 1.2 1.1 4.4 (2.2) (6.3) (7.7) 21.2
Kim Loong Resources KIML.KL 246 2.46 4.35 77.0 Not rated Jan 8.1 8.4 1.5 1.4 13.9 7.4 (0.4) 1.7 (0.8)
Kinsteel KSTE.KL 133 0.39 0.08 (79.2) Not rated Dec (2.9) 10.0 0.6 0.6 (11.0) (18.8) (1.3) (3.7) (10.3)
KLCC Property KCCP.KL 1,656 5.46 8.13 48.9 Not rated Dec 5.8 20.2 0.8 0.8 4.1 (1.9) (2.5) 4.8 43.3
Share price performance
RM term (%)
Calendarized Calendarized
P/E (x) P/B (x)
* Include the small-cap stocks in HOLT® database with market cap between US$150 mn and US$2 bn. For stocks that are Not Rated, I/B/E/S consensus forecast are used. CFROI® is a
registered trademark in the United States and other countries (excluding the United Kingdom) of Credit Suisse or its subsidiaries or affiliates.
* Companies in bold and italic indicate constituents of Credit Suisse Malaysia Small Cap Index

14 S
ep
tem
ber 2
01
2
David
& G
olia
th
68
Valuations of Credit Suisse Malaysia small-cap watch list* Market CS target/ Potential Credit Year HOLT CFROI
Cap Price HOLT warranted return Suisse end CFROI Spread
Company RIC (US$ mn) (RM) price (RM) (%) Rating month 2011 2012 2011 2012 (%) (%) 1W 1M 3M
KNM KNMP.KL 218 0.67 0.67 0.1 Not rated Dec (7.1) 7.1 0.4 0.4 (1.8) (8.4) 1.5 16.5 (5.6)
Kossan Rubber KRIB.KL 314 3.03 4.06 34.1 Not rated Dec 10.8 9.2 1.9 1.7 9.8 3.2 (3.2) (5.3) (1.0)
KPJ Healthcare KPJH.KL 1,279 6.18 3.41 (44.8) Not rated Dec 23.5 25.2 4.5 3.7 6.7 0.8 0.0 (1.0) 4.4
Krisassets KRIC.KL 1,313 9.18 7.69 (16.3) Not rated Dec 7.2 25.0 2.0 1.9 5.4 (0.7) 0.7 2.5 17.1
Kulim KULM.KL 1,971 4.76 7.81 64.0 Not rated Dec 10.4 15.9 1.4 1.2 7.4 1.6 (6.5) (11.2) 7.4
Kwantas KWAN.KL 199 1.97 2.99 51.7 Not rated Jun 5.3 7.6 0.5 0.5 2.3 (5.5) (1.0) (6.2) 3.7
Lafarge Malayan Cement LMCE.KL 2,345 8.50 6.94 (18.4) Not rated Dec 22.7 19.3 2.3 2.3 5.5 1.0 0.7 (3.4) 14.9
Lingkaran LTKH.KL 715 4.33 4.99 15.1 Not rated Mar 25.1 18.5 5.6 5.6 7.7 0.9 4.3 7.4 7.4
Lingui LGDS.KL 334 1.56 2.15 37.9 Not rated Jun 5.4 6.9 0.6 0.6 (0.2) (7.3) 2.0 0.6 0.0
Lion Industries LLBM.KL 256 1.10 3.23 193.5 Not rated Jun 4.6 5.6 0.2 0.2 3.6 (3.5) 0.9 (6.8) (7.6)
LPI Capital LOND.KL 963 13.40 9.41 (29.8) Not rated Dec 19.1 17.7 2.5 2.4 23.0 14.3 0.1 (1.0) 0.6
Mah Sing MAHS.KL 583 2.14 2.31 8.1 Not rated Dec 10.6 8.1 1.7 1.4 7.3 0.6 (7.0) (10.8) 6.5
Malaysia Building Soc. MBSS.KL 908 2.27 2.76 21.4 Not rated Dec 7.0 9.2 2.4 2.2 (20.5) (29.4) 0.9 (7.3) (1.3)
Malaysian Airline MASM.KL 1,096 1.01 0.75 (25.7) UNDERPERFORM Dec (1.3) (4.1) 3.2 2.8 0.0 (6.6) (1.9) (1.9) (12.2)
Malaysian Bulk Carriers MBCB.KL 445 1.37 1.76 28.5 Not rated Dec 15.0 50.7 0.8 0.8 4.3 (1.3) (0.7) (13.8) (9.3)
Malaysian Pacific MPIM.KL 176 2.59 6.00 131.6 Not rated Jun 8.5 30.5 0.7 0.7 (0.2) (7.0) 0.0 (3.0) (13.7)
Malaysian Res. MYRS.KL 720 1.60 -0.46 (128.5) Not rated Dec 28.6 27.6 1.6 1.9 1.0 (5.5) (2.4) (9.1) (1.8)
Manulife MNLF.KL 215 3.28 4.80 46.4 Not rated Dec 9.9 6.7 1.2 1.0 13.6 4.5 0.0 2.5 (0.6)
MBM Resources MBMR.KL 453 3.57 3.24 (9.1) Not rated Dec 11.1 8.7 1.2 1.1 2.1 (5.2) (1.9) (8.0) 20.6
Media Prima MPRM.KL 816 2.33 2.94 26.3 Not rated Dec 11.8 12.7 1.8 1.7 6.0 0.1 2.6 (4.5) 0.4
MNRB MNRB.KL 219 3.16 5.40 71.0 Not rated Mar 7.3 6.5 0.5 2.2 0.7 (6.1) (0.9) 3.3 18.4
Mudajaya MJYA.KL 473 2.65 11.50 334.1 Not rated Dec 6.3 5.5 1.5 1.0 40.1 5.7 0.0 (2.6) (2.2)
Mulpha MITC.KL 298 0.39 0.71 82.5 Not rated Dec 5.0 229.2 0.3 0.3 (2.8) (11.8) 0.0 (6.0) (2.5)
Multi-Purpose MLPM.KL 1,699 3.64 2.18 (40.2) Not rated Dec 9.6 14.9 1.7 1.5 16.2 7.5 0.8 0.3 5.5
NCB NPOT.KL 641 4.20 5.97 42.1 Not rated Dec 12.4 10.5 1.2 1.4 6.9 0.9 1.0 (3.2) (1.2)
NTPM NTPM.KL 168 0.46 0.49 7.4 Not rated Apr 11.5 11.4 2.0 5.8 8.9 2.4 (1.1) (2.1) (6.1)
Oriental Holdings OTLS.KL 1,577 7.83 10.13 29.3 Not rated Dec 18.0 17.6 1.1 1.0 3.9 (1.5) (0.3) (1.4) 17.2
OSK OSKH.KL 451 1.44 1.07 (25.4) Not rated Dec 27.0 15.2 1.0 0.9 4.0 (4.8) (1.4) (2.7) 5.1
Padiberas Nasional PNAS.KL 504 3.30 2.88 (12.8) Not rated Dec 9.4 7.7 1.4 1.3 5.6 (1.6) 0.3 (9.1) 5.4
Padini PDNI.KL 449 2.10 1.56 (25.5) Not rated Jun 18.3 16.0 4.9 4.4 11.5 4.4 1.0 (4.1) 20.7
P/E (x) P/B (x) RM term (%)
Calendarized Calendarized Share price performance
* Include the small-cap stocks in HOLT® database with market cap between US$150 mn and US$2 bn. For stocks that are Not Rated, I/B/E/S consensus forecast are used. CFROI® is a
registered trademark in the United States and other countries (excluding the United Kingdom) of Credit Suisse or its subsidiaries or affiliates.
* Companies in bold and italic indicate constituents of Credit Suisse Malaysia Small Cap Index

14 S
ep
tem
ber 2
01
2
David
& G
olia
th
69
Valuations of Credit Suisse Malaysia small-cap watch list* Market CS target/ Potential Credit Year HOLT CFROI
Cap Price HOLT warranted return Suisse end CFROI Spread
Company RIC (US$ mn) (RM) price (RM) (%) Rating month 2011 2012 2011 2012 (%) (%) 1W 1M 3M
Panasonic Mfg. Malay sia PMMY.KL 444 22.50 16.79 (25.4) Not rated Mar n.a. 20.1 n.a. 2.1 5.5 (0.4) (0.5) (5.5) 1.4
Parkson PRKN.KL 1,626 4.58 5.13 12.1 Not rated Jun 14.2 13.4 2.2 2.0 9.0 3.9 1.8 (4.8) (0.4)
Perisai PPTB.KL 247 0.90 0.97 8.8 Not rated Dec 30.3 8.4 2.1 1.6 4.2 (3.3) (1.6) (4.3) 4.1
Pharmaniaga PHMA.KL 289 7.57 6.10 (19.5) Not rated Dec 18.8 16.1 1.7 1.8 6.0 (1.3) 0.1 (13.9) 41.1
POS Malaysia PSHL.KL 540 3.10 2.90 (6.5) NEUTRAL Mar 13.8 11.6 1.9 1.7 6.9 0.9 (1.6) (2.2) 15.2
Press Metal PMET.KL 245 1.63 0.59 (63.5) Not rated Dec 7.9 9.1 0.7 0.6 3.4 (4.6) (3.0) (5.8) (8.4)
Puncak PNHB.KL 176 1.32 2.83 114.6 Not rated Dec 66.0 2.0 5.0 7.5 6.4 (2.5) 0.8 1.5 0.8
QL Resources QRES.KL 840 3.11 2.52 (18.8) Not rated Mar 19.5 16.5 3.2 2.9 6.4 0.6 (1.3) (3.7) (1.0)
QSR Brands QSRB.KL 642 6.52 3.50 (46.3) Not rated Dec 16.2 15.5 2.0 1.7 5.6 (1.2) 0.3 0.3 (0.5)
Sarawak Oil Palms SOPS.KL 907 6.40 8.42 31.5 Not rated Dec 11.4 12.5 2.3 2.0 11.3 5.3 (4.5) (6.3) 3.4
Sarawak Plantation SPLN.KL 257 2.83 4.01 41.7 Not rated Dec 9.7 9.1 1.4 1.3 7.6 0.8 (2.4) (4.1) 8.4
Scientex STIK.KL 178 2.38 4.71 97.8 Not rated Jul 6.6 6.1 1.0 1.6 8.9 2.0 0.0 (4.0) 1.3
SEG SEDU.KL 421 1.95 1.37 (29.9) Not rated Dec 13.8 16.0 5.7 3.6 13.6 6.7 (1.5) (2.5) 14.0
Selangor Properties SELS.KL 374 3.35 4.68 39.7 Not rated Oct 11.0 18.6 0.6 0.7 3.6 (2.9) (1.2) (2.6) 2.1
Shangri-La Hotels (MY) SHGM.KL 606 4.24 3.31 (21.8) Not rated Dec 30.7 19.7 2.3 2.1 3.6 (2.6) 1.0 2.2 38.6
Shell Refining SLRS.KL 862 8.85 8.34 (5.7) Not rated Dec (21.1) (21.0) 1.4 1.6 (5.8) (11.5) (0.3) (4.8) (2.5)
Southern Steel STEE.KL 236 1.73 2.01 16.2 Not rated Jun n.a. 10.0 0.8 0.8 3.3 (4.4) 0.0 (3.9) (3.9)
SP Setia SETI.KL 2,459 3.78 3.60 (4.8) NEUTRAL Oct 23.0 23.3 2.0 1.7 4.5 (0.2) 7.4 6.2 1.3
Star Publications (MY) STAR.KL 770 3.21 2.91 (9.2) Not rated Dec 12.7 12.8 2.3 2.1 9.2 3.6 0.9 1.6 2.2
Starhill REIT SRHL.KL 439 1.02 1.47 44.5 Not rated Jun 15.4 11.4 0.9 0.9 4.5 (1.0) (1.9) (4.7) 7.4
Sunway SWAY.KL 944 2.25 2.57 14.3 Not rated Dec 7.8 8.5 1.0 0.9 4.9 (1.6) 0.4 1.8 (6.3)
Sunw ay REIT SUNW.KL 1,288 1.47 1.42 (3.4) NEUTRAL Jun 22.1 20.7 1.4 1.3 6.4 0.3 2.8 (3.9) 12.2
Supermax SUPM.KL 444 2.01 1.85 (8.2) Not rated Dec 13.1 10.6 1.8 1.6 5.9 (0.6) (0.5) (7.8) 8.6
Ta Ann TAAN.KL 483 4.01 6.08 51.7 OUTPERFORM Dec 9.6 9.0 1.6 1.4 12.4 6.1 (1.5) (12.8) (11.2)
TA Enterprise TAES.KL 286 0.52 0.73 41.1 Not rated Jan 9.0 8.2 0.6 0.5 1.4 (5.4) 0.0 (1.9) (3.7)
Tan Chong TNCS.KL 1,003 4.60 3.10 (32.6) UNDERPERFORM Dec 14.1 13.5 1.7 1.5 6.2 0.6 3.8 4.5 1.1
Tasek TKCS.KL 411 10.24 11.13 8.7 Not rated Dec 12.3 13.2 1.3 1.3 3.1 (3.1) (9.2) 2.6 19.2
TDM TDMS.KL 294 3.68 10.45 183.9 Not rated Dec 5.5 4.6 0.8 0.8 8.6 2.1 1.1 (5.2) (3.7)
Tebrau Teguh TEBA.KL 142 0.66 0.65 (1.2) Not rated Dec 167.9 165.6 0.9 0.9 0.3 (6.4) 0.0 (8.4) (13.2)
TH Plantations THPB.KL 404 2.40 3.53 47.1 Not rated Dec 9.8 12.5 2.0 2.0 4.2 (2.3) 2.1 (5.1) 2.6
Share price performance
P/E (x) P/B (x) RM term (%)
Calendarized Calendarized
* Include the small-cap stocks in HOLT® database with market cap between US$150 mn and US$2 bn. For stocks that are Not Rated, I/B/E/S consensus forecast are used. CFROI® is a
registered trademark in the United States and other countries (excluding the United Kingdom) of Credit Suisse or its subsidiaries or affiliates.
* Companies in bold and italic indicate constituents of Credit Suisse Malaysia Small Cap Index

14 S
ep
tem
ber 2
01
2
David
& G
olia
th
70
Valuations of Credit Suisse Malaysia small-cap watch list* Market CS target/ Potential Credit Year HOLT CFROI
Cap Price HOLT warranted return Suisse end CFROI Spread
Company RIC (US$ mn) (RM) price (RM) (%) Rating month 2011 2012 2011 2012 (%) (%) 1W 1M 3M
Time Dotcom TCOM.KL 609 3.28 5.70 73.7 Not rated Dec 14.1 14.2 0.9 0.8 3.4 (2.4) (2.1) (2.1) (1.5)
Top Glove TPGC.KL 1,033 5.14 4.53 (11.9) Not rated Aug 23.1 16.4 2.8 3.9 5.8 0.7 (1.2) (4.8) 10.8
Tradewinds TWMM.KL 722 7.50 19.72 162.9 Not rated Dec 4.7 4.0 0.9 0.8 7.6 0.9 (1.3) (10.7) (16.4)
Tradewinds Corp. TWSB.KL 305 0.85 1.08 27.4 Not rated Dec 16.2 17.7 0.4 0.5 0.5 (6.9) 14.9 7.6 21.4
Tradewinds Plantation TWSP.KL 770 4.48 6.62 47.7 Not rated Dec 7.1 9.8 1.3 1.2 6.9 0.5 0.4 0.2 (8.6)
TSH Resources TSHR.KL 630 2.31 1.57 (31.8) Not rated Dec 16.0 17.2 2.2 2.1 5.9 (0.9) (0.9) (11.8) (4.5)
Uchi Techs. UCHI.KL 139 1.14 1.13 (0.5) Not rated Dec 8.6 9.7 2.2 2.3 20.8 14.0 1.8 (3.4) (8.1)
Unisem UNSM.KL 223 1.02 1.28 25.3 Not rated Dec 34.8 (340.0) 0.6 0.6 (0.2) (7.0) 0.0 (11.3) (23.3)
United Malacca UMRS.KL 498 7.53 7.97 5.9 Not rated Apr 18.0 16.6 1.5 1.4 5.8 (0.1) (1.7) (4.7) 3.6
United Plantations UTPS.KL 1,785 26.42 28.33 7.2 Not rated Dec 14.7 15.2 2.8 2.6 10.6 5.7 0.5 (3.1) 6.4
Wah Seong WAHE.KL 440 1.75 1.40 (20.2) Not rated Dec 12.1 13.5 1.3 1.2 5.8 (0.9) (3.3) (4.9) (4.9)
WCT WCTE.KL 695 2.60 1.89 (27.3) Not rated Dec 12.9 11.9 1.4 1.3 3.4 (3.0) 2.4 2.0 11.1
Wing Tai Malay sia WITM.KL 172 1.63 3.21 96.9 Not rated Jun n.a. 4.9 n.a. 0.6 6.2 (1.8) (3.0) (11.4) (11.9)
WTK WTKH.KL 148 1.04 2.45 135.5 Not rated Dec 6.6 10.1 0.4 0.4 2.4 (5.0) (3.7) (11.9) (13.3)
Yeo Hiap Seng (MY) YHMS.KL 174 3.49 3.15 (9.8) Not rated Dec 21.3 19.5 2.0 1.9 2.8 (5.1) 0.9 2.3 (0.6)
YTL E-Solutions YTLE.KL 324 0.74 0.44 (39.9) Not rated Jun n.a. 30.8 n.a. 5.3 18.9 13.0 0.0 (0.7) 1.4
YTL Land & Development YTLL.KL 262 0.96 0.57 (40.4) Not rated Jun 41.9 35.6 1.4 1.4 1.3 (5.0) (3.0) (7.3) (0.5)
Zhulian ZHCO.KL 354 2.37 2.00 (15.8) Not rated Nov 11.3 10.1 2.8 2.8 15.4 9.0 0.4 (3.7) 18.5
P/E (x) P/B (x) RM term (%)
Calendarized Calendarized Share price performance
* Include the small-cap stocks in HOLT® database with market cap between US$150 mn and US$2 bn. For stocks that are Not Rated, I/B/E/S consensus forecast are used. CFROI® is a
registered trademark in the United States and other countries (excluding the United Kingdom) of Credit Suisse or its subsidiaries or affiliates.
* Companies in bold and italic indicate constituents of Credit Suisse Malaysia Small Cap Index.

14 S
ep
tem
ber 2
01
2
David
& G
olia
th
71
Malaysia – Screening Absolute price performance - top & bottom 10 companies Absolute price performance - top & bottom 10 companies Absolute price performance - top & bottom 10 companies
Price 1W return Price 1M return Price 3M return Company RIC (RM) (%) Company RIC (RM) (%) Company RIC (RM) (%)
Winners Winners Winners Tradewinds Corp. TWSB.KL 0.85 14.9 KNM KNMP.KL 0.67 16.5 KLCC Property KCCP.KL 5.46 43.3 Glenealy Plantations (MY) GLEN.KL 7.95 9.1 Glenealy Plantations (MY) GLEN.KL 7.95 12.0 Pharmaniaga PHMA.KL 7.57 41.1 SP Setia SETI.KL 3.78 7.4 Cahya Mata CMSM.KL 3.34 10.6 Shangri-La Hotels (MY) SHGM.KL 4.24 38.6 Lingkaran LTKH.KL 4.33 4.3 Bandar Raya BRDS.KL 2.85 8.0 Cahya Mata CMSM.KL 3.34 34.7 Aeon AEOM.KL 10.42 4.2 Tradewinds Corp. TWSB.KL 0.85 7.6 Dutch Lady Milk DBMS.KL 42.24 26.0 Jobstreet JOBT.KL 2.34 4.0 Lingkaran LTKH.KL 4.33 7.4 Bandar Raya BRDS.KL 2.85 22.3 Tan Chong TNCS.KL 4.60 3.8 Jobstreet JOBT.KL 2.34 6.4 Tradewinds Corp. TWSB.KL 0.85 21.4 Hong Leong Industries HLIB.KL 4.46 3.7 SP Setia SETI.KL 3.78 6.2 Kian Joo Can KJCS.KL 2.40 21.2 Cahya Mata CMSM.KL 3.34 3.1 KLCC Property KCCP.KL 5.46 4.8 Padini PDNI.KL 2.10 20.7 Capitamalls Malaysia CAMA.KL 1.74 3.0 Eastern & Oriental ENOB.KL 1.61 4.5 MBM Resources MBMR.KL 3.57 20.6 Losers Losers Losers Tasek TKCS.KL 10.24 (9.2) JCY JCYI.KL 0.98 (32.3) JCY JCYI.KL 0.98 (32.8) Mah Sing MAHS.KL 2.14 (7.0) Boustead Heavy Inds. BHIB.KL 2.00 (16.7) Boustead Heavy Inds. BHIB.KL 2.00 (29.3) Kulim KULM.KL 4.76 (6.5) Pharmaniaga PHMA.KL 7.57 (13.9) Unisem UNSM.KL 1.02 (23.3) Kian Joo Can KJCS.KL 2.40 (6.3) Malaysian Bulk Carriers MBCB.KL 1.37 (13.8) Tradewinds TWMM.KL 7.50 (16.4) CB Industrial Product CBIP.KL 2.66 (5.0) Ta Ann TAAN.KL 4.01 (12.8) Esso Malaysia PTMR.KL 2.80 (16.2) IJM Land IJML.KL 2.18 (4.8) IJM Land IJML.KL 2.18 (12.4) Berjaya BGRO.KL 0.63 (16.0) Sarawak Oil Palms SOPS.KL 6.40 (4.5) WTK WTKH.KL 1.04 (11.9) Ann Joo ANNJ.KL 1.41 (15.6) WTK WTKH.KL 1.04 (3.7) TSH Resources TSHR.KL 2.31 (11.8) Malaysian Pacific MPIM.KL 2.59 (13.7) Boustead BOUS.KL 5.04 (3.6) Wing Tai Malaysia WITM.KL 1.63 (11.4) WTK WTKH.KL 1.04 (13.3) Ann Joo ANNJ.KL 1.41 (3.4) Unisem UNSM.KL 1.02 (11.3) Tebrau Teguh TEBA.KL 0.66 (13.2)
Price-to-earnings - most & least expensive 10 companies Price-to-book - most & least expensive 10 companies CFROI® Spread - top & bottom 10 companies
Price 12 P/E Price 12 P/B Price CFROI® Spread Company RIC (RM) (x) Company RIC (RM) (x) Company RIC (RM) (%)
Winners Winners Winners Puncak PNHB.KL 1.32 2.0 Lion Industries LLBM.KL 1.10 0.2 Berjaya Sports Toto BSTB.KL 4.34 58.1 Esso Malaysia PTMR.KL 2.80 3.8 Mulpha MITC.KL 0.39 0.3 Mudajaya MJYA.KL 2.65 34.4 JCY JCYI.KL 0.98 4.0 WTK WTKH.KL 1.04 0.4 Amway (MY) AMWA.KL 10.80 30.6 Tradewinds TWMM.KL 7.50 4.0 KNM KNMP.KL 0.67 0.4 Jobstreet JOBT.KL 2.34 18.8 TDM TDMS.KL 3.68 4.6 Tradewinds Corp. TWSB.KL 0.85 0.5 Hartalega HTHB.KL 4.40 18.5 Wing Tai Malaysia WITM.KL 1.63 4.9 Kwantas KWAN.KL 1.97 0.5 Dutch Lady Milk DBMS.KL 42.24 16.9 Glomac GLOM.KL 0.82 5.4 TA Enterprise TAES.KL 0.52 0.5 CB Industrial Product CBIP.KL 2.66 15.1 Mudajaya MJYA.KL 2.65 5.5 Berjaya Assets BERJ.KL 0.91 0.5 Coastal Contracts CTAL.KL 1.78 14.8 Berjaya Assets BERJ.KL 0.91 5.6 CSC Steel CSTH.KL 1.19 0.6 Carlsberg (MY) CBMS.KL 11.94 14.6 Lion Industries LLBM.KL 1.10 5.6 Wing Tai Malaysia WITM.KL 1.63 0.6 LPI Capital LOND.KL 13.40 14.3 Losers Losers Losers Mulpha MITC.KL 0.39 229.2 Dutch Lady Milk DBMS.KL 42.24 11.1 Malaysia Building Soc. MBSS.KL 2.27 (29.4) Tebrau Teguh TEBA.KL 0.66 165.6 Guinness Anchor GUMS.KL 15.28 10.3 Kinsteel KSTE.KL 0.39 (18.8) Berjaya Land BLAD.KL 0.79 155.9 Carlsberg (MY) CBMS.KL 11.94 10.1 Mulpha MITC.KL 0.39 (11.8) Malaysian Bulk Carriers MBCB.KL 1.37 50.7 Berjaya Sports Toto BSTB.KL 4.34 9.1 Shell Refining SLRS.KL 8.85 (11.5) Chemical Malaysia CLMS.KL 1.38 41.6 Fraser & Neave FRAS.KL 19.40 6.2 KNM KNMP.KL 0.67 (8.4) Boustead Heavy Inds. BHIB.KL 2.00 37.7 Dialog DIAL.KL 2.30 5.8 ECM Libra Financial ECMA.KL 0.87 (8.3) YTL Land & Development YTLL.KL 0.96 35.6 NTPM NTPM.KL 0.46 5.8 Guocoland (MY) GUOL.KL 0.75 (7.6) Dialog DIAL.KL 2.30 31.6 Dialog DIAL.KL 2.30 5.8 JCY JCYI.KL 0.98 (7.4) Fraser & Neave FRAS.KL 19.40 31.1 NTPM NTPM.KL 0.46 5.8 Lingui LGDS.KL 1.56 (7.3)
YTL E-Solutions YTLE.KL 0.74 30.8 Lingkaran LTKH.KL 4.33 5.6 Unisem UNSM.KL 1.02 (7.0)
* For stocks that are not rated, I/B/E/S consensus forecast numbers are used. CFROI® Spread is the difference between CFROI® and market implied discount rate. A larger number indicates
that more value is created by a company

14 September 2012
David & Goliath 72
Singapore – Company updates CDL Hospitality Trusts (CDLT.SI, S$1.98, O, TP S$2.32)
Most asked question: 'FEHT or CDLHT?'; industry 7M12 REVPAR up strongly,
by 9.4% YoY
■ 7M12 REVPAR rose strongly YoY (+9.4%) to S$226 led by
upscale and mid-tier hotels versus industry’s expectation of 5–
10% for 2012 (CS forecasts 6.5% for 2012 REVPAR growth).
■ During our recent marketing trip, investors often asked “Far East
HT or CDLHT?” While both portfolios appear similar, investors
were mainly concerned about CDLHT’s overseas exposure and
whether it is less of a proxy to Singapore hotels because its
revenues are based on a lower percentage of REVPAR and
gross operating profits, compared to FEHT.
■ Figure 3 shows that despite the lower percentage used in the
calculation of revenue, CDLHT’s earnings are still highly
correlated to the SG hotels sector. Also, 90% of the Australia
income is from fixed components, mitigating volatility risk.
■ We maintain OUTPERFORM rating on CDLHT with 6.1% yield.
DPU growth is supported by strong sector fundamentals:
favourable demand-supply outlook (STB forecasting 6.6% 4-year
visitor arrivals CAGR versus 3.8% 3-year hotel supply CAGR of
3.8%), against the backdrop of high system occupancies, which
is supportive of higher room rates.
Bbg/RIC 1.97
2.32 (2.32)
967.53 18
1.6
2.5
Free float (%) 59.4 Performance 1M 3M 12M
Absolute (%) 0.3 4.2 17.6
Relativ e (%) 1.8 (4.5) 7.1
Year 12/10A 12/11A 12/12E 12/13E 12/14E
115.1 135.2 144.3 149.8 153.8
103.5 120.7 132.7 137.9 141.6
84.5 103.1 116.7 122.0 125.7
100.6 113.6 125.5 131.0 134.9
0.09 0.11 0.12 0.13 0.13
n.a. n.a. 0.12 0.12 0.13
19.7 14.0 12.6 4.0 2.6
20.9 18.3 16.3 15.7 15.3
0.1 0.1 0.1 0.1 0.1
n.a. n.a. 0.0 0.0 0.0
5.2 5.6 6.1 6.4 6.5
1.3 1.2 1.2 1.2 1.1
6.4 6.9 7.4 7.5 7.6
20.4 25.2 24.3 23.5 22.7
2.08 - 1.36
1,906.0/ 1,550.9Mkt cap (S$/US$ mn)Daily trad v al - 6m av g (US$ mn)
Major shareholders M&C (40.6%)
Daily trad v ol - 6m av g (mn)
Shares outstanding (mn)
Price (11 Sep 12 , S$)
TP (prev. TP S$)
Est. pot. % chg. to TP
52-w k range (S$)
Net property income (S$ mn)
CDREIT SP / CDLT.SI
O (O)
Debt/Asset (%)
Note1:CDLHT is a hospitality REIT with hotels in Singapore, Australia and New Zealand..
P/E (x )
DPU (S$)
- Change from prev . DPU (%)
DPU y ield (%)
ROE (%)
EBITDA (S$ mn)
P/B (x )
Net profit (S$ mn)
EPS (S$)
Distributable income (S$ mn)
- Consensus EPS (S$)
EPS grow th (%)
Rating (prev. rating)
Price performance vs. MSCI Singapore
70
80
90
100
110
120
09/11 11/11 01/12 03/12 05/12 07/12 09/12
CDL Hospitality Trusts MSCI Singapore
Yvonne Voon / Research Analyst / 65 6212 3026 /
Extracted from The Asian Daily 13 Sep 2012

14 S
ep
tem
ber 2
01
2
David
& G
olia
th
73
Valuations of Credit Suisse Singapore small-cap watch list* Market CS target/ Potential Credit Year HOLT CFROI
Cap Price HOLT warranted return Suisse end CFROI Spread
Company RIC (US$ mn) (S$) price (S$) (%) Rating month 2011 2012 2011 2012 (%) (%) 1W 1M 3M
Amara AMRA.SI 176 0.38 0.24 (36.8) Not rated Dec 7.4 23.3 1.0 0.9 2.1 (5.5) 0.0 2.7 8.7
Amtek Engineering AMEL.SI 261 0.59 0.70 18.6 NEUTRAL Jun 6.6 7.3 1.7 1.6 9.9 2.6 0.9 (3.3) (7.8)
ARA Asset Management ARAM.SI 944 1.51 1.43 (5.3) Not rated Dec 17.0 15.4 6.1 5.1 36.9 29.9 2.7 4.9 4.9
Ascendas India Trust AINT.SI 496 0.79 0.80 1.4 Not rated Mar 13.8 14.4 1.1 1.2 4.1 (3.0) 0.6 1.3 6.8
Ascott Residence Trust ASRT.SI 1,128 1.22 1.28 4.9 NEUTRAL Dec 25.8 8.7 0.9 0.8 3.6 (3.0) (1.6) 2.5 13.5
ASL Marine ASLM.SI 215 0.63 0.65 4.3 Not rated Jun 8.2 8.2 0.8 0.8 3.4 (4.1) 3.3 8.7 10.6
Aspial ASPA.SI 496 0.41 0.27 (34.5) Not rated Dec 8.2 11.1 4.1 3.2 30.2 21.1 3.8 10.8 8.2
Banyan Tree BANY.SI 359 0.58 0.52 (10.7) Not rated Dec 290.0 116.0 0.8 0.8 1.3 (5.8) 3.6 4.5 12.6
Biosensors BIOS.SI 1,717 1.23 1.80 46.9 OUTPERFORM Mar 15.3 13.8 1.6 1.4 19.1 12.5 0.0 (1.2) 4.3
Bonvests BVHS.SI 334 1.02 2.68 163.0 Not rated Dec 9.7 9.7 0.6 0.6 5.0 (2.4) 3.6 2.5 10.9
Boustead Singapore BTSS.SI 404 0.96 1.64 71.0 Not rated Mar 8.9 8.4 2.0 1.8 14.3 7.0 0.0 2.1 9.1
Bukit Sembawang Estates BSES.SI 1,082 5.14 8.23 60.1 Not rated Mar 7.2 6.0 1.2 1.2 8.2 1.3 6.0 7.8 12.7
Bumitama Agri BUMI.SI 1,601 1.12 1.08 (3.6) NEUTRAL Dec 24.1 19.1 6.2 3.3 15.0 9.0 2.8 5.2 25.1
Cambridge Ind. Trust CMIT.SI 619 0.63 0.70 11.8 Not rated Dec 8.7 14.7 1.0 1.0 5.5 (1.7) 1.6 6.8 16.7
CapitaRetail China Trust CRCT.SI 809 1.44 1.35 (6.5) Not rated Dec 7.9 15.0 1.1 1.0 3.5 (3.4) 0.0 (2.4) 12.9
CDL Hospitality CDLT.SI 1,558 1.98 2.32 17.2 OUTPERFORM Dec 18.4 16.4 1.2 1.2 5.5 (1.1) (1.0) 0.8 4.2
Cerebos CERE.SI 1,691 6.55 5.24 (20.0) Not rated Dec 20.7 17.9 4.7 5.0 12.1 5.4 0.0 0.0 24.1
CH Offshore CHOF.SI 261 0.46 0.63 38.0 Not rated Jun 8.1 8.2 1.1 1.0 13.7 6.1 0.0 5.8 8.3
Chemoil Energy CHEL.SI 368 $0.35 $0.01 (97.6) Not rated Dec 9.6 7.9 1.2 1.1 4.1 (3.0) (5.4) 7.7 11.1
China Animal Healthcare CAHC.SI 317 0.25 0.40 62.1 Not rated Dec 9.0 7.9 1.8 1.6 15.3 8.0 (5.8) (5.8) (10.9)
China Aviation Oil CNAO.SI 570 0.97 0.89 (7.9) Not rated Dec 8.9 7.8 1.3 1.3 5.9 (1.1) (1.0) 0.5 0.0
China Fishery CNFG.SI 632 0.76 1.68 121.5 Not rated Sep 5.8 5.4 0.8 1.0 10.8 4.2 0.7 (5.0) (13.6)
China Merchants CAEP.SI 424 0.73 2.00 175.8 Not rated Dec 10.4 7.3 0.8 0.9 44.7 37.5 1.4 0.0 8.2
China Minzhong Food CMFC.SI 338 0.75 1.87 151.1 Not rated Jun 3.7 3.4 0.7 0.6 12.3 5.2 8.8 13.7 19.2
China New Town Dev. CNTW.SI 190 0.05 0.00 (98.9) Not rated Dec (5.2) (5.8) 0.4 0.4 (3.2) (10.5) 0.0 0.0 0.0
China XLX Fertiliser CXLX.SI 244 0.30 0.34 12.3 Not rated Dec 8.6 8.3 0.7 0.6 5.4 (1.9) (1.6) (4.8) (1.6)
Chip Eng Seng CESE.SI 255 0.47 0.77 63.2 Not rated Dec 2.5 2.0 0.7 0.8 10.9 3.5 0.0 14.6 20.5
Chuan Hup CHHS.SI 190 0.25 0.37 49.6 Not rated Jun n.a. 5.6 n.a. 0.7 4.4 (3.4) 0.0 6.4 19.0
Citispring Infra. Trust CITY.SI 525 0.43 -0.28 (165.1) Not rated Mar n.a. (14.4) n.a. 1.8 1.4 (5.5) 3.7 6.3 10.4
COSCO (SG) COSC.SI 1,794 0.99 0.60 (39.1) UNDERPERFORM Dec 15.8 18.5 1.7 1.6 5.3 (0.9) 3.7 (0.5) (1.0)
Share price performance
S$ term (%)P/B (x)P/E (x)
CalendarizedCalendarized
* Include the small-cap stocks in HOLT® database with market cap between US$150 mn and US$2 bn. For stocks that are Not Rated, I/B/E/S consensus forecast are used. CFROI® is a
registered trademark in the United States and other countries (excluding the United Kingdom) of Credit Suisse or its subsidiaries or affiliates.
* Companies in bold and italic indicate constituents of Credit Suisse Singapore Small Cap Index

14 S
ep
tem
ber 2
01
2
David
& G
olia
th
74
Valuations of Credit Suisse Singapore small-cap watch list* Market CS target/ Potential Credit Year HOLT CFROI
Cap Price HOLT warranted return Suisse end CFROI Spread
Company RIC (US$ mn) (S$) price (S$) (%) Rating month 2011 2012 2011 2012 (%) (%) 1W 1M 3M
Creativ e Technology CREA.SI 189 3.10 6.38 105.9 Not rated Jun n.a. (3.7) n.a. 0.8 (7.3) (14.9) (0.6) (3.4) (10.7)
CSE Global CSES.SI 384 0.92 1.04 13.6 Not rated Dec 17.1 8.3 2.3 2.1 9.7 2.5 9.6 9.6 14.4
CWT CWTD.SI 610 1.25 0.52 (58.5) Not rated Dec 13.0 8.7 1.6 1.4 4.2 (2.7) 1.6 2.5 7.3
Del Monte Pacific DMPL.SI 422 0.48 0.40 (17.5) Not rated Dec 15.3 13.4 1.7 1.7 9.4 2.2 3.2 (1.0) 0.0
DMX Technologies DMXT.SI 209 0.22 0.44 100.4 Not rated Dec 11.0 10.9 0.5 0.5 8.5 1.0 2.3 0.0 (2.2)
Elec & Eltek EELT.SI 353 $2.32 $2.93 26.1 Not rated Dec 8.4 10.1 1.1 1.1 6.0 (1.0) 0.4 (10.4) (14.1)
Eu Yan Sang EYSI.SI 236 0.66 0.42 (35.7) Not rated Jun 11.6 13.5 2.4 2.3 11.8 4.3 1.6 1.6 9.2
Ezion EZHL.SI 873 1.26 0.84 (33.5) Not rated Dec 12.5 11.6 3.0 2.0 9.3 2.0 13.5 22.9 49.1
Ezra EZRA.SI 915 1.15 0.10 (91.4) Not rated Aug 16.5 12.1 0.9 1.2 1.0 (5.6) 5.5 15.0 20.4
First Resources FRLD.SI 2,680 2.08 2.62 26.0 OUTPERFORM Dec 15.9 13.0 3.2 2.7 14.5 8.0 2.5 4.0 25.7
Food Empire FEMP.SI 185 0.43 0.39 (10.1) Not rated Dec 12.3 11.6 1.2 1.2 8.4 0.6 2.4 (1.1) 16.2
Fortune REIT FORT.SI 8,025 HK$5.82 HK$4.65 (20.1) Not rated Dec 2.9 22.1 0.7 0.7 2.7 (4.1) 0.3 8.0 33.5
Frasers Centrepoint Trust FCRT.SI 1,205 1.80 1.93 7.2 NEUTRAL Sep 22.0 18.8 1.3 1.2 4.3 (2.5) 0.0 2.6 10.1
Frasers Commercial Trust FRCR.SI 607 1.16 1.01 (12.1) Not rated Sep 13.3 27.8 0.8 0.8 3.7 (3.3) (1.3) 4.5 23.5
G.K. Goh GKHS.SI 189 0.74 0.70 (5.3) Not rated Dec 4.1 36.9 0.6 0.7 (1.2) (10.3) 2.1 1.4 6.5
Gallant Venture GLVT.SI 569 0.29 0.38 30.5 Not rated Dec 85.3 87.5 0.6 0.6 0.3 (6.6) 0.0 1.8 7.4
GMG Global GMGG.SI 774 0.12 0.14 14.3 Not rated Dec 9.3 13.8 1.2 1.1 8.0 1.2 2.5 5.1 7.8
Goodpack GPAK.SI 743 1.84 1.65 (10.0) Not rated Jun 17.7 16.6 2.9 2.7 10.6 3.6 2.5 4.6 7.3
GP Industries GPEI.SI 170 0.40 0.60 48.8 Not rated Mar n.a. 14.0 n.a. 0.6 0.9 (6.7) 1.3 1.3 1.3
Guocoland GUOC.SI 1,704 1.77 1.57 (11.3) Not rated Jun 13.8 8.6 0.8 0.9 1.3 (4.9) 4.7 6.0 11.7
Guthrie GTS GTGS.SI 530 0.61 0.50 (17.3) Not rated Dec 2.8 12.0 0.7 0.6 3.1 (4.0) 3.4 3.4 12.0
Haw Par HPAR.SI 1,055 6.55 14.32 118.7 Not rated Dec 16.1 12.8 0.7 0.6 4.2 (2.7) 2.0 5.3 11.2
Hiap Hoe HIAP.SI 235 0.61 0.65 7.1 Not rated Dec 6.1 4.8 1.1 1.0 6.0 (1.6) 5.2 13.0 18.4
Hi-P HIPI.SI 718 1.00 0.91 (8.2) Not rated Dec 18.8 14.2 1.4 1.4 4.0 (3.1) 9.3 16.4 32.7
Ho Bee HBEE.SI 849 1.42 1.75 23.5 Not rated Dec 5.1 8.4 0.6 0.6 5.1 (1.7) 9.7 13.7 26.3
Hong Leong Asia HLAA.SI 517 1.70 2.64 55.3 Not rated Dec 7.6 11.0 0.8 0.7 7.0 0.1 2.4 0.3 7.6
Hong Leong Finance HLSF.SI 879 2.45 2.20 (10.2) UNDERPERFORM Dec 11.2 17.0 0.7 0.7 1.5 (7.2) 2.5 1.2 8.4
Hotel Grand Central HGCS.SI 371 0.80 2.04 154.8 Not rated Dec 15.3 5.6 0.6 0.6 7.8 0.4 0.0 1.9 5.3
Hotel Properties HPPS.SI 1,182 2.87 2.74 (4.4) Not rated Dec 20.6 19.3 1.0 0.9 2.2 (4.5) 10.8 23.7 49.9
Hour Glass HRGS.SI 268 1.40 2.98 113.0 Not rated Mar n.a. 5.4 n.a. 1.0 13.1 5.5 0.0 (4.4) 8.5
P/E (x) P/B (x)
Share price performance
S$ term (%)
Calendarized Calendarized
* Include the small-cap stocks in HOLT® database with market cap between US$150 mn and US$2 bn. For stocks that are Not Rated, I/B/E/S consensus forecast are used. CFROI® is a
registered trademark in the United States and other countries (excluding the United Kingdom) of Credit Suisse or its subsidiaries or affiliates.
* Companies in bold and italic indicate constituents of Credit Suisse Singapore Small Cap Index
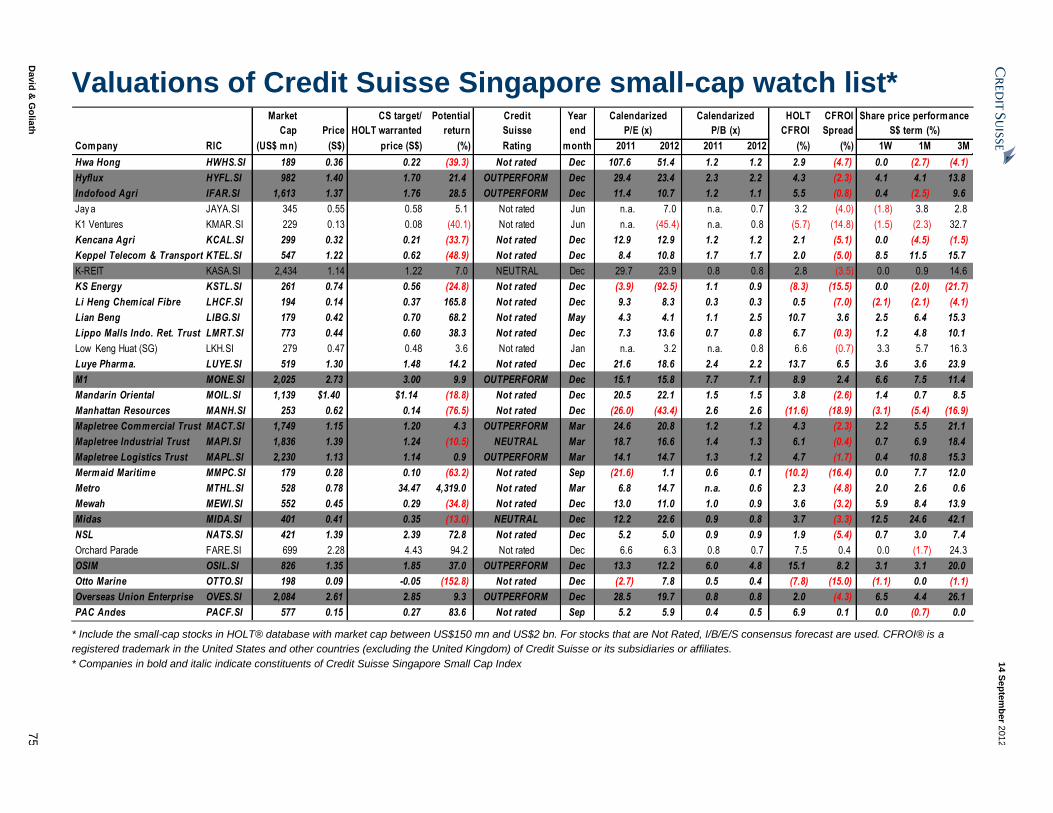
14 S
ep
tem
ber 2
01
2
David
& G
olia
th
75
Valuations of Credit Suisse Singapore small-cap watch list* Market CS target/ Potential Credit Year HOLT CFROI
Cap Price HOLT warranted return Suisse end CFROI Spread
Company RIC (US$ mn) (S$) price (S$) (%) Rating month 2011 2012 2011 2012 (%) (%) 1W 1M 3M
Hwa Hong HWHS.SI 189 0.36 0.22 (39.3) Not rated Dec 107.6 51.4 1.2 1.2 2.9 (4.7) 0.0 (2.7) (4.1)
Hyflux HYFL.SI 982 1.40 1.70 21.4 OUTPERFORM Dec 29.4 23.4 2.3 2.2 4.3 (2.3) 4.1 4.1 13.8
Indofood Agri IFAR.SI 1,613 1.37 1.76 28.5 OUTPERFORM Dec 11.4 10.7 1.2 1.1 5.5 (0.8) 0.4 (2.5) 9.6
Jay a JAYA.SI 345 0.55 0.58 5.1 Not rated Jun n.a. 7.0 n.a. 0.7 3.2 (4.0) (1.8) 3.8 2.8
K1 Ventures KMAR.SI 229 0.13 0.08 (40.1) Not rated Jun n.a. (45.4) n.a. 0.8 (5.7) (14.8) (1.5) (2.3) 32.7
Kencana Agri KCAL.SI 299 0.32 0.21 (33.7) Not rated Dec 12.9 12.9 1.2 1.2 2.1 (5.1) 0.0 (4.5) (1.5)
Keppel Telecom & Transport KTEL.SI 547 1.22 0.62 (48.9) Not rated Dec 8.4 10.8 1.7 1.7 2.0 (5.0) 8.5 11.5 15.7
K-REIT KASA.SI 2,434 1.14 1.22 7.0 NEUTRAL Dec 29.7 23.9 0.8 0.8 2.8 (3.5) 0.0 0.9 14.6
KS Energy KSTL.SI 261 0.74 0.56 (24.8) Not rated Dec (3.9) (92.5) 1.1 0.9 (8.3) (15.5) 0.0 (2.0) (21.7)
Li Heng Chemical Fibre LHCF.SI 194 0.14 0.37 165.8 Not rated Dec 9.3 8.3 0.3 0.3 0.5 (7.0) (2.1) (2.1) (4.1)
Lian Beng LIBG.SI 179 0.42 0.70 68.2 Not rated May 4.3 4.1 1.1 2.5 10.7 3.6 2.5 6.4 15.3
Lippo Malls Indo. Ret. Trust LMRT.SI 773 0.44 0.60 38.3 Not rated Dec 7.3 13.6 0.7 0.8 6.7 (0.3) 1.2 4.8 10.1
Low Keng Huat (SG) LKH.SI 279 0.47 0.48 3.6 Not rated Jan n.a. 3.2 n.a. 0.8 6.6 (0.7) 3.3 5.7 16.3
Luye Pharma. LUYE.SI 519 1.30 1.48 14.2 Not rated Dec 21.6 18.6 2.4 2.2 13.7 6.5 3.6 3.6 23.9
M1 MONE.SI 2,025 2.73 3.00 9.9 OUTPERFORM Dec 15.1 15.8 7.7 7.1 8.9 2.4 6.6 7.5 11.4
Mandarin Oriental MOIL.SI 1,139 $1.40 $1.14 (18.8) Not rated Dec 20.5 22.1 1.5 1.5 3.8 (2.6) 1.4 0.7 8.5
Manhattan Resources MANH.SI 253 0.62 0.14 (76.5) Not rated Dec (26.0) (43.4) 2.6 2.6 (11.6) (18.9) (3.1) (5.4) (16.9)
Mapletree Commercial Trust MACT.SI 1,749 1.15 1.20 4.3 OUTPERFORM Mar 24.6 20.8 1.2 1.2 4.3 (2.3) 2.2 5.5 21.1
Mapletree Industrial Trust MAPI.SI 1,836 1.39 1.24 (10.5) NEUTRAL Mar 18.7 16.6 1.4 1.3 6.1 (0.4) 0.7 6.9 18.4
Mapletree Logistics Trust MAPL.SI 2,230 1.13 1.14 0.9 OUTPERFORM Mar 14.1 14.7 1.3 1.2 4.7 (1.7) 0.4 10.8 15.3
Mermaid Maritime MMPC.SI 179 0.28 0.10 (63.2) Not rated Sep (21.6) 1.1 0.6 0.1 (10.2) (16.4) 0.0 7.7 12.0
Metro MTHL.SI 528 0.78 34.47 4,319.0 Not rated Mar 6.8 14.7 n.a. 0.6 2.3 (4.8) 2.0 2.6 0.6
Mewah MEWI.SI 552 0.45 0.29 (34.8) Not rated Dec 13.0 11.0 1.0 0.9 3.6 (3.2) 5.9 8.4 13.9
Midas MIDA.SI 401 0.41 0.35 (13.0) NEUTRAL Dec 12.2 22.6 0.9 0.8 3.7 (3.3) 12.5 24.6 42.1
NSL NATS.SI 421 1.39 2.39 72.8 Not rated Dec 5.2 5.0 0.9 0.9 1.9 (5.4) 0.7 3.0 7.4
Orchard Parade FARE.SI 699 2.28 4.43 94.2 Not rated Dec 6.6 6.3 0.8 0.7 7.5 0.4 0.0 (1.7) 24.3
OSIM OSIL.SI 826 1.35 1.85 37.0 OUTPERFORM Dec 13.3 12.2 6.0 4.8 15.1 8.2 3.1 3.1 20.0
Otto Marine OTTO.SI 198 0.09 -0.05 (152.8) Not rated Dec (2.7) 7.8 0.5 0.4 (7.8) (15.0) (1.1) 0.0 (1.1)
Overseas Union Enterprise OVES.SI 2,084 2.61 2.85 9.3 OUTPERFORM Dec 28.5 19.7 0.8 0.8 2.0 (4.3) 6.5 4.4 26.1
PAC Andes PACF.SI 577 0.15 0.27 83.6 Not rated Sep 5.2 5.9 0.4 0.5 6.9 0.1 0.0 (0.7) 0.0
P/E (x) P/B (x) S$ term (%)
Calendarized Calendarized Share price performance
* Include the small-cap stocks in HOLT® database with market cap between US$150 mn and US$2 bn. For stocks that are Not Rated, I/B/E/S consensus forecast are used. CFROI® is a
registered trademark in the United States and other countries (excluding the United Kingdom) of Credit Suisse or its subsidiaries or affiliates.
* Companies in bold and italic indicate constituents of Credit Suisse Singapore Small Cap Index

14 S
ep
tem
ber 2
01
2
David
& G
olia
th
76
Valuations of Credit Suisse Singapore small-cap watch list* Market CS target/ Potential Credit Year HOLT CFROI
Cap Price HOLT warranted return Suisse end CFROI Spread
Company RIC (US$ mn) (S$) price (S$) (%) Rating month 2011 2012 2011 2012 (%) (%) 1W 1M 3M
PAC Century Regional Dev. PCEN.SI 441 0.18 0.20 16.0 Not rated Dec 10.0 5.6 0.9 0.8 (2.4) (9.7) 0.6 (3.3) 2.3
Pan Pacific Hotels PPHG.SI 1,030 2.11 1.14 (46.0) Not rated Dec 27.0 n.a. 1.6 n.a. 4.0 (1.9) 1.4 4.5 22.3
Pan-United PANU.SI 306 0.68 0.81 20.3 Not rated Dec 12.3 10.7 1.3 1.2 8.5 0.9 0.7 12.5 26.2
Parkw ay Life REIT PWLR.SI 960 1.95 1.20 (38.4) Not rated Dec 11.6 19.3 1.3 1.3 5.1 (1.7) (1.8) (0.3) 6.3
People's Food PPFH.SI 584 0.64 0.87 36.3 Not rated Dec 28.5 88.0 0.7 0.6 (0.9) (7.9) 0.8 11.4 22.1
Petra Foods PEFO.SI 1,193 2.40 1.14 (52.3) Not rated Dec 19.6 19.2 3.8 3.3 8.8 2.1 0.0 5.7 (1.6)
Raffles Education RLSE.SI 302 0.43 0.48 12.9 NEUTRAL Jun 25.4 (112.3) 0.7 0.7 0.4 (6.6) 39.3 14.9 11.8
Raffles Medical RAFG.SI 1,035 2.34 2.50 6.8 NEUTRAL Dec 25.0 22.6 3.7 3.4 10.7 3.9 (2.5) (0.4) 6.4
Rotary Engineering ROTE.SI 226 0.49 0.59 19.5 Not rated Dec 8.9 19.6 1.0 0.9 7.5 0.2 1.0 (2.0) 1.0
Sakari Resources SAKR.SI 1,729 1.87 1.45 (22.5) NEUTRAL Dec 9.1 17.1 2.7 2.8 18.0 11.6 (0.3) 28.1 47.2
Sarin Techs. SARI.SI 260 0.94 3.75 299.2 Not rated Dec 14.7 9.3 5.1 3.8 31.5 23.7 3.3 (14.2) (21.0)
Singapore Airport SATS.SI 2,395 2.65 2.90 9.5 NEUTRAL Mar 16.6 15.8 1.9 2.0 8.1 1.7 1.1 6.0 1.9
SBS Transit SBVV.SI 374 1.49 1.91 28.0 Not rated Dec 12.5 12.1 1.4 1.4 3.1 (3.9) 0.7 (2.6) (3.2)
SC Global SCGO.SI 369 1.10 0.07 (93.7) Not rated Dec 3.4 8.9 0.7 0.7 5.2 (1.8) 11.7 12.3 13.5
Second Chance SECD.SI 185 0.41 0.45 11.6 Not rated Jun 5.1 6.5 n.a. 1.1 7.8 (0.2) (1.2) 5.2 9.5
Sheng Siong SHEN.SI 540 0.48 0.28 (41.3) Not rated Dec 21.7 20.9 4.6 4.1 9.9 2.7 1.1 6.7 18.5
Silverlake Axis SLVX.SI 751 0.43 0.60 38.6 Not rated Jun n.a. 16.8 n.a. 9.5 69.2 62.1 6.2 10.3 21.1
Sinarmas Land SINA.SI 668 0.27 0.52 93.3 Not rated Dec 9.2 8.9 0.8 0.8 7.0 0.1 0.0 0.0 (11.5)
Singapore Land SLND.SI 2,301 6.86 12.06 75.7 Not rated Dec 8.6 13.0 0.6 0.6 4.4 (2.0) 13.6 13.0 26.3
Singapore Post SPOS.SI 1,713 1.09 0.45 (58.5) Not rated Mar 14.5 15.3 6.5 3.5 10.3 3.8 0.9 2.3 6.9
SMRT SMRT.SI 2,065 1.67 1.60 (4.0) NEUTRAL Mar 16.8 17.9 3.2 3.1 5.4 (1.0) 0.9 0.6 2.1
Sound Global SOGL.SI 598 0.57 0.80 40.3 Not rated Dec 9.1 8.4 1.6 1.4 12.3 5.3 0.9 (5.0) 4.6
Stamford Land SFLD.SI 390 0.56 0.55 (0.8) Not rated Mar 8.7 10.9 n.a. 0.9 4.8 (2.3) 3.7 0.9 1.8
Starhill Global REIT STHL.SI 1,177 0.75 0.59 (21.3) Not rated Dec 13.9 16.2 0.9 0.8 4.0 (2.7) (0.7) 2.8 18.3
STATS ChipPAC STTS.SI 636 0.36 0.65 84.2 Not rated Dec (251.9) 14.6 0.6 0.6 3.4 (3.2) 10.9 6.0 (7.8)
Straits Trading STCM.SI 782 2.95 1.56 (47.0) Not rated Dec 21.1 57.4 0.8 0.8 1.4 (5.3) (2.0) (4.5) 0.0
STX OSV STXO.SI 1,579 1.65 1.50 (8.8) NEUTRAL Dec 5.7 7.6 2.6 2.6 21.5 14.8 1.5 6.1 13.4
STX Pan Ocean STXPx.SI 707 4.22 6.48 53.6 Not rated Dec (179.2) (2.2) 0.3 0.3 (2.5) (8.8) 6.0 (10.2) (11.3)
Super Group SPGP.SI 916 2.02 1.34 (33.8) Not rated Dec 18.2 17.0 3.1 2.9 9.7 2.6 (1.5) (6.0) (6.0)
Swiber SWBR.SI 311 0.63 0.34 (46.0) Not rated Dec 8.0 8.2 0.7 0.6 2.6 (4.6) 5.9 6.8 9.6
Calendarized Calendarized Share price performance
P/E (x) P/B (x) S$ term (%)
* Include the small-cap stocks in HOLT® database with market cap between US$150 mn and US$2 bn. For stocks that are Not Rated, I/B/E/S consensus forecast are used. CFROI® is a
registered trademark in the United States and other countries (excluding the United Kingdom) of Credit Suisse or its subsidiaries or affiliates.
* Companies in bold and italic indicate constituents of Credit Suisse Singapore Small Cap Index

14 S
ep
tem
ber 2
01
2
David
& G
olia
th
77
Valuations of Credit Suisse Singapore small-cap watch list* Market CS target/ Potential Credit Year HOLT CFROI
Cap Price HOLT warranted return Suisse end CFROI Spread
Company RIC (US$ mn) (S$) price (S$) (%) Rating month 2011 2012 2011 2012 (%) (%) 1W 1M 3M
Tat Hong TAT.SI 536 1.30 1.30 0.0 OUTPERFORM Mar 19.4 12.3 1.4 1.2 4.9 (2.3) 9.2 25.0 32.7
Tiger Airways TAHL.SI 494 0.74 0.70 (5.4) UNDERPERFORM Mar (9.4) (38.0) 2.4 2.3 (7.8) (14.6) 3.5 5.7 14.7
Tuan Sing TSHS.SI 288 0.31 0.11 (65.1) Not rated Dec 8.7 15.4 0.6 1.2 (0.2) (7.4) 5.2 5.2 13.0
United Engineers UTES.SI 590 2.39 1.73 (27.4) Not rated Dec 2.5 15.5 0.6 0.5 9.0 2.0 5.8 4.4 12.2
United Fiber System UFSL.SI 148 0.05 0.03 (46.3) Not rated Dec (4.0) (3.9) 1.7 1.6 (15.2) (23.0) 0.0 (4.0) (14.3)
United Int'l Securities UTSS.SI 186 1.14 0.75 (34.1) Not rated Dec 47.7 22.7 0.8 0.8 (0.2) (9.3) 0.9 0.9 (0.9)
UOB Kay Hian UOKH.SI 955 1.62 1.34 (17.4) Not rated Dec 12.8 12.2 1.1 1.0 5.0 (3.7) 0.9 (0.6) 1.9
Venture VENM.SI 1,772 7.94 8.25 3.9 NEUTRAL Dec 13.9 14.2 1.2 1.2 8.9 2.4 1.1 3.5 2.5
WBL WEAS.SI 765 3.48 3.64 4.5 Not rated Sep 9.8 12.0 1.0 1.3 4.0 (2.9) 3.3 4.2 7.1
Wheelock Properties WPSL.SI 1,796 1.85 2.44 32.4 Not rated Dec 7.6 18.8 0.8 0.7 5.9 (0.6) 0.8 0.0 10.5
Wing Tai WTHS.SI 1,065 1.65 1.44 (12.6) NEUTRAL Jun 7.6 8.3 0.7 0.6 5.3 (1.4) 9.3 18.7 30.4
XinRen Aluminum XIRN.SI 293 0.28 0.08 (70.2) Not rated Dec 3.7 7.4 0.9 0.8 6.7 (0.4) 1.9 0.0 (6.8)
Yanlord YNLG.SI 1,926 1.22 1.09 (10.2) Not rated Dec 8.2 11.4 0.8 0.7 3.4 (3.0) 7.5 (2.8) 6.6
Yeo Hiap Seng YHSS.SI 873 1.87 1.22 (34.6) Not rated Dec 26.0 30.0 2.2 1.7 3.4 (3.7) 1.1 (18.7) 31.7
Ying Li Int'l Real Estate YING.SI 607 0.35 0.35 1.4 Not rated Dec 13.6 9.9 1.3 1.2 2.2 (4.8) 9.5 11.3 25.5
Yongnam YNAM.SI 241 0.24 0.40 70.2 OUTPERFORM Dec 4.6 5.6 1.0 0.9 12.2 4.8 2.2 4.4 2.2
Calendarized Calendarized Share price performance
P/E (x) P/B (x) S$ term (%)
* Include the small-cap stocks in HOLT® database with market cap between US$150 mn and US$2 bn. For stocks that are Not Rated, I/B/E/S consensus forecast are used. CFROI® is a
registered trademark in the United States and other countries (excluding the United Kingdom) of Credit Suisse or its subsidiaries or affiliates.
* Companies in bold and italic indicate constituents of Credit Suisse Singapore Small Cap Index

14 S
ep
tem
ber 2
01
2
David
& G
olia
th
78
Singapore – Screening Absolute price performance - top & bottom 10 companies Absolute price performance - top & bottom 10 companies Absolute price performance - top & bottom 10 companies
Price 1W return Price 1M return Price 3M return Company RIC (S$) (%) Company RIC (S$) (%) Company RIC (S$) (%)
Winners Winners Winners Raffles Education RLSE.SI 0.43 39.3 Sakari Resources SAKR.SI 1.87 28.1 Hotel Properties HPPS.SI 2.87 49.9 Singapore Land SLND.SI 6.86 13.6 Tat Hong TAT.SI 1.30 25.0 Ezion EZHL.SI 1.26 49.1 Ezion EZHL.SI 1.26 13.5 Midas MIDA.SI 0.41 24.6 Sakari Resources SAKR.SI 1.87 47.2 Midas MIDA.SI 0.41 12.5 Hotel Properties HPPS.SI 2.87 23.7 Midas MIDA.SI 0.41 42.1 SC Global SCGO.SI 1.10 11.7 Ezion EZHL.SI 1.26 22.9 Fortune REIT FORT.SI 5.82 33.5 STATS ChipPAC STTS.SI 0.36 10.9 Wing Tai WTHS.SI 1.65 18.7 Hi-P HIPI.SI 1.00 32.7 Hotel Properties HPPS.SI 2.87 10.8 Hi-P HIPI.SI 1.00 16.4 Tat Hong TAT.SI 1.30 32.7 Ho Bee HBEE.SI 1.42 9.7 Ezra EZRA.SI 1.15 15.0 K1 Ventures KMAR.SI 0.13 32.7 CSE Global CSES.SI 0.92 9.6 Raffles Education RLSE.SI 0.43 14.9 Yeo Hiap Seng YHSS.SI 1.87 31.7 Ying Li Int'l Real Estate YING.SI 0.35 9.5 Chip Eng Seng CESE.SI 0.47 14.6 Wing Tai WTHS.SI 1.65 30.4
Losers Losers Losers China Animal Healthcare CAHC.SI 0.25 (5.8) Yeo Hiap Seng YHSS.SI 1.87 (18.7) KS Energy KSTL.SI 0.74 (21.7) Chemoil Energy CHEL.SI 0.35 (5.4) Sarin Techs. SARI.SI 0.94 (14.2) Sarin Techs. SARI.SI 0.94 (21.0) Manhattan Resources MANH.SI 0.62 (3.1) Elec & Eltek EELT.SI 2.32 (10.4) Manhattan Resources MANH.SI 0.62 (16.9) Raffles Medical RAFG.SI 2.34 (2.5) STX Pan Ocean STXPx.SI 4.22 (10.2) United Fiber System UFSL.SI 0.05 (14.3) Li Heng Chemical Fibre LHCF.SI 0.14 (2.1) Super Group SPGP.SI 2.02 (6.0) Elec & Eltek EELT.SI 2.32 (14.1) Straits Trading STCM.SI 2.95 (2.0) China Animal Healthcare CAHC.SI 0.25 (5.8) China Fishery CNFG.SI 0.76 (13.6) Jaya JAYA.SI 0.55 (1.8) Manhattan Resources MANH.SI 0.62 (5.4) Sinarmas Land SINA.SI 0.27 (11.5) Parkway Life REIT PWLR.SI 1.95 (1.8) China Fishery CNFG.SI 0.76 (5.0) STX Pan Ocean STXPx.SI 4.22 (11.3) China XLX Fertiliser CXLX.SI 0.30 (1.6) Sound Global SOGL.SI 0.57 (5.0) China Animal Healthcare CAHC.SI 0.25 (10.9) Ascott Residence Trust ASRT.SI 1.22 (1.6) China XLX Fertiliser CXLX.SI 0.30 (4.8) Creative Technology CREA.SI 3.10 (10.7)
Price-to-earnings - most & least expensive 10 companies Price-to-book - most & least expensive 10 companies CFROI® Spread - top & bottom 10 companies
Price 12 P/E Price 12 P/B Price CFROI® Spread Company RIC (S$) (x) Company RIC (S$) (x) Company RIC (S$) (%)
Winners Winners Winners Mermaid Maritime MMPC.SI 0.28 1.1 Mermaid Maritime MMPC.SI 0.28 0.1 Silverlake Axis SLVX.SI 0.43 62.1 Chip Eng Seng CESE.SI 0.47 2.0 STX Pan Ocean STXPx.SI 4.22 0.3 China Merchants CAEP.SI 0.73 37.5 Low Keng Huat (SG) LKH.SI 0.47 3.2 Li Heng Chemical Fibre LHCF.SI 0.14 0.3 ARA Asset Management ARAM.SI 1.51 29.9 China Minzhong Food CMFC.SI 0.75 3.4 China New Town Dev. CNTW.SI 0.05 0.4 Sarin Techs. SARI.SI 0.94 23.7 Lian Beng LIBG.SI 0.42 4.1 Otto Marine OTTO.SI 0.09 0.4 Aspial ASPA.SI 0.41 21.1 Hiap Hoe HIAP.SI 0.61 4.8 PAC Andes PACF.SI 0.15 0.5 STX OSV STXO.SI 1.65 14.8 NSL NATS.SI 1.39 5.0 DMX Technologies DMXT.SI 0.22 0.5 Biosensors BIOS.SI 1.23 12.5 China Fishery CNFG.SI 0.76 5.4 United Engineers UTES.SI 2.39 0.5 Sakari Resources SAKR.SI 1.87 11.6 Hour Glass HRGS.SI 1.40 5.4 Gallant Venture GLVT.SI 0.29 0.6 Bumitama Agri BUMI.SI 1.12 9.0 Yongnam YNAM.SI 0.24 5.6 Hotel Grand Central HGCS.SI 0.80 0.6 OSIM OSIL.SI 1.35 8.2 Losers Losers Losers Banyan Tree BANY.SI 0.58 116.0 Silverlake Axis SLVX.SI 0.43 9.5 United Fiber System UFSL.SI 0.05 (23.0) People's Food PPFH.SI 0.64 88.0 M1 MONE.SI 2.73 7.1 Manhattan Resources MANH.SI 0.62 (18.9) Gallant Venture GLVT.SI 0.29 87.5 ARA Asset Management ARAM.SI 1.51 5.1 Mermaid Maritime MMPC.SI 0.28 (16.4) Straits Trading STCM.SI 2.95 57.4 Cerebos CERE.SI 6.55 5.0 KS Energy KSTL.SI 0.74 (15.5) Hwa Hong HWHS.SI 0.36 51.4 OSIM OSIL.SI 1.35 4.8 Otto Marine OTTO.SI 0.09 (15.0) G.K. Goh GKHS.SI 0.74 36.9 Sheng Siong SHEN.SI 0.48 4.1 Creative Technology CREA.SI 3.10 (14.9) Yeo Hiap Seng YHSS.SI 1.87 30.0 Sarin Techs. SARI.SI 0.94 3.8 K1 Ventures KMAR.SI 0.13 (14.8) Frasers Commercial Trust FRCR.SI 1.16 27.8 Singapore Post SPOS.SI 1.09 3.5 Tiger Airways TAHL.SI 0.74 (14.6) K-REIT KASA.SI 1.14 23.9 Raffles Medical RAFG.SI 2.34 3.4 China New Town Dev. CNTW.SI 0.05 (10.5) Hyflux HYFL.SI 1.40 23.4 Bumitama Agri BUMI.SI 1.12 3.3 G.K. Goh GKHS.SI 0.74 (10.3)
* For stocks that are not rated, I/B/E/S consensus forecast numbers are used. CFROI® Spread is the difference between CFROI® and market implied discount rate. A larger number indicates
that more value is created by a company

14 September 2012
David & Goliath 79
Taiwan – Company updates E Ink (8069.TWO, NT$32.40, N [V], TP NT$35.00) Hiwin (2049.TW, NT$212.00, U [V], TP NT$195.00)
ePaper shipment recovery to drive the year-end rally
■ E Ink’s August sales of NT$2.55 bn were up 41% MoM, driven by
EPD shipment recovery. We believe the strong EPD monthly
sales momentum should continue into October. We now estimate
3Q12 sales of NT$7.7 bn, up 73% QoQ from the low base in
2Q12.
■ EPD is the key to drive 2H12 recovery and gross margin should
also improve on a greater scale of EPD shipments. However,
2012 EPD GM will still be lower than 2011 30%+ given product
mix and structure change (touch is a pass-through cost). We
estimate EPD to account for 46% of sales in 2012 vs 68% in
2011.
■ We note there are positive reviews for Amazon’s new tablets but
think there is limited upside for E Ink’s FFS shipments given
lower market share vs in 2011. However, E Ink is in talks with
other panel-makers for potential licensing or partnerships which
could bring more royalty income and help it to gain shares longer
term.
■ We raise 2012E earnings on better 3Q and raise our TP to
NT$35, based on 1.5x 12M P/B. Maintain our NEUTRAL rating
but think the stock will rebound on better revenue momentum.
Inventory remains an issue
■ We remain concerned about Hiwin’s high inventory. Its 2Q12
finished goods inventory was up 370% YoY, 38% of total
inventory vs 12% in 1Q. Our checks with equipment-makers and
distributors suggest channel inventory is still at a relatively high
level, and lead time has been shortened to 2-4 weeks from 3-4
months in 2011.
■ We also learned ASP has dropped 10%+ YTD, and the high
channel inventory could potentially trigger more ASP cuts. Some
distributors also said channel inventory is still piling up given
upstream continues to stuff the channel to maintain top-lines.
■ Based on preliminary August export data, Taiwan’s linear motion
exports remain challenging as they dropped 40% YoY to US$39
mn. Exports to China (~50% of total) remain weak with a 34%
YoY decline in August, while Germany and US saw sequential
growth.
■ We remain UNDERPERFORM with a NT$195 TP on 15x 12M
P/E. We agree Hiwin has good technology but continue to see
high inventory, ASP cuts, solar investment and low dividend as
key concerns. Trading at 18x 2012E P/E (vs 11-22x since 2011),
we do not see a re-rating catalyst absent a macro recovery.
Bbg/RIC 31.70
35.00 (30.00)
1,080.46 10
4.1
4.8
Free float (%) 71.2 Performance 1M 3M 12M
Absolute (%) (3.9) 9.9 (55.0)
Relativ e (%) (3.7) 5.6 (52.5)
Year 12/10A 12/11A 12/12E 12/13E 12/14E
25,179 38,428 23,591 38,061 42,113
6,726 9,268 505 4,277 4,961
4,028 6,527 -775 2,889 3,899
3.81 6.05 (0.72) 2.67 3.61
n.a. n.a. n.m 0 0
n.a. n.a. (0.58) 1.50 2.52
n.m. 58.5 n.m. n.m. 35.0
8.3 5.2 n.m. 11.9 8.8
8.4 9.5 0.0 5.5 7.4
5.4 4.2 70.7 8.1 7.0
1.4 1.2 1.4 1.3 1.2
18.1 24.7 -3.0 11.4 14.0
8.3 16.3 6.1 2.0 2.4
72.0 - 27.8
34,250.5/ 1,154.0
ROE (%)
Mkt cap (NT$/US$ mn)Daily trad v al - 6m av g (US$ mn)
Major shareholders Yuen Foong Yu (10.52%)
Net debt(cash)/equity (%)
Rev enue (NT$ mn)
52-w k range (NT$)
8069 TT / 8069.TWO
N (N) [V]
Daily trad v ol - 6m av g (mn)
Rating (prev. rating)
Shares outstanding (mn)
Price (07 Sep 12 , NT$)
TP (prev. TP NT$)
Est. pot. % chg. to TP
EBITDA (NT$ mn)
Net profit (NT$ mn)
EPS (NT$)
- Change from prev . EPS (%)
- Consensus EPS (NT$)
EPS grow th (%)
P/E (x )
Div idend y ield (%)
EV/EBITDA (x )
P/B (x )
Bbg/RIC 212.00
195.00
246.43 (8)
1.9
18.0
Free float (%) 75 Performance 1M 3M 12M
Absolute (%) (15.9) (23.6) (23.2)
Relativ e (%) (15.7) (27.9) (20.8)
Year 12/10A 12/11A 12/12E 12/13E 12/14E
8,210 14,134 11,683 14,004 16,156
2,550 4,779 4,268 5,066 5,869
1,689 3,809 2,947 3,594 4,163
6.90 15.50 12.00 14.60 16.90
n.a. n.a. 0 0 0
n.a. n.a. 13.50 14.80 19.00
476.6 125.5 -22.6 21.9 15.8
30.9 13.7 17.7 14.5 12.5
1.4 2.6 2.0 2.4 2.8
21.8 12.1 14.0 11.3 10.2
8.4 5.6 5.7 4.6 3.8
31.2 48.9 31.8 34.9 33.0
56.5 60.8 80.9 45.7 54.5
323.8 - 191.9
52,242.7/ 1,760.2
ROE (%)
Note 1: Established in 1989, Hiwin is an automation equipment and machine supplier in Taiwan.
Mkt cap (NT$/US$ mn)Daily trad v al - 6m av g (US$ mn)
Major shareholders Ta Yin Inv estment (8.3%)
Net debt(cash)/equity (%)
Rev enue (NT$ mn)
52-w k range (NT$)
2049 TT / 2049.TW
U (U) [V]
Daily trad v ol - 6m av g (mn)
Rating (prev. rating)
Shares outstanding (mn)
Price (07 Sep 12 , NT$)
TP (prev. TP NT$)
Est. pot. % chg. to TP
EBITDA (NT$ mn)
Net profit (NT$ mn)
EPS (NT$)
- Change from prev . EPS (%)
- Consensus EPS (NT$)
EPS grow th (%)
P/E (x )
Div idend y ield (%)
EV/EBITDA (x )
P/B (x )
Price performance vs. MSCI Taiwan Price performance vs. MSCI Taiwan
40
60
80
100
120
09/11 11/11 01/12 03/12 05/12 07/12 09/12
E Ink MSCI Taiwan
60
75
90
105
120
09/11 11/11 01/12 03/12 05/12 07/12 09/12
Hiwin MSCI Taiwan
Jerry Su / Research Analyst / 886 2 2715 6361 /
Extracted from The Asian Daily 10 Sep 2012
Jerry Su / Research Analyst / 886 2 2715 6361 /
Extracted from The Asian Daily 10 Sep 2012

14 September 2012
David & Goliath 80
Taiwan – Company updates Novatek (3034.TW, NT$103.50, O, TP NT$118.00) Lextar (3698.TW, NT$30.65, N [V], TP NT$37.00)
New report: Resolution migration, mid-sized devices, and share gains driving
future growth
■ We raise Novatek’s 2012-14 EPS estimates by 1-4% to reflect
the rapid growth potential in mid-sized 7-13” devices, and
potential market share gain in smartphone and non-driver IC
segments. We lift our TP to NT$118 (from NT$107), based on
13x 2013E P/E and NT$5.5 cash dividend (same multiple).
■ Besides the ongoing resolution migration, we think the street has
underestimated Novatek’s growth potential from mid-size
devices. We estimate mid-sized devices to see ~25% CAGR in
2012-2015 and Novatek’s growth potential could be similar to
that.
■ Besides share gain in large size driver IC, Novatek is also gaining
share in the smartphone and non-driver IC market, thanks to the
higher specification for smartphone drivers, and growth from TV
chipset business given customers’ supplier diversification
strategy.
■ The stock is trading at 11.6x 2013E P/E and is supported by a
5.5% cash dividend yield. Near-term catalysts are better 3Q sales
and margin, Apple’s iPad min launch, and share gain in mid-size
devices, smartphone, and TV chipsets.
Uncertain synergy from the Wellypower acquisition
■ Lextar announced its plans to acquire Wellypower based on a 1:2
share swap (1.5% premium). Lextar will issue additional 85 mn
shares (17% dilution) for the deal and expects to conclude the
transaction on 1 February 2013, post regulatory approvals.
■ Post the transaction, Lextar’s LED packaging capacity will
increase from 800 mn units/month to 1 bn units/month while
maintaining an LED wafer capacity of ~100,000/month on 2”
equivalent basis. Lextar thinks the Wellypower acquisition will
enhance its LED packaging, lightbar and lighting
competitiveness.
■ Lextar outsources LED packaging and lightbar assembly to
Wellypower. Wellypower’s 2011 sales mix was 60% LED, 27%
CCFL and 6% lighting. Main customers are AUO related (~30%
of sales), Forehouse (~20%) and Radiant (~19%) in 1Q12.
■ We are less positive on the deal given uncertain synergy.
Wellypower is still in operating loss in 1H12, it will require
significant turnaround (i.e. ~8% GM) in 2013 to make the deal
accretive. We see downside to our earnings forecast if Lextar
fails to turn Wellypower’s business around in 2013.
Bbg/RIC 100.00
118.00
603.20 18
1.7
5.0
Free float (%) 75.5 Performance 1M 3M 12M
Absolute (%) 9.5 16.3 33.9
Relativ e (%) 9.0 10.5 35.5
Year 12/10A 12/11A 12/12E 12/13E 12/14E
36,261 35,034 35,231 39,729 42,506
5,622 4,619 5,729 6,730 7,186
4,584 3,695 4,392 5,192 5,573
7.70 6.10 7.30 8.60 9.20
n.a. n.a. 1 4 4
n.a. n.a. 6.95 7.97 8.72
13.3 -20.2 18.6 18.2 7.3
13.0 16.3 13.7 11.6 10.8
5.8 4.6 5.5 6.5 6.6
9.3 11.3 8.9 7.4 6.9
2.7 2.7 2.9 2.8 2.7
21.9 16.8 20.6 24.6 25.2
-36.7 -36.8 -45.9 -47.0 -48.6
- Consensus EPS (NT$)
EPS grow th (%)
P/E (x )
Div idend y ield (%)
EV/EBITDA (x )
P/B (x )
EBITDA (NT$ mn)
Net profit (NT$ mn)
EPS (NT$)
- Change from prev . EPS (%)
Price (10 Sep 12 , NT$)
TP (prev. TP NT$)
Est. pot. % chg. to TP
52-w k range (NT$)
3034 TT / 3034.TW
O (O)
Daily trad v ol - 6m av g (mn)
Rating (prev. rating)
Shares outstanding (mn)
100.0 - 68.5
60,320.4/ 2,032.6
ROE (%)
Note1:Novatek is a fabless chip design company specializing in the design, development and sales of a wide range of display driver ICs & SoC solutions.
Mkt cap (NT$/US$ mn)Daily trad v al - 6m av g (US$ mn)
Major shareholders UMC (10.27%)
Net debt(cash)/equity (%)
Rev enue (NT$ mn)
Bbg/RIC 30.65
37.00 (37.00)
419.50 21
1.5
1.7
Free float (%) 48.4 Performance 1M 3M 12M
Absolute (%) 10.6 (5.5) 40.0
Relativ e (%) 9.3 (11.5) 35.1
Year 12/10A 12/11A 12/12E 12/13E 12/14E
8,058 9,103 10,535 13,333 16,141
2,387 1,641 2,543 3,298 3,646
1,231 -138 426 880 1,095
3.28 (0.35) 1.02 2.10 2.61
n.a. n.a. 0 0 0
n.a. n.a. 1.05 1.74 2.61
n.a. n.m. n.m. 106.5 24.4
9.3 n.m. 30.2 14.6 11.7
0.0 0.0 0.0 1.3 3.4
7.1 11.1 7.8 5.3 4.5
1.6 1.6 1.5 1.4 1.3
15.6 -1.7 5.2 10.1 11.8
52.5 67.4 83.9 50.6 37.0
41.7 - 17.3
12,857.8/ 434.8
ROE (%)
Note1:Lextar is involved in LED wafer production, LED chip packaging and light bar assembly for display backlights..
Mkt cap (NT$/US$ mn)Daily trad v al - 6m av g (US$ mn)
Major shareholders AUO group (45.4%)
Net debt(cash)/equity (%)
Rev enue (NT$ mn)
52-w k range (NT$)
3698 TT / 3698.TW
N (N) [V]
Daily trad v ol - 6m av g (mn)
Rating (prev. rating)
Shares outstanding (mn)
Price (13 Sep 12 , NT$)
TP (prev. TP NT$)
Est. pot. % chg. to TP
EBITDA (NT$ mn)
Net profit (NT$ mn)
EPS (NT$)
- Change from prev . EPS (%)
- Consensus EPS (NT$)
EPS grow th (%)
P/E (x )
Div idend y ield (%)
EV/EBITDA (x )
P/B (x )
Price performance vs. MSCI Taiwan Price performance vs. MSCI Taiwan
85
100
115
130
145
09/11 11/11 01/12 03/12 05/12 07/12 09/12
Novatek MSCI Taiwan
60
90
120
150
180
09/11 11/11 01/12 03/12 05/12 07/12 09/12
Lextar MSCI Taiwan
Jerry Su / Research Analyst / 886 2 2715 6361 /
Extracted from The Asian Daily 11 Sep 2012
Jerry Su / Research Analyst / 886 2 2715 6361 /
Extracted from The Asian Daily 14 Sep 2012

14 September 2012
David & Goliath 81
Taiwan – Company updates Spreadtrum Communication (SPRD.OQ, $20.27, O [V], TP
$26.50)
Taiwan Surface Mounting Technology (6278.TW,
NT$49.80, N, TP NT$54.00)
New report: Smartphone ramp gains momentum
■ Smartphones are witnessing good traction. Spreadtrum is seeing
a solid ramp-up across its branded Chinese customers including
Huawei, ZTE, K-Touch, Lenovo, Hisense, Haier and Konka, while
Samsung is also likely to follow in 4Q12. Constraints at Mediatek
have opened up some low-cost EDGE designs. We raise our
2012 estimates from US$25 mn to US$27.5 mn and 2013 from
US$86 mn to US$90 mn.
■ Spreadtrum is set to move to higher-end with dual and quad core
processors in 1H13 and into the WCDMA channel with its first
smartphone chipset for 1Q13.
■ On higher smartphone projections, we raise our 2012 revenue
and EPS estimates from US$686mn and $2.11 to US$702mn
and $2.20; we raise our 2013 estimates from $769mn and $2.27
to $794mn and $2.42 (against street estimates of $2.08/$2.30)
due to higher expectation on smartphones and modest GM
recovery.
■ Spreadtrum is trading at 9.5x 2012E EPS. We raise our target
from $21.50 to $26.50, rolling over to 2013 and based on 13x US
GAAP and 11x Pro Forma EPS.
Softer outlook ahead with slower-than-expected margin expansion
■ We downgrade TSMT to NEUTRAL and lower TP to NT$54,
based on same 11x 12M forward P/E, mainly to reflect 1) softer
new iPad shipment in 2H12/FY13, 2) slower GM expansion, and
3) market share loss on the merger of Lextar and Wellypower.
■ We are seeing a weaker new iPad demand on the upcoming
iPad-mini, which is unfavourable to TSMT’s lightbar business. Its
4Q12 new iPad shipment will be flattish to 3Q level and we hold a
more conservative view on its FY13 shipment, largely due to the
decreasing order allocation for Samsung display panel.
■ While TSMT is confident on GM expansion, we are less positive
on margin improvement now, on 1) control board sales mix
should remain at <50% level in FY12-13, 2) small upside from
existing high UT, and 3) limited support from new products (LED
lighting and white goods), which carry higher margin, in FY12-13.
■ TSMT should continue to benefit from the ongoing LED
penetration and lighting trend, but we are also concerned about
market share loss as well as its execution ability. We will turn
positive again if we see a clear sign of margin improvement and
better execution.
Bbg/RIC 20.75
26.50 (21.50)
48.27 28
0.3
4.8
Free float (%) 50 Performance 1M 3M 12M
Absolute (%) 20.1 7.8 1.6
Relativ e (%) 22.8 8.4 2.9
Year 12/10A 12/11A 12/12E 12/13E 12/14E
346.3 674.3 701.5 794.4 870.5
79.6 156.4 118.3 140.3 162.4
66.1 135.0 90.3 108.0 126.1
1.27 2.51 1.75 2.05 2.34
n.a. n.a. 6 8 12
n.a. n.a. 1.96 2.24 2.58
n.m. 97.8 -30.3 17.1 14.5
16.4 8.3 11.9 10.1 8.9
0.0 0.0 0.0 0.0 0.0
10.3 5.0 7.0 5.4 4.0
-25.7 3.6 3.1 2.6 2.1
-93.6 100.5 27.7 28.0 26.2
-91.5 -72.0 -47.0 -53.5 -62.5
29.3 - 13.2
1,001.7
ROE (%)
Mkt cap (US$ mn)Daily trad v al - 6m av g (US$ mn)
Major shareholders New Enterprise (14.3%)
Net debt(cash)/equity (%)
Rev enue (US$ mn)
52-w k range (US$)
SPRD US / SPRD.OQ
O (O) [V]
Daily trad v ol - 6m av g (mn)
Rating (prev. rating)
Shares outstanding (mn)
Price (12 Sep 12 , US$)
TP (prev. TP US$)
Est. pot. % chg. to TP
EBITDA (US$ mn)
Net profit (US$ mn)
EPS (US$)
- Change from prev . EPS (%)
- Consensus EPS (US$)
EPS grow th (%)
P/E (x )
Div idend y ield (%)
EV/EBITDA (x )
P/B (x )
Bbg/RIC 49.80
54.00 (60.00)
257.11 8
1.0
2.0
Free float (%) 75.8 Performance 1M 3M 12M
Absolute (%) 0.8 (8.8) (11.0)
Relativ e (%) 1.1 (14.7) (15.9)
Year 12/10A 12/11A 12/12E 12/13E 12/14E
40,565 46,419 51,650 57,926 63,859
3,683 3,496 3,006 3,709 4,169
1,624 1,317 1,104 1,418 1,601
6.76 5.48 4.30 5.52 6.23
n.a. n.a. (5) (12) (12)
n.a. n.a. 4.90 5.76 6.64
20.8 -18.9 -21.6 28.4 12.9
7.4 9.1 11.6 9.0 8.0
5.1 4.0 3.5 4.4 5.0
2.7 2.7 3.7 3.1 2.8
2.3 2.1 2.0 1.7 1.5
34.8 23.8 18.0 20.6 20.5
-27.7 -28.6 -12.5 -9.1 -7.4
73.6 - 45.0
12,804.0/ 432.6
ROE (%)
Mkt cap (NT$/US$ mn)Daily trad v al - 6m av g (US$ mn)
Major shareholders Chairman 4.08%
Net debt(cash)/equity (%)
Rev enue (NT$ mn)
52-w k range (NT$)
6278 TT / 6278.TW
N (O)
Daily trad v ol - 6m av g (mn)
Rating (prev. rating)
Shares outstanding (mn)
Price (13 Sep 12 , NT$)
TP (prev. TP NT$)
Est. pot. % chg. to TP
EBITDA (NT$ mn)
Net profit (NT$ mn)
EPS (NT$)
- Change from prev . EPS (%)
- Consensus EPS (NT$)
EPS grow th (%)
P/E (x )
Div idend y ield (%)
EV/EBITDA (x )
P/B (x )
Price performance vs. MSCI Taiwan Price performance vs. MSCI Taiwan
60
80
100
120
140
160
09/11 11/11 01/12 03/12 05/12 07/12 09/12
Spreadtrum Communication MSCI Taiwan
70
85
100
115
130
09/11 11/11 01/12 03/12 05/12 07/12 09/12
Taiwan Surface Mounting Technology MSCI Taiwan
Randy Abrams, CFA / Research Analyst / 886 2 2715 6366 /
Extracted from The Asian Daily 14 Sep 2012
Jimmy Huang / Research Analyst / 886 2 2715 6352 /
Extracted from The Asian Daily 14 Sep 2012

14 S
ep
tem
ber 2
01
2
David
& G
olia
th
82
Valuations of Credit Suisse Taiwan small-cap watch list* Market CS target/ Potential Credit Year HOLT CFROI
Cap Price HOLT warranted return Suisse end CFROI Spread
Company RIC (US$ mn) (NT$) price (NT$) (%) Rating month 2011 2012 2011 2012 (%) (%) 1W 1M 3M
Ability Enter. 2374.TW 420 27.80 32.56 17.1 Not rated Dec 11.3 9.6 1.3 1.1 8.4 1.2 (2.8) 0.2 2.0
AcBel Polytech 6282.TW 368 21.25 22.15 4.2 Not rated Dec 17.7 16.2 1.5 1.3 7.4 (0.1) 8.7 26.9 36.2
Accton Technology 2345.TW 283 16.00 22.44 40.3 Not rated Dec 9.6 8.4 1.2 1.1 7.6 0.1 2.9 0.6 (3.6)
Aces Electronic 3605.TW 204 48.40 44.31 (8.4) Not rated Dec 8.8 14.0 1.6 1.2 11.0 3.3 3.8 12.6 14.7
Actron Technology 8255.TWO 181 71.50 89.29 24.9 Not rated Dec 12.5 11.6 2.3 1.8 13.1 5.4 (0.6) (4.0) (5.0)
A-Data Technology 3260.TWO 258 33.80 35.22 4.2 Not rated Dec 99.4 22.9 1.1 0.9 2.6 (5.2) (0.9) (7.9) (8.8)
ADLink Technology 6166.TW 170 31.80 37.74 18.7 Not rated Dec 12.1 18.0 2.0 1.8 14.1 6.2 2.9 (4.4) 7.5
Advanced Int'l. Multitech 8938.TWO 204 45.00 25.13 (44.2) Not rated Dec 39.1 34.5 1.7 1.6 1.9 (5.9) 0.3 16.1 23.1
Advantech 2395.TW 2,042 108.00 146.66 35.8 Not rated Dec 16.8 15.9 3.8 3.1 20.4 13.9 7.5 3.8 8.7
Airtac 1590.TW 726 143.00 170.00 18.9 NEUTRAL Dec 15.9 16.4 3.9 4.2 17.3 10.4 (1.0) (10.1) (11.7)
Ali 3041.TW 397 38.60 34.79 (9.9) Not rated Dec 17.2 16.0 2.1 1.9 9.2 1.8 16.4 27.8 23.5
Alpha Networks 3380.TW 375 21.45 30.38 41.6 Not rated Dec 10.7 10.6 1.1 0.9 4.7 (2.8) 0.2 (0.5) (2.5)
Altek 3059.TW 238 17.80 44.21 148.4 Not rated Dec 34.9 13.2 0.6 0.6 (0.6) (7.9) 8.5 11.3 (12.3)
Ambassador Hotel 2704.TW 395 31.85 20.97 (34.2) Not rated Dec 27.2 33.6 1.4 1.4 2.7 (4.6) 2.7 6.2 8.9
Amtran Technology 2489.TW 671 24.20 21.30 (12.0) Not rated Dec 16.0 11.3 1.3 1.2 2.9 (4.4) 5.7 13.9 2.3
Apex Biotechnology 1733.TW 249 74.60 81.63 9.4 Not rated Dec 13.6 12.5 4.1 3.5 24.6 16.9 (2.2) (3.3) 1.8
Arcadyan Technology 3596.TW 153 32.20 39.34 22.2 Not rated Dec 7.8 15.9 0.9 0.8 7.4 (0.5) (2.0) (4.0) 2.2
Ardentec 3264.TWO 325 20.85 26.83 28.7 Not rated Dec 11.3 10.6 1.2 1.1 5.3 (2.2) 2.5 (1.8) 5.3
Arima Comm. 8101.TW 191 13.70 7.35 (46.4) Not rated Dec 13.2 (25.1) 1.3 1.2 2.8 (5.0) 0.4 5.0 (18.9)
Asia Optical 3019.TW 305 32.05 36.55 14.0 Not rated Dec (4.3) (4.2) 0.7 0.7 (7.7) (15.2) 6.8 (1.7) 21.9
Asia Polymer 1308.TW 450 28.30 55.18 95.0 Not rated Dec 8.2 6.7 1.5 1.3 13.6 6.4 2.7 (8.4) 11.3
Asia Vital Components 3017.TW 199 17.55 31.70 80.6 Not rated Dec 8.8 6.9 0.8 0.8 5.3 (2.3) 0.3 2.3 17.0
ASRock 3515.TW 409 105.00 116.03 10.5 Not rated Dec 9.2 10.4 1.9 1.7 17.5 10.2 (1.4) (2.8) (7.5)
Aten Int'l 6277.TW 209 51.70 54.95 6.3 Not rated Dec 12.0 10.8 2.1 1.9 11.7 4.1 (0.4) (6.8) (3.5)
Aurora 2373.TW 516 45.25 29.60 (34.6) Not rated Dec 13.2 13.7 2.3 2.3 10.0 2.9 1.9 (0.9) (5.2)
AV Tech 8072.TW 308 91.20 95.13 4.3 Not rated Dec 10.3 10.0 2.0 1.8 16.3 8.9 1.6 2.5 0.8
Avermedia Technologies 2417.TW 126 18.00 21.54 19.7 Not rated Dec 6.6 35.9 0.9 0.8 1.4 (6.3) 2.0 (4.3) (21.2)
BES Engineering 2515.TW 386 7.48 5.38 (28.1) Not rated Dec 68.0 1,249.1 0.6 0.6 0.5 (7.0) 2.3 11.5 8.4
Cando 8056.TWO 315 10.25 7.15 (30.2) Not rated Dec (7.4) (9.2) 1.3 1.2 (9.4) (16.6) (0.5) 1.0 (5.5)
Capital Securities 6005.TW 837 10.45 8.51 (18.6) Not rated Dec 29.9 28.1 0.9 0.8 1.2 (7.5) 3.5 (1.9) 9.3
Share price performance
NT$ term (%)P/B (x)P/E (x)
CalendarizedCalendarized
* Include the small-cap stocks in HOLT® database with market cap between US$150 mn and US$2 bn. For stocks that are Not Rated, I/B/E/S consensus forecast are used. CFROI® is a
registered trademark in the United States and other countries (excluding the United Kingdom) of Credit Suisse or its subsidiaries or affiliates.
* Companies in bold and italic indicate constituents of Credit Suisse Taiwan Small Cap Index.

14 S
ep
tem
ber 2
01
2
David
& G
olia
th
83
Valuations of Credit Suisse Taiwan small-cap watch list* Market CS target/ Potential Credit Year HOLT CFROI
Cap Price HOLT warranted return Suisse end CFROI Spread
Company RIC (US$ mn) (NT$) price (NT$) (%) Rating month 2011 2012 2011 2012 (%) (%) 1W 1M 3M
Career Tech. 6153.TW 468 42.65 49.31 15.6 Not rated Dec 11.0 14.2 1.9 1.7 13.0 5.8 2.0 (7.9) (4.2)
Cathay Real Estate Dev. 2501.TW 790 14.10 17.75 25.9 Not rated Dec 7.5 7.3 1.1 1.0 9.1 2.0 9.7 15.1 8.5
Cheng Loong 1904.TW 428 11.80 11.74 (0.5) Not rated Dec 13.9 12.0 0.7 0.7 1.8 (5.9) 4.0 4.4 4.0
Cheng UEI 2392.TW 1,154 69.70 46.29 (33.6) Not rated Dec 15.4 23.9 1.5 1.5 4.6 (2.4) 4.0 19.6 13.4
Chia Hsin Cement 1103.TW 367 13.95 10.01 (28.2) Not rated Dec 55.3 15.8 0.6 0.6 2.6 (5.2) 4.5 5.3 8.5
Chicony Electronics 2385.TW 1,531 67.00 62.00 62.0 NEUTRAL Dec 10.8 11.5 2.4 2.3 8.9 2.0 4.7 8.9 25.8
China Bills Finance 2820.TW 486 10.70 12.46 16.5 Not rated Dec 3.4 13.2 0.7 0.6 18.1 9.3 0.5 2.4 (13.0)
China Chemical & Pharm. 1701.TW 197 19.50 11.55 (40.8) Not rated Dec 18.9 13.8 1.2 1.1 3.4 (4.5) 3.4 4.8 17.5
China Ecotek 1535.TW 250 65.50 53.30 (18.6) Not rated Dec 13.5 12.8 3.4 n.a. 27.4 19.7 2.0 2.7 3.5
China Electric Manufacturing 1611.TW 270 20.00 19.39 (3.0) Not rated Dec 14.9 13.6 1.3 1.2 9.6 2.0 1.0 4.4 1.5
China Hi-Ment 9930.TW 363 47.50 44.33 (6.7) Not rated Dec 16.1 15.2 2.7 2.8 12.3 4.8 1.7 (0.6) 1.2
China Man Made Fiber 1718.TW 542 11.35 -37.84 (433.4) Not rated Dec 14.7 7.1 0.7 0.7 0.6 (7.3) 2.3 5.1 23.2
China Metal Products 1532.TW 321 25.10 16.92 (32.6) Not rated Dec 21.8 16.8 1.0 1.0 4.6 (3.1) 7.3 40.2 44.3
China Motor 2204.TW 1,273 27.20 48.10 76.8 Not rated Dec 12.4 12.3 0.9 0.9 3.2 (3.4) 1.1 2.4 2.1
China Petrochemical Dev. 1314.TW 1,633 24.45 27.97 14.4 Not rated Dec 4.4 14.4 1.3 1.2 9.6 3.2 3.2 9.9 (0.2)
China Steel Chemical 1723.TW 1,030 128.50 104.75 (18.5) Not rated Dec 13.2 14.5 4.7 5.4 29.3 22.6 2.4 0.0 (4.1)
China Syn. Rubber 2104.TW 597 32.15 26.10 (18.8) Not rated Dec 15.8 14.3 1.1 1.0 2.5 (5.0) 1.4 14.8 14.2
Chinese Gamer 3083.TWO 207 69.90 41.88 (40.1) Not rated Dec 19.3 18.9 2.9 2.7 16.8 9.6 1.6 (1.0) (11.0)
Chinese Maritime Transport 2612.TW 290 33.40 42.51 27.3 Not rated Dec 7.0 11.3 0.9 n.a. 12.7 6.1 1.2 (4.0) (9.7)
Chin-Poon 2355.TW 468 34.80 42.67 22.6 Not rated Dec 12.0 8.8 1.2 1.1 6.2 (1.5) (6.2) (1.7) 30.8
Chipbond Technology 6147.TWO 932 46.75 48.00 2.7 OUTPERFORM Dec 15.6 11.7 1.7 1.7 9.3 2.2 1.6 15.7 18.1
Chong Hong 5534.TW 651 77.70 90.16 16.0 Not rated Dec 8.4 6.1 2.1 2.1 13.4 6.0 1.8 15.1 33.5
Chroma ATE 2360.TW 794 62.30 89.00 42.9 OUTPERFORM Dec 15.4 16.0 3.1 2.9 15.0 8.1 1.0 (0.3) (9.4)
Chun Yuan Steel 2010.TW 250 11.40 5.67 (50.3) Not rated Dec 12.8 11.7 0.7 0.6 2.2 (5.6) 0.9 (0.2) (4.7)
Chung Hsin E&M 1513.TW 257 15.80 16.44 4.1 Not rated Dec 13.0 12.2 1.0 1.0 5.0 (2.7) 0.6 (7.3) (5.4)
Chung Hung Steel 2014.TW 415 8.55 1.39 (83.7) Not rated Dec (5.0) (4.4) 1.0 1.2 (9.3) (16.8) 18.6 11.6 6.7
Chung Hwa Pulp 1905.TW 208 9.96 12.78 28.3 Not rated Dec 498.0 26.9 0.7 0.7 (0.8) (8.5) 2.9 3.2 8.9
Chunghwa Picture 2475.TW 182 0.83 7.27 776.4 Not rated Dec (0.4) (0.4) 0.2 0.2 (12.6) (20.1) 2.5 (9.8) (18.6)
Clevo 2362.TW 885 41.00 1.75 (95.7) Not rated Dec 19.5 18.8 3.0 2.6 4.4 (2.7) 5.1 0.0 (0.5)
CMC Magnetics 2323.TW 455 4.89 9.54 95.0 Not rated Dec (8.0) (8.6) 0.4 0.4 (3.9) (11.3) 0.8 3.6 2.1
Share price performanceCalendarized Calendarized
P/E (x) P/B (x) NT$ term (%)
* Include the small-cap stocks in HOLT® database with market cap between US$150 mn and US$2 bn. For stocks that are Not Rated, I/B/E/S consensus forecast are used. CFROI® is a
registered trademark in the United States and other countries (excluding the United Kingdom) of Credit Suisse or its subsidiaries or affiliates.
* Companies in bold and italic indicate constituents of Credit Suisse Taiwan Small Cap Index.

14 S
ep
tem
ber 2
01
2
David
& G
olia
th
84
Valuations of Credit Suisse Taiwan small-cap watch list* Market CS target/ Potential Credit Year HOLT CFROI
Cap Price HOLT warranted return Suisse end CFROI Spread
Company RIC (US$ mn) (NT$) price (NT$) (%) Rating month 2011 2012 2011 2012 (%) (%) 1W 1M 3M
Compal 8078.TW 699 34.00 34.68 2.0 Not rated Dec (125.9) 15.5 2.1 2.0 (3.1) (10.0) 0.6 12.6 (10.2)
Compeq Manufacturing 2313.TW 526 13.05 11.30 (13.4) Not rated Dec 15.9 16.7 1.0 1.0 1.6 (5.8) 0.0 (1.9) 9.7
Continental 3703.TW 323 11.35 8.70 (23.3) Not rated Dec 9.7 8.9 0.6 0.5 7.0 (0.8) 0.9 7.6 2.7
Coretronic 5371.TWO 693 28.30 27.00 (4.6) NEUTRAL Dec 13.5 12.8 1.1 1.0 5.3 (1.8) 0.5 3.9 3.7
Cox on Precise Industrial 3607.TW 201 53.00 30.22 (43.0) Not rated Dec 17.5 29.0 1.0 1.0 4.1 (3.9) 0.6 11.5 37.8
CSBC 2208.TW 494 19.65 27.88 41.9 Not rated Dec 8.4 7.5 1.0 1.0 5.2 (2.0) (0.8) (9.0) (14.8)
CTCI 9933.TW 1,448 59.30 47.74 (19.5) Not rated Dec 18.4 15.3 3.0 2.8 13.2 6.2 6.1 4.2 5.1
Cyberlink 5203.TW 337 105.50 84.68 (19.7) Not rated Dec 17.3 15.1 2.1 1.9 7.9 0.4 4.5 7.1 25.0
CyberTAN 3062.TW 244 22.15 31.73 43.3 Not rated Dec 11.0 7.1 1.3 1.3 7.6 0.2 (0.2) 0.7 (2.4)
Darfon Electronics 8163.TW 250 23.15 30.68 32.5 Not rated Dec 45.4 28.4 0.8 0.8 1.9 (5.7) 0.7 8.7 8.7
Delsolar 3599.TW 123 13.60 13.87 2.0 Not rated Dec (1.3) (1.3) 0.5 0.4 (31.9) (39.5) 3.4 22.5 (16.3)
Depo Auto Parts 6605.TW 363 64.70 88.92 37.4 Not rated Dec (27.4) 6.6 1.4 1.2 7.9 0.2 0.3 (4.9) 3.2
D-Link 2332.TW 395 18.05 22.77 26.2 Not rated Dec 11.9 13.4 0.8 0.8 4.7 (2.6) 1.4 (5.7) (5.0)
Dynapack 3211.TWO 719 140.00 141.35 1.0 Not rated Dec 12.0 11.8 3.1 2.4 14.3 7.0 (0.4) (5.7) (7.6)
E Ink 8069.TWO 1,184 32.40 35.00 8.0 NEUTRAL Dec 5.4 (45.2) 1.2 1.5 16.8 10.3 3.2 (1.7) 13.5
Elan Microelectronics 2458.TW 767 54.50 48.00 (11.9) NEUTRAL Dec 48.1 22.9 4.1 4.0 2.8 (4.4) 15.7 17.0 34.2
E-Life Mall 6281.TW 234 69.90 40.67 (41.8) Not rated Dec 15.1 15.1 3.1 3.0 9.3 1.3 1.2 5.9 10.8
Elite Material 2383.TW 315 31.05 30.97 (0.3) Not rated Dec 10.8 8.8 1.6 1.5 9.3 1.5 3.0 14.8 13.3
Elite Semicon. Memory 3006.TW 238 26.95 16.89 (37.3) Not rated Dec (31.0) (33.8) 1.2 1.2 1.0 (6.4) 5.5 8.2 20.6
Elitegroup Computer Sys. 2331.TW 385 9.62 13.13 36.5 Not rated Dec 26.7 29.8 0.5 0.5 0.8 (6.8) (1.1) (22.4) (10.9)
Entie Commercial Bank 2849.TW 753 13.25 16.28 22.8 Not rated Dec 10.1 8.1 1.0 1.0 10.1 1.4 4.3 2.7 (0.4)
Epistar 2448.TW 1,852 63.60 75.00 17.9 OUTPERFORM Dec 113.3 73.6 1.2 1.3 (0.7) (7.1) 7.8 4.4 6.9
Eternal Chemical 1717.TW 826 24.60 17.61 (28.4) Not rated Dec 20.0 19.9 1.3 1.3 3.1 (4.0) 1.0 (0.6) 9.1
E-Ton 3452.TWO 205 12.65 13.28 5.0 Not rated Dec (1.4) (2.0) 0.7 0.7 (29.4) (36.8) 1.2 10.0 (19.4)
Etron Technology 5351.TWO 147 9.87 9.65 (2.2) Not rated Dec (5.0) (4.6) 0.9 0.9 (9.2) (17.0) 1.1 5.6 8.5
EVA Airways 2618.TW 1,835 16.65 19.40 16.5 OUTPERFORM Dec 271.4 77.6 1.3 1.3 2.1 (4.5) 0.3 (3.2) (5.7)
Ev ergreen Strg. & Tran. 2607.TW 650 18.00 17.54 (2.6) Not rated Dec 23.7 29.0 1.0 1.0 0.6 (6.3) 9.1 10.1 22.9
Evergreen Marine 2603.TW 1,863 15.85 19.50 23.0 OUTPERFORM Dec (9.9) 18.2 0.9 0.8 (5.9) (12.4) 0.3 (9.4) 7.1
Everlight Chemical 1711.TW 304 19.95 14.71 (26.2) Not rated Dec 19.6 24.6 1.5 1.3 2.8 (4.8) 5.6 2.3 16.1
Everlight Electronics 2393.TW 664 46.80 40.00 (14.5) UNDERPERFORM Dec 14.9 17.8 1.3 1.3 6.9 (0.1) 3.2 (6.3) (5.5)
P/E (x) P/B (x)
Share price performance
NT$ term (%)
Calendarized Calendarized
* Include the small-cap stocks in HOLT® database with market cap between US$150 mn and US$2 bn. For stocks that are Not Rated, I/B/E/S consensus forecast are used. CFROI® is a
registered trademark in the United States and other countries (excluding the United Kingdom) of Credit Suisse or its subsidiaries or affiliates.
* Companies in bold and italic indicate constituents of Credit Suisse Taiwan Small Cap Index.

14 S
ep
tem
ber 2
01
2
David
& G
olia
th
85
Valuations of Credit Suisse Taiwan small-cap watch list* Market CS target/ Potential Credit Year HOLT CFROI
Cap Price HOLT warranted return Suisse end CFROI Spread
Company RIC (US$ mn) (NT$) price (NT$) (%) Rating month 2011 2012 2011 2012 (%) (%) 1W 1M 3M
Excelsior Medical 4104.TW 229 65.80 32.82 (50.1) Not rated Dec 20.2 20.6 1.3 1.1 6.1 (1.6) 3.6 8.6 22.3
Far East Dept. St. 2903.TW 1,420 30.65 16.82 (45.1) Not rated Dec 19.4 20.4 1.5 1.5 6.3 (0.4) 6.4 (3.0) 17.6
Far Eastern Int'l Bank 2845.TW 863 12.05 14.76 22.5 Not rated Dec 10.8 10.0 1.0 1.0 7.8 (0.9) 1.7 2.1 11.6
Faraday Tech. 3035.TW 633 46.40 55.00 18.5 OUTPERFORM Dec 149.8 15.2 2.8 2.7 3.1 (4.0) 3.3 10.5 18.4
Farglory Land 5522.TW 1,422 54.50 64.46 18.3 Not rated Dec 7.1 7.9 1.3 1.3 13.0 6.3 2.8 12.1 14.0
Federal 2102.TW 284 20.85 18.77 (10.0) Not rated Dec 16.3 15.2 1.0 0.9 4.3 (3.6) 5.8 26.4 53.1
Feng Hsin Iron & Steel 2015.TW 948 48.20 42.07 (12.7) Not rated Dec 10.5 14.6 1.7 1.8 11.1 4.2 4.0 (3.1) (1.9)
Feng Tay Enterprises 9910.TW 538 29.70 35.03 17.9 Not rated Dec 11.1 10.5 1.8 1.7 7.8 0.4 2.6 3.8 11.2
Firich Enterprises 8076.TWO 229 40.15 10.28 (74.4) Not rated Dec 121.7 65.2 2.8 2.6 3.0 (4.7) 4.0 5.9 20.4
First Hotel 2706.TW 234 20.70 16.86 (18.5) Not rated Dec 30.4 28.7 1.1 1.1 3.9 (3.6) 3.2 0.7 13.7
First Steamship 2601.TW 286 30.50 31.72 4.0 Not rated Dec 15.3 10.1 1.2 1.0 8.3 1.0 4.8 (5.1) (13.6)
Flexium 6269.TW 789 123.00 158.35 28.7 Not rated Dec 17.7 14.6 4.8 3.8 22.2 14.9 (3.1) (2.6) 17.3
Flytech Technology 6206.TW 220 64.90 72.10 11.1 Not rated Dec 12.1 12.3 2.6 2.3 14.5 6.7 0.2 (1.9) 8.2
Forhouse 6120.TW 262 16.10 21.50 33.5 Not rated Dec 22.7 27.0 0.7 0.7 1.8 (5.8) 0.6 0.9 5.9
Formosa Epitaxy 3061.TW 344 21.15 9.58 (54.7) Not rated Dec (52.9) (55.1) 0.9 0.7 (2.9) (10.3) 1.9 3.4 (0.2)
Formosa Int'l. Hotels 2707.TW 1,020 312.00 161.73 (48.2) Not rated Dec 31.2 24.8 9.6 8.8 20.9 14.3 3.8 4.0 6.9
Formosa Sumco Tech. 3532.TW 897 34.20 18.31 (46.5) Not rated Dec 180.0 184.7 1.4 1.4 (1.8) (8.4) 2.4 21.3 17.7
Formosa Taffeta 1434.TW 1,576 27.65 48.68 76.1 Not rated Dec 22.3 19.3 0.9 0.8 5.6 (1.0) 2.6 0.2 5.7
Formosan Rubber 2107.TW 344 20.45 31.25 52.8 Not rated Dec 8.4 7.8 1.1 1.0 10.6 3.3 4.1 8.2 7.6
FSP Technology 3015.TW 220 28.30 49.25 74.0 Not rated Dec 7.1 n.a. 1.2 n.a. 13.0 5.6 (0.2) 11.6 4.8
Gamania Digital Entertainment6180.TWO 132 24.80 34.20 37.9 Not rated Dec 21.6 23.7 1.4 1.2 14.3 6.5 3.3 (8.0) (14.6)
Gemtek 4906.TW 328 31.80 40.36 26.9 Not rated Dec 795.0 12.1 1.2 1.1 3.0 (4.7) (1.9) 9.7 29.8
Genesis Photonics 3383.TW 251 25.45 -0.80 (103.1) Not rated Dec 23.2 16.0 1.2 1.0 1.2 (6.1) 11.1 8.1 (3.9)
Genius Electronic 3406.TW 643 213.00 137.34 (35.5) Not rated Dec 19.5 22.7 2.9 2.3 10.6 3.7 0.2 (6.0) (5.8)
Geovision 3356.TW 221 116.50 98.02 (15.9) Not rated Dec 14.1 13.2 4.1 3.8 22.0 14.2 3.6 2.2 7.1
Getac Technology 3005.TW 423 21.60 24.66 14.2 Not rated Dec 26.7 21.0 1.0 0.9 1.7 (5.9) (1.4) (5.1) (5.5)
Giant Mfg. 9921.TW 1,998 157.50 132.14 (16.1) Not rated Dec 19.6 17.6 3.9 3.7 11.4 4.7 7.5 (5.4) 15.8
Giga-Byte Technology 2376.TW 551 26.10 47.45 81.8 Not rated Dec 10.6 8.8 0.8 0.8 5.1 (2.0) 0.4 1.2 (5.8)
Gintech Energy 3514.TW 356 31.10 23.73 (23.7) Not rated Dec (6.6) (14.8) 0.8 0.7 (8.7) (16.0) 0.2 8.2 (19.2)
Global Brands Mfg. 6191.TW 211 11.75 9.47 (19.4) Not rated Dec 7.0 6.6 0.6 0.5 1.1 (6.9) 1.3 (4.0) (4.0)
Calendarized Calendarized Share price performance
P/E (x) P/B (x) NT$ term (%)
* Include the small-cap stocks in HOLT® database with market cap between US$150 mn and US$2 bn. For stocks that are Not Rated, I/B/E/S consensus forecast are used. CFROI® is a
registered trademark in the United States and other countries (excluding the United Kingdom) of Credit Suisse or its subsidiaries or affiliates.
* Companies in bold and italic indicate constituents of Credit Suisse Taiwan Small Cap Index.

14 S
ep
tem
ber 2
01
2
David
& G
olia
th
86
Valuations of Credit Suisse Taiwan small-cap watch list* Market CS target/ Potential Credit Year HOLT CFROI
Cap Price HOLT warranted return Suisse end CFROI Spread
Company RIC (US$ mn) (NT$) price (NT$) (%) Rating month 2011 2012 2011 2012 (%) (%) 1W 1M 3M
Global Mixed-Mode 8081.TW 302 103.50 108.21 4.6 Not rated Dec 12.7 12.3 2.3 2.0 17.0 9.5 5.2 11.1 18.4
Global Unichip 3443.TW 519 114.50 74.76 (34.7) Not rated Dec 29.1 26.0 4.6 4.4 10.5 3.4 (1.7) 9.0 11.2
Globe Union 9934.TW 179 17.75 5.02 (71.7) Not rated Dec 17.4 23.2 1.0 1.0 0.1 (7.7) (1.9) (16.1) (6.6)
Gloria Material 5009.TWO 389 27.25 20.46 (24.9) Not rated Dec 10.9 8.9 1.5 1.4 4.9 (2.8) (1.6) (8.1) (0.9)
Goldsun Dev. 2504.TW 558 10.85 11.63 7.2 Not rated Dec 20.9 11.9 0.7 0.7 1.9 (5.3) 2.4 4.8 4.8
Gourmet Master 2723.TW 1,057 221.50 114.76 (48.2) Not rated Dec 27.9 23.7 5.4 4.5 16.7 10.0 (0.7) 0.0 6.7
Grand Pacific Petrochem. 1312.TW 465 15.15 16.91 11.6 Not rated Dec 12.3 8.9 1.0 1.0 8.6 1.3 5.6 7.8 28.4
Great China Metal Industry 9905.TW 344 33.30 34.74 4.3 Not rated Dec 13.4 12.1 1.6 1.6 7.6 0.2 (0.4) (2.9) 1.1
Greatck Electronics 2441.TW 435 23.20 33.33 43.7 Not rated Dec 14.2 10.3 1.2 1.1 6.4 (0.9) 0.4 (4.3) 4.0
Greatwall Enteprise 1210.TW 506 27.15 27.32 0.6 Not rated Dec 12.8 16.4 1.3 1.1 6.4 (0.9) 1.3 (6.4) 3.8
Green Energy Technology 3519.TW 233 21.40 -4.87 (122.7) Not rated Dec (2.5) (2.9) 0.5 0.3 (8.4) (15.7) 3.6 12.6 (12.5)
G-Tech Optoelectronics 3149.TW 701 88.00 43.31 (50.8) Not rated Dec 21.4 20.8 2.7 1.8 8.7 1.7 2.8 2.9 4.8
Hannstar Board 5469.TW 252 16.25 2.27 (86.1) Not rated Dec 15.4 9.1 0.7 0.6 0.5 (7.7) (0.9) 10.5 12.8
Hannstar Display 6116.TW 335 3.38 6.87 103.1 Not rated Dec (2.6) 84.5 0.7 0.6 (22.9) (30.3) 12.7 (18.8) (26.8)
Hey Song 1234.TW 850 46.90 18.85 (59.8) Not rated Dec 64.2 58.0 2.0 1.9 1.7 (5.5) 14.7 23.7 31.2
Highwealth Construction 2542.TW 1,290 51.10 117.85 130.6 Not rated Dec 5.6 4.5 1.8 1.5 12.6 5.6 4.3 7.2 9.2
Ho Tung Chemical 1714.TW 457 17.40 16.62 (4.5) Not rated Dec 11.4 9.4 1.3 1.2 6.2 (1.3) 0.6 (1.1) 5.8
Holiday Entertainment 9943.TW 236 47.30 49.68 5.0 Not rated Dec 9.8 9.0 2.1 2.0 15.0 7.1 (1.5) (16.1) (3.1)
Soltck Semiconductor 6202.TW 241 31.90 28.00 (12.2) Not rated Dec 13.5 13.4 2.0 1.8 9.4 1.8 2.6 4.6 (0.6)
Holy Stone Enterprise 3026.TW 279 25.75 24.51 (4.8) Not rated Dec 10.8 11.1 0.9 0.9 4.6 (2.9) 2.8 1.2 (2.1)
Hsin Kuang Steel 2031.TW 175 18.65 9.73 (47.8) Not rated Dec 26.3 15.8 0.9 0.9 2.7 (5.2) 11.0 2.2 (5.3)
Hua Eng Wire & Cable 1608.TW 211 9.84 6.36 (35.4) Not rated Dec (328.0) 28.0 0.7 0.6 0.1 (8.1) 0.8 9.5 25.2
Huaku Construction 2548.TW 667 71.20 93.53 31.4 OUTPERFORM Dec 6.5 6.4 1.7 1.5 12.9 5.7 2.6 14.7 8.1
Huang Hsiang Construction 2545.TW 875 78.90 8.98 (88.6) Not rated Dec 18.8 15.4 3.4 2.9 5.1 (2.3) 8.7 30.8 27.5
Huga Optotech 8199.TW 224 12.75 9.61 (24.6) Not rated Dec (5.7) (6.2) 0.7 0.7 (12.1) (19.7) 7.6 6.3 (0.8)
Hung Poo Real Estate Dev. 2536.TW 325 30.10 35.38 17.5 Not rated Dec 12.0 6.8 0.9 n.a. 7.2 0.4 3.4 19.0 26.2
Hung Sheng Construction 2534.TW 330 16.55 5.47 (66.9) Not rated Dec 11.3 50.1 0.9 0.9 1.2 (6.6) 3.4 14.5 10.3
Ichia Technologies 2402.TW 177 15.55 12.31 (20.9) Not rated Dec 59.8 16.2 0.8 0.8 0.6 (7.4) (1.0) 5.4 0.3
ICP Electronics 3022.TW 413 53.80 87.12 61.9 Not rated Dec 8.9 8.0 2.0 1.8 11.3 3.8 2.1 5.5 20.2
Industrial Bank of Taiw an 2897.TWO 554 6.85 8.48 23.8 Not rated Dec 10.8 n.a. 0.7 n.a. 6.4 (0.2) 0.7 2.2 (0.9)
Calendarized Calendarized Share price performance
P/E (x) P/B (x) NT$ term (%)
* Include the small-cap stocks in HOLT® database with market cap between US$150 mn and US$2 bn. For stocks that are Not Rated, I/B/E/S consensus forecast are used. CFROI® is a
registered trademark in the United States and other countries (excluding the United Kingdom) of Credit Suisse or its subsidiaries or affiliates.
* Companies in bold and italic indicate constituents of Credit Suisse Taiwan Small Cap Index.

14 S
ep
tem
ber 2
01
2
David
& G
olia
th
87
Valuations of Credit Suisse Taiwan small-cap watch list* Market CS target/ Potential Credit Year HOLT CFROI
Cap Price HOLT warranted return Suisse end CFROI Spread
Company RIC (US$ mn) (NT$) price (NT$) (%) Rating month 2011 2012 2011 2012 (%) (%) 1W 1M 3M
Infortrend Technology 2495.TW 189 19.70 19.27 (2.2) Not rated Dec 17.4 16.4 1.3 1.3 6.9 (0.6) 2.1 (1.0) (3.9)
Inotera Memories 3474.TW 909 4.97 13.13 164.2 Not rated Dec (1.1) (2.1) 0.7 0.7 (18.3) (25.2) 0.8 (11.9) (31.6)
International Games 3293.TWO 254 108.00 283.84 162.8 Not rated Dec 8.2 n.a. 2.4 n.a. 20.9 13.6 (5.3) (10.7) (18.5)
Inventec 2356.TW 1,244 10.25 11.16 8.9 Not rated Dec 13.4 5.8 0.8 0.7 0.8 (6.0) 2.0 4.9 7.7
I-Sheng Elec. Wire & Cable 6115.TW 229 41.20 35.64 (13.5) Not rated Dec 9.2 10.4 1.5 1.4 9.9 2.1 1.6 5.8 (1.0)
ITE Technology 3014.TW 196 28.60 18.54 (35.2) Not rated Dec (2.5) (30.0) 1.6 1.4 (0.6) (8.1) 11.3 11.7 22.7
ITEQ 6213.TW 344 30.60 36.01 17.7 Not rated Dec 8.8 8.3 1.6 1.4 11.5 3.9 1.8 3.4 7.9
Jentech Precision 3653.TW 328 86.70 85.32 (1.6) Not rated Dec 18.2 16.0 2.1 1.7 10.4 3.0 (0.9) (6.4) 19.0
Jess-Link Products 6197.TW 162 27.60 12.91 (53.2) Not rated Dec (72.6) (96.8) 1.3 1.3 (1.1) (8.7) 2.6 1.1 8.4
Jih Sun Financial 5820.TWO 755 8.20 9.10 11.0 Not rated Dec 10.9 10.8 0.8 0.8 4.5 (4.3) 2.4 (0.5) 4.7
Johnson Health Tech 1736.TW 461 68.00 62.98 (7.4) Not rated Dec 17.7 13.0 2.4 2.3 7.4 (0.1) 1.1 (13.9) 7.0
Kenda Rubber Industry 2106.TW 906 36.50 31.17 (14.6) Not rated Dec 8.9 11.9 2.0 1.8 6.6 (0.5) 4.7 0.6 12.3
Kerry TJ Logistics 2608.TW 654 40.00 18.74 (53.1) Not rated Dec 28.0 29.9 2.8 2.6 5.5 (1.7) 3.2 0.0 21.0
KGI Securities 6008.TWO 1,465 13.25 15.36 15.9 Not rated Dec 21.4 12.0 0.9 0.8 3.0 (5.6) 0.4 (0.7) 1.1
Kindom Construction 2520.TW 344 20.40 6.79 (66.7) Not rated Dec 10.1 8.6 1.0 0.9 5.2 (2.6) 2.0 8.5 20.0
King S Town Bank 2809.TW 716 20.15 25.15 24.8 Not rated Dec 8.2 7.4 1.3 1.3 13.4 4.6 0.5 1.5 14.2
King S Town Construction 2524.TW 422 33.20 13.76 (58.5) Not rated Dec 15.0 17.5 1.8 1.8 4.8 (3.0) 1.5 35.6 38.0
King Slide 2059.TW 550 176.00 148.93 (15.4) Not rated Dec 18.1 14.9 4.1 3.7 15.2 7.8 0.6 0.0 4.8
King Yuan Electronics 2449.TW 674 16.75 22.05 31.6 Not rated Dec 44.1 17.1 1.0 1.0 (2.0) (9.4) 5.7 16.7 25.9
Kinik Company 1560.TW 203 42.60 37.80 (11.3) Not rated Dec 13.7 12.4 1.7 1.6 8.9 1.3 2.7 4.4 2.3
Kinko Optical 6209.TW 246 44.70 36.41 (18.6) Not rated Dec 19.1 14.3 1.7 1.7 4.4 (3.2) 3.5 (2.4) 3.4
Kinpo Electronics 2312.TW 333 6.76 12.83 89.8 Not rated Dec 338.0 329.5 0.5 0.5 4.0 (3.7) 4.2 1.2 5.0
Kinsus Interconnect 3189.TW 1,284 85.10 90.00 5.8 NEUTRAL Dec 13.6 12.7 1.5 1.5 7.4 0.7 (0.8) (3.1) 1.9
L&K Engineering 6139.TW 181 28.50 37.24 30.7 Not rated Dec 8.8 8.3 0.8 0.8 7.6 (0.2) 0.5 2.9 (10.5)
LCY Chemical 1704.TW 1,098 40.40 14.58 (63.9) Not rated Dec 12.0 17.1 1.4 1.4 3.4 (3.3) (0.4) (4.7) (12.2)
Lealea Enterprise 1444.TW 341 11.05 15.62 41.4 Not rated Dec 12.9 9.3 0.9 0.9 4.7 (2.8) 5.2 7.8 3.5
Leofoo Dev elopment 2705.TW 161 16.05 11.87 (26.0) Not rated Dec 8.3 18.3 0.9 0.9 2.1 (6.0) 1.6 (6.4) (2.1)
Les Enphants 2911.TW 165 23.10 14.31 (38.1) Not rated Dec 13.7 n.a. 1.3 n.a. 6.6 (0.7) 2.7 (14.2) (7.6)
Lextar Electronics 3698.TW 435 30.65 37.00 20.7 NEUTRAL Dec (88.6) 30.2 1.6 1.5 2.7 (4.7) 1.7 12.9 (6.7)
Lien Hw a Industrial 1229.TW 555 19.35 26.34 36.1 Not rated Dec 11.0 9.7 0.8 0.8 1.0 (6.2) 2.7 5.7 12.2
P/E (x) P/B (x) NT$ term (%)
Calendarized Calendarized Share price performance
* Include the small-cap stocks in HOLT® database with market cap between US$150 mn and US$2 bn. For stocks that are Not Rated, I/B/E/S consensus forecast are used. CFROI® is a
registered trademark in the United States and other countries (excluding the United Kingdom) of Credit Suisse or its subsidiaries or affiliates.
* Companies in bold and italic indicate constituents of Credit Suisse Taiwan Small Cap Index.

14 S
ep
tem
ber 2
01
2
David
& G
olia
th
88
Valuations of Credit Suisse Taiwan small-cap watch list* Market CS target/ Potential Credit Year Calendarized Calendarized HOLT CFROIShare price performance
Cap Price HOLT warranted return Suisse end P/E (x) P/B (x) CFROI SpreadNT$ term (%)
Company RIC (US$ mn) (NT$) price (NT$) (%) Rating month 2011 2012 2011 2012 (%) (%) 1W 1M 3M
Lingsen Precision 2369.TW 224 17.45 21.07 20.8 Not rated Dec 16.0 15.7 1.0 1.0 5.2 (2.4) 2.0 10.8 5.8
Lite-on IT 8008.TW 837 27.00 50.66 87.6 Not rated Dec 8.8 8.5 1.1 1.0 14.0 7.1 2.5 5.1 (8.2)
Lite-on Semiconductor 5305.TW 231 15.25 16.04 5.2 Not rated Dec 28.8 36.8 0.9 0.9 0.3 (7.6) 2.3 (1.0) 3.0
Long Chen Paper 1909.TW 183 7.89 -2.90 (136.7) Not rated Dec 9.2 9.2 0.5 0.5 3.3 (4.8) 1.4 2.2 2.5
Macronix 2337.TW 1,028 8.63 10.53 22.1 Not rated Dec 10.4 (11.9) 0.7 0.7 2.7 (3.9) 3.9 11.2 1.6
Makalot 1477.TW 464 83.70 94.80 13.3 Not rated Dec 12.1 10.6 3.1 2.7 19.9 12.5 (1.4) (1.8) 1.3
MasterLink Securities 2856.TW 475 9.18 8.27 (9.9) Not rated Dec 29.6 28.3 0.7 0.7 0.3 (8.6) 2.8 (1.8) 2.2
Merida Industry 9914.TW 1,031 107.00 76.95 (28.1) Not rated Dec 16.8 13.9 4.3 4.1 19.7 12.4 3.9 (6.8) 13.4
Merry Electronics 2439.TW 247 44.05 44.75 1.6 Not rated Dec 23.1 12.3 1.7 1.5 1.5 (6.2) 4.1 21.0 14.1
Microlife 4103.TWO 204 49.30 44.81 (9.1) Not rated Dec 12.8 11.6 2.2 2.0 12.1 4.4 2.2 (6.5) 7.4
Micro-Star 2377.TW 409 14.30 23.09 61.5 Not rated Dec 44.7 38.7 0.6 0.6 0.1 (7.3) (0.3) 6.7 (3.4)
Min Aik Technology 3060.TW 481 86.60 49.88 (42.4) Not rated Dec 60.6 16.9 3.5 3.2 9.9 2.5 1.1 17.0 21.5
Mitac Int'l 2315.TW 517 10.00 17.52 75.2 Not rated Dec 58.8 67.7 0.5 0.5 (2.7) (10.0) 1.8 6.7 6.6
Motech Industries 6244.TWO 467 31.55 31.05 (1.6) Not rated Dec (5.6) (3.3) 0.7 0.7 (8.3) (15.2) 5.2 16.2 (23.8)
MPI 6223.TWO 173 64.90 120.45 85.6 Not rated Dec 8.0 7.0 1.6 1.5 15.1 7.5 5.4 0.3 19.5
Nankang Rubber Tire 2101.TW 1,119 45.90 19.69 (57.1) Not rated Dec 22.4 39.6 2.8 2.7 6.4 (0.5) 3.4 4.2 12.4
Nan Ya PCB 8046.TW 1,058 48.40 55.00 13.6 NEUTRAL Dec 9.9 50.7 0.9 0.9 5.7 (0.8) 3.3 0.3 1.7
Nantex Industry 2108.TW 280 21.80 32.68 49.9 Not rated Dec 8.8 8.1 1.4 1.5 11.1 3.6 (7.7) (10.6) (9.5)
Nanya Technology 2408.TW 1,143 1.81 2.66 46.7 Not rated Dec (0.2) (0.9) 1.2 2.0 0.0 (6.0) (8.1) (6.2) (27.0)
National Petroleum 9937.TW 321 30.75 24.54 (20.2) Not rated Dec 20.4 17.6 1.9 1.9 11.3 3.9 3.0 2.8 (5.5)
Neo Solar Power 3576.TW 288 19.80 22.26 12.4 Not rated Dec (2.6) (4.4) 0.6 0.6 (20.5) (27.7) 11.5 20.7 (9.6)
Nien Hsing Textile 1451.TW 304 20.75 26.08 25.7 Not rated Dec 13.0 15.0 0.8 0.8 3.0 (4.4) 1.0 (3.0) 0.1
Novatek 3034.TW 2,112 103.50 118.00 14.0 OUTPERFORM Dec 16.9 14.2 2.8 3.0 10.3 3.7 6.4 13.5 20.1
Opto Tech 2340.TW 229 12.40 12.59 1.5 Not rated Dec 14.9 11.5 0.9 0.9 3.3 (4.4) (0.4) 3.3 2.9
Oriental Union Chemical 1710.TW 1,031 34.40 24.56 (28.6) Not rated Dec 10.4 19.6 1.8 1.9 10.9 4.1 4.2 (1.7) 8.7
Pacific Hospital Supply 4126.TWO 189 84.50 81.78 (3.2) Not rated Dec 17.2 14.3 3.7 3.4 19.0 11.3 1.2 4.3 9.6
Pan Int'l Industrial 2328.TW 528 30.65 13.00 (57.6) Not rated Dec (65.2) (104.7) 1.7 1.6 0.5 (6.7) 4.3 2.2 8.7
PChome Online 8044.TWO 471 170.00 69.00 (59.4) Not rated Dec 33.1 30.7 10.3 9.2 15.3 8.0 2.4 (2.0) 22.5
Phihong Technology 2457.TW 257 27.45 59.39 116.4 Not rated Dec 5.3 5.5 1.1 1.1 17.0 9.8 4.0 6.4 (9.6)
Phison 8299.TWO 1,398 229.50 281.44 22.6 Not rated Dec 15.6 14.1 3.8 3.1 21.0 14.2 4.3 (4.4) 6.0 * Include the small-cap stocks in HOLT® database with market cap between US$150 mn and US$2 bn. For stocks that are Not Rated, I/B/E/S consensus forecast are used. CFROI® is a
registered trademark in the United States and other countries (excluding the United Kingdom) of Credit Suisse or its subsidiaries or affiliates.
* Companies in bold and italic indicate constituents of Credit Suisse Taiwan Small Cap Index.
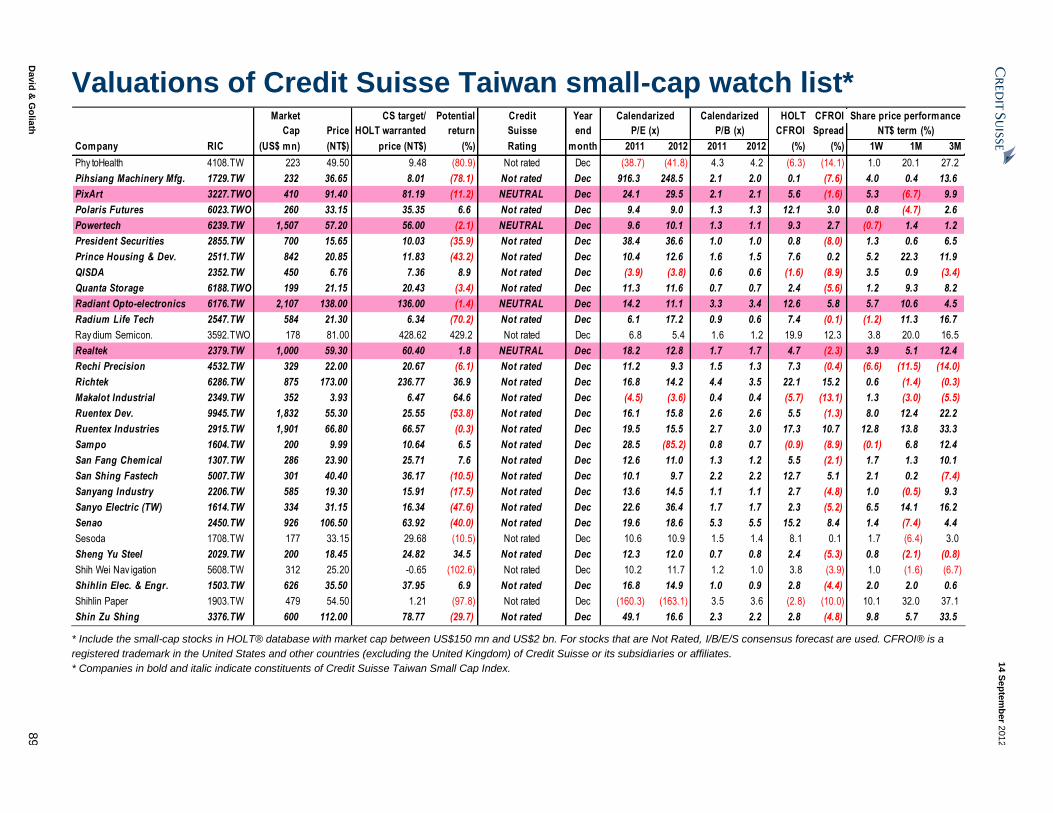
14 S
ep
tem
ber 2
01
2
David
& G
olia
th
89
Valuations of Credit Suisse Taiwan small-cap watch list* Market CS target/ Potential Credit Year HOLT CFROI
Cap Price HOLT warranted return Suisse end CFROI Spread
Company RIC (US$ mn) (NT$) price (NT$) (%) Rating month 2011 2012 2011 2012 (%) (%) 1W 1M 3M
Phy toHealth 4108.TW 223 49.50 9.48 (80.9) Not rated Dec (38.7) (41.8) 4.3 4.2 (6.3) (14.1) 1.0 20.1 27.2
Pihsiang Machinery Mfg. 1729.TW 232 36.65 8.01 (78.1) Not rated Dec 916.3 248.5 2.1 2.0 0.1 (7.6) 4.0 0.4 13.6
PixArt 3227.TWO 410 91.40 81.19 (11.2) NEUTRAL Dec 24.1 29.5 2.1 2.1 5.6 (1.6) 5.3 (6.7) 9.9
Polaris Futures 6023.TWO 260 33.15 35.35 6.6 Not rated Dec 9.4 9.0 1.3 1.3 12.1 3.0 0.8 (4.7) 2.6
Powertech 6239.TW 1,507 57.20 56.00 (2.1) NEUTRAL Dec 9.6 10.1 1.3 1.1 9.3 2.7 (0.7) 1.4 1.2
President Securities 2855.TW 700 15.65 10.03 (35.9) Not rated Dec 38.4 36.6 1.0 1.0 0.8 (8.0) 1.3 0.6 6.5
Prince Housing & Dev. 2511.TW 842 20.85 11.83 (43.2) Not rated Dec 10.4 12.6 1.6 1.5 7.6 0.2 5.2 22.3 11.9
QISDA 2352.TW 450 6.76 7.36 8.9 Not rated Dec (3.9) (3.8) 0.6 0.6 (1.6) (8.9) 3.5 0.9 (3.4)
Quanta Storage 6188.TWO 199 21.15 20.43 (3.4) Not rated Dec 11.3 11.6 0.7 0.7 2.4 (5.6) 1.2 9.3 8.2
Radiant Opto-electronics 6176.TW 2,107 138.00 136.00 (1.4) NEUTRAL Dec 14.2 11.1 3.3 3.4 12.6 5.8 5.7 10.6 4.5
Radium Life Tech 2547.TW 584 21.30 6.34 (70.2) Not rated Dec 6.1 17.2 0.9 0.6 7.4 (0.1) (1.2) 11.3 16.7
Ray dium Semicon. 3592.TWO 178 81.00 428.62 429.2 Not rated Dec 6.8 5.4 1.6 1.2 19.9 12.3 3.8 20.0 16.5
Realtek 2379.TW 1,000 59.30 60.40 1.8 NEUTRAL Dec 18.2 12.8 1.7 1.7 4.7 (2.3) 3.9 5.1 12.4
Rechi Precision 4532.TW 329 22.00 20.67 (6.1) Not rated Dec 11.2 9.3 1.5 1.3 7.3 (0.4) (6.6) (11.5) (14.0)
Richtek 6286.TW 875 173.00 236.77 36.9 Not rated Dec 16.8 14.2 4.4 3.5 22.1 15.2 0.6 (1.4) (0.3)
Makalot Industrial 2349.TW 352 3.93 6.47 64.6 Not rated Dec (4.5) (3.6) 0.4 0.4 (5.7) (13.1) 1.3 (3.0) (5.5)
Ruentex Dev. 9945.TW 1,832 55.30 25.55 (53.8) Not rated Dec 16.1 15.8 2.6 2.6 5.5 (1.3) 8.0 12.4 22.2
Ruentex Industries 2915.TW 1,901 66.80 66.57 (0.3) Not rated Dec 19.5 15.5 2.7 3.0 17.3 10.7 12.8 13.8 33.3
Sampo 1604.TW 200 9.99 10.64 6.5 Not rated Dec 28.5 (85.2) 0.8 0.7 (0.9) (8.9) (0.1) 6.8 12.4
San Fang Chemical 1307.TW 286 23.90 25.71 7.6 Not rated Dec 12.6 11.0 1.3 1.2 5.5 (2.1) 1.7 1.3 10.1
San Shing Fastech 5007.TW 301 40.40 36.17 (10.5) Not rated Dec 10.1 9.7 2.2 2.2 12.7 5.1 2.1 0.2 (7.4)
Sanyang Industry 2206.TW 585 19.30 15.91 (17.5) Not rated Dec 13.6 14.5 1.1 1.1 2.7 (4.8) 1.0 (0.5) 9.3
Sanyo Electric (TW) 1614.TW 334 31.15 16.34 (47.6) Not rated Dec 22.6 36.4 1.7 1.7 2.3 (5.2) 6.5 14.1 16.2
Senao 2450.TW 926 106.50 63.92 (40.0) Not rated Dec 19.6 18.6 5.3 5.5 15.2 8.4 1.4 (7.4) 4.4
Sesoda 1708.TW 177 33.15 29.68 (10.5) Not rated Dec 10.6 10.9 1.5 1.4 8.1 0.1 1.7 (6.4) 3.0
Sheng Yu Steel 2029.TW 200 18.45 24.82 34.5 Not rated Dec 12.3 12.0 0.7 0.8 2.4 (5.3) 0.8 (2.1) (0.8)
Shih Wei Nav igation 5608.TW 312 25.20 -0.65 (102.6) Not rated Dec 10.2 11.7 1.2 1.0 3.8 (3.9) 1.0 (1.6) (6.7)
Shihlin Elec. & Engr. 1503.TW 626 35.50 37.95 6.9 Not rated Dec 16.8 14.9 1.0 0.9 2.8 (4.4) 2.0 2.0 0.6
Shihlin Paper 1903.TW 479 54.50 1.21 (97.8) Not rated Dec (160.3) (163.1) 3.5 3.6 (2.8) (10.0) 10.1 32.0 37.1
Shin Zu Shing 3376.TW 600 112.00 78.77 (29.7) Not rated Dec 49.1 16.6 2.3 2.2 2.8 (4.8) 9.8 5.7 33.5
Calendarized Calendarized Share price performance
P/E (x) P/B (x) NT$ term (%)
* Include the small-cap stocks in HOLT® database with market cap between US$150 mn and US$2 bn. For stocks that are Not Rated, I/B/E/S consensus forecast are used. CFROI® is a
registered trademark in the United States and other countries (excluding the United Kingdom) of Credit Suisse or its subsidiaries or affiliates.
* Companies in bold and italic indicate constituents of Credit Suisse Taiwan Small Cap Index.

14 S
ep
tem
ber 2
01
2
David
& G
olia
th
90
Valuations of Credit Suisse Taiwan small-cap watch list* Market CS target/ Potential Credit Year HOLT CFROI
Cap Price HOLT warranted return Suisse end CFROI Spread
Company RIC (US$ mn) (NT$) price (NT$) (%) Rating month 2011 2012 2011 2012 (%) (%) 1W 1M 3M
Shinkong Sy nthetic Fiber 1409.TW 593 9.96 -0.62 (106.2) Not rated Dec 14.0 15.0 0.8 0.8 1.1 (6.4) 1.6 10.3 15.0
Shinkong Tex tile 1419.TW 420 41.35 12.72 (69.2) Not rated Dec 49.8 47.1 2.4 2.1 2.6 (4.9) 3.4 2.6 4.2
Sigurd Microelectronics 6257.TW 318 25.80 29.93 16.0 Not rated Dec 11.7 10.5 1.3 1.2 6.1 (1.6) 4.7 9.8 22.3
Silicon Integrated Sys. 2363.TW 220 10.35 15.38 48.6 Not rated Dec (10.1) (10.3) 0.7 0.7 (2.5) (9.9) 8.4 2.0 7.3
Silitech 3311.TW 356 57.00 60.00 5.3 NEUTRAL Dec 7.8 10.6 1.6 1.9 13.6 6.3 5.0 6.9 (8.6)
Simplo 6121.TWO 1,903 182.50 187.43 2.7 Not rated Dec 15.3 14.2 3.5 2.9 15.6 9.2 3.4 (3.2) (3.5)
Sincere Navigation 2605.TW 488 25.40 30.58 20.4 Not rated Dec 8.2 8.8 1.0 1.0 9.2 1.8 (0.4) (1.7) (1.9)
Sinmag Equipment 1580.TWO 176 122.00 123.22 1.0 Not rated Dec 13.0 11.9 4.8 n.a. 26.9 19.2 4.7 1.7 8.6
Sino American Silicon 5483.TWO 697 39.40 37.98 (3.6) Not rated Dec 17.5 (16.8) 0.8 n.a. 15.3 8.8 3.1 16.2 (21.7)
Sintek Photronic 3049.TW 362 12.10 0.85 (92.9) Not rated Dec (6.1) (6.3) 1.6 1.6 (18.2) (25.7) (0.4) 0.8 (9.0)
Sinyi Realty 9940.TW 638 40.50 36.12 (10.8) Not rated Dec 14.4 12.3 2.8 2.6 16.7 9.6 2.5 3.1 4.2
Soft World 5478.TWO 243 56.40 64.12 13.7 Not rated Dec 17.2 21.3 1.5 1.3 11.8 4.5 (2.8) (12.0) (26.8)
Solar Applied Mats. Tech. 1785.TWO 540 39.05 17.73 (54.6) Not rated Dec 19.9 16.7 1.7 1.5 4.9 (2.4) 3.9 0.8 21.7
Solartech Energy 3561.TW 208 21.40 -7.67 (135.9) Not rated Dec (4.4) (7.2) 0.7 0.6 (9.6) (17.2) 4.6 14.4 (34.8)
Sonix Technology 5471.TW 250 44.00 39.88 (9.4) Not rated Dec 13.3 11.5 2.3 2.0 8.7 1.2 2.0 2.3 (2.2)
Southeast Cement 1110.TW 269 13.90 10.37 (25.4) Not rated Dec 347.5 76.0 1.0 0.9 (2.4) (10.1) 4.9 13.5 17.3
SportOn 6146.TWO 186 67.60 85.35 26.3 Not rated Dec 8.3 11.0 3.0 n.a. 25.6 17.9 (0.6) (5.5) (4.1)
SpringSoft 2473.TW 398 56.70 47.29 (16.6) Not rated Dec 20.4 19.4 2.4 2.1 13.5 5.8 0.7 1.8 46.1
ST Shine Optical 1565.TWO 609 357.00 289.24 (19.0) Not rated Dec 16.9 16.2 6.4 4.4 31.5 24.4 1.1 (1.7) 10.7
Standard Foods 1227.TW 1,505 77.40 65.87 (14.9) Not rated Dec 18.0 15.0 5.0 4.4 19.8 13.1 2.1 (8.4) 16.5
Sunonwealth Elec. Ind. 2421.TW 157 18.55 22.56 21.6 Not rated Dec 11.1 10.4 1.2 1.1 7.0 (0.7) 2.5 (5.6) (11.0)
Sunplus 2401.TW 203 10.05 15.79 57.1 Not rated Dec (3.0) (4.7) 0.7 0.6 (7.7) (15.2) 5.9 12.9 15.3
Sunrex 2387.TW 172 13.75 21.15 53.8 Not rated Dec 15.4 6.9 0.7 0.6 2.6 (5.0) 2.2 1.1 (0.7)
Sunspring Metal 2062.TW 155 28.05 28.59 1.9 Not rated Dec 11.1 10.9 1.1 1.0 5.2 (2.6) (2.1) (9.2) (6.5)
Syncmold Enterprise 1582.TW 228 49.30 67.59 37.1 Not rated Dec 13.3 9.1 1.7 1.6 11.6 3.8 (0.6) 1.9 10.5
Sy stex 6214.TW 268 30.50 43.28 41.9 Not rated Dec 50.0 52.4 0.6 0.5 0.9 (6.6) 1.0 1.2 1.5
Ta Chen Stainless Pipe 2027.TW 365 15.25 5.33 (65.1) Not rated Dec 23.1 18.0 1.0 1.0 2.7 (5.0) 6.3 5.2 (1.9)
Ta Chong Bank 2847.TW 718 9.45 9.03 (4.5) NEUTRAL Dec 10.7 12.0 0.8 0.8 2.6 (6.1) 2.1 4.3 7.0
Taichung Commercial Bank 2812.TW 792 10.10 16.20 60.4 Not rated Dec 13.3 7.3 0.9 0.8 4.8 (3.9) 7.4 6.8 17.2
Taiflex Scientific 8039.TW 258 37.70 29.51 (21.7) Not rated Dec 13.5 10.3 1.5 1.3 5.3 (2.3) 1.1 (11.7) (13.0)
Calendarized Calendarized Share price performance
P/E (x) P/B (x) NT$ term (%)
* Include the small-cap stocks in HOLT® database with market cap between US$150 mn and US$2 bn. For stocks that are Not Rated, I/B/E/S consensus forecast are used. CFROI® is a
registered trademark in the United States and other countries (excluding the United Kingdom) of Credit Suisse or its subsidiaries or affiliates.
* Companies in bold and italic indicate constituents of Credit Suisse Taiwan Small Cap Index.

14 S
ep
tem
ber 2
01
2
David
& G
olia
th
91
Valuations of Credit Suisse Taiwan small-cap watch list* Market CS target/ Potential Credit Year HOLT CFROI
Cap Price HOLT warranted return Suisse end CFROI Spread
Company RIC (US$ mn) (NT$) price (NT$) (%) Rating month 2011 2012 2011 2012 (%) (%) 1W 1M 3M
Tainan Spinning 1440.TW 746 14.05 12.71 (9.6) Not rated Dec 40.1 37.4 0.9 0.9 (0.0) (7.0) 7.7 5.6 16.6
Taiwan Acceptance 9941.TW 557 69.90 43.16 (38.3) Not rated Dec 16.8 15.6 3.1 2.8 16.4 7.5 3.9 0.0 9.6
Taiwan Business Park 2834.TW 1,426 8.61 10.21 18.5 Not rated Dec 12.6 13.6 0.8 0.7 6.4 (2.2) 1.9 (1.0) 8.4
Taiwan Cogeneration 8926.TW 399 20.05 12.68 (36.8) Not rated Dec 11.4 10.7 1.4 1.4 (4.5) (12.0) 0.5 1.8 0.5
Taiwan Family Mart 5903.TWO 1,095 145.00 76.81 (47.0) Not rated Dec 32.2 32.0 7.4 6.8 16.0 9.2 1.4 (5.2) 2.1
Taiwan Glass Ind. 1802.TW 2,284 28.40 24.15 (15.0) Not rated Dec 26.7 34.2 1.4 1.2 1.2 (5.1) 1.2 0.0 22.2
Taiw an High Speed Rail 2633.TWO 1,143 5.19 -8.16 (257.1) Not rated Dec (27.3) n.a. (1.9) n.a. 2.2 (2.7) (0.2) (0.2) 1.8
Taiwan Hon Chuan 9939.TW 559 63.60 52.11 (18.1) Not rated Dec 12.7 11.8 1.7 1.5 6.5 (0.7) 1.0 (6.2) (0.2)
Taiwan Life Insurance 2833.TW 561 19.35 8.52 (56.0) Not rated Dec 49.6 43.1 1.8 1.5 1.3 (7.5) 2.7 2.1 15.5
Taiw an Nav igation 2617.TW 361 25.60 29.39 14.8 Not rated Dec 9.1 9.8 1.1 1.1 7.9 0.6 (3.4) (15.8) (6.7)
Taiwan Paiho 9938.TW 194 19.20 19.37 0.9 Not rated Dec 10.3 10.4 1.1 1.1 6.0 (1.7) 0.3 5.4 5.4
Taiw an Prosperity Chemical 4725.TW 451 45.70 109.42 139.4 Not rated Dec 5.7 4.8 1.5 1.4 13.7 6.8 (6.7) (19.7) (34.9)
Taiwan Secom 9917.TW 935 62.20 58.48 (6.0) Not rated Dec 15.5 15.2 2.8 2.7 15.2 8.2 1.6 4.0 (2.7)
Taiwan Shin Kong Security 9925.TW 415 32.30 20.33 (37.1) Not rated Dec 16.8 n.a. 2.0 n.a. 7.7 0.7 1.1 5.4 10.2
Taiwan Surface Mounting 6278.TW 433 49.80 54.00 8.4 NEUTRAL Dec 9.1 11.6 2.1 2.0 13.0 5.8 (0.8) (0.8) (4.7)
Taiwan Tea Corp. 2913.TW 325 15.60 4.61 (70.4) Not rated Dec 45.9 (33.0) 0.9 0.9 (1.6) (9.3) 1.6 1.3 9.1
Taiyen Biotech 1737.TW 212 22.55 19.43 (13.8) Not rated Dec 32.2 29.8 0.9 0.9 2.1 (5.5) (1.5) (2.4) 11.9
Tang Eng Iron Works 2035.TWO 336 28.40 28.08 (1.1) Not rated Dec 20.6 17.9 1.3 1.3 1.4 (6.4) 2.7 4.6 7.8
Tatung 2371.TW 526 6.65 11.28 69.7 Not rated Dec 11.1 22.8 0.4 0.5 (6.2) (13.4) 5.9 10.8 9.4
Teco Elec. & Machinery 1504.TW 1,249 20.00 24.00 20.0 OUTPERFORM Dec 13.2 12.2 1.1 1.0 4.0 (3.0) 1.3 4.2 2.6
Test Research 3030.TW 370 49.15 62.58 27.3 Not rated Dec 11.4 10.1 2.5 2.2 20.2 12.7 0.9 (0.3) 17.1
Test Rite 2908.TW 375 21.25 7.20 (66.1) Not rated Dec 17.2 16.8 1.6 1.5 5.4 (2.3) 1.2 4.3 14.7
Thye Ming 9927.TW 206 29.90 18.50 (38.1) Not rated Dec 16.2 13.5 1.6 1.5 6.2 (1.6) 5.5 10.7 14.6
Ton Yi 9907.TW 903 16.90 11.16 (34.0) Not rated Dec 27.3 26.8 1.4 1.4 2.1 (5.1) 2.1 (2.3) 18.2
Tong Hsing 6271.TW 568 103.00 79.66 (22.7) Not rated Dec 16.1 16.9 2.0 1.6 11.1 4.1 5.2 9.2 12.6
Tong Yang 1319.TW 558 28.60 26.45 (7.5) Not rated Dec 13.9 13.6 1.1 1.0 5.4 (1.9) 0.9 (2.8) 5.7
Tongtai Machine & Tool 4526.TW 192 25.00 19.82 (20.7) Not rated Dec 9.8 8.3 1.2 1.1 6.2 (1.5) 1.6 3.3 6.0
Tonlin Dept. St. 2910.TW 176 25.00 5.02 (79.9) Not rated Dec 35.7 31.1 1.9 1.8 2.3 (5.8) 4.4 4.6 13.4
Topco Scientific 5434.TW 245 48.55 51.45 6.0 Not rated Dec 7.6 8.0 1.5 1.4 16.8 9.1 0.6 (1.3) (2.0)
Transcend Info. 2451.TW 1,155 79.30 71.97 (9.2) Not rated Dec 11.8 12.6 1.8 1.7 14.4 7.7 1.3 (4.3) (2.9)
Calendarized Calendarized Share price performance
P/E (x) P/B (x) NT$ term (%)
* Include the small-cap stocks in HOLT® database with market cap between US$150 mn and US$2 bn. For stocks that are Not Rated, I/B/E/S consensus forecast are used. CFROI® is a
registered trademark in the United States and other countries (excluding the United Kingdom) of Credit Suisse or its subsidiaries or affiliates.
* Companies in bold and italic indicate constituents of Credit Suisse Taiwan Small Cap Index.

14 S
ep
tem
ber 2
01
2
David
& G
olia
th
92
Valuations of Credit Suisse Taiwan small-cap watch list* Market CS target/ Potential Credit Year HOLT CFROI
Cap Price HOLT warranted return Suisse end CFROI Spread
Company RIC (US$ mn) (NT$) price (NT$) (%) Rating month 2011 2012 2011 2012 (%) (%) 1W 1M 3M
Tripod 3044.TW 1,255 70.60 80.00 13.3 NEUTRAL Dec 8.8 10.3 1.6 1.6 7.4 0.9 (2.5) (2.4) (16.8)
Tsann Kuen Enterprise 2430.TW 351 62.00 43.04 (30.6) Not rated Dec 9.6 9.5 2.2 2.1 11.4 4.0 (0.3) (1.0) (4.5)
TSRC 2103.TW 1,702 64.00 99.94 56.2 Not rated Dec 8.8 14.4 2.9 3.3 19.0 12.3 5.4 (7.1) (2.9)
Tung Ho Steel 2006.TW 904 27.25 24.41 (10.4) Not rated Dec 9.9 11.3 1.2 1.2 6.4 (0.7) 1.7 (3.2) (2.0)
TXC 3042.TW 480 47.00 57.00 21.3 OUTPERFORM Dec 13.5 12.1 2.0 1.9 8.8 1.4 0.4 (0.8) 10.3
U-Ming Marine 2606.TW 1,296 44.65 35.91 (19.6) Not rated Dec 14.0 20.9 1.4 1.4 3.5 (3.3) 1.5 (2.4) (2.9)
Unimicron Technology 3037.TW 1,730 33.25 38.00 14.3 NEUTRAL Dec 10.2 11.5 1.0 1.0 7.0 0.5 1.7 0.5 4.7
Union Bank Of Taiwan 2838.TW 611 10.55 11.70 10.9 Not rated Dec 11.0 8.0 1.0 1.0 8.0 (0.8) 1.4 1.2 12.2
Unitech Printed CUB 2367.TW 203 10.35 8.66 (16.3) Not rated Dec 11.4 258.8 0.6 0.6 0.6 (7.1) (1.4) 3.5 (3.3)
United Integrated Serv ices 2404.TW 194 24.10 38.56 60.0 Not rated Dec 5.0 n.a. 1.2 n.a. 17.5 10.2 (1.0) 1.5 (13.3)
Unity Opto Tech. 2499.TW 356 30.55 -3.12 (110.2) Not rated Dec (19.0) (28.0) 1.9 1.6 (3.4) (10.9) 0.8 3.4 3.9
Universal Cement 1104.TW 289 14.15 17.90 26.5 Not rated Dec 21.8 20.6 0.7 0.7 (0.9) (8.4) 4.0 6.4 7.6
Unizyx 3704.TW 243 14.30 23.91 67.2 Not rated Dec 5.5 (15.5) 0.7 0.6 12.1 4.7 0.4 (5.3) (3.1)
UPC Technology 1313.TW 613 16.10 6.14 (61.9) Not rated Dec 16.9 10.9 1.0 1.0 2.5 (4.9) 3.2 (2.4) 1.2
USI 1304.TW 993 25.70 23.79 (7.4) Not rated Dec 8.6 12.5 1.6 1.4 8.0 1.0 2.0 2.4 15.2
Vanguard 5347.TWO 866 15.80 16.00 1.3 NEUTRAL Dec 29.8 13.7 1.3 1.2 0.9 (6.1) 0.6 20.6 7.5
Via Technologies 2388.TW 369 11.05 12.06 9.1 Not rated Dec (3.2) (3.6) 1.3 1.3 (21.2) (28.1) 21.6 34.6 (19.0)
Visual Photonics Epitaxy 2455.TW 352 42.30 35.26 (16.6) Not rated Dec 20.0 13.7 2.9 2.5 11.0 3.6 0.6 (4.5) 5.4
Wafer Works 6182.TWO 178 18.30 0.91 (95.0) Not rated Dec 62.1 73.4 0.7 0.7 (2.8) (10.5) 1.7 22.0 (5.9)
Wah Lee Ind. 3010.TW 304 38.90 37.21 (4.3) Not rated Dec 9.4 7.8 1.2 1.1 6.5 (1.1) 1.2 (0.8) 0.1
Walsin Lihwa 1605.TW 1,254 10.25 10.70 4.4 Not rated Dec (8.5) (32.0) 0.6 0.5 0.5 (6.4) 13.8 8.6 28.8
Walsin Technology 2492.TW 174 7.44 15.64 110.2 Not rated Dec (4.8) (4.6) 0.3 0.4 (3.9) (11.7) 5.1 7.5 2.8
Wan Hai Lines 2615.TW 1,125 15.00 19.00 26.7 OUTPERFORM Dec (24.8) 20.3 1.1 1.0 (1.8) (8.7) 0.7 (8.5) 10.3
Waterland Financial 2889.TW 740 8.57 8.66 1.1 Not rated Dec 14.5 12.5 0.8 0.8 4.5 (4.2) (3.2) (8.3) (8.7)
Wei-Chuan Foods 1201.TW 582 34.00 2.97 (91.3) Not rated Dec 25.2 23.4 2.2 2.0 2.3 (5.1) (2.0) 8.6 12.0
WIN Semiconductors 3105.TWO 840 38.30 40.89 6.8 Not rated Dec 18.8 12.8 2.5 2.0 10.0 2.9 5.4 (0.6) 0.7
Winbond Electronics 2344.TW 548 4.40 11.21 154.7 Not rated Dec (19.1) (19.4) 0.5 0.5 (0.8) (7.9) (1.3) (1.6) 5.3
Wintek 2384.TW 1,006 16.10 15.00 (6.8) NEUTRAL Dec (13.1) (32.5) 0.8 0.8 (3.1) (9.8) 4.9 6.6 2.9
Wistron Neweb 6285.TW 566 55.10 79.73 44.7 Not rated Dec 9.7 11.1 1.8 1.6 11.4 4.3 4.8 (1.6) 9.6
Wowprime 2727.TW 1,004 437.00 198.98 (54.5) Not rated Dec 34.4 27.3 14.7 7.2 23.7 16.7 0.9 (3.1) (0.1)
Calendarized Calendarized Share price performance
P/E (x) P/B (x) NT$ term (%)
* Include the small-cap stocks in HOLT® database with market cap between US$150 mn and US$2 bn. For stocks that are Not Rated, I/B/E/S consensus forecast are used. CFROI® is a
registered trademark in the United States and other countries (excluding the United Kingdom) of Credit Suisse or its subsidiaries or affiliates.
* Companies in bold and italic indicate constituents of Credit Suisse Taiwan Small Cap Index.

14 S
ep
tem
ber 2
01
2
David
& G
olia
th
93
Valuations of Credit Suisse Taiwan small-cap watch list* Market CS target/ Potential Credit Year HOLT CFROI
Cap Price HOLT warranted return Suisse end CFROI Spread
Company RIC (US$ mn) (NT$) price (NT$) (%) Rating month 2011 2012 2011 2012 (%) (%) 1W 1M 3M
WPG 3702.TW 2,139 38.20 37.50 (1.8) NEUTRAL Dec 11.9 12.7 1.6 1.7 6.9 0.3 8.7 14.9 8.7
WT Microelectronics 3036.TW 416 36.50 30.02 (17.7) Not rated Dec 6.9 10.8 1.2 1.1 9.7 2.2 5.3 0.8 (1.6)
WUS Printed Circuit 2316.TW 147 13.80 20.05 45.3 Not rated Dec 10.5 9.5 0.8 0.8 0.7 (7.3) 2.6 4.9 (4.2)
Xintec 3374.TWO 185 23.20 13.85 (40.3) Not rated Dec 40.4 34.1 1.4 1.4 1.1 (6.6) 5.9 5.0 23.0
Yageo 2327.TW 658 8.82 13.40 51.9 Not rated Dec 11.6 11.1 0.6 0.6 2.8 (4.3) 0.3 4.1 (6.4)
Yang Ming Marine 2609.TW 1,135 11.90 3.92 (67.1) Not rated Dec (3.6) (25.3) 1.1 1.5 (4.9) (12.0) 1.3 (9.5) (1.2)
Yeun Chy ang Ind. 2034.TW 208 16.65 6.57 (60.6) Not rated Dec 13.2 12.7 0.9 0.9 3.5 (4.3) 10.6 10.3 5.7
Yieh Phui Enterprise 2023.TW 492 8.90 8.70 (2.2) Not rated Dec 26.7 28.2 0.6 0.5 1.5 (6.1) (2.2) 0.7 (0.8)
Young Fast Opto 3622.TW 368 72.00 63.00 (12.5) NEUTRAL Dec 25.7 (71.8) 1.0 1.1 0.5 (6.3) (0.7) (3.1) 22.7
Young Optics 3504.TW 349 90.40 69.39 (23.2) Not rated Dec 17.2 19.7 2.6 n.a. 8.4 1.4 0.7 (15.9) (9.6)
Youngtek 6261.TWO 271 71.00 80.81 13.8 Not rated Dec 10.7 10.4 1.6 1.3 10.2 2.6 0.3 (7.2) (9.0)
Yuen Foong Yu Paper 1907.TW 663 11.80 9.85 (16.6) Not rated Dec 9.8 22.7 0.8 0.7 2.3 (5.1) 0.4 (1.7) (2.9)
Yulon Nissan Motor 2227.TW 2,643 260.50 114.95 (55.9) Not rated Dec 20.4 20.3 4.0 4.4 9.5 2.8 (0.4) (2.3) 13.0
Yung Chi Paint & Varnish 1726.TW 322 58.70 59.34 1.1 Not rated Dec 13.6 11.9 1.5 1.4 8.3 0.7 (0.3) 3.2 19.1
Yungshin Pharma. 3705.TW 343 40.00 36.21 (9.5) Not rated Dec 18.3 16.8 1.8 1.8 5.6 (1.8) 0.3 0.5 (0.4)
Yung Tay Engineering 1507.TW 763 54.90 52.95 (3.6) Not rated Dec 15.2 14.1 2.0 1.9 10.3 3.3 0.4 6.8 16.1
Yunshin Con. & Dev. 5508.TWO 326 53.20 15.57 (70.7) Not rated Dec 29.1 29.9 3.1 3.0 6.2 (1.7) (4.5) 22.7 29.4
Zig Sheng Ind. 1455.TW 207 10.10 10.40 2.9 Not rated Dec 39.3 25.8 0.8 0.8 1.3 (6.6) 1.5 (8.2) 12.1
Zinwell 2485.TW 321 29.90 36.57 22.3 Not rated Dec 10.6 8.8 1.4 1.3 9.2 2.0 2.7 2.6 (1.0)
Calendarized Calendarized Share price performance
P/E (x) P/B (x) NT$ term (%)
* Include the small-cap stocks in HOLT® database with market cap between US$150 mn and US$2 bn. For stocks that are Not Rated, I/B/E/S consensus forecast are used. CFROI® is a
registered trademark in the United States and other countries (excluding the United Kingdom) of Credit Suisse or its subsidiaries or affiliates.
* Companies in bold and italic indicate constituents of Credit Suisse Taiwan Small Cap Index.

14 S
ep
tem
ber 2
01
2
David
& G
olia
th
94
Taiwan – Screening Absolute price performance - top & bottom 10 companies Absolute price performance - top & bottom 10 companies Absolute price performance - top & bottom 10 companies
Price 1W return Price 1M return Price 3M return Company RIC (NT$) (%) Company RIC (NT$) (%) Company RIC (NT$) (%)
Winners Winners Winners Via Technologies 2388.TW 11.05 21.6 China Metal Products 1532.TW 25.10 40.2 Federal 2102.TW 20.85 53.1 Chung Hung Steel 2014.TW 8.55 18.6 King S Town Construction 2524.TW 33.20 35.6 SpringSoft 2473.TW 56.70 46.1 Ali 3041.TW 38.60 16.4 Via Technologies 2388.TW 11.05 34.6 China Metal Products 1532.TW 25.10 44.3 Elan Microelectronics 2458.TW 54.50 15.7 Shihlin Paper 1903.TW 54.50 32.0 King S Town Construction 2524.TW 33.20 38.0 Hey Song 1234.TW 46.90 14.7 Huang Hsiang Construction 2545.TW 78.90 30.8 Coxon Precise Industrial 3607.TW 53.00 37.8 Walsin Lihwa 1605.TW 10.25 13.8 Ali 3041.TW 38.60 27.8 Shihlin Paper 1903.TW 54.50 37.1 Ruentex Industries 2915.TW 66.80 12.8 AcBel Polytech 6282.TW 21.25 26.9 AcBel Polytech 6282.TW 21.25 36.2 Hannstar Display 6116.TW 3.38 12.7 Federal 2102.TW 20.85 26.4 Elan Microelectronics 2458.TW 54.50 34.2 Neo Solar Power 3576.TW 19.80 11.5 Hey Song 1234.TW 46.90 23.7 Shin Zu Shing 3376.TW 112.00 33.5 ITE Technology 3014.TW 28.60 11.3 Yunshin Con. & Dev. 5508.TWO 53.20 22.7 Chong Hong 5534.TW 77.70 33.5 Losers Losers Losers Nanya Technology 2408.TW 1.81 (8.1) Elitegroup Computer Sys. 2331.TW 9.62 (22.4) Taiwan Prosperity Chemical 4725.TW 45.70 (34.9) Nantex Industry 2108.TW 21.80 (7.7) Taiwan Prosperity Chemical 4725.TW 45.70 (19.7) Solartech Energy 3561.TW 21.40 (34.8) Taiwan Prosperity Chemical 4725.TW 45.70 (6.7) Hannstar Display 6116.TW 3.38 (18.8) Inotera Memories 3474.TW 4.97 (31.6) Rechi Precision 4532.TW 22.00 (6.6) Holiday Entertainment 9943.TW 47.30 (16.1) Nanya Technology 2408.TW 1.81 (27.0) Chin-Poon 2355.TW 34.80 (6.2) Globe Union 9934.TW 17.75 (16.1) Hannstar Display 6116.TW 3.38 (26.8) International Games 3293.TWO 108.00 (5.3) Young Optics 3504.TW 90.40 (15.9) Soft World 5478.TWO 56.40 (26.8) Yunshin Con. & Dev. 5508.TWO 53.20 (4.5) Taiwan Navigation 2617.TW 25.60 (15.8) Motech Industries 6244.TWO 31.55 (23.8) Taiwan Navigation 2617.TW 25.60 (3.4) Les Enphants 2911.TW 23.10 (14.2) Sino American Silicon 5483.TWO 39.40 (21.7) Waterland Financial 2889.TW 8.57 (3.2) Johnson Health Tech 1736.TW 68.00 (13.9) Avermedia Technologies 2417.TW 18.00 (21.2) Flexium 6269.TW 123.00 (3.1) Soft World 5478.TWO 56.40 (12.0) E-Ton 3452.TWO 12.65 (19.4)
Price-to-earnings - most & least expensive 10 companies Price-to-book - most & least expensive 10 companies CFROI® Spread - top & bottom 10 companies
Price 12 P/E Price 12 P/B Price CFROI® Spread Company RIC (NT$) (x) Company RIC (NT$) (x) Company RIC (NT$) (%)
Winners Winners Winners Highwealth Construction 2542.TW 51.10 4.5 Chunghwa Picture 2475.TW 0.83 0.2 ST Shine Optical 1565.TWO 357.00 24.4 Taiwan Prosperity Chemical 4725.TW 45.70 4.8 Green Energy Technology 3519.TW 21.40 0.3 China Steel Chemical 1723.TW 128.50 22.6 Raydium Semicon. 3592.TWO 81.00 5.4 Walsin Technology 2492.TW 7.44 0.4 China Ecotek 1535.TW 65.50 19.7 Phihong Technology 2457.TW 27.45 5.5 Makalot Industrial 2349.TW 3.93 0.4 Sinmag Equipment 1580.TWO 122.00 19.2 Inventec 2356.TW 10.25 5.8 CMC Magnetics 2323.TW 4.89 0.4 SportOn 6146.TWO 67.60 17.9 Chong Hong 5534.TW 77.70 6.1 Delsolar 3599.TW 13.60 0.4 Apex Biotechnology 1733.TW 74.60 16.9 Huaku Construction 2548.TW 71.20 6.4 Tatung 2371.TW 6.65 0.5 Wowprime 2727.TW 437.00 16.7 Depo Auto Parts 6605.TW 64.70 6.6 Winbond Electronics 2344.TW 4.40 0.5 Richtek 6286.TW 173.00 15.2 Global Brands Mfg. 6191.TW 11.75 6.6 Kinpo Electronics 2312.TW 6.76 0.5 Flexium 6269.TW 123.00 14.9 Asia Polymer 1308.TW 28.30 6.7 Mitac Int'l 2315.TW 10.00 0.5 Formosa Int'l. Hotels 2707.TW 312.00 14.3 Losers Losers Losers BES Engineering 2515.TW 7.48 1,249.1 PChome Online 8044.TWO 170.00 9.2 Delsolar 3599.TW 13.60 (39.5) Kinpo Electronics 2312.TW 6.76 329.5 Formosa Int'l. Hotels 2707.TW 312.00 8.8 E-Ton 3452.TWO 12.65 (36.8) Unitech Printed CUB 2367.TW 10.35 258.8 Wowprime 2727.TW 437.00 7.2 Hannstar Display 6116.TW 3.38 (30.3) Pihsiang Machinery Mfg. 1729.TW 36.65 248.5 Taiwan Family Mart 5903.TWO 145.00 6.8 Via Technologies 2388.TW 11.05 (28.1) Formosa Sumco Tech. 3532.TW 34.20 184.7 Senao 2450.TW 106.50 5.5 Neo Solar Power 3576.TW 19.80 (27.7) Hannstar Display 6116.TW 3.38 84.5 China Steel Chemical 1723.TW 128.50 5.4 Sintek Photronic 3049.TW 12.10 (25.7) EVA Airways 2618.TW 16.65 77.6 Gourmet Master 2723.TW 221.50 4.5 Inotera Memories 3474.TW 4.97 (25.2) Southeast Cement 1110.TW 13.90 76.0 Standard Foods 1227.TW 77.40 4.4 Chunghwa Picture 2475.TW 0.83 (20.1) Epistar 2448.TW 63.60 73.6 ST Shine Optical 1565.TWO 357.00 4.4 Huga Optotech 8199.TW 12.75 (19.7) Wafer Works 6182.TWO 18.30 73.4 Yulon Nissan Motor 2227.TW 260.50 4.4 Solartech Energy 3561.TW 21.40 (17.2)
* For stocks that are not rated, I/B/E/S consensus forecast numbers are used. CFROI® Spread is the difference between CFROI® and market implied discount rate. A larger number indicates
that more value is created by a company.

14 September 2012
David & Goliath 95
Thailand – Company updates Major Cineplex (MAJO.BK, Bt18.10, N, TP Bt20.00)
Ticket sales likely to fall YoY again in 3Q
■ Based on Box Office Mojo data, ticket sales during July-August
have fallen 8% YoY. This implies that Major’s ticket sales
revenue could again fall short of expectation in 3Q.
■ We thus see an increased risk of Major missing our ticket sales
growth forecast this year. Assuming that Major’s 3Q ticket sales
fall in line with Box Office Mojo data, Major must generate growth
of 55% YoY in 4Q12 to meet our full-year forecast; this is a tough
target to meet, in our view.
■ The area that could surprise us on the upside is advertising
income, which could offset weaker-than-expected ticket sales.
However, we believe that, at best, this should help Major to meet
our full-year profit forecast, but we maintain there is risk of market
disappointment as 2012E consensus is 10% above our forecast.
■ We maintain NEUTRAL. Beyond 2012, potentially rising
competition from its key rival, SF Cinema, could emerge as a
new threat. So far this year, SF has already enjoyed much
stronger revenue growth than Major due to market share gains.
Bbg/RIC 18.50
20.00 (20.00)
886.27 8
3.6
2.1
Free float (%) 54.2 Performance 1M 3M 12M
Absolute (%) 1.1 6.3 17.8
Relativ e (%) (2.0) (2.7) (4.1)
Year 12/10A 12/11A 12/12E 12/13E 12/14E
5,937 6,730 7,159 7,582 8,008
1,754 1,792 1,979 2,178 2,312
617 721 833 1,052 1,178
0.73 0.83 0.93 1.18 1.32
n.a. n.a. 0 0 0
n.a. n.a. 1.05 1.25 1.46
167.2 13.9 12.9 26.3 11.9
25.5 22.4 19.8 15.7 14.0
4.3 4.5 4.6 5.8 6.5
11.2 10.5 9.3 8.2 7.4
2.8 2.8 2.7 2.6 2.6
11.4 12.6 14.0 17.2 18.7
57.8 40.9 33.1 21.8 9.5
- Consensus EPS (Bt)
EPS grow th (%)
P/E (x )
Div idend y ield (%)
EV/EBITDA (x )
P/B (x )
EBITDA (Bt mn)
Net profit (Bt mn)
EPS (Bt)
- Change from prev . EPS (%)
Price (12 Sep 12 , Bt)
TP (prev. TP Bt)
Est. pot. % chg. to TP
52-w k range (Bt)
MAJOR TB / MAJO.BK
N (N)
Daily trad v ol - 6m av g (mn)
Rating (prev. rating)
Shares outstanding (mn)
20.8 - 10.5
16,396.1/ 529.9
ROE (%)
Note1:Major Cineplex Group Public Company Limited is a Thailand-based lifestyle entertainment company. Its core businesses include cinema, bowling,
karaoke, ice skating rink, retails space, film distribution and advertising media..
Mkt cap (Bt/US$ mn)Daily trad v al - 6m av g (US$ mn)
Major shareholders Poolv araluck Family (43%)
Net debt(cash)/equity (%)
Rev enue (Bt mn)
Price performance vs. MSCI Thailand
60
80
100
120
140
09/11 11/11 01/12 03/12 05/12 07/12 09/12
Major Cineplex MSCI Thailand
Thaniya Kevalee / Research Analyst / 662 614 6219 /
Extracted from The Asian Daily 13 Sep 2012

14 S
ep
tem
ber 2
01
2
David
& G
olia
th
96
Valuations of Credit Suisse Thailand small-cap watch list*
Market CS target/ Potential Credit Year HOLT CFROI
Cap Price HOLT warranted return Suisse end CFROI Spread
Company RIC (US$ mn) (Bt) price (Bt) (%) Rating month 2011 2012 2011 2012 (%) (%) 1W 1M 3M
A.J. Plast AJ.BK 183 14.20 10.68 (24.8) Not rated Dec 6.3 38.4 1.7 1.6 11.8 6.4 (2.1) 23.5 15.4
AE. Thana Sinsap AEON.BK 378 46.75 19.99 (57.2) Not rated Feb n.a. (600.0) n.a. 1.8 (5.2) (14.2) 0.0 33.6 54.5
Amata AMAT.BK 569 16.50 15.43 (6.5) Not rated Dec 19.0 14.4 2.9 2.9 7.7 1.5 (1.2) (4.1) 4.4
Asia Plus Securities ASP.BK 152 2.24 1.95 (12.7) Not rated Dec 9.3 10.0 1.2 1.2 7.8 (1.3) 0.0 (4.3) (1.8)
Asian Property AP.BK 762 8.30 10.00 20.5 OUTPERFORM Dec 15.1 10.2 2.2 1.9 8.2 1.7 3.8 11.4 16.9
Bangchak Petroleum BCP.BK 1,045 23.50 31.87 35.6 Not rated Dec 5.5 8.4 1.0 0.9 8.8 2.8 1.3 2.6 0.4
Bangkok Aviation Fuel BAFS.BK 232 14.10 14.70 4.2 Not rated Dec 13.7 11.9 2.0 1.8 6.4 (0.0) 1.4 0.7 13.7
Bangkok Chain Hospital BCH.BK 625 9.70 7.40 (23.8) Not rated Dec 28.5 22.5 6.0 5.4 8.7 3.6 0.0 7.8 7.2
Bangkok Expressway BECL.BK 734 29.50 38.43 30.3 Not rated Dec 16.1 15.4 1.2 1.2 2.0 (4.9) 2.6 7.3 25.0
Bangkok Life BLA.BK 1,735 44.75 45.00 0.6 NEUTRAL Dec 15.7 13.9 4.0 3.0 26.7 18.1 3.5 0.6 (4.8)
Bangkok Metro BMCL.BK 255 0.66 -0.13 (120.4) Not rated Dec (6.6) (8.4) 4.2 4.1 (4.4) (11.8) 1.5 6.5 10.0
Berli Jucker BJC.BK 2,514 49.00 28.56 (41.7) Not rated Dec 35.8 31.0 6.2 5.8 7.0 2.0 2.1 20.2 23.3
BTS BTS.BK 1,697 5.55 5.80 4.4 Not rated Mar 29.5 31.2 1.4 1.3 2.7 (2.9) 4.7 4.7 15.4
Bumrungrad Hospital BH.BK 1,888 80.25 79.00 (1.6) NEUTRAL Dec 37.9 26.8 8.7 6.5 14.7 9.7 (1.5) 3.5 30.5
Cal-Comp CCET.BK 364 2.76 0.74 (73.0) Not rated Dec 21.2 8.2 0.7 0.7 1.4 (5.6) (0.7) 6.2 3.0
Central Plaza Hotel CENT.BK 746 17.10 8.75 (48.9) Not rated Dec 41.7 21.6 4.0 3.5 3.7 (3.2) (1.2) 11.0 39.0
CH Karnchang CK.BK 416 7.80 0.95 (87.8) Not rated Dec 13.9 36.1 2.0 2.0 (1.0) (8.1) 3.3 11.4 10.6
Bank Thai CIMBT.BK 1,206 1.77 0.83 (53.4) Not rated Dec 25.8 22.3 2.5 2.4 3.8 (4.8) 0.0 (3.8) (16.9)
CPN Retail CPNRu.BK 867 16.40 22.46 36.9 Not rated Dec 14.2 13.8 1.6 1.5 9.6 4.8 0.0 5.1 15.5
Delta Electronics DELT.BK 1,058 26.25 50.10 90.9 Not rated Dec 11.4 10.4 1.6 1.6 7.1 2.6 4.0 10.8 20.4
Diamond Roofing Tiles DRT.BK 228 6.85 8.22 20.0 Not rated Dec 14.9 12.5 3.4 3.0 10.2 4.7 (2.8) 4.6 7.0
Dynasty Ceramic DCC.BK 662 50.25 46.03 (8.4) Not rated Dec 16.5 15.5 7.8 7.5 15.0 10.4 (1.0) (2.4) 0.0
Eastern Water Resources EASW.BK 683 12.70 11.19 (11.9) Not rated Dec 20.8 19.2 3.0 2.8 7.9 2.0 3.3 16.5 27.0
Electricity Generating EGCO.BK 2,126 125.00 211.30 69.0 Not rated Dec 13.2 10.5 1.1 1.1 (1.5) (6.3) 5.9 7.8 17.4
Erawan ERW.BK 203 2.80 2.81 0.2 Not rated Dec 12.7 50.9 1.8 1.7 6.5 (0.7) 5.3 7.7 8.5
Esso (TJ) ESSO.BK 1,219 10.90 10.95 0.5 Not rated Dec 40.4 10.8 1.5 1.7 (0.9) (7.1) 2.8 (0.9) 9.5
G J Steel GJS.BK 193 0.15 0.56 273.9 Not rated Dec (5.0) (4.6) 0.5 0.5 0.0 (5.1) 7.1 7.1 7.1
GFPT GFPT.BK 298 7.35 7.35 0.0 Not rated Dec 7.7 32.2 1.6 1.6 9.9 4.3 0.7 (6.4) (23.8)
GMM Grammy GRAM.BK 355 20.70 10.37 (49.9) Not rated Dec 17.5 36.6 3.7 3.2 5.1 (1.1) (2.4) (11.5) (22.6)
G Steel GSTE.BK 265 0.38 1.07 182.0 Not rated Dec (2.5) (2.3) 0.9 1.2 0.0 (5.7) 2.7 (2.6) 5.6
Share price performance
Bt term (%)P/B (x)P/E (x)
CalendarizedCalendarized
* Include the small-cap stocks in HOLT® database with market cap between US$150 mn and US$2 bn. For stocks that are Not Rated, I/B/E/S consensus forecast are used. CFROI® is a
registered trademark in the United States and other countries (excluding the United Kingdom) of Credit Suisse or its subsidiaries or affiliates
* Companies in bold and italic indicate constituents of Credit Suisse Thailand Small Cap Index

14 S
ep
tem
ber 2
01
2
David
& G
olia
th
97
Valuations of Credit Suisse Thailand small-cap watch list*
Market CS target/ Potential Credit Year HOLT CFROI
Cap Price HOLT warranted return Suisse end CFROI Spread
Company RIC (US$ mn) (Bt) price (Bt) (%) Rating month 2011 2012 2011 2012 (%) (%) 1W 1M 3M
Hana Microelectronics HANA.BK 533 20.50 43.41 111.8 Not rated Dec 10.2 10.2 1.1 1.1 5.3 0.6 0.0 (1.0) 2.0
Hemaraj Land & Dev. HEMR.BK 966 3.08 3.76 21.9 Not rated Dec 55.7 13.4 3.4 3.2 6.5 0.9 0.7 4.8 4.8
Home Product Center HMPR.BK 2,426 12.80 6.60 (48.4) UNDERPERFORM Dec 37.4 32.4 9.2 8.0 16.1 11.8 2.4 8.5 1.6
ICC Int'l ICC.BK 385 41.00 81.96 99.9 Not rated Dec 16.0 15.2 0.9 0.8 3.3 (1.5) (0.6) 1.9 2.5
Italian-Thai Dev. ITD.BK 496 3.66 2.50 (31.7) UNDERPERFORM Dec (9.0) (9.6) 1.9 2.4 (2.0) (8.8) 1.7 14.4 16.6
Jasmine JAS.BK 894 3.82 3.15 (17.5) Not rated Dec 25.5 14.1 3.9 3.5 8.3 2.2 (2.6) 10.4 26.5
Khon Kaen Sugar KSL.BK 661 13.00 13.61 4.7 Not rated Oct 10.6 10.2 2.0 2.3 8.8 3.2 4.0 6.6 0.0
Kiatnakin Bank KK.BK 951 46.25 44.31 (4.2) Not rated Dec 10.2 11.0 1.3 1.2 3.5 (5.3) 3.9 12.1 32.1
Laguna Resorts & Hotels LRH.BK 195 36.25 76.09 109.9 Not rated Dec (27.1) (22.5) 0.4 0.4 (1.4) (7.7) 0.7 (8.2) (8.2)
Lanna Resources LANN.BK 283 25.00 182.91 631.6 Not rated Dec 8.4 7.9 2.7 2.1 27.0 21.6 0.8 (3.8) (2.9)
LH Financial LHBANK.BK 514 1.33 0.31 (77.0) Not rated Dec 27.5 22.5 1.2 1.1 1.2 (7.6) 0.8 1.5 1.5
Loxley LOXL.BK 284 4.40 2.95 (33.0) Not rated Dec 29.3 28.9 2.1 2.0 0.6 (5.8) 12.8 22.2 29.4
LPN Development LPN.BK 858 18.00 22.00 22.2 OUTPERFORM Dec 13.9 10.2 3.7 3.1 22.9 18.0 4.7 10.4 9.1
Major Cineplex MAJO.BK 518 18.10 20.00 10.5 NEUTRAL Dec 21.9 19.4 2.7 2.7 9.8 4.2 1.7 (1.1) 4.0
Maybank Kim Eng Secs. MBKET.BK 256 13.90 14.28 2.8 Not rated Dec 12.6 12.2 1.8 1.8 9.4 3.5 (0.7) (3.5) (6.1)
MBK MBK.BK 707 116.00 122.38 5.5 Not rated Jun n.a. 14.7 n.a. 1.9 3.9 (2.2) 3.6 24.7 21.5
MCOT MCOT.BK 638 28.75 32.80 14.1 NEUTRAL Dec 11.0 11.7 2.5 2.4 8.9 4.1 (0.9) (0.9) 1.8
Minor MINT.BK 1,853 15.70 19.00 21.0 OUTPERFORM Dec 24.9 19.9 3.5 3.3 7.0 1.5 0.0 2.6 18.0
OHTL OHTL.BK 238 460.00 209.64 (54.4) Not rated Dec 56.7 55.1 6.5 5.8 2.7 (3.0) (6.9) (3.0) (4.2)
Oishi OISH.BK 1,184 195.50 136.17 (30.3) Not rated Dec 45.4 32.0 12.6 9.9 10.6 5.4 3.4 13.7 62.9
Polyplex PTL.BK 377 14.60 25.57 75.2 Not rated Mar 5.9 7.4 1.4 1.3 10.0 5.2 0.0 2.8 (2.7)
POSCO Thainox INOX.BK 476 1.89 2.88 52.4 Not rated Dec (23.6) (32.7) 1.4 1.4 (4.7) (9.5) 0.5 4.4 3.3
Precious Shipping PSL.BK 443 13.20 11.21 (15.1) Not rated Dec 19.1 70.2 0.9 0.9 (0.9) (6.6) (1.5) (9.0) (11.4)
Property Perfect PF.BK 191 1.07 -0.10 (109.3) Not rated Dec 10.4 5.6 0.7 0.6 3.6 (4.9) 0.9 (4.5) (0.9)
Preuksa Real Estate PS.BK 1,263 17.70 14.90 (15.8) UNDERPERFORM Dec 14.0 11.5 2.3 2.0 7.9 2.3 (0.6) 1.7 19.6
Quality Houses QH.BK 531 1.79 1.89 5.6 OUTPERFORM Dec 18.8 10.6 1.2 1.1 1.5 (5.4) 0.6 0.6 16.2
Ramkhamhaeng Hospital RAM.BK 721 1860.00 1216.86 (34.6) Not rated Dec 24.4 23.6 7.0 6.1 10.7 5.1 (1.9) 12.9 77.8
Ratchaburi Electricity RATC.BK 2,249 48.00 54.70 14.0 Not rated Dec 14.4 12.7 1.5 1.4 2.9 (2.5) 2.1 3.2 14.3
Regional Containers RCL.BK 183 6.85 13.12 91.6 Not rated Dec (7.3) (8.7) 0.4 0.5 (10.4) (17.2) (1.4) 4.6 (1.4)
Robinson Dept. Store ROBI.BK 2,287 63.75 59.00 (7.5) NEUTRAL Dec 48.7 32.2 8.1 7.2 12.3 8.0 0.8 6.3 5.4
Share price performance
Bt term (%)
Calendarized Calendarized
P/E (x) P/B (x)
* Include the small-cap stocks in HOLT® database with market cap between US$150 mn and US$2 bn. For stocks that are Not Rated, I/B/E/S consensus forecast are used. CFROI® is a
registered trademark in the United States and other countries (excluding the United Kingdom) of Credit Suisse or its subsidiaries or affiliates.
* Companies in bold and italic indicate constituents of Credit Suisse Thailand Small Cap Index
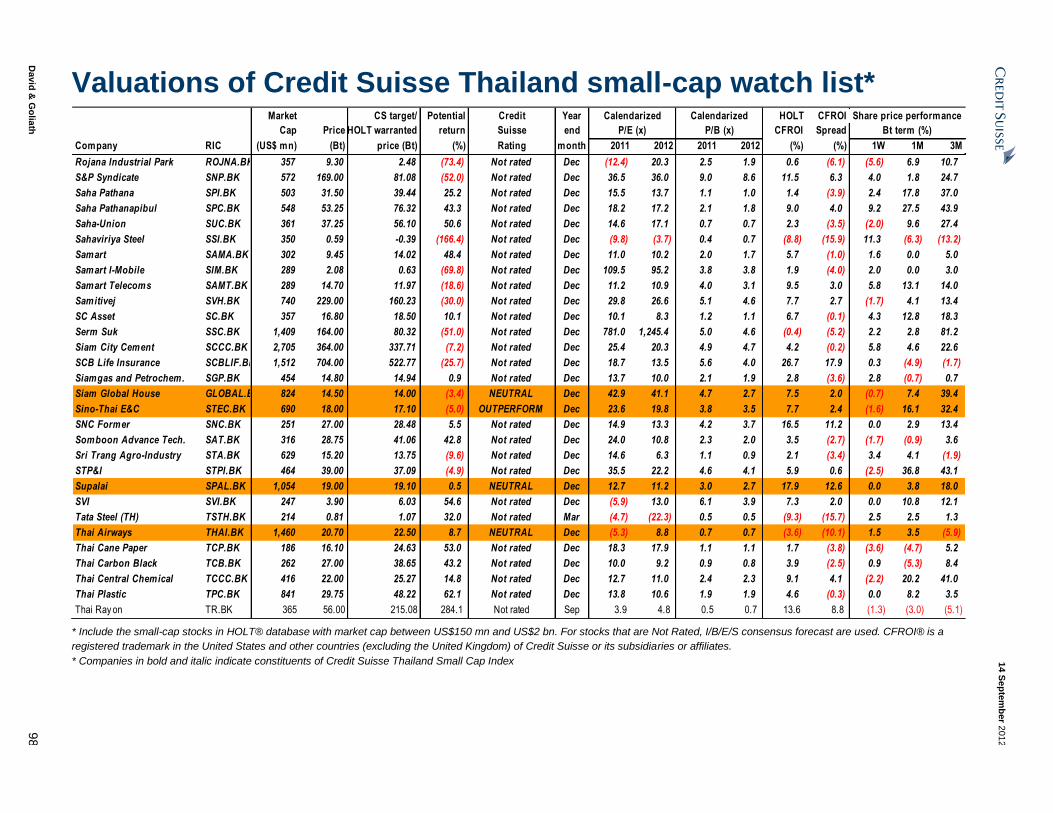
14 S
ep
tem
ber 2
01
2
David
& G
olia
th
98
Valuations of Credit Suisse Thailand small-cap watch list*
Market CS target/ Potential Credit Year HOLT CFROI
Cap Price HOLT warranted return Suisse end CFROI Spread
Company RIC (US$ mn) (Bt) price (Bt) (%) Rating month 2011 2012 2011 2012 (%) (%) 1W 1M 3M
Rojana Industrial Park ROJNA.BK 357 9.30 2.48 (73.4) Not rated Dec (12.4) 20.3 2.5 1.9 0.6 (6.1) (5.6) 6.9 10.7
S&P Syndicate SNP.BK 572 169.00 81.08 (52.0) Not rated Dec 36.5 36.0 9.0 8.6 11.5 6.3 4.0 1.8 24.7
Saha Pathana SPI.BK 503 31.50 39.44 25.2 Not rated Dec 15.5 13.7 1.1 1.0 1.4 (3.9) 2.4 17.8 37.0
Saha Pathanapibul SPC.BK 548 53.25 76.32 43.3 Not rated Dec 18.2 17.2 2.1 1.8 9.0 4.0 9.2 27.5 43.9
Saha-Union SUC.BK 361 37.25 56.10 50.6 Not rated Dec 14.6 17.1 0.7 0.7 2.3 (3.5) (2.0) 9.6 27.4
Sahaviriya Steel SSI.BK 350 0.59 -0.39 (166.4) Not rated Dec (9.8) (3.7) 0.4 0.7 (8.8) (15.9) 11.3 (6.3) (13.2)
Samart SAMA.BK 302 9.45 14.02 48.4 Not rated Dec 11.0 10.2 2.0 1.7 5.7 (1.0) 1.6 0.0 5.0
Samart I-Mobile SIM.BK 289 2.08 0.63 (69.8) Not rated Dec 109.5 95.2 3.8 3.8 1.9 (4.0) 2.0 0.0 3.0
Samart Telecoms SAMT.BK 289 14.70 11.97 (18.6) Not rated Dec 11.2 10.9 4.0 3.1 9.5 3.0 5.8 13.1 14.0
Samitivej SVH.BK 740 229.00 160.23 (30.0) Not rated Dec 29.8 26.6 5.1 4.6 7.7 2.7 (1.7) 4.1 13.4
SC Asset SC.BK 357 16.80 18.50 10.1 Not rated Dec 10.1 8.3 1.2 1.1 6.7 (0.1) 4.3 12.8 18.3
Serm Suk SSC.BK 1,409 164.00 80.32 (51.0) Not rated Dec 781.0 1,245.4 5.0 4.6 (0.4) (5.2) 2.2 2.8 81.2
Siam City Cement SCCC.BK 2,705 364.00 337.71 (7.2) Not rated Dec 25.4 20.3 4.9 4.7 4.2 (0.2) 5.8 4.6 22.6
SCB Life Insurance SCBLIF.BK 1,512 704.00 522.77 (25.7) Not rated Dec 18.7 13.5 5.6 4.0 26.7 17.9 0.3 (4.9) (1.7)
Siamgas and Petrochem. SGP.BK 454 14.80 14.94 0.9 Not rated Dec 13.7 10.0 2.1 1.9 2.8 (3.6) 2.8 (0.7) 0.7
Siam Global House GLOBAL.BK 824 14.50 14.00 (3.4) NEUTRAL Dec 42.9 41.1 4.7 2.7 7.5 2.0 (0.7) 7.4 39.4
Sino-Thai E&C STEC.BK 690 18.00 17.10 (5.0) OUTPERFORM Dec 23.6 19.8 3.8 3.5 7.7 2.4 (1.6) 16.1 32.4
SNC Former SNC.BK 251 27.00 28.48 5.5 Not rated Dec 14.9 13.3 4.2 3.7 16.5 11.2 0.0 2.9 13.4
Somboon Advance Tech. SAT.BK 316 28.75 41.06 42.8 Not rated Dec 24.0 10.8 2.3 2.0 3.5 (2.7) (1.7) (0.9) 3.6
Sri Trang Agro-Industry STA.BK 629 15.20 13.75 (9.6) Not rated Dec 14.6 6.3 1.1 0.9 2.1 (3.4) 3.4 4.1 (1.9)
STP&I STPI.BK 464 39.00 37.09 (4.9) Not rated Dec 35.5 22.2 4.6 4.1 5.9 0.6 (2.5) 36.8 43.1
Supalai SPAL.BK 1,054 19.00 19.10 0.5 NEUTRAL Dec 12.7 11.2 3.0 2.7 17.9 12.6 0.0 3.8 18.0
SVI SVI.BK 247 3.90 6.03 54.6 Not rated Dec (5.9) 13.0 6.1 3.9 7.3 2.0 0.0 10.8 12.1
Tata Steel (TH) TSTH.BK 214 0.81 1.07 32.0 Not rated Mar (4.7) (22.3) 0.5 0.5 (9.3) (15.7) 2.5 2.5 1.3
Thai Airways THAI.BK 1,460 20.70 22.50 8.7 NEUTRAL Dec (5.3) 8.8 0.7 0.7 (3.6) (10.1) 1.5 3.5 (5.9)
Thai Cane Paper TCP.BK 186 16.10 24.63 53.0 Not rated Dec 18.3 17.9 1.1 1.1 1.7 (3.8) (3.6) (4.7) 5.2
Thai Carbon Black TCB.BK 262 27.00 38.65 43.2 Not rated Dec 10.0 9.2 0.9 0.8 3.9 (2.5) 0.9 (5.3) 8.4
Thai Central Chemical TCCC.BK 416 22.00 25.27 14.8 Not rated Dec 12.7 11.0 2.4 2.3 9.1 4.1 (2.2) 20.2 41.0
Thai Plastic TPC.BK 841 29.75 48.22 62.1 Not rated Dec 13.8 10.6 1.9 1.9 4.6 (0.3) 0.0 8.2 3.5
Thai Ray on TR.BK 365 56.00 215.08 284.1 Not rated Sep 3.9 4.8 0.5 0.7 13.6 8.8 (1.3) (3.0) (5.1)
Calendarized Calendarized Share price performance
P/E (x) P/B (x) Bt term (%)
* Include the small-cap stocks in HOLT® database with market cap between US$150 mn and US$2 bn. For stocks that are Not Rated, I/B/E/S consensus forecast are used. CFROI® is a
registered trademark in the United States and other countries (excluding the United Kingdom) of Credit Suisse or its subsidiaries or affiliates.
* Companies in bold and italic indicate constituents of Credit Suisse Thailand Small Cap Index
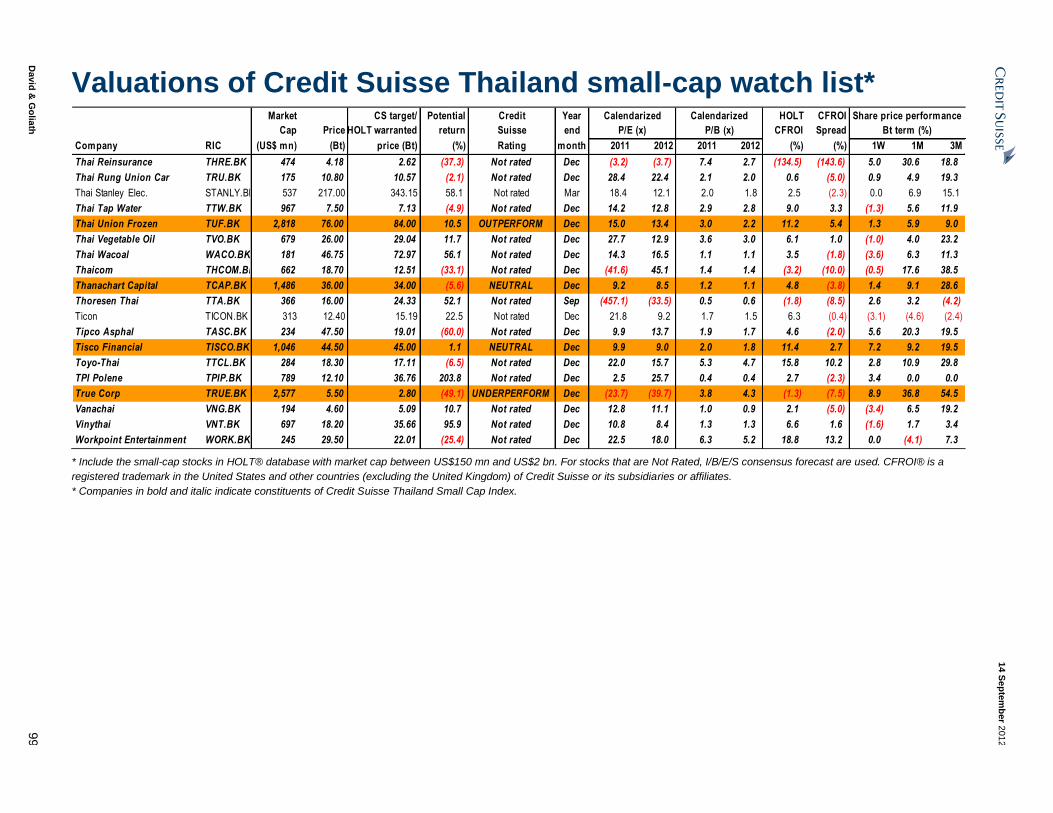
14 S
ep
tem
ber 2
01
2
David
& G
olia
th
99
Valuations of Credit Suisse Thailand small-cap watch list*
Market CS target/ Potential Credit Year HOLT CFROI
Cap Price HOLT warranted return Suisse end CFROI Spread
Company RIC (US$ mn) (Bt) price (Bt) (%) Rating month 2011 2012 2011 2012 (%) (%) 1W 1M 3M
Thai Reinsurance THRE.BK 474 4.18 2.62 (37.3) Not rated Dec (3.2) (3.7) 7.4 2.7 (134.5) (143.6) 5.0 30.6 18.8
Thai Rung Union Car TRU.BK 175 10.80 10.57 (2.1) Not rated Dec 28.4 22.4 2.1 2.0 0.6 (5.0) 0.9 4.9 19.3
Thai Stanley Elec. STANLY.BK 537 217.00 343.15 58.1 Not rated Mar 18.4 12.1 2.0 1.8 2.5 (2.3) 0.0 6.9 15.1
Thai Tap Water TTW.BK 967 7.50 7.13 (4.9) Not rated Dec 14.2 12.8 2.9 2.8 9.0 3.3 (1.3) 5.6 11.9
Thai Union Frozen TUF.BK 2,818 76.00 84.00 10.5 OUTPERFORM Dec 15.0 13.4 3.0 2.2 11.2 5.4 1.3 5.9 9.0
Thai Vegetable Oil TVO.BK 679 26.00 29.04 11.7 Not rated Dec 27.7 12.9 3.6 3.0 6.1 1.0 (1.0) 4.0 23.2
Thai Wacoal WACO.BK 181 46.75 72.97 56.1 Not rated Dec 14.3 16.5 1.1 1.1 3.5 (1.8) (3.6) 6.3 11.3
Thaicom THCOM.BK 662 18.70 12.51 (33.1) Not rated Dec (41.6) 45.1 1.4 1.4 (3.2) (10.0) (0.5) 17.6 38.5
Thanachart Capital TCAP.BK 1,486 36.00 34.00 (5.6) NEUTRAL Dec 9.2 8.5 1.2 1.1 4.8 (3.8) 1.4 9.1 28.6
Thoresen Thai TTA.BK 366 16.00 24.33 52.1 Not rated Sep (457.1) (33.5) 0.5 0.6 (1.8) (8.5) 2.6 3.2 (4.2)
Ticon TICON.BK 313 12.40 15.19 22.5 Not rated Dec 21.8 9.2 1.7 1.5 6.3 (0.4) (3.1) (4.6) (2.4)
Tipco Asphal TASC.BK 234 47.50 19.01 (60.0) Not rated Dec 9.9 13.7 1.9 1.7 4.6 (2.0) 5.6 20.3 19.5
Tisco Financial TISCO.BK 1,046 44.50 45.00 1.1 NEUTRAL Dec 9.9 9.0 2.0 1.8 11.4 2.7 7.2 9.2 19.5
Toyo-Thai TTCL.BK 284 18.30 17.11 (6.5) Not rated Dec 22.0 15.7 5.3 4.7 15.8 10.2 2.8 10.9 29.8
TPI Polene TPIP.BK 789 12.10 36.76 203.8 Not rated Dec 2.5 25.7 0.4 0.4 2.7 (2.3) 3.4 0.0 0.0
True Corp TRUE.BK 2,577 5.50 2.80 (49.1) UNDERPERFORM Dec (23.7) (39.7) 3.8 4.3 (1.3) (7.5) 8.9 36.8 54.5
Vanachai VNG.BK 194 4.60 5.09 10.7 Not rated Dec 12.8 11.1 1.0 0.9 2.1 (5.0) (3.4) 6.5 19.2
Vinythai VNT.BK 697 18.20 35.66 95.9 Not rated Dec 10.8 8.4 1.3 1.3 6.6 1.6 (1.6) 1.7 3.4
Workpoint Entertainment WORK.BK 245 29.50 22.01 (25.4) Not rated Dec 22.5 18.0 6.3 5.2 18.8 13.2 0.0 (4.1) 7.3
Calendarized Calendarized Share price performance
P/E (x) P/B (x) Bt term (%)
* Include the small-cap stocks in HOLT® database with market cap between US$150 mn and US$2 bn. For stocks that are Not Rated, I/B/E/S consensus forecast are used. CFROI® is a
registered trademark in the United States and other countries (excluding the United Kingdom) of Credit Suisse or its subsidiaries or affiliates.
* Companies in bold and italic indicate constituents of Credit Suisse Thailand Small Cap Index.

14 S
ep
tem
ber 2
01
2
David
& G
olia
th
10
0
Thailand – Screening Absolute price performance - top & bottom 10 companies Absolute price performance - top & bottom 10 companies Absolute price performance - top & bottom 10 companies
Price 1W return Price 1M return Price 3M return Company RIC (Bt) (%) Company RIC (Bt) (%) Company RIC (Bt) (%)
Winners Winners Winners Loxley LOXL.BK 4.40 12.8 STP&I STPI.BK 39.00 36.8 Serm Suk SSC.BK 164.00 81.2 Sahaviriya Steel SSI.BK 0.59 11.3 True Corp TRUE.BK 5.50 36.8 Ramkhamhaeng Hospital RAM.BK 1,860.00 77.8 Saha Pathanapibul SPC.BK 53.25 9.2 AE. Thana Sinsap AEON.BK 46.75 33.6 Oishi OISH.BK 195.50 62.9 True Corp TRUE.BK 5.50 8.9 Thai Reinsurance THRE.BK 4.18 30.6 AE. Thana Sinsap AEON.BK 46.75 54.5 Tisco Financial TISCO.BK 44.50 7.2 Saha Pathanapibul SPC.BK 53.25 27.5 True Corp TRUE.BK 5.50 54.5 G J Steel GJS.BK 0.15 7.1 MBK MBK.BK 116.00 24.7 Saha Pathanapibul SPC.BK 53.25 43.9 Electricity Generating EGCO.BK 125.00 5.9 A.J. Plast AJ.BK 14.20 23.5 STP&I STPI.BK 39.00 43.1 Siam City Cement SCCC.BK 364.00 5.8 Loxley LOXL.BK 4.40 22.2 Thai Central Chemical TCCC.BK 22.00 41.0 Samart Telecoms SAMT.BK 14.70 5.8 Tipco Asphal TASC.BK 47.50 20.3 Siam Global House GLOBAL.BK 14.50 39.4 Tipco Asphal TASC.BK 47.50 5.6 Berli Jucker BJC.BK 49.00 20.2 Central Plaza Hotel CENT.BK 17.10 39.0
Losers Losers Losers OHTL OHTL.BK 460.00 (6.9) GMM Grammy GRAM.BK 20.70 (11.5) GFPT GFPT.BK 7.35 (23.8) Rojana Industrial Park ROJNA.BK 9.30 (5.6) Precious Shipping PSL.BK 13.20 (9.0) GMM Grammy GRAM.BK 20.70 (22.6) Thai Wacoal WACO.BK 46.75 (3.6) Laguna Resorts & Hotels LRH.BK 36.25 (8.2) Bank Thai CIMBT.BK 1.77 (16.9) Thai Cane Paper TCP.BK 16.10 (3.6) GFPT GFPT.BK 7.35 (6.4) Sahaviriya Steel SSI.BK 0.59 (13.2) Vanachai VNG.BK 4.60 (3.4) Sahaviriya Steel SSI.BK 0.59 (6.3) Precious Shipping PSL.BK 13.20 (11.4) Ticon TICON.BK 12.40 (3.1) Thai Carbon Black TCB.BK 27.00 (5.3) Laguna Resorts & Hotels LRH.BK 36.25 (8.2) Diamond Roofing Tiles DRT.BK 6.85 (2.8) SCB Life Insurance SCBLIF.BK 704.00 (4.9) Maybank Kim Eng Secs. MBKET.BK 13.90 (6.1) Jasmine JAS.BK 3.82 (2.6) Thai Cane Paper TCP.BK 16.10 (4.7) Thai Airways THAI.BK 20.70 (5.9) STP&I STPI.BK 39.00 (2.5) Ticon TICON.BK 12.40 (4.6) Thai Rayon TR.BK 56.00 (5.1) GMM Grammy GRAM.BK 20.70 (2.4) Property Perfect PF.BK 1.07 (4.5) Bangkok Life BLA.BK 44.75 (4.8)
Price-to-earnings - most & least expensive 10 companies Price-to-book - most & least expensive 10 companies CFROI® Spread - top & bottom 10 companies
Price 12 P/E Price 12 P/B Price CFROI® Spread Company RIC (Bt) (x) Company RIC (Bt) (x) Company RIC (Bt) (%)
Winners Winners Winners Thai Rayon TR.BK 56.00 4.8 TPI Polene TPIP.BK 12.10 0.4 Lanna Resources LANN.BK 25.00 21.6 Property Perfect PF.BK 1.07 5.6 Laguna Resorts & Hotels LRH.BK 36.25 0.4 Bangkok Life BLA.BK 44.75 18.1 Sri Trang Agro-Industry STA.BK 15.20 6.3 Regional Containers RCL.BK 6.85 0.5 LPN Development LPN.BK 18.00 18.0 Polyplex PTL.BK 14.60 7.4 Tata Steel (TH) TSTH.BK 0.81 0.5 SCB Life Insurance SCBLIF.BK 704.00 17.9 Lanna Resources LANN.BK 25.00 7.9 G J Steel GJS.BK 0.15 0.5 Workpoint Entertainment WORK.BK 29.50 13.2 Cal-Comp CCET.BK 2.76 8.2 Property Perfect PF.BK 1.07 0.6 Supalai SPAL.BK 19.00 12.6 SC Asset SC.BK 16.80 8.3 Thoresen Thai TTA.BK 16.00 0.6 Home Product Center HMPR.BK 12.80 11.8 Bangchak Petroleum BCP.BK 23.50 8.4 Thai Airways THAI.BK 20.70 0.7 SNC Former SNC.BK 27.00 11.2 Vinythai VNT.BK 18.20 8.4 Sahaviriya Steel SSI.BK 0.59 0.7 Dynasty Ceramic DCC.BK 50.25 10.4 Thanachart Capital TCAP.BK 36.00 8.5 Cal-Comp CCET.BK 2.76 0.7 Toyo-Thai TTCL.BK 18.30 10.2 Losers Losers Losers Serm Suk SSC.BK 164.00 1,245.4 Oishi OISH.BK 195.50 9.9 Thai Reinsurance THRE.BK 4.18 (143.6) Samart I-Mobile SIM.BK 2.08 95.2 S&P Syndicate SNP.BK 169.00 8.6 Regional Containers RCL.BK 6.85 (17.2) Precious Shipping PSL.BK 13.20 70.2 Home Product Center HMPR.BK 12.80 8.0 Sahaviriya Steel SSI.BK 0.59 (15.9) OHTL OHTL.BK 460.00 55.1 Dynasty Ceramic DCC.BK 50.25 7.5 Tata Steel (TH) TSTH.BK 0.81 (15.7) Erawan ERW.BK 2.80 50.9 Robinson Dept. Store ROBI.BK 63.75 7.2 AE. Thana Sinsap AEON.BK 46.75 (14.2) Thaicom THCOM.BK 18.70 45.1 Bumrungrad Hospital BH.BK 80.25 6.5 Bangkok Metro BMCL.BK 0.66 (11.8) Siam Global House GLOBAL.BK 14.50 41.1 Ramkhamhaeng Hospital RAM.BK 1,860.00 6.1 Thai Airways THAI.BK 20.70 (10.1) A.J. Plast AJ.BK 14.20 38.4 OHTL OHTL.BK 460.00 5.8 Thaicom THCOM.BK 18.70 (10.0) GMM Grammy GRAM.BK 20.70 36.6 Berli Jucker BJC.BK 49.00 5.8 POSCO Thainox INOX.BK 1.89 (9.5) CH Karnchang CK.BK 7.80 36.1 Bangkok Chain Hospital BCH.BK 9.70 5.4 Italian-Thai Dev. ITD.BK 3.66 (8.8)
* For stocks that are not rated, I/B/E/S consensus forecast numbers are used. CFROI® Spread is the difference between CFROI® and market implied discount rate. A larger number indicates
that more value is created by a company

14 September 2012
David & Goliath 101
Companies Mentioned (Price as of 13 Sep 12)
ACE Hardware Indonesia (ACES.JK, Rp6,250.00, NEUTRAL, TP Rp5,500.00) ASM Pacific Tech. (0522.HK, HK$92.00, UNDERPERFORM, TP HK$73.50) Bekasi Fajar Industrial Estate (BEST.JK, Rp660.00, OUTPERFORM [V], TP Rp770.00) C C Land Holdings (1224.HK, HK$1.65, NOT RATED) CDL Hospitality Trusts (CDLT.SI, S$1.98, OUTPERFORM, TP S$2.32) Central China Real Estate (0832.HK, HK$1.89, NOT RATED) China Molybdenum Co Ltd. (3993.HK, HK$3.43) China Overseas Grand Oceans Group (0081.HK, HK$7.95, NOT RATED) China Tianyi Holdings (0756.HK, HK$1.18, NOT RATED) Chow Sang Sang (0116.HK, HK$17.06, OUTPERFORM, TP HK$20.00) E Ink Holdings, Inc. (8069.TWO, NT$32.40, NEUTRAL [V], TP NT$35.00) Emami (EMAM.BO, Rs507.50, OUTPERFORM, TP Rs619.00) Green Dragon Gas (GDG.L, $4.10, OUTPERFORM [V], TP $11.70) Gujarat State Petronet Ltd. (GSPT.BO, Rs78.45, OUTPERFORM, TP Rs110.00) Haitian International Holdings Ltd. (1882.HK, HK$7.89, UNDERPERFORM, TP HK$6.50) Hexaware Technologies (HEXT.BO, Rs137.55, OUTPERFORM, TP Rs160.00) Hiwin (2049.TW, NT$212.00, UNDERPERFORM [V], TP NT$195.00) Kawasan Industri Jababeka (KIJA.JK, Rp200.00, OUTPERFORM, TP Rp250.00) KWG Property Holding Ltd. (1813.HK, HK$4.50, NEUTRAL [V], TP HK$4.70) Lee & Man Paper (2314.HK, HK$3.20, UNDERPERFORM [V], TP HK$2.75) Lextar (3698.TW, NT$30.65, NEUTRAL [V], TP NT$37.00) Lippo Cikarang (LPCK.JK, Rp3,750.00, OUTPERFORM [V], TP Rp4,500.00) Lonking Holdings Ltd. (3339.HK, HK$1.34, NEUTRAL [V], TP HK$1.80) Luk Fook Holdings International (0590.HK, HK$22.45, NEUTRAL [V], TP HK$23.30) Major Cineplex Group Pcl (MAJO.BK, Bt18.10, NEUTRAL, TP Bt20.00) Mitra Adiperkasa (MAPI.JK, Rp7,100.00, OUTPERFORM [V], TP Rp8,400.00) Multi Commodities Exchange of India (MCEI.BO, Rs1,255.10, OUTPERFORM [V], TP Rs1,450.00) Novatek Microelectronics Corp Ltd. (3034.TW, NT$103.50, OUTPERFORM, TP NT$118.00) Pacific Basin Shipping Ltd. (2343.HK, HK$3.84, UNDERPERFORM [V], TP HK$3.40) Pacific Textiles Group (1382.HK, HK$5.01, OUTPERFORM, TP HK$5.60) Semiconductor Manufacturing International Corp. (0981.HK, HK$0.30, NEUTRAL [V], TP HK$0.41) Shinsegae Co. (004170.KS, W217,000, NEUTRAL, TP W250,000) Skyworth Digital (0751.HK, HK$3.30, OUTPERFORM [V], TP HK$5.70) SP Setia (SETI.KL, RM3.78, NEUTRAL, TP RM3.60) Spreadtrum Communication (SPRD.OQ, $20.27, OUTPERFORM [V], TP $26.50) Sunevision Holdings Ltd. (8008.HK, HK$1.64) Surya Semesta Internusa (SSIA.JK, Rp1,260.00, OUTPERFORM [V], TP Rp1,580.00) Taiwan Surface Mounting Technology (6278.TW, NT$49.80, NEUTRAL, TP NT$54.00) Techtronic Inds. (0669.HK, HK$12.68, NEUTRAL, TP HK$9.65) Texwinca Holdings (0321.HK, HK$5.33, NEUTRAL, TP HK$5.50) Varitronix International (0710.HK, HK$2.66, OUTPERFORM, TP HK$3.65) VTech Holdings (0303.HK, HK$94.05, NEUTRAL, TP HK$84.00) Yue Yuen Industrial Holding (0551.HK, HK$24.60, NEUTRAL, TP HK$25.70) Liping Zhang, an employee of Credit Suisse, is an independent non-executive director of Zhejiang Expressway.
Disclosure Appendix Important Global Disclosures
The analysts identified in this report each certify, with respect to the companies or securities that the individual analyzes, that (1) the views expressed in this report accurately reflect his or her personal views about all of the subject companies and securities and (2) no part of his or her compensation was, is or will be directly or indirectly related to the specific recommendations or views expressed in this report. The analyst(s) responsible for preparing this research report received compensation that is based upon various factors including Credit Suisse's total revenues, a portion of which are generated by Credit Suisse's investment banking activities.
Analysts’ stock ratings are defined as follows: Outperform (O): The stock’s total return is expected to outperform the relevant benchmark* by at least 10-15% (or more, depending on perceived risk) over the next 12 months. Neutral (N): The stock’s total return is expected to be in line with the relevant benchmark* (range of ±10-15%) over the next 12 months. Underperform (U): The stock’s total return is expected to underperform the relevant benchmark* by 10-15% or more over the next 12 months. *Relevant benchmark by region: As of 29th May 2009, Australia, New Zealand, U.S. and Canadian ratings are based on (1) a stock’s absolute total return potential to its current share price and (2) the relative attractiveness of a stock’s total return potential within an analyst’s coverage universe**, with Outperforms representing the most attractive, Neutrals the less attractive, and Underperforms the least attractive investment opportunities.

14 September 2012
David & Goliath 102
Some U.S. and Canadian ratings may fall outside the absolute total return ranges defined above, depending on market conditions and industry factors. For Latin American, Japanese, and non-Japan Asia stocks, ratings are based on a stock’s total return relative to the average total return of the relevant country or regional benchmark; for European stocks, ratings are based on a stock’s total return relative to the analyst's coverage universe**. For Australian and New Zealand stocks, 12-month rolling yield is incorporated in the absolute total return calculation and a 15% and a 7.5% threshold replace the 10-15% level in the Outperform and Underperform stock rating definitions, respectively. The 15% and 7.5% thresholds replace the +10-15% and -10-15% levels in the Neutral stock rating definition, respectively. **An analyst's coverage universe consists of all companies covered by the analyst within the relevant sector. Restricted (R): In certain circumstances, Credit Suisse policy and/or applicable law and regulations preclude certain types of communications, including an investment recommendation, during the course of Credit Suisse's engagement in an investment banking transaction and in certain other circumstances.
Volatility Indicator [V]: A stock is defined as volatile if the stock price has moved up or down by 20% or more in a month in at least 8 of the past 24 months or the analyst expects significant volatility going forward.
Analysts’ coverage universe weightings are distinct from analysts’ stock ratings and are based on the expected performance of an analyst’s coverage universe* versus the relevant broad market benchmark**: Overweight: Industry expected to outperform the relevant broad market benchmark over the next 12 months. Market Weight: Industry expected to perform in-line with the relevant broad market benchmark over the next 12 months. Underweight: Industry expected to underperform the relevant broad market benchmark over the next 12 months. *An analyst’s coverage universe consists of all companies covered by the analyst within the relevant sector. **The broad market benchmark is based on the expected return of the local market index (e.g., the S&P 500 in the U.S.) over the next 12 months.
Credit Suisse’s distribution of stock ratings (and banking clients) is:
Global Ratings Distribution Outperform/Buy* 45% (52% banking clients) Neutral/Hold* 42% (49% banking clients) Underperform/Sell* 11% (40% banking clients) Restricted 2%
*For purposes of the NYSE and NASD ratings distribution disclosure requirements, our stock ratings of Outperform, Neutral, and Underperform most closely correspond to Buy, Hold, and Sell, respectively; however, the meanings are not the same, as our stock ratings are determined on a relative basis. (Please refer to definitions above.) An investor's decision to buy or sell a security should be based on investment objectives, current holdings, and other individual factors.
Credit Suisse’s policy is to update research reports as it deems appropriate, based on developments with the subject company, the sector or the market that may have a material impact on the research views or opinions stated herein.
Credit Suisse's policy is only to publish investment research that is impartial, independent, clear, fair and not misleading. For more detail please refer to Credit Suisse's Policies for Managing Conflicts of Interest in connection with Investment Research: http://www.csfb.com/research-and-analytics/disclaimer/managing_conflicts_disclaimer.html
Credit Suisse does not provide any tax advice. Any statement herein regarding any US federal tax is not intended or written to be used, and cannot be used, by any taxpayer for the purposes of avoiding any penalties.
Important Regional Disclosures
Singapore recipients should contact a Singapore financial adviser for any matters arising from this research report.
Restrictions on certain Canadian securities are indicated by the following abbreviations: NVS--Non-Voting shares; RVS--Restricted Voting Shares; SVS--Subordinate Voting Shares. Individuals receiving this report from a Canadian investment dealer that is not affiliated with Credit Suisse should be advised that this report may not contain regulatory disclosures the non-affiliated Canadian investment dealer would be required to make if this were its own report. For Credit Suisse Securities (Canada), Inc.'s policies and procedures regarding the dissemination of equity research, please visit http://www.csfb.com/legal_terms/canada_research_policy.shtml.
As of the date of this report, Credit Suisse acts as a market maker or liquidity provider in the equities securities that are the subject of this report.
Principal is not guaranteed in the case of equities because equity prices are variable.
Commission is the commission rate or the amount agreed with a customer when setting up an account or at anytime after that.
For Thai listed companies mentioned in this report, the independent 2010 Corporate Governance Report survey results published by the Thai Institute of Directors Association are being disclosed pursuant to the policy of the Office of the Securities and Exchange Commission: Major Cineplex Group Pcl(Very Good). Taiwanese Disclosures: This research report is for reference only. Investors should carefully consider their own investment risk. Investment results are the responsibility of the individual investor. Reports may not be reprinted without permission of CS. Reports written by Taiwan-based analysts on non-Taiwan listed companies are not considered recommendations to buy or sell securities under Taiwan Stock Exchange Operational Regulations Governing Securities Firms Recommending Trades in Securities to Customers.
To the extent this is a report authored in whole or in part by a non-U.S. analyst and is made available in the U.S., the following are important disclosures regarding any non-U.S. analyst contributors:

14 September 2012
David & Goliath 103
The non-U.S. research analysts listed below (if any) are not registered/qualified as research analysts with FINRA. The non-U.S. research analysts listed below may not be associated persons of CSSU and therefore may not be subject to the NASD Rule 2711 and NYSE Rule 472 restrictions on communications with a subject company, public appearances and trading securities held by a research analyst account. • Kenny Lau, CFA, non-U.S. analyst, is a research analyst employed by Credit Suisse (Hong Kong) Limited. • Eva Wang, non-U.S. analyst, is a research analyst employed by Credit Suisse (Hong Kong) Limited. • Anantha Narayan, non-U.S. analyst, is a research analyst employed by Credit Suisse Securities (India) Private Limited. • Teddy Oetomo, non-U.S. analyst, is a research analyst employed by PT Credit Suisse Securities Indonesia. • Minseok Sinn, non-U.S. analyst, is a research analyst employed by Credit Suisse Securities (Europe) Limited, Seoul Branch. • Loke Foong Wai, non-U.S. analyst, is a research analyst employed by Credit Suisse Securities (Malaysia) Sdn Bhd.. • Su Tye Chua, non-U.S. analyst, is a research analyst employed by Credit Suisse AG, Singapore Branch. • Chai Techakumpuch, non-U.S. analyst, is a research analyst employed by Credit Suisse Securities (Thailand) Limited.
Important Credit Suisse HOLT Disclosures
With respect to the analysis in this report based on the Credit Suisse HOLT methodology, Credit Suisse certifies that (1) the views expressed in this report accurately reflect the Credit Suisse HOLT methodology and (2) no part of the Firm’s compensation was, is, or will be directly related to the specific views disclosed in this report.
The Credit Suisse HOLT methodology does not assign ratings to a security. It is an analytical tool that involves use of a set of proprietary quantitative algorithms and warranted value calculations, collectively called the Credit Suisse HOLT valuation model, that are consistently applied to all the companies included in its database. Third-party data (including consensus earnings estimates) are systematically translated into a number of default variables and incorporated into the algorithms available in the Credit Suisse HOLT valuation model. The source financial statement, pricing, and earnings data provided by outside data vendors are subject to quality control and may also be adjusted to more closely measure the underlying economics of firm performance. These adjustments provide consistency when analyzing a single company across time, or analyzing multiple companies across industries or national borders. The default scenario that is produced by the Credit Suisse HOLT valuation model establishes the baseline valuation for a security, and a user then may adjust the default variables to produce alternative scenarios, any of which could occur. Additional information about the Credit Suisse HOLT methodology is available on request. The Credit Suisse HOLT methodology does not assign a price target to a security. The default scenario that is produced by the Credit Suisse HOLT valuation model establishes a warranted price for a security, and as the third-party data are updated, the warranted price may also change. The default variables may also be adjusted to produce alternative warranted prices, any of which could occur. CFROI®, HOLT, HOLTfolio, HOLTSelect, ValueSearch, AggreGator, Signal Flag and “Powered by HOLT” are trademarks or service marks or registered trademarks or registered service marks of Credit Suisse or its affiliates in the United States and other countries. HOLT is a corporate performance and valuation advisory service of Credit Suisse. Additional information about the Credit Suisse HOLT methodology is available on request.
Important MSCI Disclosures
The MSCI sourced information is the exclusive property of Morgan Stanley Capital International Inc. (MSCI). Without prior written permission of MSCI, this information and any other MSCI intellectual property may not be reproduced, re-disseminated or used to create any financial products, including any indices. This information is provided on an “as is” basis. The user assumes the entire risk of any use made of this information. MSCI, its affiliates and any third party involved in, or related to, computing or compiling the information hereby expressly disclaim all warranties of originality, accuracy, completeness, merchantability or fitness for a particular purpose with respect to any of this information. Without limiting any of the foregoing, in no event shall MSCI, any of its affiliates or any third party involved in, or related to, computing or compiling the information have any liability for any damages of any kind. MSCI, Morgan Stanley Capital International and the MSCI indexes are services marks of MSCI and its affiliates.
The Global Industry Classification Standard (GICS) was developed by and is the exclusive property of Morgan Stanley Capital International Inc. and Standard & Poor’s. GICS is a service mark of MSCI and S&P and has been licensed for use by Credit Suisse.
For Credit Suisse disclosure information on other companies mentioned in this report, please visit the website at www.credit-suisse.com/researchdisclosures or call +1 (877) 291-2683. Disclaimers continue on next page.

14 September 2012
Asia Pacific
Equity Research
DG_120914-final.doc
This report is not directed to, or intended for distribution to or use by, any person or entity who is a citizen or resident of or located in any locality, state, country or other jurisdiction where such distribution, publication, availability or use would be contrary to law or regulation or which would subject Credit Suisse AG, the Swiss bank, or its subsidiaries or its affiliates (“CS”) to any registration or licensing requirement within such jurisdiction. All material presented in this report, unless specifically indicated otherwise, is under copyright to CS. None of the material, nor its content, nor any copy of it, may be altered in any way, transmitted to, copied or distributed to any other party, without the prior express written permission of CS. All trademarks, service marks and logos used in this report are trademarks or service marks or registered trademarks or service marks of CS or its affiliates.
The information, tools and material presented in this report are provided to you for information purposes only and are not to be used or considered as an offer or the solicitation of an offer to sell or to buy or subscribe for securities or other financial instruments. CS may not have taken any steps to ensure that the securities referred to in this report are suitable for any particular investor. CS will not treat recipients as its customers by virtue of their receiving the report. The investments or services contained or referred to in this report may not be suitable for you and it is recommended that you consult an independent investment advisor if you are in doubt about such investments or investment services. Nothing in this report constitutes investment, legal, accounting or tax advice or a representation that any investment or strategy is suitable or appropriate to your individual circumstances or otherwise constitutes a personal recommendation to you. CS does not offer advice on the tax consequences of investment and you are advised to contact an independent tax adviser. Please note in particular that the bases and levels of taxation may change. CS believes the information and opinions in the Disclosure Appendix of this report are accurate and complete. Information and opinions presented in the other sections of the report were obtained or derived from sources CS believes are reliable, but CS makes no representations as to their accuracy or completeness. Additional information is available upon request. CS accepts no liability for loss arising from the use of the material presented in this report, except that this exclusion of liability does not apply to the extent that liability arises under specific statutes or regulations applicable to CS. This report is not to be relied upon in substitution for the exercise of independent judgment. CS may have issued, and may in the future issue, a trading call regarding this security. Trading calls are short term trading opportunities based on market events and catalysts, while stock ratings reflect investment recommendations based on expected total return over a 12-month period as defined in the disclosure section. Because trading calls and stock ratings reflect different assumptions and analytical methods, trading calls may differ directionally from the stock rating. In addition, CS may have issued, and may in the future issue, other reports that are inconsistent with, and reach different conclusions from, the information presented in this report. Those reports reflect the different assumptions, views and analytical methods of the analysts who prepared them and CS is under no obligation to ensure that such other reports are brought to the attention of any recipient of this report. CS is involved in many businesses that relate to companies mentioned in this report. These businesses include specialized trading, risk arbitrage, market making, and other proprietary trading. Past performance should not be taken as an indication or guarantee of future performance, and no representation or warranty, express or implied, is made regarding future performance. Information, opinions and estimates contained in this report reflect a judgement at its original date of publication by CS and are subject to change without notice. The price, value of and income from any of the securities or financial instruments mentioned in this report can fall as well as rise. The value of securities and financial instruments is subject to exchange rate fluctuation that may have a positive or adverse effect on the price or income of such securities or financial instruments. Investors in securities such as ADR’s, the values of which are influenced by currency volatility, effectively assume this risk. Structured securities are complex instruments, typically involve a high degree of risk and are intended for sale only to sophisticated investors who are capable of understanding and assuming the risks involved. The market value of any structured security may be affected by changes in economic, financial and political factors (including, but not limited to, spot and forward interest and exchange rates), time to maturity, market conditions and volatility, and the credit quality of any issuer or reference issuer. Any investor interested in purchasing a structured product should conduct their own investigation and analysis of the product and consult with their own professional advisers as to the risks involved in making such a purchase.
Some investments discussed in this report have a high level of volatility. High volatility investments may experience sudden and large falls in their value causing losses when that investment is realised. Those losses may equal your original investment. Indeed, in the case of some investments the potential losses may exceed the amount of initial investment, in such circumstances you may be required to pay more money to support those losses. Income yields from investments may fluctuate and, in consequence, initial capital paid to make the investment may be used as part of that income yield. Some investments may not be readily realisable and it may be difficult to sell or realise those investments, similarly it may prove difficult for you to obtain reliable information about the value, or risks, to which such an investment is exposed. This report may provide the addresses of, or contain hyperlinks to, websites. Except to the extent to which the report refers to website material of CS, CS has not reviewed the linked site and takes no responsibility for the content contained therein. Such address or hyperlink (including addresses or hyperlinks to CS’s own website material) is provided solely for your convenience and information and the content of the linked site does not in any way form part of this document. Accessing such website or following such link through this report or CS’s website shall be at your own risk. This report is issued and distributed in Europe (except Switzerland) by Credit Suisse Securities (Europe) Limited, One Cabot Square, London E14 4QJ, England, which is regulated in the United Kingdom by The Financial Services Authority (“FSA”). This report is being distributed in Germany by Credit Suisse Securities (Europe) Limited Niederlassung Frankfurt am Main regulated by the Bundesanstalt fuer Finanzdienstleistungsaufsicht ("BaFin"). This report is being distributed in the United States by Credit Suisse Securities (USA) LLC ; in Switzerland by Credit Suisse AG; in Canada by Credit Suisse Securities (Canada), Inc.; in Brazil by Banco de Investimentos Credit Suisse (Brasil) S.A. or its affiliates; in Mexico by Banco Credit Suisse (México), S.A. (transactions related to the securities mentioned in this report will only be effected in compliance with applicable regulation); in Japan by Credit Suisse Securities (Japan) Limited, Financial Instrument Firm, Director-General of Kanto Local Finance Bureau (Kinsho) No. 66, a member of Japan Securities Dealers Association, The Financial Futures Association of Japan, Japan Securities Investment Advisers Association, Type II Financial Instruments Firms Association; elsewhere in Asia/Pacific by whichever of the following is the appropriately authorised entity in the relevant jurisdiction: Credit Suisse (Hong Kong) Limited, Credit Suisse Equities (Australia) Limited , Credit Suisse Securities (Thailand) Limited, Credit Suisse Securities (Malaysia) Sdn Bhd, Credit Suisse AG, Singapore Branch, Credit Suisse Securities (India) Private Limited regulated by the Securities and Exchange Board of India (registration Nos. INB230970637; INF230970637; INB010970631; INF010970631), having registered address at 9th Floor, Ceejay House,Dr.A.B. Road, Worli, Mumbai - 18, India, T- +91-22 6777 3777, Credit Suisse Securities (Europe) Limited, Seoul Branch, Credit Suisse AG, Taipei Securities Branch, PT Credit Suisse Securities Indonesia, Credit Suisse Securities (Philippines ) Inc., and elsewhere in the world by the relevant authorised affiliate of the above. Research on Taiwanese securities produced by Credit Suisse AG, Taipei Securities Branch has been prepared by a registered Senior Business Person. Research provided to residents of Malaysia is authorised by the Head of Research for Credit Suisse Securities (Malaysia) Sdn. Bhd., to whom they should direct any queries on +603 2723 2020. In jurisdictions where CS is not already registered or licensed to trade in securities, transactions will only be effected in accordance with applicable securities legislation, which will vary from jurisdiction to jurisdiction and may require that the trade be made in accordance with applicable exemptions from registration or licensing requirements. Non-U.S. customers wishing to effect a transaction should contact a CS entity in their local jurisdiction unless governing law permits otherwise. U.S. customers wishing to effect a transaction should do so only by contacting a representative at Credit Suisse Securities (USA) LLC in the U.S. Please note that this report was originally prepared and issued by CS for distribution to their market professional and institutional investor customers. Recipients who are not market professional or institutional investor customers of CS should seek the advice of their independent financial advisor prior to taking any investment decision based on this report or for any necessary explanation of its contents. This research may relate to investments or services of a person outside of the UK or to other matters which are not regulated by the FSA or in respect of which the protections of the FSA for private customers and/or the UK compensation scheme may not be available, and further details as to where this may be the case are available upon request in respect of this report. Any Nielsen Media Research material contained in this report represents Nielsen Media Research's estimates and does not represent facts. NMR has neither reviewed nor approved this report and/or any of the statements made herein. If this report is being distributed by a financial institution other than Credit Suisse AG, or its affiliates, that financial institution is solely responsible for distribution. Clients of that institution should contact that institution to effect a transaction in the securities mentioned in this report or require further information. This report does not constitute investment advice by Credit Suisse to the clients of the distributing financial institution, and neither Credit Suisse AG, its affiliates, and their respective officers, directors and employees accept any liability whatsoever for any direct or consequential loss arising from their use of this report or its content.
Copyright 2012 CREDIT SUISSE AG and/or its affiliates. All rights reserved.