#datavizinsixweeks, week 2 - viz types
TRANSCRIPT

#DataVizInSixWeeksCopyright Anne Stevens
Viz types

#DataVizInSixWeeksCopyright Anne Stevens
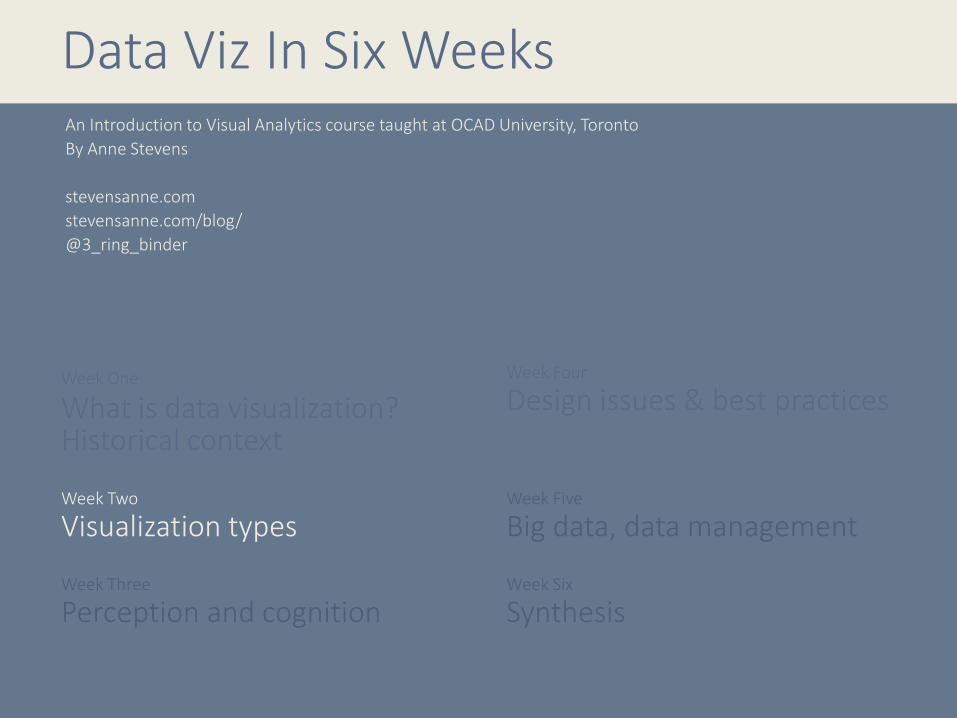
Week One
What is data visualization? Historical context
Week Four
Design issues & best practices
Week Two
Visualization typesWeek Five
Big data, data management
Week Three
Perception and cognitionWeek Six
Synthesis
Data Viz In Six WeeksAn Introduction to Visual Analytics course taught at OCAD University, Toronto
By Anne Stevens

#DataVizInSixWeeksCopyright Anne Stevens
Not all viz types are created equal
Anne Stevens

#DataVizInSixWeeksCopyright Anne Stevens
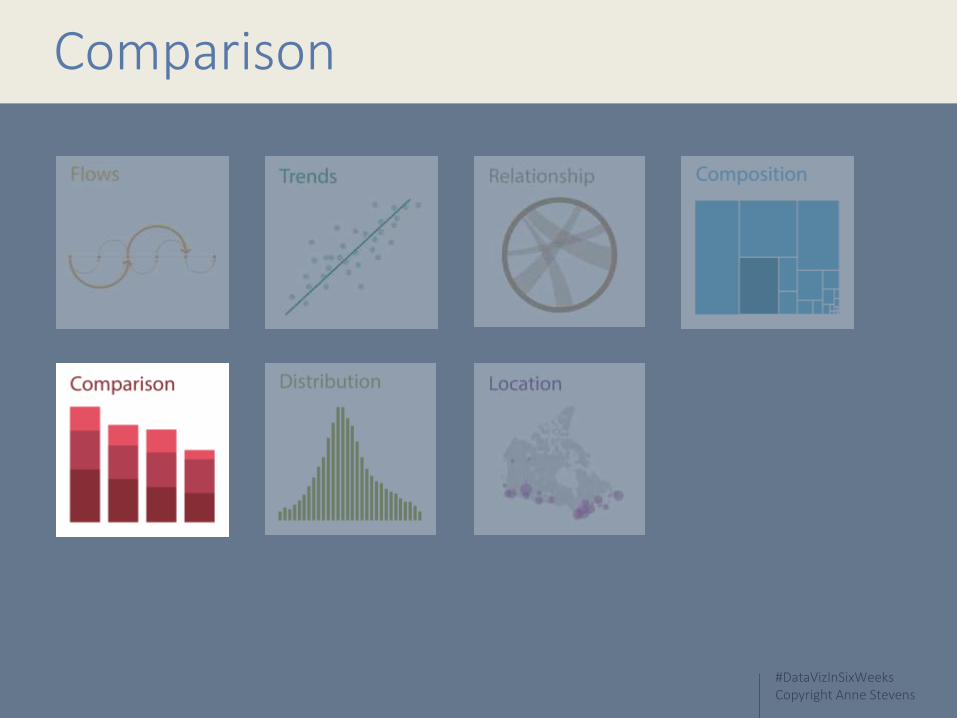
Taxonomy of viz types

#DataVizInSixWeeksCopyright Anne Stevens
Flows

#DataVizInSixWeeksCopyright Anne Stevens
Time series
Charles Minard, Napoleon’s March on Moscow. 1869http://en.wikipedia.org/wiki/File:Minard.png

#DataVizInSixWeeksCopyright Anne Stevens
Time series
Twitter StreamGraph for Kleenexthoughtgadgets.com/beyond-sentiment-analysis/

#DataVizInSixWeeksCopyright Anne Stevens
Clocks, spirals
Spiral Clock. emn.fr/z-info/spiraclock (top left). Doug McCune. Visualizing Cyclical Time. dougmccune.com/blog/2011/04/21/visualizing-cyclical-time-hour-of-day-charts/ (Top Right).. Doublas Ian Scott. Africa’s Population Growth from 0 AD to 2050 AD. visualizing.org/visualizations/africas-population-growth-0-ad-
2050-ad-combined-maddison-and-united-nations-data (Bottom Left).

#DataVizInSixWeeksCopyright Anne Stevens
Waterfall diagram
www.cimaglobal.com/

#DataVizInSixWeeksCopyright Anne Stevens
Balloon race diagram
Hans RoslingGapminder.org

#DataVizInSixWeeksCopyright Anne Stevens
Thread arc diagram
visualcomplexity.com
#DataVizInSixWeeksCopyright Anne Stevens
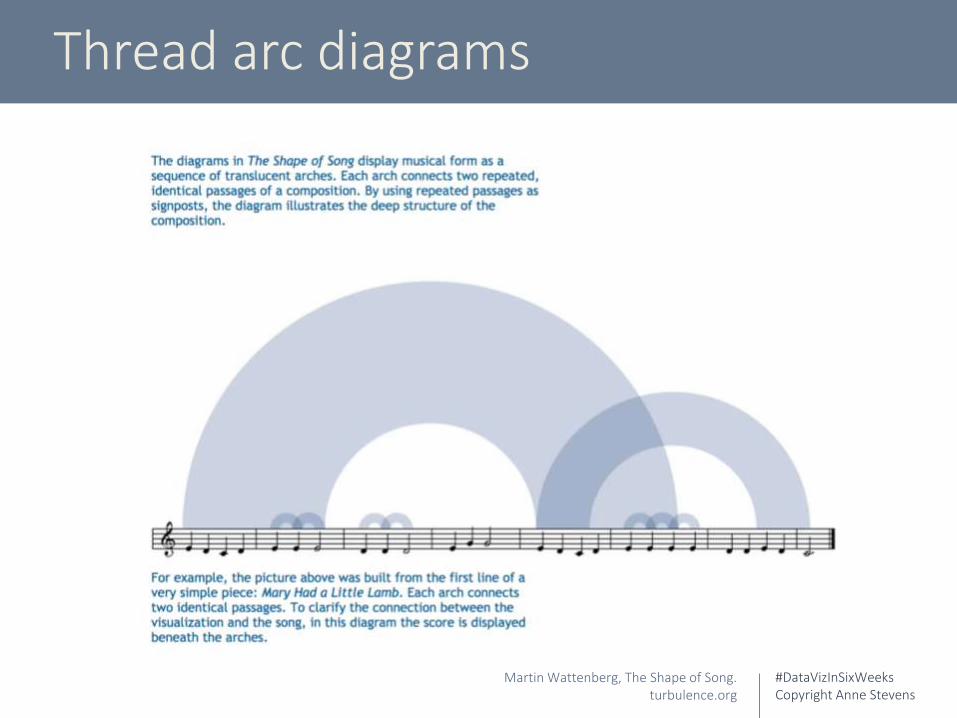
Thread arc diagrams
Martin Wattenberg, The Shape of Song.turbulence.org
#DataVizInSixWeeksCopyright Anne Stevens
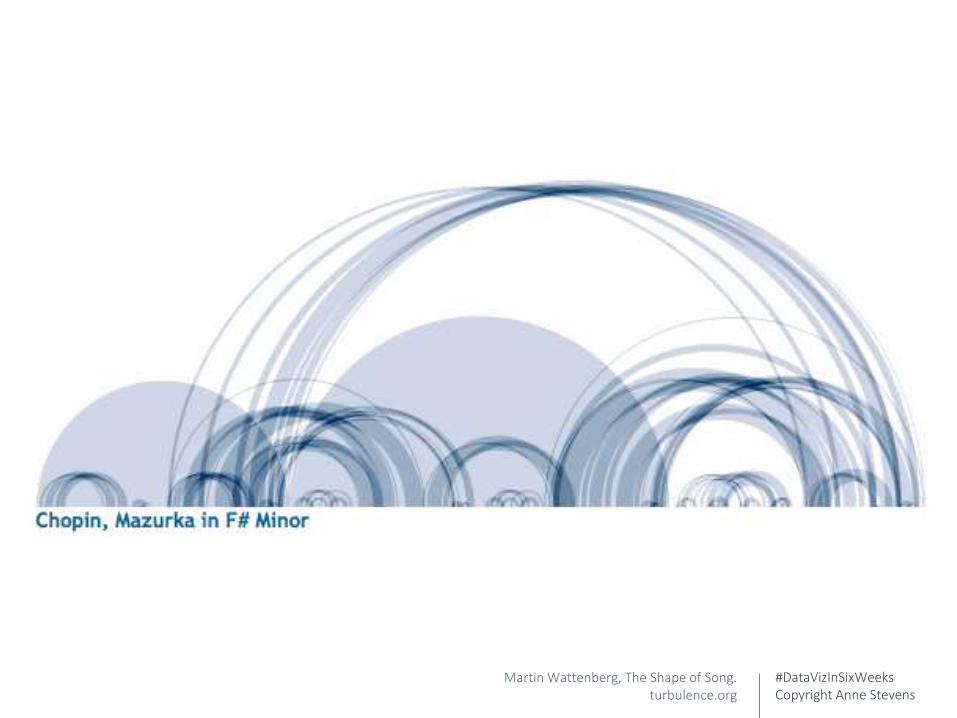
Martin Wattenberg, The Shape of Song.turbulence.org
#DataVizInSixWeeksCopyright Anne StevensCopyright Anne
Stevens 2014
#DataVizInSixWeeksCopyright Anne Stevens
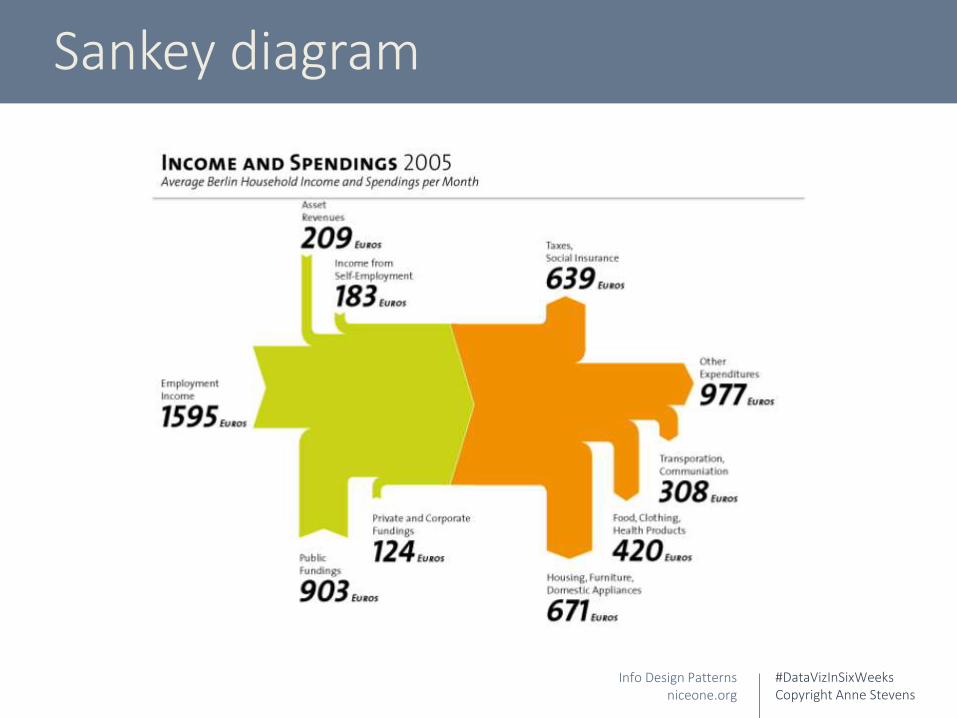
Sankey diagram
Info Design Patternsniceone.org
#DataVizInSixWeeksCopyright Anne Stevens
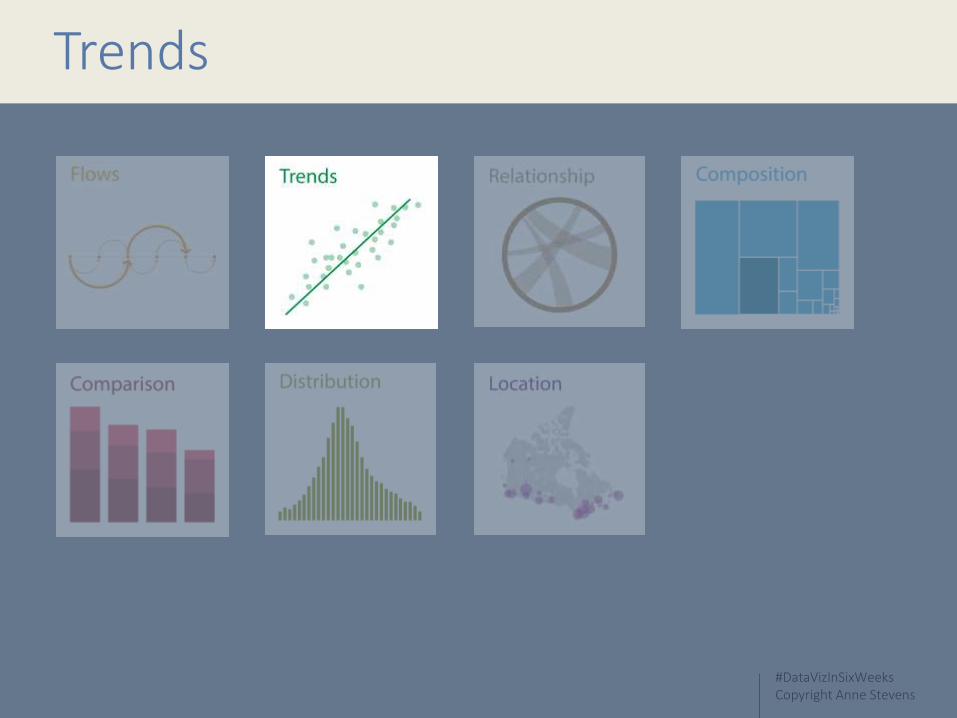
Trends

#DataVizInSixWeeksCopyright Anne Stevens
Line chart
climate4you.com/GlobalTemperatures.htm
#DataVizInSixWeeksCopyright Anne Stevens
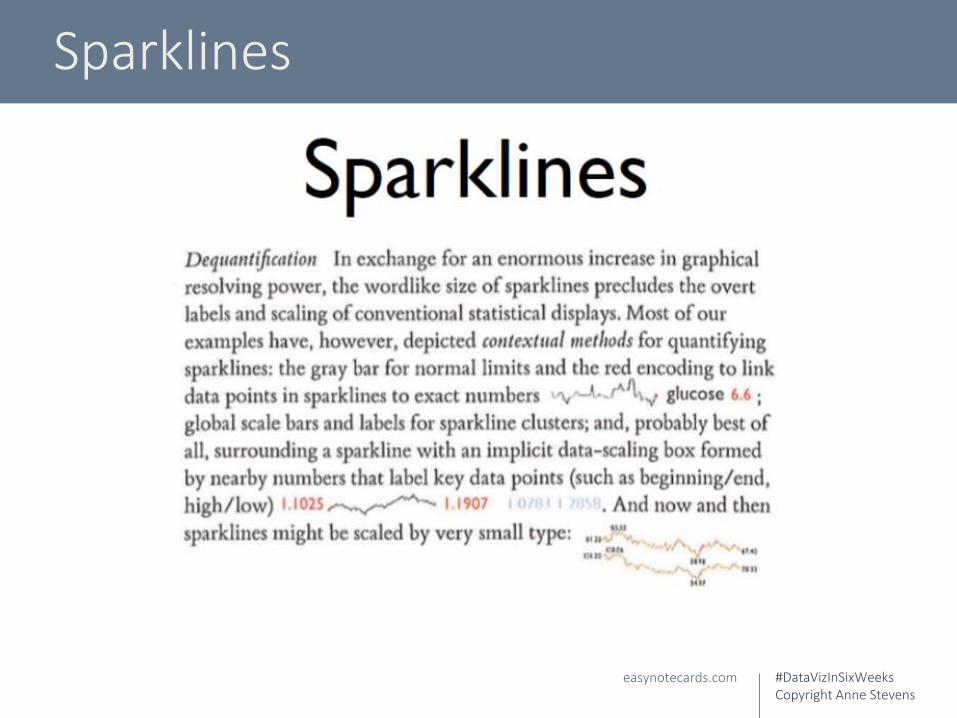
Sparklines
easynotecards.com

#DataVizInSixWeeksCopyright Anne Stevens
Sparklines: small multiples
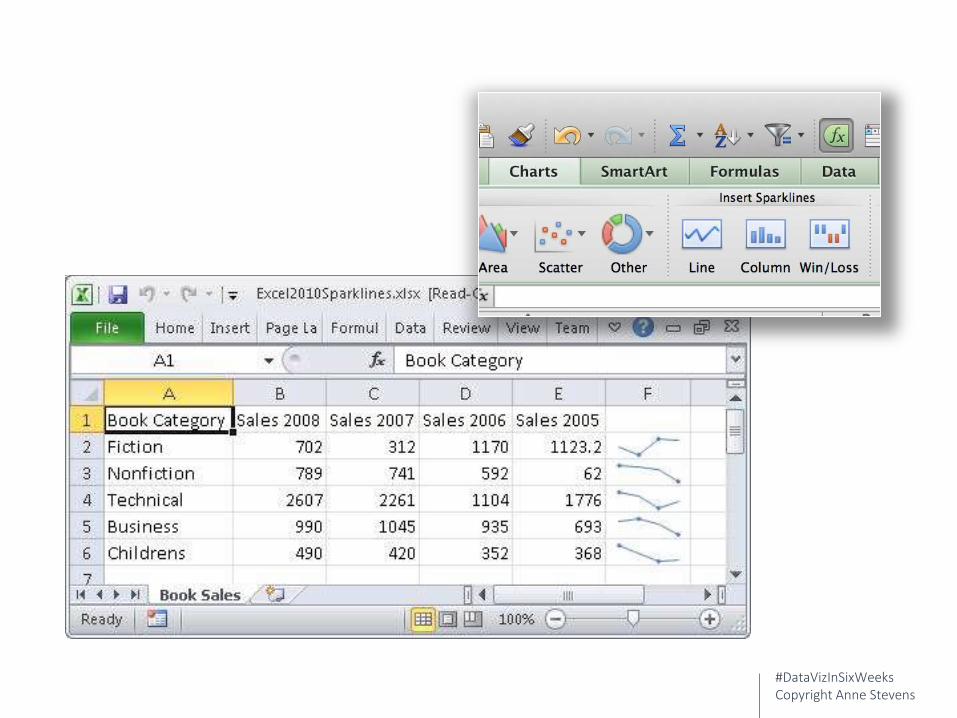
#DataVizInSixWeeksCopyright Anne Stevens
#DataVizInSixWeeksCopyright Anne Stevens
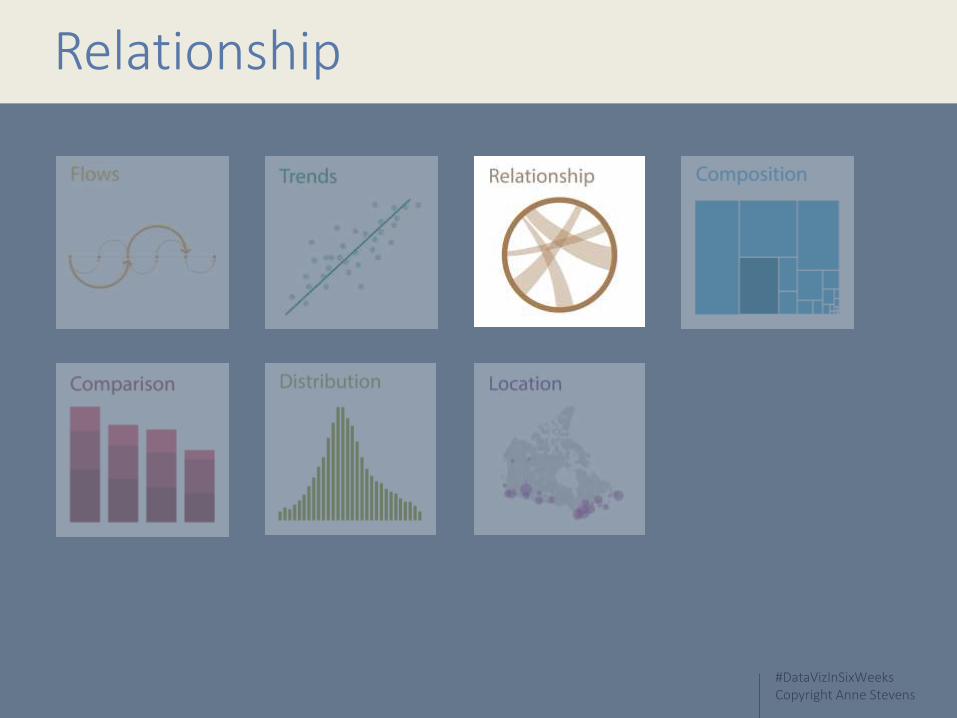
Relationship
#DataVizInSixWeeksCopyright Anne Stevens
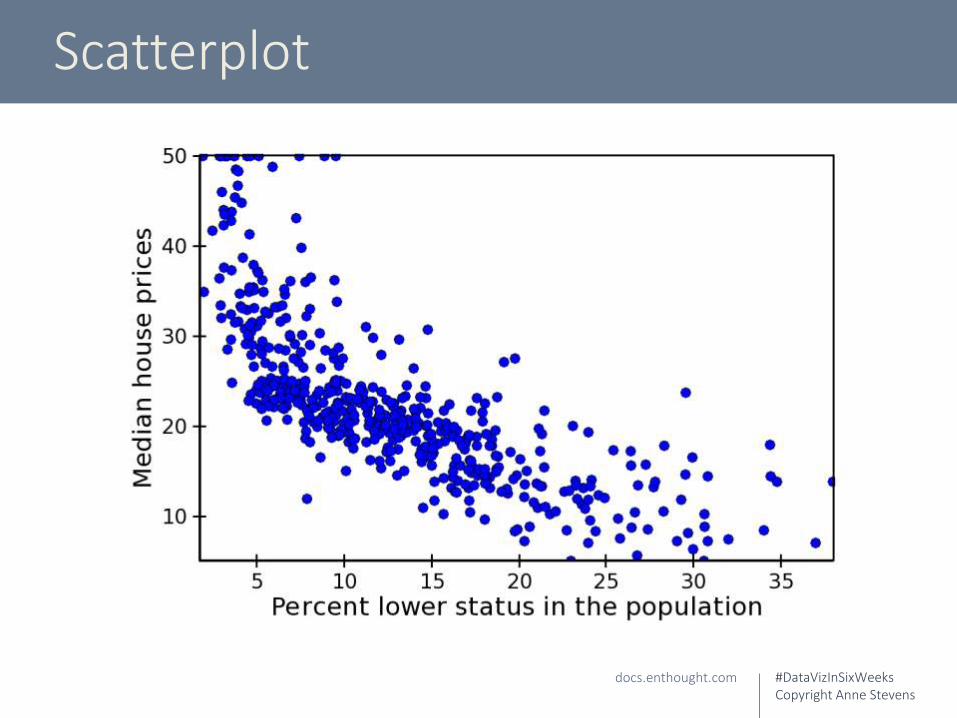
Scatterplot
docs.enthought.com

#DataVizInSixWeeksCopyright Anne Stevens
Venn diagram

#DataVizInSixWeeksCopyright Anne Stevens
Node-link diagram
c/o Fanny Chevalier

#DataVizInSixWeeksCopyright Anne Stevens
Topographic map
Tube map, 1908http://en.wikipedia.org/wiki/Tube_map

#DataVizInSixWeeksCopyright Anne Stevens
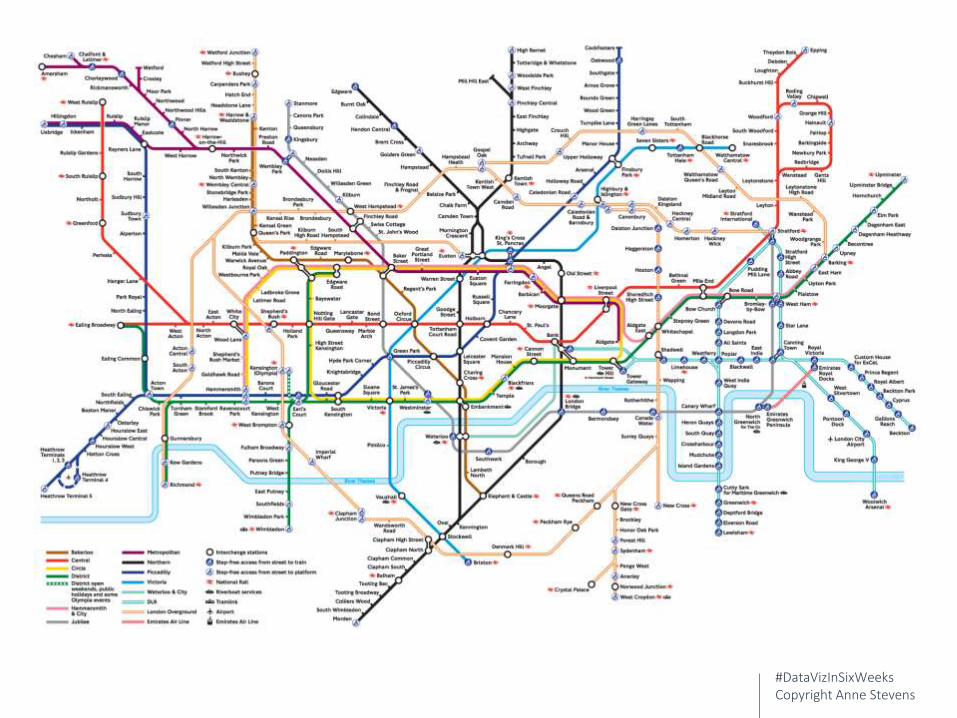
Topologic map
Harry Beck’s original Tube map, 1933http://britton.disted.camosun.bc.ca/beckmap.htm
#DataVizInSixWeeksCopyright Anne Stevens

#DataVizInSixWeeksCopyright Anne Stevens
Tree

#DataVizInSixWeeksCopyright Anne Stevens
Word tree
Word Treeopenbible.info/blog/2007/09/visualization-genesis-word-trees/

#DataVizInSixWeeksCopyright Anne Stevens
Circular tree
c/o Fanny Chevalier

#DataVizInSixWeeksCopyright Anne Stevens
Icicle tree Sunray tree
c/o Fanny Chevalier

#DataVizInSixWeeksCopyright Anne Stevens
Composition

#DataVizInSixWeeksCopyright Anne Stevens
Pie chart

#DataVizInSixWeeksCopyright Anne Stevens
Pies: the lowest form of visualization

#DataVizInSixWeeksCopyright Anne Stevens
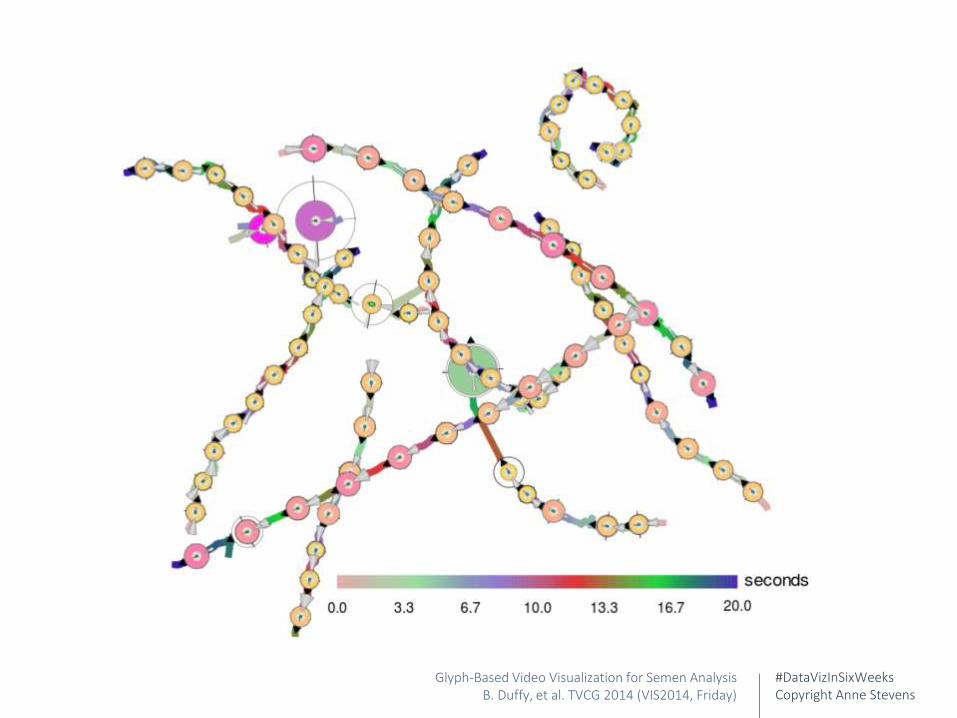
Glyph
Glyph-Based Video Visualization for Semen AnalysisB. Duffy, et al. TVCG 2014 (VIS2014, Friday)
VSL: Straight Line Velocity(radius and colour)
VAP: Average Path Velocity(radius)
VCL: Curvilinear Velocity(radius)
LIN*: VSL/VCL
WOB*: VAP/VCL
STR*: VSL/VAP
ALH: Amplitude of Lateral Head Displacement (length)
BCF: Beat-Cross Frequency (length/circumference)
MAD: Mean Angular Displacement (angle)
SLD: Straight Line Direction(shape orientation)
HP: Head Position(center position)HW: Head Width
(shape width)HL: Head Length(shape length)
HR: Head Rotation(shape orientation)
Uncertainty(colour)
FTA: Total ProjectedArclength of Filament
FCA: Change-in-Angle of Filament
FTT: Total Torque of Filament (thickness)
FAS: Asymmetry of Filament(angular displacement)
V0: Zero Velocity(fixed radius)
#DataVizInSixWeeksCopyright Anne Stevens
Glyph-Based Video Visualization for Semen AnalysisB. Duffy, et al. TVCG 2014 (VIS2014, Friday)

#DataVizInSixWeeksCopyright Anne Stevens
Ring chart
infodesignpatterns.com
#DataVizInSixWeeksCopyright Anne Stevens
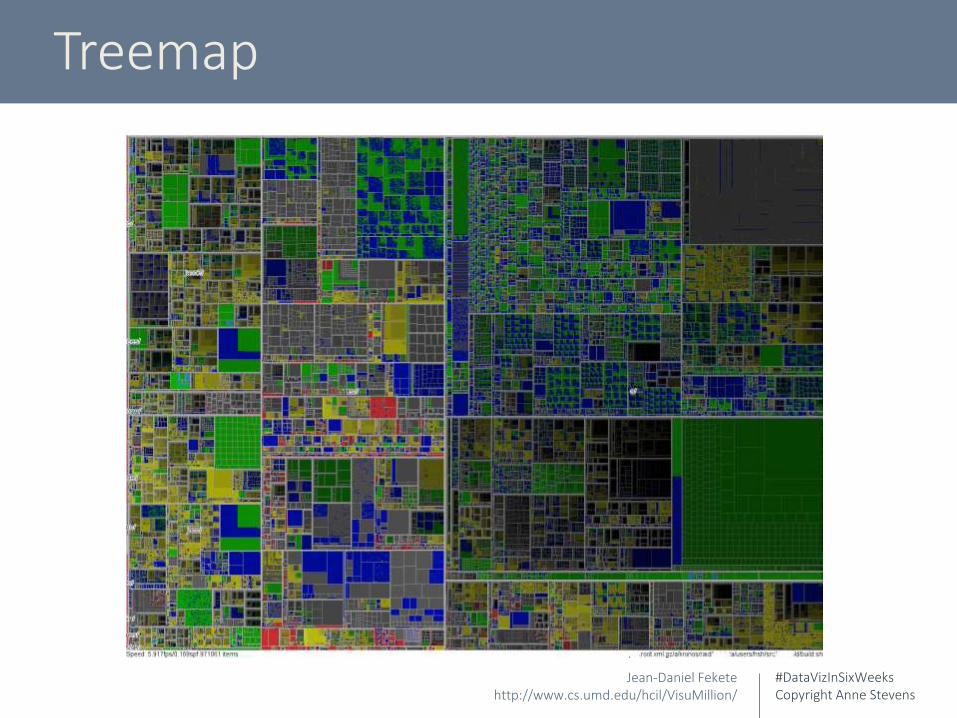
Treemap
Jean-Daniel Feketehttp://www.cs.umd.edu/hcil/VisuMillion/

#DataVizInSixWeeksCopyright Anne Stevens

#DataVizInSixWeeksCopyright Anne Stevens
Map of the Marketmarketwatch.com/tools/stockresearch/marketmap
#DataVizInSixWeeksCopyright Anne Stevens
Comparison

#DataVizInSixWeeksCopyright Anne Stevens
Bar chart
Enrico Bertini. Fell in Love With Databit.ly/infovis14-l2
#DataVizInSixWeeksCopyright Anne Stevens
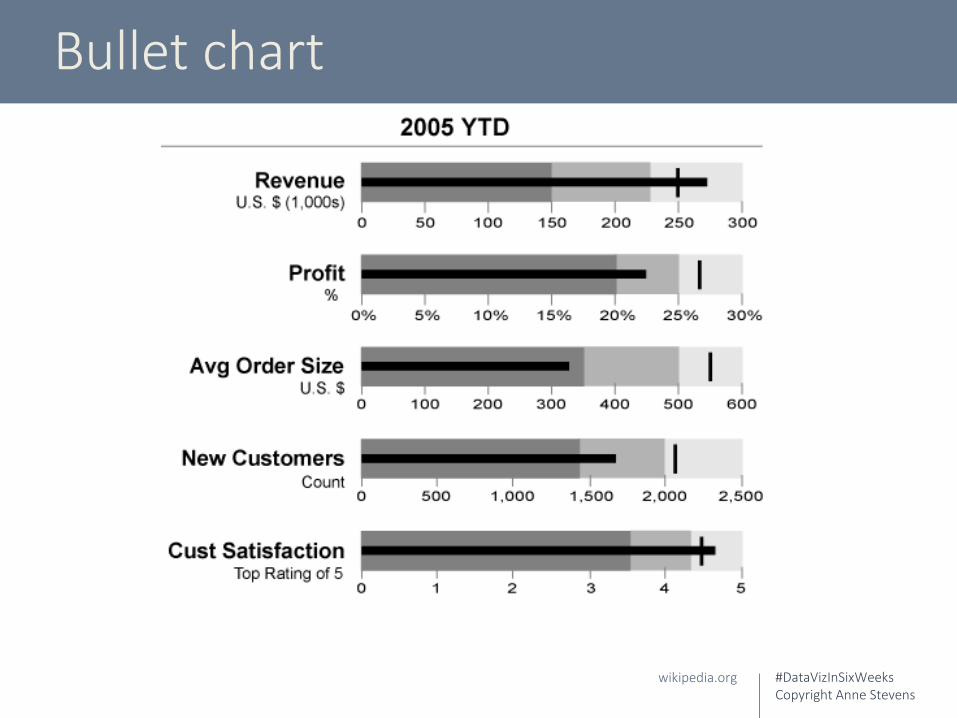
Bullet chart
wikipedia.org

#DataVizInSixWeeksCopyright Anne Stevens
Stacked area chart
Martin Wattenberg, Baby Name Voyager. 2005babynamewizard.com/voyager

#DataVizInSixWeeksCopyright Anne Stevens
Parallel coordinates diagram
Data Stories, Ownership of Assets and Amenities by District (Proportion of Households)http://datastories.in/

#DataVizInSixWeeksCopyright Anne Stevens
Star plot
Tulip software c/o Fanny Chevalier
#DataVizInSixWeeksCopyright Anne Stevens
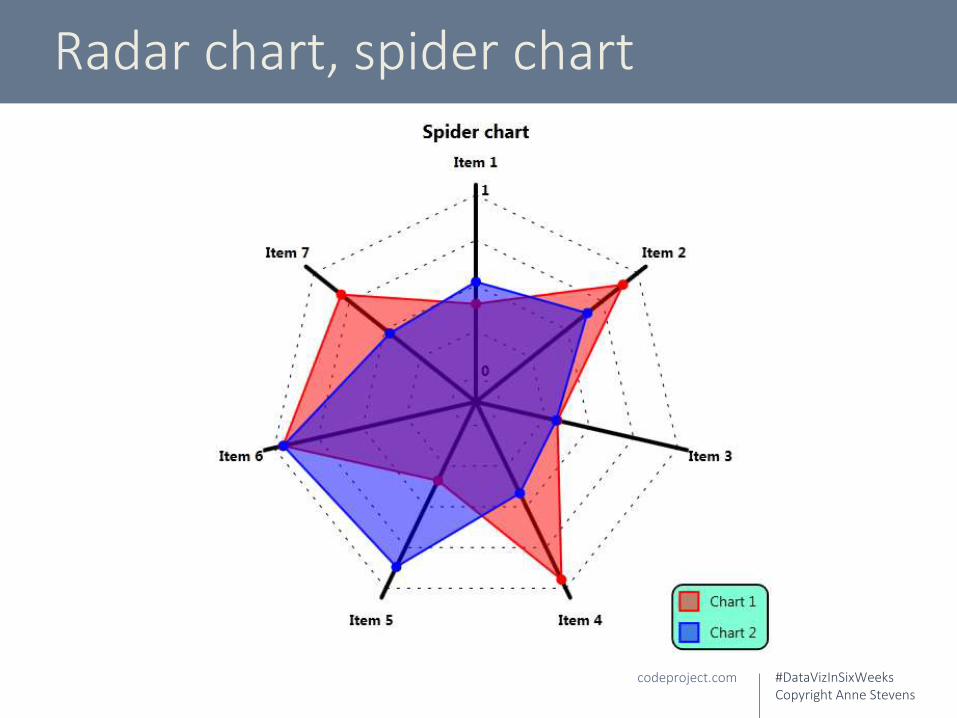
Radar chart, spider chart
codeproject.com

#DataVizInSixWeeksCopyright Anne Stevens
Coxcomb diagram
Diagram of the causes of mortality in the army in the East. Florence Nightengale. 1858 decohan.wordpress.com/2011/10/07/nature-of-visualisation
Grey = disease. Pink = battle wounds. Black = other causes
#DataVizInSixWeeksCopyright Anne Stevens
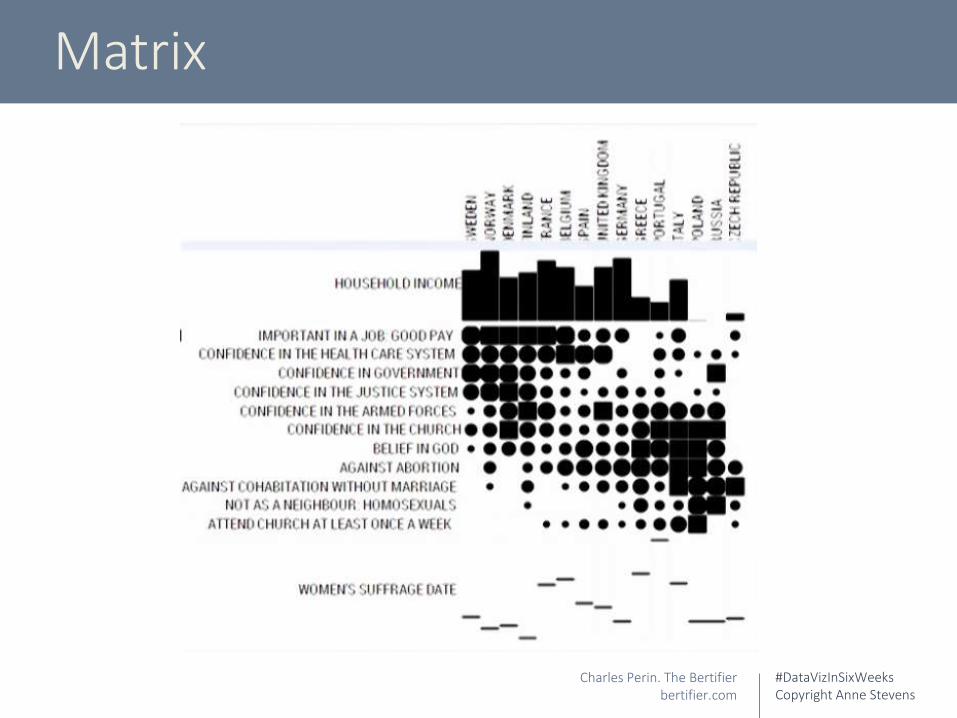
Matrix
Charles Perin. The Bertifierbertifier.com
#DataVizInSixWeeksCopyright Anne Stevens
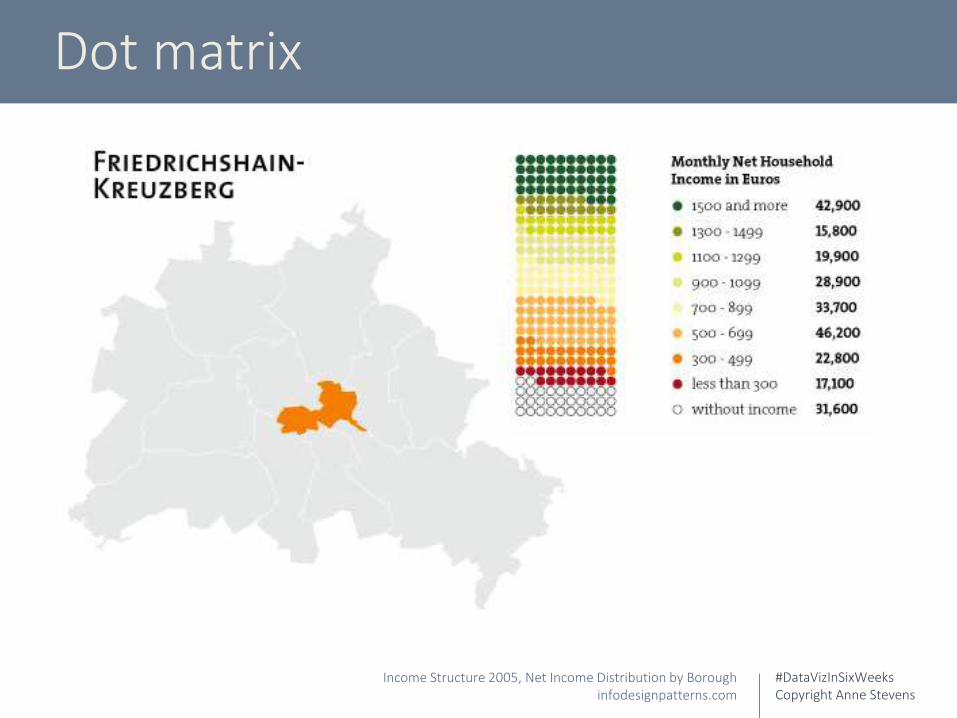
Dot matrix
Income Structure 2005, Net Income Distribution by Boroughinfodesignpatterns.com

#DataVizInSixWeeksCopyright Anne Stevens
Matrix of dot matrices
Political Party Landscape 2006. Number of Seats per Party and Borough Assemblyinfodesignpatterns.com

#DataVizInSixWeeksCopyright Anne Stevens
Matrices of any viz form

#DataVizInSixWeeksCopyright Anne Stevens
Small multiples
Jeffrey Heerhomes.cs.washington.edu/~jheer//files/zoo/

#DataVizInSixWeeksCopyright Anne Stevens

#DataVizInSixWeeksCopyright Anne Stevens
Distribution
#DataVizInSixWeeksCopyright Anne Stevens
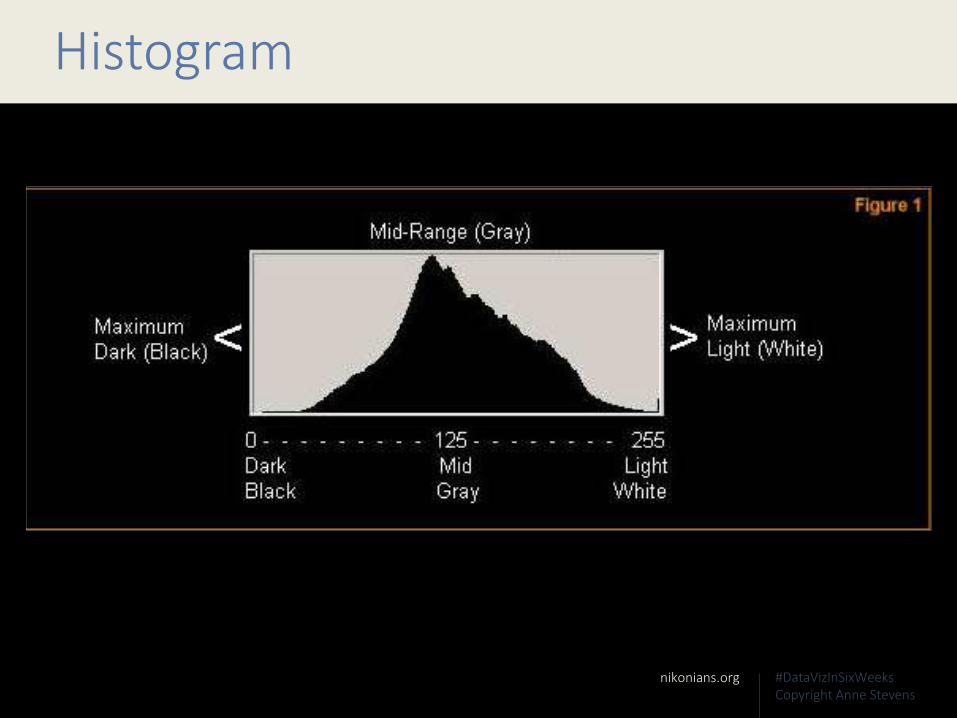
Histogram
nikonians.org

#DataVizInSixWeeksCopyright Anne Stevens
Histogram

#DataVizInSixWeeksCopyright Anne Stevens
Box & whisker chart
maths.nayland.school.nz (left), wilsonmar.com (right)

#DataVizInSixWeeksCopyright Anne Stevens
Location based data

#DataVizInSixWeeksCopyright Anne Stevens
Maps
Paul ButlerVisualizing Friendship

#DataVizInSixWeeksCopyright Anne Stevens
Choropleth (thematic) maps
Borzu Taleia

#DataVizInSixWeeksCopyright Anne Stevens
Bubble maps
Borzu Taleia

#DataVizInSixWeeksCopyright Anne Stevens
Cartograms
World population. worldmapper.org/svg/map2/index.html (top) Alcohol & cigarette imports. worldmapper.org/display.php?selected=56 (botom)

#DataVizInSixWeeksCopyright Anne Stevens
Hybrids & composites

#DataVizInSixWeeksCopyright Anne Stevens
Online resources
A Tour Through the Visualization Zoo, Jeffrey Heer
hci.stanford.edu/jheer/files/zoo/
Info Design Patterns
www.niceone.org/infodesignpatterns/index.php5#/patterns.php5
Extreme Presentations
extremepresentation.typepad.com/blog/2006/09/choosing_a_good.html
#DataVizInSixWeeksCopyright Anne Stevens
Week One
What is data visualization? Historical context
Week Four
Design issues & best practices
Week Two
Visualization typesWeek Five
Big data, data management
Week Three
Perception and cognitionWeek Six
Synthesis
Data Viz In Six WeeksAn Introduction to Visual Analytics course taught at OCAD University, Toronto
By Anne Stevens
stevensanne.com
stevensanne.com/blog/
@3_ring_binder