dataset integrity check for the studies of pediatric … · dataset integrity check for the studies...
TRANSCRIPT

Dataset Integrity Check for the Studies of Pediatric Liver Transplant
(SPLIT) Registry
Prepared by
RTI International
3040 Cornwallis Road
Research Triangle Park, NC 27709-2194
June 18, 2012

Revision History
Version Author/Title Date Comments
1.0 SM Rogers October, 2011 Original

Table of Contents
1 Standard Disclaimer ................................................................................................................ 1
2 Study Background ................................................................................................................... 2
3 Archived Datasets .................................................................................................................... 2
4 Statistical Methods .................................................................................................................. 3
5 Results ..................................................................................................................................... 4
6 Conclusions ............................................................................................................................. 8
7 References ............................................................................................................................... 9
8 Appendix 1: Tabulations of Tables 1-3 from Gilmour et al. (2010). .................................... 10
Table 1. Characteristics of Participants. Published results from Gilmour et al. (2010), Liver
Transplantation 16(9): 1041-1048. .......................................................................................... 5
Table 2. Published results from Gilmour et al. (2010), Liver Transplantation 16(9): 1041-1048.. 6
Table 3. Educational Outcomes by Age Group. Published results from Gilmour et al. (2010),
Liver Transplantation 16(9): 1041-1048. ................................................................................ 7
Table 4. Education Outcomes by Age Group: DSIC Results. ........................................................ 7

Studies of Pediatric Liver Transplant (SPLIT)
1
1 Standard Disclaimer
The intent of this DSIC is to provide confidence that the data distributed by the NIDDK repository is a
true copy of the study data. Our intent is not to assess the integrity of the statistical analyses reported by
study investigators. As with all statistical analyses of complex datasets, complete replication of a set of
statistical results should not be expected on a first (or second) exercise in secondary analysis. This occurs
for a number of reasons including differences in the handling of missing data, restrictions on cases
included in samples for a particular analysis, software coding used to define complex variables, etc.
Experience suggests that most discrepancies can ordinarily be resolved by consultation with the study
data coordinating center (DCC), however this process is labor-intensive for both DCC and Repository
staff. It is thus not our policy to resolve every discrepancy that is observed in an integrity check.
Specifically, we do not attempt to resolve minor or inconsequential discrepancies with published results
or discrepancies that involve complex analyses, unless NIDDK Repository staff suspect that the observed
discrepancy suggests that the dataset may have been corrupted in storage, transmission, or processing by
repository staff. We do, however, document in footnotes to the integrity check those instances in which
our secondary analyses produced results that were not fully consistent with those reported in the target
publication.

2 Study Background
The Studies of Pediatric Liver Transplant (SPLIT) is a prospective, longitudinal study of pediatric liver
transplantation conducted at over 40 transplant centers in the United States and Canada. Originally
started in 1995, the National Institute of Diabetes and Digestive and Kidney Diseases (NIDDK) became
the sponsor of SPLIT in 2004. SPLIT data archived in the NIDDK repository include study information
on any participant enrolled under the NIDDK grant period and for participants that have any follow-up
after the start of the grant period even if enrolled prior to the grant period. As a partial check of the
SPLIT data archived in the NIDDK data repository, a dataset integrity check (DSIC) was performed.
This DSIC consists of a small number of analyses performed in the publication by Gilmour et al (2010) in
Liver Transplantation [1].
3 Archived Datasets
The DCC submitted 23 datasets which correspond to 22 study data collection forms. (The enrollment
form, enr.sas7bdat, included only the date of enrollment and was not included in the repository). An
analysis dataset that corresponds with results published by Gilmour et al. was not provided and
reconstruction of the analysis dataset and derived variables was left to repository analysts. Datasets used
to create this analysis file include: DEM (demographics), LTF (long-term post-transplant follow-up), TPP
(transplant baseline), EDU (school attendance and performance survey), and S1L (status 1 listing).
The results of this DSIC do not match the published results for several reasons:
The data supplied to the NIDDK repository represent a subset of all pediatric liver transplant
recipients in the SPLIT data registry.
The original SPLIT pediatric registry began in 1995. Starting in 2004, the NIDDK became the
sponsor of SPLIT. Only data collected during the time that NIDDK sponsored the study, i.e.
since 2004, are included in the repository.
Data have been included for any participant enrolled under the NIDDK grant period.
Additionally data have been included for participants that have any follow-up after the start of
the grant period even if enrolled prior to the grant period.

Dates are not provided. The date of birth has been recoded to year of birth. All other dates have
been recoded to age at event (in days). This includes date of form completion, listing for
transplantation, clinical and laboratory test dates, transplant dates, etc.
4 Statistical Methods
The publication by Gilmour et al examines several indicators of school attendance, performance, and
educational outcomes. Eligible patients were defined as between 6 and 18 years of age, survived liver
transplantation by at least 9 months, completed the school function questionnaire (School Attendance and
Academic Performance Survey, SAAPS) between 1 June 2005 and 31 March 2008, and completed the
SPLIT long-term follow-up form. If more than one SAAPS was completed, only data from the last
SAAPS filed were included.
We present our DSIC results to published results in Table 1 (Characteristics of Participants versus
nonparticipants), Table 2 (School Attendance) and Table 3 (Educational Outcomes by Age Group).
For this DSIC, SAS datasets were converted to Stata using Stat/Transfer (Circle Systems Inc). Stata
v11.1 was used for all analyses (Appendix 1).

5 Results
Table 1 presents the characteristics of patients who completed the SAAPS in the published manuscript
and our DSIC calculations. The datasets and variables within those datasets that were used in deriving
our DSIC estimates are indicated in the column, dataset.variable. Our DSIC calculations differ from the
published results in at least two ways: Only subjects who completed the SAAPS between 1 June 2005 and
31 March 2008 were included in the Gilmour analyses. DSIC calculations are derived from all transplant
patients registered in the NIDDK repository and represent a larger sample of registry participants.
Furthermore, since dates were not included, it is not possible to restrict our analyses to patients registered
during a specific time period as in Gilmour et al.

Table 1. Characteristics of Participants. Published results from Gilmour et al. (2010), Liver
Transplantation 16(9): 1041-1048.
Gilmour et al (2010) DSIC Dataset.Variable
Characteristic N % N %
Sex Dem.regsex
Male 389 47.3 516 46.4
Female 434 52.7 596 53.6
Race Dem.regrace
White 514 62.5 515 62.1
Black 128 15.6 139 16.8
Hispanic 103 12.5 104 12.5
Asian/ Pacific 34 4.1 27 3.3
Aboriginal 9 1.1 9 1.1
Other 31 3.7 35 4.2
Primary Dx Dem.regprdis
Bil. Atresia 307 37.3 421 37.9
Other chol. 368 32.6 341 30.7
Fulminant LF 115 14.0 145 13.0
Cirrhosis 57 6.9 76 6.8
Other 76 9.2 129 11.6
Age @ Transp. Tpp.tranage
0-6 mo 49 6.0 59 5.3
6-12 mo 123 14.9 161 14.5
1-5 yr 258 31.3 350 31.5
5-13 yr 294 35.7 407 36.6
13-17 yr 99 12.0 134 12.1
Primary Payor Tpp.tpppayor
Medicaid 278 33.8 405 41.4
Prov. Govt. 74 9.0 a
HMO 162 19.7 219 22.4
Priv. Ins. 220 26.7 303 31.0
Military 12 1.5 14 1.4
PELD tppscore,tppalloc,
Mean 11.5±14.5 b Tppelda;s1lscore
Note: a provincial government not coded; tabulations exclude 36 values (3.8%) “self pay,” “donation,” “no funding,” and
“other.” b
Tabulations of PELD score were limited in the DSIC analysis to a subset of participants with complete TPP (Transplant Baseline) forms or S1L (Status 1 Listing) forms (n=213). Results were not presented for this smaller subset.

Table 2 in the published manuscript details the number of days of school that were missed due to illness
or doctors’ visits. Although the sample Ns differed between the two analyses, the percentages of patients
attending school and days of school missed in the Gilmour analyses and DSIC were similar.
Table 2. Published results from Gilmour et al. (2010), Liver Transplantation 16(9): 1041-1048.
Gilmour et al (2010) DSIC Data.variable
School Attendance N % N %
Attended school in No 36 4.4 43 3.9 Edu.edusch12
last 12 months Yes 774 95.6 1050 96.1
Missed >10 days No 512 67.2 701 67.7 Edu.edumisse
of school Yes 250 32.8 334 32.3
School days missed Edu.edumisse
0-4 277 36.4 375 36.2
5-10 235 30.8 326 31.5
11-20 116 15.2 165 15.9
21-30 47 6.2 56 5.4
31+ 87 11.4 113 10.9
Tables 3 and 4 tabulate educational outcomes by age group, for the Gilmour analyses (Table 3) and the
DSIC (Table 4). Again, sample sizes in the DSIC vary from the published analyses although the
percentages of patients with each selected outcome, total and by age group appear similar.
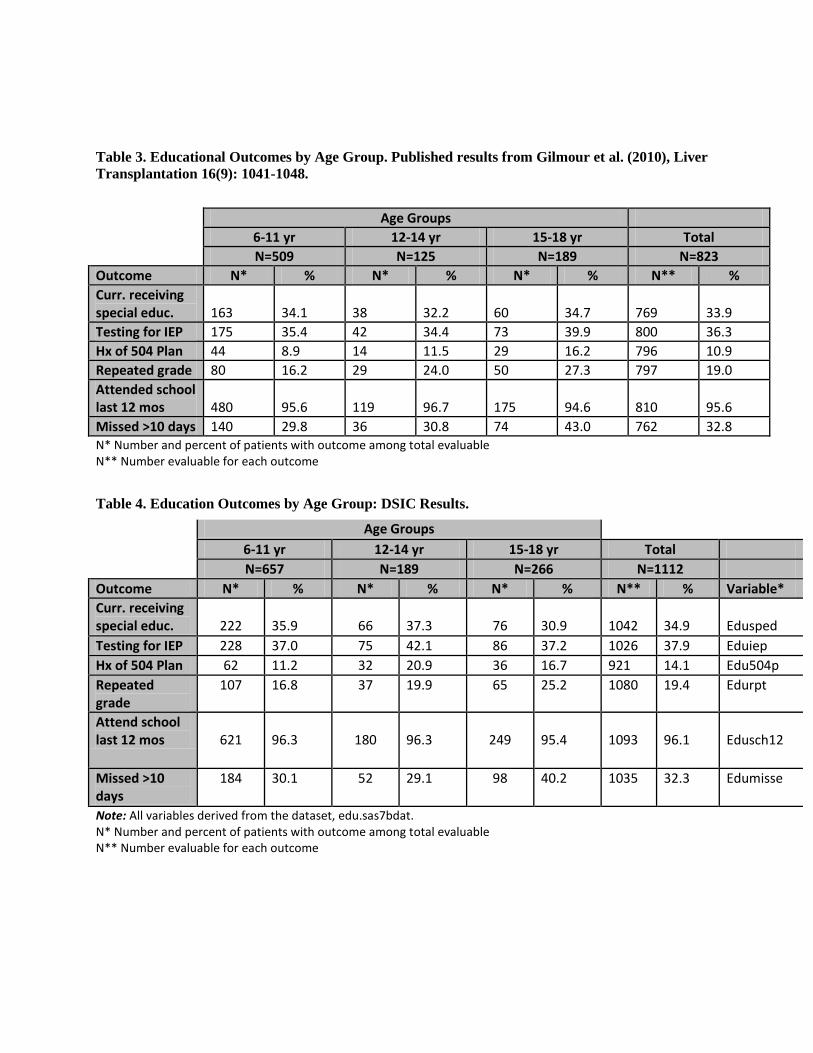
Table 3. Educational Outcomes by Age Group. Published results from Gilmour et al. (2010), Liver
Transplantation 16(9): 1041-1048.
Age Groups
6-11 yr 12-14 yr 15-18 yr Total
N=509 N=125 N=189 N=823
Outcome N* % N* % N* % N** %
Curr. receiving special educ.
163
34.1
38
32.2
60
34.7
769
33.9
Testing for IEP 175 35.4 42 34.4 73 39.9 800 36.3
Hx of 504 Plan 44 8.9 14 11.5 29 16.2 796 10.9
Repeated grade 80 16.2 29 24.0 50 27.3 797 19.0
Attended school last 12 mos
480
95.6
119
96.7
175
94.6
810
95.6
Missed >10 days 140 29.8 36 30.8 74 43.0 762 32.8 N* Number and percent of patients with outcome among total evaluable N** Number evaluable for each outcome
Table 4. Education Outcomes by Age Group: DSIC Results.
Age Groups
6-11 yr 12-14 yr 15-18 yr Total
N=657 N=189 N=266 N=1112
Outcome N* % N* % N* % N** % Variable*
Curr. receiving special educ.
222
35.9
66
37.3
76
30.9
1042
34.9
Edusped
Testing for IEP 228 37.0 75 42.1 86 37.2 1026 37.9 Eduiep
Hx of 504 Plan 62 11.2 32 20.9 36 16.7 921 14.1 Edu504p
Repeated grade
107 16.8 37 19.9 65 25.2 1080 19.4 Edurpt
Attend school last 12 mos
621
96.3
180
96.3
249
95.4
1093
96.1
Edusch12
Missed >10 days
184 30.1 52 29.1 98 40.2 1035 32.3 Edumisse
Note: All variables derived from the dataset, edu.sas7bdat. N* Number and percent of patients with outcome among total evaluable N** Number evaluable for each outcome

6 Conclusions
In conclusion, the SPLIT data in the NIDDK repository represent data collected during the NIDDK
sponsorship of the SPLIT registry (since 2004). All dates have been removed; most dates are reflected as
age (in days) of event. Our DSIC analyses cannot replicate the results in the Gilmour et al manuscript
which restrict the sample to data collected during a specific time period, however our analyses provide
confidence that the data provided to the NIDDK repository represent the range of study variables, data
collection instruments, and study data that have been generated over the NIDDK grant period.

7 References
[1] Gilmour SM, Sorensen LG, Anand R, Yin W, Alonso E on behalf of the SPLIT Research
Consortium. 2010. School outcomes in children registered in the studies for pediatric liver transplant
(SPLIT) consortium. Liver Transplantation 16:1041-48

8 Appendix 1: Tabulations of Tables 1-3 from Gilmour et al. (2010).
. /* Tabulations of Tables 1-3 from Gilmour et al(2010) in Liver Transplantation
>Patient eligibility include age between 6 and 18 years, liver transplant 9 months ago,completed
SAAPS between 1 June 2005 and 31 March 2008, maintaining routine follow-up, 39 of 45 centers
participated in SAAPS*/
. /* Due to de-identification of data, center ID not included and dates have been
converted to age of event in days, can not determine date of data collection*/
.
. use "C:\Documents and Settings\smr\My Documents\SPLIT\Data\dem.dta", clear
. /* Demographic data */
. tab prot
prot | Freq. Percent Cum.
------------+-----------------------------------
SPLIT | 3,245 100.00 100.00
------------+-----------------------------------
Total | 3,245 100.00
. keep if prot=="SPLIT"
(0 observations deleted)
. sort projid
. keep projid regrace regsex regprdis birthyr regagereg
. save "C:\Documents and Settings\smr\My Documents\SPLIT\DSIC\Gilmour_1.dta", replace
file C:\Documents and Settings\smr\My Documents\SPLIT\DSIC\Gilmour_1.dta saved
. merge 1:m projid using "C:\Documents and Settings\smr\MyDocuments\SPLIT\Data\tpp.dta"
Result # of obs.
-----------------------------------------
not matched 466
from master 466 (_merge==1)
from using 0 (_merge==2)
matched 3,026 (_merge==3)
-----------------------------------------
. /* Transplant Baseline Data */
. tab1 visno regsex regprdis regrace
-> tabulation of visno
visit |
number | Freq. Percent Cum.
------------+-----------------------------------
100 | 2,775 91.71 91.71
200 | 224 7.40 99.11
300 | 24 0.79 99.90
400 | 3 0.10 100.00
------------+-----------------------------------
Total | 3,026 100.00
-> tabulation of regsex
sex | Freq. Percent Cum.
------------+-----------------------------------
1 | 1,653 47.34 47.34
2 | 1,839 52.66 100.00
------------+-----------------------------------
Total | 3,492 100.00
-> tabulation of regprdis
primary |
liver |

disease | Freq. Percent Cum.
------------+-----------------------------------
1.01 | 1,450 41.52 41.52
1.02 | 92 2.63 44.16
1.04 | 52 1.49 45.65
1.05 | 42 1.20 46.85
1.07 | 56 1.60 48.45
1.08 | 93 2.66 51.12
1.09 | 5 0.14 51.26
1.10 | 40 1.15 52.41
1.99 | 52 1.49 53.89
2.01 | 3 0.09 53.98
2.02 | 2 0.06 54.04
2.03 | 2 0.06 54.10
2.06 | 2 0.06 54.15
2.07 | 310 8.88 63.03
2.08 | 56 1.60 64.63
2.09 | 12 0.34 64.98
2.99 | 44 1.26 66.24
3.01 | 90 2.58 68.81
3.02 | 29 0.83 69.64
3.03 | 40 1.15 70.79
3.04 | 18 0.52 71.31
3.05 | 65 1.86 73.17
3.06 | 86 2.46 75.63
3.07 | 22 0.63 76.26
3.08 | 21 0.60 76.86
3.09 | 14 0.40 77.26
3.10 | 4 0.11 77.38
3.99 | 100 2.86 80.24
4.01 | 20 0.57 80.81
4.02 | 179 5.13 85.94
4.03 | 14 0.40 86.34
4.99 | 22 0.63 86.97
5.01 | 6 0.17 87.14
5.02 | 6 0.17 87.31
5.03 | 6 0.17 87.49
6.01 | 9 0.26 87.74
6.03 | 1 0.03 87.77
6.04 | 15 0.43 88.20
6.05 | 98 2.81 91.01
6.06 | 46 1.32 92.33
6.99 | 43 1.23 93.56
7.01 | 18 0.52 94.07
7.02 | 36 1.03 95.10
9.99 | 171 4.90 100.00
------------+-----------------------------------
Total | 3,492 100.00
-> tabulation of regrace
race | Freq. Percent Cum.
------------+-----------------------------------
1 | 978 60.52 60.52
2 | 270 16.71 77.23
3 | 221 13.68 90.90
4 | 55 3.40 94.31
5 | 26 1.61 95.92
9 | 66 4.08 100.00
------------+-----------------------------------
Total | 1,616 100.00
. summ regagereg tpppelda tpppayor tranage
Variable | Obs Mean Std. Dev. Min Max
-------------+--------------------------------------------------------
regagereg | 1007 1581.045 1747.473 -2 7669
tpppelda | 217 29.53456 7.744171 3 50
tpppayor | 0
tranage | 3026 1832.538 1940.545 10 7756

.
. /* tranage Age at transplant recorded in days */
. gen agetran_yr=tranage/365
(466 missing values generated)
. *tab agetran_yr
. recode agetran_yr (0/0.5 = 1 "0-6 mos") (0.501/1.0 = 2 "6-12 mos") (1.001/5 = 3 "1-5 yr") ///
> (5.001/13 = 4 "5-13 yr") (13.001/17 = 5 "13-17 yr") (17.001/22=.), gen(agetranr)
(3025 differences between agetran_yr and agetranr)
. tab1 agetranr
-> tabulation of agetranr
RECODE of |
agetran_yr | Freq. Percent Cum.
------------+-----------------------------------
0-6 mos | 237 8.04 8.04
6-12 mos | 687 23.31 31.35
1-5 yr | 1,016 34.48 65.83
5-13 yr | 686 23.28 89.11
13-17 yr | 321 10.89 100.00
------------+-----------------------------------
Total | 2,947 100.00
. sort projid
. keep projid regrace regsex regprdis birthyr regagereg regagereg tpppelda tpppayor
tranage agetran_yr agetranr
. save "C:\Documents and Settings\smr\My Documents\SPLIT\DSIC\Gilmour_2.dta", replace
file C:\Documents and Settings\smr\My Documents\SPLIT\DSIC\Gilmour_2.dta saved
.
. /*merge with School Attendance and Performance Survey */
. merge m:m projid using "C:\Documents and Settings\smr\My Documents\SPLIT\Data\edu.dta",
gen (_merge2)
Result # of obs.
-----------------------------------------
not matched 2,130
from master 2,130 (_merge2==1)
from using 0 (_merge2==2)
matched 3,182 (_merge2==3)
-----------------------------------------
.
. summ eduage /* school status age in days */
Variable | Obs Mean Std. Dev. Min Max
-------------+--------------------------------------------------------
eduage | 2787 4046.557 1349.047 1468 9294
. gen eduageyr=eduage/365
(2525 missing values generated)
. sum eduageyr /* eligible subjects 6 to 18 years of age */
Variable | Obs Mean Std. Dev. Min Max
-------------+--------------------------------------------------------
eduageyr | 2787 11.08646 3.69602 4.021918 25.46301
. keep if eduageyr >=6 & eduageyr <=18
(2677 observations deleted)
. recode eduageyr (6/11.999=1) (12/14.999=2) (15/18=3), gen (agegroup)
(2635 differences between eduageyr and agegroup)
. label define age 1"6-11" 2"12-14 yr" 3"15-18yrs"
. label values agegroup age

. tab agegroup
RECODE of |
eduageyr | Freq. Percent Cum.
------------+-----------------------------------
6-11 | 1,692 64.21 64.21
12-14 yr | 483 18.33 82.54
15-18yrs | 460 17.46 100.00
------------+-----------------------------------
Total | 2,635 100.00
. sort projid
. /*eligible patients completed long-term follow-up form */
. merge m:m projid using "C:\Documents and Settings\smr\My Documents\SPLIT\Data\ltf.dta",
gen (_merge3)
Result # of obs.
-----------------------------------------
not matched 6,801
from master 8 (_merge3==1)
from using 6,793 (_merge3==2)
matched 8,521 (_merge3==3)
-----------------------------------------
. /* calculate last visit */
. destring visno, gen(visit)
visno has all characters numeric; visit generated as int
. bysort projid (visit) : gen visdiff = visit - visit[_n-1]
(2545 missing values generated)
. * list projid visno visit visdiff in 10/53
. bys projid (visit) : gen nid= _n
. * list projid visno visit visdiff in 10/53, sepby(projid)
. bys projid (visit) : gen first = _n==1
. bys projid (visit) : gen last = _n==_N
* list projid visit visdiff first last edupcg in 10/53, sepby(projid)
.
. tab nid
nid | Freq. Percent Cum.
------------+-----------------------------------
1 | 2,545 16.61 16.61
2 | 2,351 15.34 31.95
3 | 2,129 13.90 45.85
4 | 1,931 12.60 58.45
5 | 1,622 10.59 69.04
6 | 1,294 8.45 77.48
7 | 1,030 6.72 84.21
8 | 784 5.12 89.32
9 | 583 3.80 93.13
10 | 405 2.64 95.77
11 | 266 1.74 97.51
12 | 175 1.14 98.65
13 | 112 0.73 99.38
14 | 60 0.39 99.77
15 | 18 0.12 99.89
16 | 9 0.06 99.95
17 | 8 0.05 100.00
------------+-----------------------------------
Total | 15,322 100.00
. *tab visit last
. *tab visit first

. keep if first==1 | last==1
(10426 observations deleted)
. keep if last==1
(2351 observations deleted)
. *list projid visit visdiff first last eduage tranage agetranr in 10/53, sepby(projid)
* list projid if _merge3==1 /*(id=2470 and 3706 do not have LTF data. remove from
gilmour3.dta)*/
*drop if projid=="02470" | projid=="03706"
. sort projid
. /*remove cases with missing data*/ tab birthyr
year of |
birth | Freq. Percent Cum.
------------+-----------------------------------
1986 | 9 0.80 0.80
1987 | 14 1.25 2.06
1988 | 34 3.04 5.09
1989 | 58 5.18 10.28
1990 | 55 4.92 15.19
1991 | 49 4.38 19.57
1992 | 65 5.81 25.38
1993 | 50 4.47 29.85
1994 | 64 5.72 35.57
1995 | 76 6.79 42.36
1996 | 79 7.06 49.42
1997 | 92 8.22 57.64
1998 | 117 10.46 68.10
1999 | 110 9.83 77.93
2000 | 121 10.81 88.74
2001 | 94 8.40 97.14
2002 | 30 2.68 99.82
2003 | 2 0.18 100.00
------------+-----------------------------------
Total | 1,119 100.00
. keep if birthyr!=.
(1426 observations deleted)
.
. gen timefromtrans=eduage-tranage
(5 missing values generated)
. summ timefromtrans
Variable | Obs Mean Std. Dev. Min Max
-------------+--------------------------------------------------------
timefromtr~s | 1114 2012.835 1083.29 -372 4776
. if timefromtrans <270 timefromtrans=. /* eligible patients survived liver transplant
at least 9 months */
. keep if timefromtrans!=.
(5 observations deleted)
. keep projid regrace regsex regprdis birthyr regagereg regagereg tpppelda tpppayor
tranage agetran_yr agetranr ///
> eduage eduageyr agegroup visit visdiff first last edupcg eduiep edu504p edurpt edusch12
edumisse edusped
. save "C:\Documents and Settings\smr\My Documents\SPLIT\DSIC\Gilmour_3.dta",
replace
file C:\Documents and Settings\smr\My Documents\SPLIT\DSIC\Gilmour_3.dta saved
destring regprdis, gen(primdx)
regprdis has all characters numeric; primdx generated as double

. recode primdx (1.01=1) (1.02/1.99=2) (2.0/2.99=3) (3.0/3.99=2) (6.01/6.99=4) (else=5)
(primdx: 1114 changes made)
.l define dx 1"atresia" 2"cholestatic" 3"fulminant" 4"cirrhosis" 5"other"
. label values primdx dx
. tab primdx
primary |
liver |
disease | Freq. Percent Cum.
------------+-----------------------------------
atresia | 421 37.79 37.79
cholestatic | 341 30.61 68.40
fulminant | 146 13.11 81.51
cirrhosis | 76 6.82 88.33
other | 130 11.67 100.00
------------+-----------------------------------
Total | 1,114 100.00
.
. /*Table 1. characteristics of participants */
. destring tpppayor, gen(payor)
tpppayor has all characters numeric; payor generated as byte
(135 missing values generated)
. recode payor (6/99=6)
(payor: 21 changes made)
. label define payor 1"medicaid" 3"HMO" 4"priv ins" 5"military" 6"other"
. label values payor payor
. tab1 regsex regrace primdx agetranr payor
-> tabulation of regsex
sex | Freq. Percent Cum.
------------+-----------------------------------
1 | 517 46.41 46.41
2 | 597 53.59 100.00
------------+-----------------------------------
Total | 1,114 100.00
-> tabulation of regrace
race | Freq. Percent Cum.
------------+-----------------------------------
1 | 515 62.12 62.12
2 | 139 16.77 78.89
3 | 104 12.55 91.44
4 | 27 3.26 94.69
5 | 9 1.09 95.78
9 | 35 4.22 100.00
------------+-----------------------------------
Total | 829 100.00
-> tabulation of primdx
primary |
liver |
disease | Freq. Percent Cum.
------------+-----------------------------------
atresia | 421 37.79 37.79
cholestatic | 341 30.61 68.40
fulminant | 146 13.11 81.51
cirrhosis | 76 6.82 88.33
other | 130 11.67 100.00
------------+-----------------------------------
Total | 1,114 100.00
-> tabulation of agetranr
RECODE of |

agetran_yr | Freq. Percent Cum.
------------+-----------------------------------
0-6 mos | 57 5.12 5.12
6-12 mos | 159 14.29 19.41
1-5 yr | 351 31.54 50.94
5-13 yr | 408 36.66 87.60
13-17 yr | 138 12.40 100.00
------------+-----------------------------------
Total | 1,113 100.00
-> tabulation of payor
payor | Freq. Percent Cum.
------------+-----------------------------------
medicaid | 407 41.57 41.57
2 | 3 0.31 41.88
HMO | 220 22.47 64.35
priv ins | 302 30.85 95.20
military | 14 1.43 96.63
other | 33 3.37 100.00
------------+-----------------------------------
Total | 979 100.00
.
. destring edumisse, gen(daysmiss)
edumisse has all characters numeric; daysmiss generated as byte
(77 missing values generated)
. label define days 1"0-4" 2"5-10" 3"11-20" 4"21-30" 5"31+"
. label values daysmiss days
. tab1 edusch12 daysmiss edusped eduiep edu504 edurpt
-> tabulation of edusch12
attend |
school past |
12 mos | Freq. Percent Cum.
------------+-----------------------------------
0 | 43 3.93 3.93
1 | 1,052 96.07 100.00
------------+-----------------------------------
Total | 1,095 100.00
-> tabulation of daysmiss
missed |
school days | Freq. Percent Cum.
------------+-----------------------------------
0-4 | 376 36.26 36.26
5-10 | 326 31.44 67.70
11-20 | 165 15.91 83.61
21-30 | 56 5.40 89.01
31+ | 114 10.99 100.00
------------+-----------------------------------
Total | 1,037 100.00
-> tabulation of edusped
special |
education | Freq. Percent Cum.
------------+-----------------------------------
0 | 680 65.13 65.13
1 | 364 34.87 100.00
------------+-----------------------------------
Total | 1,044 100.00
-> tabulation of eduiep
individual |
education |
plan | Freq. Percent Cum.
------------+-----------------------------------

0 | 639 62.16 62.16
1 | 389 37.84 100.00
------------+-----------------------------------
Total | 1,028 100.00
-> tabulation of edu504p
504 plan |
received | Freq. Percent Cum.
------------+-----------------------------------
0 | 793 85.92 85.92
1 | 130 14.08 100.00
------------+-----------------------------------
Total | 923 100.00
-> tabulation of edurpt
repeated |
grade | Freq. Percent Cum.
------------+-----------------------------------
0 | 873 80.68 80.68
1 | 209 19.32 100.00
------------+-----------------------------------
Total | 1,082 100.00
sort agegroup
tab agegroup edusped, row chi2
+----------------+
| Key |
|----------------|
| frequency |
| row percentage |
+----------------+
RECODE of | special education
eduageyr | 0 1 | Total
-----------+----------------------+----------
6-11 | 398 222 | 620
| 64.19 35.81 | 100.00
-----------+----------------------+----------
12-14 yr | 111 66 | 177
| 62.71 37.29 | 100.00
-----------+----------------------+----------
15-18yrs | 171 76 | 247
| 69.23 30.77 | 100.00
-----------+----------------------+----------
Total | 680 364 | 1,044
| 65.13 34.87 | 100.00
Pearson chi2(2) = 2.5242 Pr = 0.283
. tab agegroup eduiep, row chi2
+----------------+
| Key |
|----------------|
| frequency |
| row percentage |
+----------------+
| individual education
RECODE of | plan
eduageyr | 0 1 | Total
-----------+----------------------+----------
6-11 | 390 228 | 618
| 63.11 36.89 | 100.00
-----------+----------------------+----------
12-14 yr | 103 75 | 178
| 57.87 42.13 | 100.00

-----------+----------------------+----------
15-18yrs | 146 86 | 232
| 62.93 37.07 | 100.00
-----------+----------------------+----------
Total | 639 389 | 1,028
| 62.16 37.84 | 100.00
Pearson chi2(2) = 1.6900 Pr = 0.430
. tab agegroup edu504, row chi2
+----------------+
| Key |
|----------------|
| frequency |
| row percentage |
+----------------+
RECODE of | 504 plan received
eduageyr | 0 1 | Total
-----------+----------------------+----------
6-11 | 491 62 | 553
| 88.79 11.21 | 100.00
-----------+----------------------+----------
12-14 yr | 121 32 | 153
| 79.08 20.92 | 100.00
-----------+----------------------+----------
15-18yrs | 181 36 | 217
| 83.41 16.59 | 100.00
-----------+----------------------+----------
Total | 793 130 | 923
| 85.92 14.08 | 100.00
Pearson chi2(2) = 10.7966 Pr = 0.005
. tab agegroup edurpt, row chi2
+----------------+
| Key |
|----------------|
| frequency |
| row percentage |
+----------------+
RECODE of | repeated grade
eduageyr | 0 1 | Total
-----------+----------------------+----------
6-11 | 530 107 | 637
| 83.20 16.80 | 100.00
-----------+----------------------+----------
12-14 yr | 149 37 | 186
| 80.11 19.89 | 100.00
-----------+----------------------+----------
15-18yrs | 194 65 | 259
| 74.90 25.10 | 100.00
-----------+----------------------+----------
Total | 873 209 | 1,082
| 80.68 19.32 | 100.00
Pearson chi2(2) = 8.1852 Pr = 0.017
. tab agegroup edusch12, row chi2
+----------------+
| Key |
|----------------|
| frequency |
| row percentage |
+----------------+
| attend school past 12

RECODE of | mos
eduageyr | 0 1 | Total
-----------+----------------------+----------
6-11 | 24 622 | 646
| 3.72 96.28 | 100.00
-----------+----------------------+----------
12-14 yr | 7 180 | 187
| 3.74 96.26 | 100.00
-----------+----------------------+----------
15-18yrs | 12 250 | 262
| 4.58 95.42 | 100.00
-----------+----------------------+----------
Total | 43 1,052 | 1,095
| 3.93 96.07 | 100.00
Pearson chi2(2) = 0.3898 Pr = 0.823
. recode daysmiss (1/2=1) (3/5=2), gen(daysmissr)
(661 differences between daysmiss and daysmissr)
. tab agegroup daysmissr, row chi2
+----------------+
| Key |
|----------------|
| frequency |
| row percentage |
+----------------+
| RECODE of daysmiss
RECODE of | (missed school days)
eduageyr | 1 2 | Total
-----------+----------------------+----------
6-11 | 428 185 | 613
| 69.82 30.18 | 100.00
-----------+----------------------+----------
12-14 yr | 127 52 | 179
| 70.95 29.05 | 100.00
-----------+----------------------+----------
15-18yrs | 147 98 | 245
| 60.00 40.00 | 100.00
-----------+----------------------+----------
Total | 702 335 | 1,037
| 67.70 32.30 | 100.00
Pearson chi2(2) = 8.7672 Pr = 0.012