datadisaggregated$by$income$and/or$ other$dimensions$of ... · lfs!(pnad) !! censuslongform...
TRANSCRIPT
ATHIAS,L. 2016
ESA/STAT/AC.320/8������Expert Group Meeting on Data Disaggregation���27-29 June 2016���New York
Data disaggregated by income and/or other dimensions of poverty By Leonardo Athias

ATHIAS,L. 2016 2
Expert Group Mee,ng on Data Disaggrega,on Session 5 – Data disaggregated by income and/or other
dimensions of poverty
Concrete examples of current work and specific strategies Monday, 27 June 2016
Leonardo Athias Brazilian InsBtute of Geography and StaBsBcs -‐ IBGE

ATHIAS,L. 2016 3
Contents
1) Problem statement 2) Concrete examples 3) Methodological challenges 4) Iden,fica,on of priority issues to be addressed for future guidance for SDG follow up and review

ATHIAS,L. 2016 4
Brazil is a big middle income country with high levels of inequality Along with urban/rural, gender, racial, and regional inequali,es, income is one of the main inequali,es if not the most studied
8.5 m km2
HDR, 2015, p. 217
1) Problem statement

ATHIAS,L. 2016 5
Average years of schooling of people 25 y.o.+ per quin,les of average monthly household per capita income -‐ Brazil -‐ 2014
1st quin,le
2nd quin,le
3rd quin,le
4th quin,le
5th quin,le
Source:
Educa,onal achievement
2) Concrete examples: income disaggrega,on
Source: IBGE, PNAD

ATHIAS,L. 2016 6
Propor,on of overcrowded households, total and 1st quin,le of average monthly household per capita income -‐ Brazil -‐ 2004/2014
1st quin,le
Source: IBGE, PNAD
Dwelling characteris,cs
Note: overcrowding is defined as >3 persons per dormitory.
2) Concrete examples: income disaggrega,on

ATHIAS,L. 2016 7
2) Concrete examples: MDG monitoring
MDG na,onal monitoring reports disclosed “UN indicators” and “Na,onal indicators” for Goal 1 such as: • Na,onal income concentrated by 20% richest
Percen
tage of total income
Middle income group
Middle income group (+6.9 p.p.) concentrated most of the 8% lost by 20% richest in the period
20% poorest 20%-‐80% middle
20% richest Gini index
Data source: IBGE, PNAD Source: 5th MDG na,onal monitoring report, 2014.
Income concentra,on and Gini index

ATHIAS,L. 2016 8
2) Concrete examples: MDG monitoring
MDG na,onal monitoring reports disclosed “UN indicators” and “Na,onal indicators” for Goal 1 such as: • Na,onal income concentrated by 20% richest • Distribu,on of popula,on in the 10% poorest and 1% richest, by race
Data source: IBGE, PNAD Source: 3rd MDG na,onal monitoring report, 2007.
White Black / Brown

ATHIAS,L. 2016 9
IBGE main household surveys
Decennial census (municipality level), short/long form Provides: total/labor/other income (reference month -‐ July)
Regular income data with annual naBonal Labor Force Survey, 1981-‐2015 (State, Metropolitan areas, urban/rural) Provides: total/labor/other income (reference month -‐ Sept.)
TransiBon since 2012 to panel LFS (HH stays 5 quarters), similar to Ireland and Mexico LFS. QuesBonnaire revision: Oct/2015 Provides: total/labor/other income (reference: last month)
Budget survey is less frequent, 2002-‐2003, 2008-‐2009, … Provides: consumpBon, total/disposable income (reference: 12 months)
3) methodological challenges: data sources

ATHIAS,L. 2016 10
3) methodological challenges: data sources
Income as variable and as disaggrega,on … DistribuBon of personal or household (per capita) income by …. … percenBles of income (20%,10%) … 1/4, 1/2, … 5+ minimum wage (today ~ US$500 PPP2011) classes
Other usual disaggregaBon: Sex Age groups Race Urban/rural Regions Disability (census data)
ATHIAS,L. 2016 11
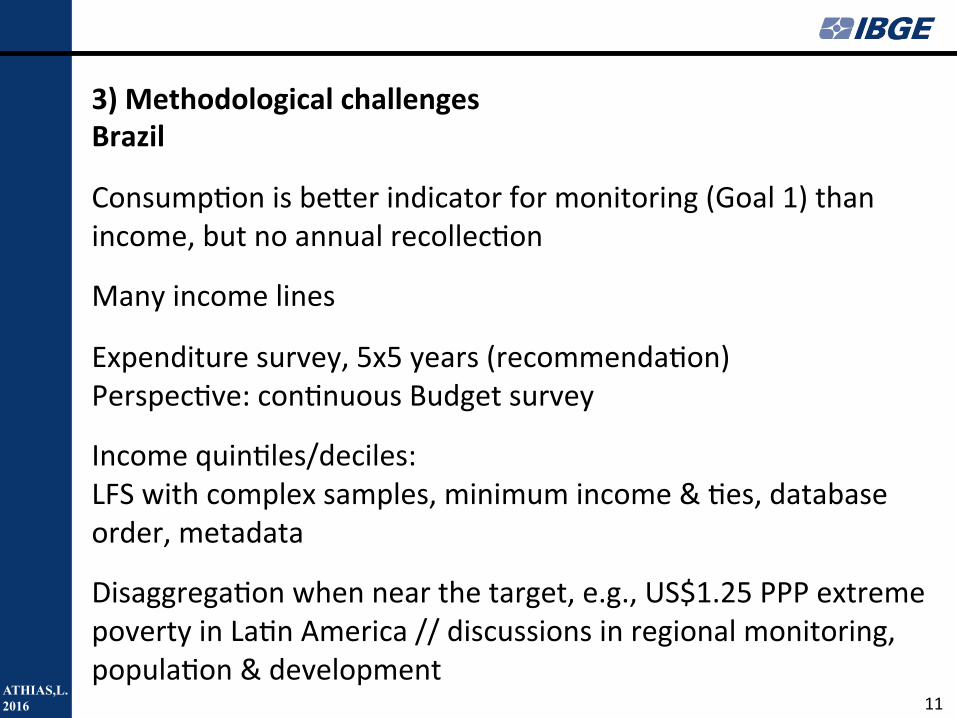
3) Methodological challenges Brazil
ConsumpBon is beger indicator for monitoring (Goal 1) than income, but no annual recollecBon
Many income lines
Expenditure survey, 5x5 years (recommendaBon) PerspecBve: conBnuous Budget survey
Income quinBles/deciles: LFS with complex samples, minimum income & Bes, database order, metadata
DisaggregaBon when near the target, e.g., US$1.25 PPP extreme poverty in LaBn America // discussions in regional monitoring, populaBon & development

ATHIAS,L. 2016 12
3) Methodological challenges Interna,onal level
India comment on 1.1.1./1.1.2. indicators: In Asia consumpBon expenditure is collected instead of income
SDGs: Many themes and data sources (if available) how to link?
QuesBons about unifying income and consumpBon sources in World Bank data Metadata from PovcalNet: • Uses both income and consumpBon because of (un)availability and study with 20 countries • ConsumpBon aggregates differ
Many decisions regarding income/consumpBon /“poverty in all its dimensions”, “people living below…” (Tier 3) How about transparency, replicability?

ATHIAS,L. 2016 13
4) Iden,fica,on of priority issues to be addressed for future guidance for SDG follow up and review Pressures regarding censuses and surveys: periodicity, coverage, more & more & more quesBons? How to set the limits of disaggregaBon? How to prioriBze disaggregaBon types?

ATHIAS,L. 2016 14
4) Iden,fica,on of priority issues to be addressed for future guidance for SDG follow up and review Pressures regarding censuses and surveys: periodicity, coverage, more & more & more quesBons? How to set the limits of disaggregaBon? How to prioriBze disaggregaBon types? NSO = official staBsBcs … How to integrate other data sources? Non-‐official data, data with high error margins… How to compose using records and census/survey data?


ATHIAS,L. 2016 16
BACKUP Data sources & HH income components Canberra Group Handbook 2nd edi,on (UNECE, 2011) IBGE surveys: HH Budget survey (POF) Con,nuous LFS (PNADC) LFS (PNAD) Census long form
Conceptual definition Operational definition
HH Budget survey(POF)
Continuous LFS (PNADC) LFS (PNAD) Census
long form
1 Income from employment ]
Employee income Included √√ √√ √√ √√
Wages and salaries Included √√ √ √ √
Cash bonuses and gratuities Included √√ √ √ √
Commissions and tips Included √√ √ √ √
Directors’ fees Included √√ √ √ √
Profit-sharing bonuses and other forms of profit-related pay Included √√ √
Shares offered as part of employee remuneration Included √√
Free or subsidised goods and services from an employer Included √ √√ √√
Severance and termination pay Included √√ √
Employers’ social insurance contributions Included
Income from self-employment Included √√ √√ √√ √√
Profit/loss from unincorporated enterprise Included √√ √ √ √
Goods and services produced for barter, less cost of inputs Included
Goods produced for own consumption, less cost of inputs Included √
2 Property income
Income from financial assets, net of expenses Included √ √ √
Income from non-financial assets, net of expenses Included √√ √√ √√ √
Royalties Included √√ √ √ √
3 Income from household production of services for own consumption
Net value of owner-occupied housing services Included √√
Value of unpaid domestic services — Not Included
Value of services from household consumer durables — Not Included
4 Current transfers received
Social security pensions / schemes Included √√ √√ √√ √√
Pensions and other insurance benefits Included √√ √√ √√ √
Social assistance benefits (excluding social transfers in kind, see 10) Included √√ √√ √√ √√
Current transfers from non-profit institutions Included √√ √ √ √
Current transfers from other households Included √√ √√ √√ √
5 Income from production (sum of 1 and 3)
6 Primary income (sum of 2 and 5)
7 Total income (sum of 4 and 6)
8 Current transfers paid
Direct taxes (net of refunds) Included √√
Compulsory fees and fines Included √√
Current inter-household transfers paid Included √√
Employee and employers’ social insurance contributions Included √√
Current transfers to non-profit institutions Included √√
9 Disposable income (7 less 8)
10 Social transfers in kind (STIK) received Not Included √
11 Adjusted disposable income (9 plus 10)
Note: √√ directly captured; √ captured aggregated with other components; most recent survey presented: POF 2008-‐2009, PNAD 2011-‐15, PNADC Oct/15 onward; Census 2010. Source: IBGE, internal documenta,on; UNECE, 2011, p.24.

ATHIAS,L. 2016 17
BACKUP 1.1.1 Propor,on of popula,on below the interna,onal poverty line, by sex, age, employment status and geographical loca,on (urban/rural) 1.2.1 Propor,on of popula,on living below the na,onal poverty line, by sex and age 1.2.2 Propor,on of men, women and children of all ages living in poverty in all its dimensions according to na,onal defini,ons 10.1.1 Growth rates of household expenditure or income per capita among the bohom 40 per cent of the popula,on and the total popula,on 10.2.1 Propor,on of people living below 50 per cent of median income, by age, sex and persons with disabili,es 17.18 By 2020, enhance capacity-‐building support to developing countries, including for least developed countries and small island developing States, to increase significantly the availability of high-‐quality, ,mely and reliable data disaggregated by income, gender, age, race, ethnicity, migratory status, disability, geographic loca,on and other characteris,cs relevant in na,onal contexts

ATHIAS,L. 2016 18
BACKUP Gini index of monthly income of 15 y.o. + persons with income by State -‐ 2014
Source: