data tricks - georgia department of educationdcconference.gadoe.org/documents/fy2017/general... ·...
TRANSCRIPT

DATA TRICKS
Casey M. Bethel | 2017 Georgia Teacher of the YearEmail: [email protected]
Facebook: GATeacher
Instagram: 2017GATOTY
Twitter: 2017GATOTY

Real Time Data
• http://tinyurl.com/data2017• Choose the one that best fits you.
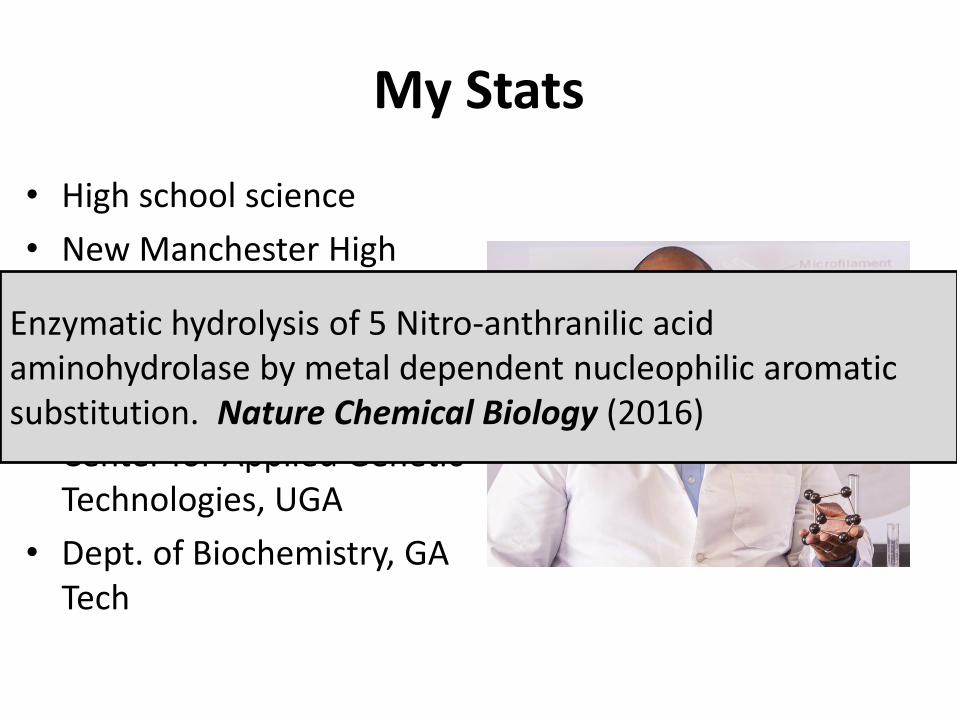
My Stats
• High school science
• New Manchester High School, Douglasville
• 11 years
• M.S. – Plant Genetics
• Center for Applied Genetic Technologies, UGA
• Dept. of Biochemistry, GA Tech
Enzymatic hydrolysis of 5 Nitro-anthranilic acid aminohydrolase by metal dependent nucleophilic aromatic substitution. Nature Chemical Biology (2016)

Effective Use of Data in My Classroom
• Student Longitudinal Data System
• Build a profile of my class beforehand
• Track vital trends throughout the year
– Attendance
– Lexile reading scores
– CRCT / Milestones
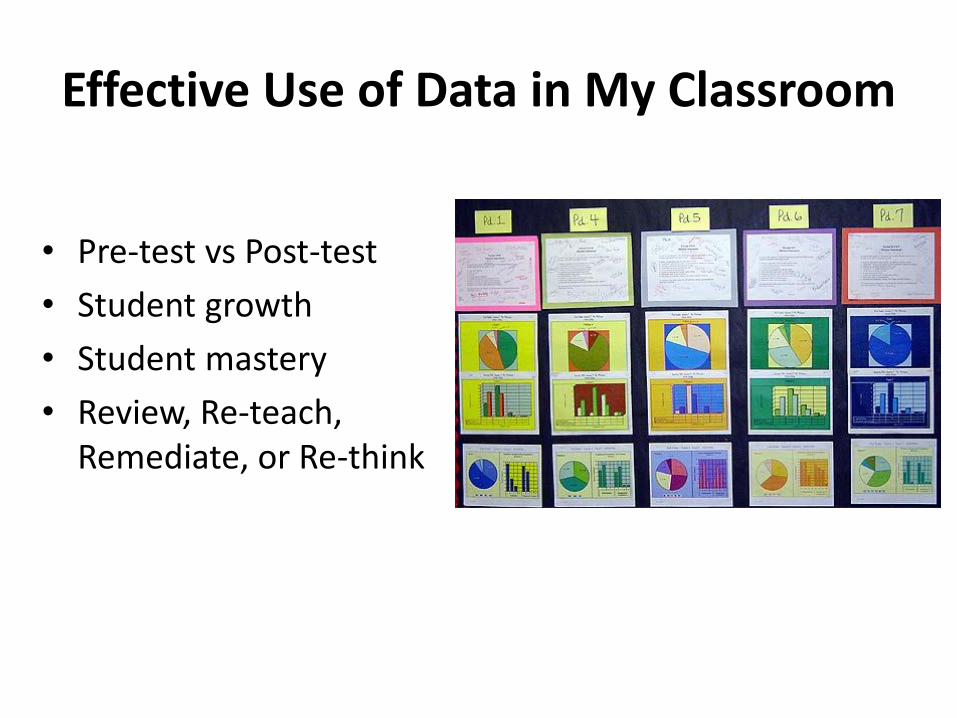
Effective Use of Data in My Classroom
• Pre-test vs Post-test
• Student growth
• Student mastery
• Review, Re-teach, Remediate, or Re-think
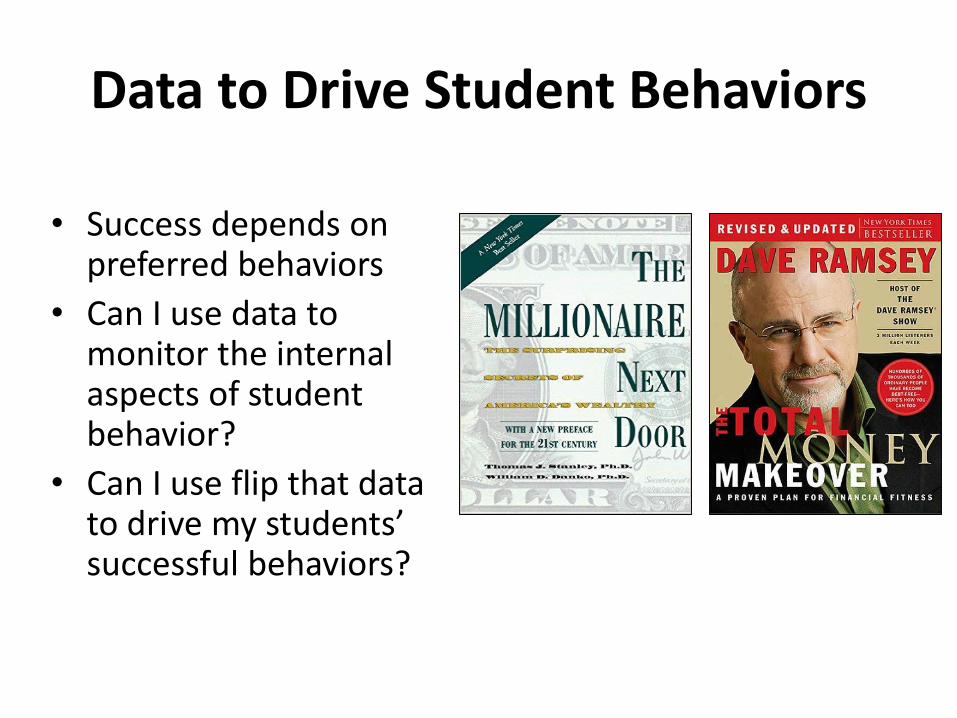
Data to Drive Student Behaviors
• Success depends on preferred behaviors
• Can I use data to monitor the internal aspects of student behavior?
• Can I use flip that data to drive my students’ successful behaviors?

Data to Build Effort
• Students who try harder perform better.
• How do I get students to notice their effort?
• How can they accurately diagnose their effort?

Data to Build Effort

Data to Build Effort
• Hosted periodic data discussions with students.
• The trend is obvious!
• Students can see that as their effort improves, so does their grade.
0
1
2
3
4
5
Wee
k 1
Wee
k 2
Wee
k 3
Wee
k 4
Wee
k 5
Wee
k 6
Wee
k7
Wee
k 8
Wee
k 9
Grade vs Effort
A
B
C
D
F

Data to Build Effort
• At the end of 9 weeks, I plotted each student’s average effort against their mid-term grade.
• This model works for the whole class.
• Overall effort improved for the remainder of the school year. 0
1
2
3
4
5
0 1 2 3 4 5
Effort vs. Grade
A
B
C
D
F

Data to Build Confidence
• Trying to inspire the next generation of scientists
• Student comments from my early teaching years
– “Mr. Bethel, scientists have to be really smart, and I’m just
not smart enough.”
– “You have to be really good at science, and it is not my
strongest subject.”
– “I want to be a scientist, but I am afraid of what it will be
like in college.”

Data to Build Confidence
• In 2011, I started keeping up with my students who graduated, by email.
• As the responses came back, I started to compile the data.
• I share their comments, and the data with my current students.


Data to Build Confidence
• Steady increase in the number of students tracked into STEM majors.
• Some of them already into STEM careers.
• 2016 data still being collected. 0
2
4
6
8
10
12
14
16
18
Students in STEM Majors

Data to Build Confidence

Data to Build Awareness & Support
PROJECT MANHOOD Mentoring Group

Data to Build Awareness & Support
• I sponsor a male mentoring group at NMHS
• Teachers would bring me reports on the performance of entire male population
• This caused me to question:
– Is there a significant difference in the performance of boys compared to girls?
– If there is, can anything be done about it?

Data to Build Awareness & Support
• 500 students failing at least one class: 62 % boys.
• 365 students earning at least one A grade: 59 % girls
754
336
0
200
400
600
800
Total failing grades by gender
Boys Girls
59
41
Percentage of students with A grades by gender
BoysGirls
ACADEMICS

Data to Build Awareness & Support
• 630 total students had at least one discipline referral: 59 % boys.
DISCIPLINE
1263
638
0
400
800
1200
Total referrals by gender
Boys Girls
41
59
Percentage of students with referrals by gender
Boys
Girls
Data to Build Awareness & Support
• S.O.S. – Save Our Sons
• Hosted at the beginning of 2nd semester
• Evening after school
• Boys and their male role models
• Marketed it as a chance to turn things around


Data to Build Awareness & Support
• More than 800 people. More than 450 boys.
• Shared the data with everyone.
• What gets noticed, gets fixed.
• Once you know better, you do better.
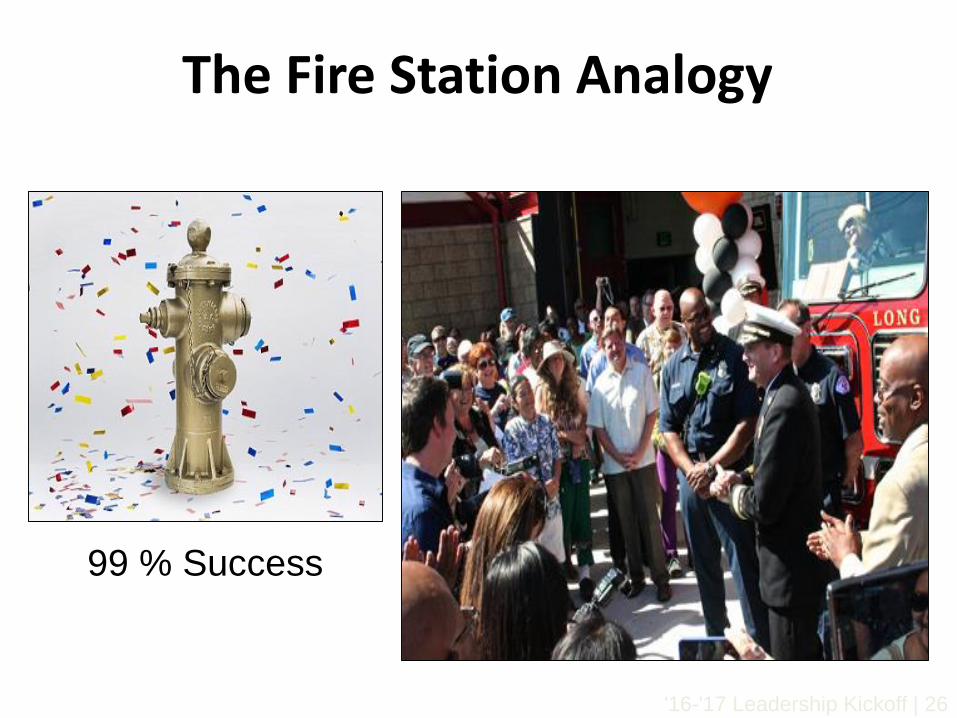
The Fire Station Analogy
99 % Success
'16-'17 Leadership Kickoff | 26

'16-'17 Leadership Kickoff | 27
The Fire Station Analogy
1% Failure

A Story Behind Every Data Point
'16-'17 Leadership Kickoff | 28

Casey M. Bethel
2017 Georgia Teacher of the Year
Email: [email protected]
Facebook: GATeacher
Instagram: 2017GATOTY
Twitter: 2017GATOTY