data systems fault coping for real-time big data analytics … · 2017-06-08 · data systems fault...
TRANSCRIPT
Data Systems Fault Coping for Real-time Big Data Analytics Required Architectural Crucibles
Stephen Cohen
Microsoft Corporation [email protected]
William Money The Citadel, The Military College of South Carolina
[email protected] Abstract
This paper analyzes the properties and characteristics of unknown and unexpected faults introduced into information systems while processing Big Data in real-time. The authors hypothesize that there are new faults, and requirements for fault handling and propose an analytic model and architectural framework to assess and manage the faults and mitigate the risks of correlating or integrating otherwise uncorrelated Big Data, and to ensure the source pedigree, quality, set integrity, freshness, and validity of data being consumed. We argue that new architectures, methods, and tools for handling and analyzing Big Data systems functioning in real-time must design systems that address and mitigate concerns for faults resulting from real-time streaming processes while ensuring that variables such as synchronization, redundancy, and latency are addressed. This paper concludes that with improved designs, real-time Big Data systems may continuously deliver the value and benefits of streaming Big Data.
1. Introduction: Third Generation Processing of Real-time Big Data
Some questions arising from big data, its aggregation, processing, and analysis include [1]: • How do we know when there is corruption, or data
loss in Big Data sets? • What is the value of data if it appears to conflict,
have deficiencies, or to be changed with other data? • How can we know when data are missing, and are
there some data sets that are more critical or important if missing than others?
• What is the impact of missing or corrupt data upon the analysis and subsequent decisions? These issues can arise from faults in the processes
of collection, ingestion, cleansing, integration, and analysis of Big Data. The faults addressed in this paper are defined to be situations where validated algorithms that use Big Data sets encounter mixed type, multiple, asynchronous, combined and interdependent data streams with one or more data sets that do not conform to pre-defined data criteria. Encountering these faults introduces new risks of varying degrees in the quality, utility, and reliability of subsequent conclusions and
decisions. Finally, we recognize that architectures addressing these new faults may themselves introduce operational issues into these systems, such as: how the data should be retained, and how to manage demands for reviews, and restrictions (for audit or legal reasons).
Given the growing number of possible faults in real-time Big Data systems and the increase of associate risks, we hypothesize: H1: New architectural elements are required to increase resiliency, and dependability in Big Data systems. Resilience and dependability are defined for this paper as a system’s ability to recover and return to a known state. This paper presents an architectural framework that will mitigate the increased risk of poor decisions that could be made if decision makers do not account for the faults that may occur.
1.1 Gen 1 and Gen 2 Big Data Systems
We have functionally grouped Big Data processing into three generations as shown in table one below. The table describes our Big Data systems generations and their descriptive and distinguishing characteristics. We will discuss the specific fault conditions and handling performed in these generations of systems in table 1
A simplified overview of the differences between the first two generations Big Data systems reveals that Generation 1 addressed sets and combination issues, and incorporated tools addressing concerns such as interval measurements, interval tracking and latent data analysis. The second generation data systems captured data more rapidly, established analytical rhythms (with predictable circadian variations that might be long term – but known) for analysis frameworks, addressed event detection and reactive response scenarios, and addressed linked Big Data events by mapping downstream actions to the analytical results. In direct comparison to generation 1, generation 2 systems emphasized immediacy and demanded that processing Big Data occur in real-time. As examples, The generation 2 time sensitive issues utilize data that could impact or enable stock trading with sub-second response requirements, identifying systems monitoring, access, authorization, and fraudulent activity anomalies, etc. A second differentiating key concern of the generation 2 systems was accepting and managing
1023
Proceedings of the 50th Hawaii International Conference on System Sciences | 2017
URI: http://hdl.handle.net/10125/41274ISBN: 978-0-9981331-0-2CC-BY-NC-ND
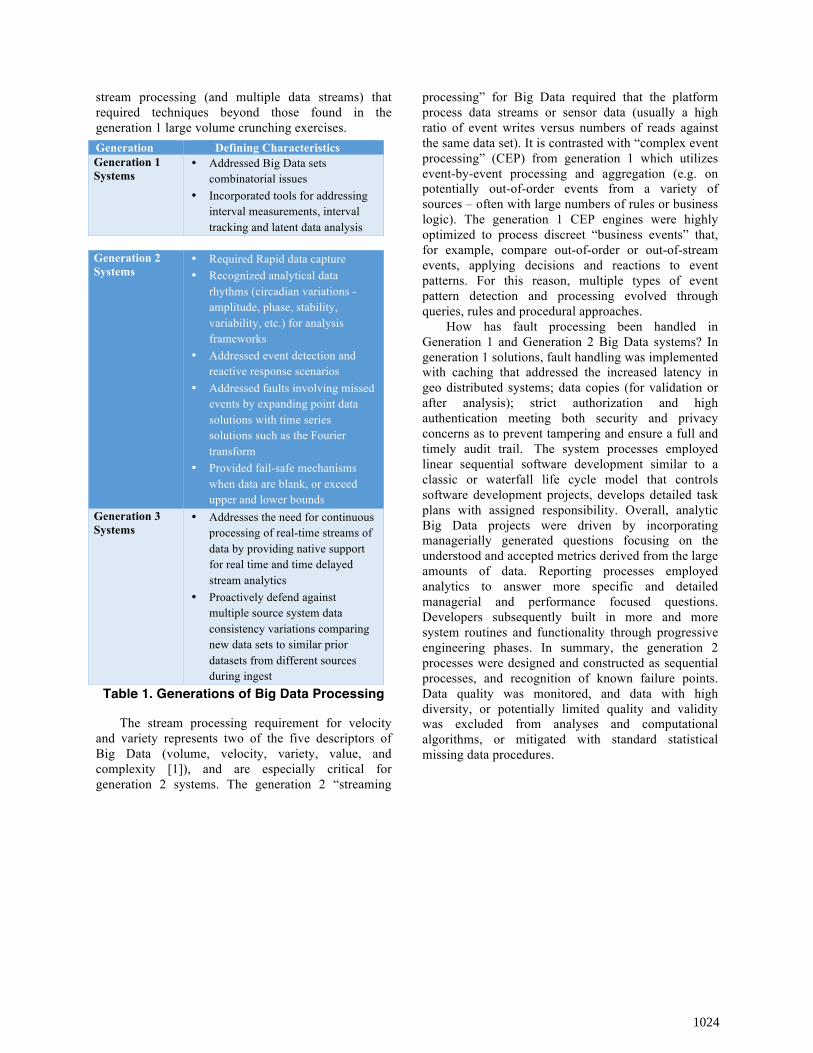
stream processing (and multiple data streams) that required techniques beyond those found in the generation 1 large volume crunching exercises.
Table 1. Generations of Big Data Processing The stream processing requirement for velocity
and variety represents two of the five descriptors of Big Data (volume, velocity, variety, value, and complexity [1]), and are especially critical for generation 2 systems. The generation 2 “streaming
processing” for Big Data required that the platform process data streams or sensor data (usually a high ratio of event writes versus numbers of reads against the same data set). It is contrasted with “complex event processing” (CEP) from generation 1 which utilizes event-by-event processing and aggregation (e.g. on potentially out-of-order events from a variety of sources – often with large numbers of rules or business logic). The generation 1 CEP engines were highly optimized to process discreet “business events” that, for example, compare out-of-order or out-of-stream events, applying decisions and reactions to event patterns. For this reason, multiple types of event pattern detection and processing evolved through queries, rules and procedural approaches.
How has fault processing been handled in Generation 1 and Generation 2 Big Data systems? In generation 1 solutions, fault handling was implemented with caching that addressed the increased latency in geo distributed systems; data copies (for validation or after analysis); strict authorization and high authentication meeting both security and privacy concerns as to prevent tampering and ensure a full and timely audit trail. The system processes employed linear sequential software development similar to a classic or waterfall life cycle model that controls software development projects, develops detailed task plans with assigned responsibility. Overall, analytic Big Data projects were driven by incorporating managerially generated questions focusing on the understood and accepted metrics derived from the large amounts of data. Reporting processes employed analytics to answer more specific and detailed managerial and performance focused questions. Developers subsequently built in more and more system routines and functionality through progressive engineering phases. In summary, the generation 2 processes were designed and constructed as sequential processes, and recognition of known failure points. Data quality was monitored, and data with high diversity, or potentially limited quality and validity was excluded from analyses and computational algorithms, or mitigated with standard statistical missing data procedures.
Generation Defining Characteristics Generation 1 Systems
• Addressed Big Data sets combinatorial issues
• Incorporated tools for addressing interval measurements, interval tracking and latent data analysis
Generation 2 Systems
• Required Rapid data capture • Recognized analytical data
rhythms (circadian variations - amplitude, phase, stability, variability, etc.) for analysis frameworks
• Addressed event detection and reactive response scenarios
• Addressed faults involving missed events by expanding point data solutions with time series solutions such as the Fourier transform
• Provided fail-safe mechanisms when data are blank, or exceed upper and lower bounds
Generation 3 Systems
• Addresses the need for continuous processing of real-time streams of data by providing native support for real time and time delayed stream analytics
• Proactively defend against multiple source system data consistency variations comparing new data sets to similar prior datasets from different sources during ingest
1024

Fault tolerance solutions for streaming
applications aimed at guaranteeing that no data were lost or that no data item was delivered to an application more than once by storing checkpoints for consistency between replicas. Partial fault tolerance methods protecting only the most critical stream operators for processing algorithms are approximate by nature and achieved then acceptable results under data loss and duplicate data delivery. [2] Other techniques used state management processes that enable a distributed stream processing system to accommodate faults by replicating computational states across nodes with checkpoints and active, passive, and upstream backup. [3] Application level check-pointing was used for fault tolerance for tightly-coupled streaming applications using Light-weight Summary Structure (LSS) summarizing the state of the program with a small amount of memory. [4] Implemented at the application levels, Hadoop protects geographically distributed data from network link and node failures using data replication and Heartbeat messages. [5] Photon, Google Advertising System, joins geographically distributed data streams possibly unordered and delayed (web search queries and user clicks on advertisements) by using joined logs derived from key business metrics, including billing for advertisers. It tolerates infrastructure degradation and datacenter-level outages guaranteeing that there will be no duplicates in the joined output (at-most-once semantics) at any point in time, and that most joinable events will be present in the output in real-time (near-exact semantics). [6] Finally, Apache Apec Fault Tolerance uses asynchronous and distributed checkpointing to persistently store with automatic detection and recovery of failed containers, heartbeat, process status notification, buffering for replay of data from a recovery point. [7]
1.2 Generation 3 relies on stream processing
Generation 3 systems are now incorporating real-time streams of data that must perform continuous recursive analysis. Thus, our second hypothesis that new functional capabilities are required in Generation 3 systems to mitigate and correct faults encountered with continuous recursive analysis prior to storage. These systems present new opportunities for faults, and require new detection and correction processes. These systems must be highly scalable, continuously available, fault tolerant with highly flexible fault coping mechanisms designed to quickly respond to detected faults through flexible response mechanism even when a potential or hypothetical fault has not previously been encountered in a functioning system. This has led us to propose a second hypothesis: H2: New functional capabilities are required in Generation 3 systems to mitigate and correct these faults.
Great flexibility is demanded because of the real time processing demands of these systems. Our definition of real-time is based upon Young’s [8] definition where information processing activity must “…respond to externally generated input stimuli within a finite and specified period.” The third generation systems are highly sensitive to time, from both a data ingestion and computation perspective; and must address faults from missing data or errors without introducing latencies or increasing operational risk.
The concern for immediate processing became acute with the addition of real-time computation where consuming applications were presented streams of data that must be processed quickly so decisions can be made to react to changing conditions and situations depicted and known only after the data had been analyzed by the new features and mechanisms.
Generation 1 Generation 2 Generation 3Size Gigabytes Terabytes ExobytesScale Large dedicated system multiple large systems Mesh, Hive, neural netsParticipating Nodes 1 clusters Mesh, Hive, neural netsResponse to Failure stop and restart fail over to replica fail in place with transparent redirection Timing of Response late - after the fact current - at time of failure early - proactive assumption of failureFocus of Processing known query query in context unknown query - gathering all potential dataFrequency of Processing known interval constant within predetermined windows continuousTiming of Prcessing highly latent quickly after data consumption was complete near real timeFrequency of Data Consumption selected period of time known interval continuouslyIntegration of Calculated Values rarely often alwaysEvent Driven singular focus of effort regularly known events always listening and responding to eventsData Quality ongong after storage inline validation with post storage review continuos verification / validation prior to storage
Table 2. Characteristics of Big Data Generations
1025

Generation 3 real-time streaming data can be subjected to real time analysis during ingest prior to storage as well as interacting with multiple sources, select data to be merged into the processing flow, and write or update other databases with the calculated or processed information that is produced by the system [9]
Either may apply “Streaming Analytics” “…continuously calculate mathematical or statistical analytics on the fly within the stream.” [10] High volume data that must be accepted and managed in real-time are well suited to stream processing, but they require systems that are scalable, highly available and very fault tolerant. [10]
Examples are found in processing used to develop a “live DataMart” delivering “…ad-hoc continuous query access to this streaming data that’s aggregated in memory” for an end user. Analytic tools may provide continuous pictures and descriptions of the live data to users viewing the data through an analytic front end [11].
2. Risks and Challenges in Generation 3 Processing of Real-time Big Data
Many generation 3 risks are derived from the stream processing requirements incorporated into the Big Data real-time systems. The risks in the systems are 1) incomplete, missing, or erroneous collections and subsequent incorrect (and unknown) errors in resultant products; 2) failures to interrupt processing when errors are encountered; 3) analysis errors due to the ingestion errors; 4) incorrect decisions. The management challenges are clear – to design and implement systems that have techniques and processes that eliminate or mitigate these risks.
Two major design risks arise when incorporating streaming real-time big data. The inclusion of both unbounded data streams and computational value while each require different system lifecycles, as well as different and new processes, and enhanced physical topologies. Real-time Big Data systems are often simultaneously ingesting data from multiple data sources. Similarly, real-time systems processes are executing and incorporating continuous calculations along temporal dimensions that combine and compare current data with/against raw or summarized past data. The combination of these unique complications bring with them additional risks for faults and potential errors.
The first challenge is to establish a system with multiple ingest processes running in parallel, with detection and response capabilities for one or more inbound data streams that will recognize and mitigate:
• Completely or partially failing Big Data sets and streams. The failure could be a full source outage where inbound data no longer flows or the unexpected intermittently stopping of inbound data.
• Telemetry flat-lining where each source system is pre-determined to be good or bad if the telemetry becomes consistent for a known period of time.
• Exceeding minimum or maximum expected values for a known period of time.
The second challenge is to use computed values from recent or past data sets in calculations with current data creating a new version of recent output for the next cycle without errors by designing and providing a means to: • Isolate and potentially remove any or all erroneous
inbound data. Consider a daily average across 100 sensors based on values from 0700h – 0700h the following day. If 25% of the sensors fail to report, the calculated rolling average would be incorrect.
• Identifying stuck sensor data where if the 100 sensors expected values are between 1-10 and some ‘stick’ on 100, the resulting calculations are wrong.
• Maintain processes that are constantly aware of the current and future usage of the data.
• Maintain raw data transmitted in a data lake or similar archive.
• Use corrected data with erroneous data, if business appropriate, marked or removed, as the ‘new’ working set.
• Maintain a separately secured and managed audit trail (for verification, maintenance, or comparison and simulation of other such events to develop further responses).
3. Generation 3 Real-time Big Data: An Emerging Problem Space
The faults are described in the examples presented below, and in the methodologies and techniques for handling the unanticipated circumstances. [12]
They have been encountered in a wide variety of applications such as Air Traffic Control Systems, defense and space systems, as well as the growing group known as IoT or “Internet of Things’ systems. Historically, these systems have been categorized from various perspectives including “… factors outside the computer system and factors inside the computer system.” [13] They have both hard and soft real-time temporal completion deadlines with varying
1026

consequences if processing or results are incorrect. Losses may be important in soft deadline real-time systems, but truly horrendous in hard deadline real-time systems. [14] Systems may also be fail-safe or fail operational. Fail safe means that when the system enters a state that is unreliable it will produce a result that will be safe. An example is a traffic light that blinks yellow or red if it cannot correctly monitor and control traffic. Fail-operational systems require faults to be identified and either isolated or addressed without a notable reduction in primary operational metrics. The methods of achieving the required predictability have been addressed through static and dynamic scheduling of systems tasks. This ensures that they will meet deadlines. Static scheduling means that the scheduling decisions are set at “compile time” or historically when system files are joined offline. Conversely, dynamic scheduling enables schedulabilty tests to ascertain whether or not the tasks can be performed by the set deadlines. [15]
3.1 Generation 3 Real-time Big Data Faults Cannot Be Solved with Previous Solutions and Techniques
As discussed, generation 3 Big Data systems present more complex problems. They could be seen as “context aware” in that they may be viewed using an analytical model with recursive subsystems that require many successful executions to support complex decision making.
The proposed analytical model for fault identification, detection, and mitigation process utilizes non-linear interactive phases: Phase Description 1 Auto monitoring and recognition of the
inbound data streams, metadata, characteristics, and data sets
2 Identifying potential duplicate or corresponding data sets predicted relationships (equal, non-duplicative, predicted sequencing)
3 Identifying direct and indirect critical relationships impacting results, conclusions, or decisions. Identifying compensatory actions (mandatory, optional)
4 Designing reactive subsystem procedures 5 Designing proactive intervention points and
steps 6 Integrating steps and subsystems actions at
the system level 7 Mapping of actions and outcomes at system
level
Table 3. Proposed analytical phases These proposed analytic phases do not describe
how any particular designer should proceed with the systems but rather offer our introductory approach for appropriate phases of analysis. In each system, subsystem inputs must handle concurrent processing of the live, raw, and processed data. The system must dynamically (and automatically) adjust its processing based on contextual metadata and apply the adjustments to one or more concurrent instances. The actual responses designed will depend on the data streams incorporated into system, characteristics of the decisions impacted, and alternatives available. A generic list of tentative responses that designers may build into use is presented in table 4.
Actionable Responses to Faults Types 1 Stream data removal (full) 2 Stream substitution 3 Inject alternative known set4 Replace values
(partial) 4 Utilize historical data (smoothed/raw) 5 Questions and Research on Real-time Big Data
Decision Making Risks 6 New working creation (excluding data0 7 Roll back (to old set) 8 Managements alerts (as specified)
Table 4. Preliminary Streaming Data Response Descriptions
The generation 3 real-time systems processing
streams of Big Data pose a number of key risks that must be s6ystematically addressed. Decision makers must ask, what is the impact upon the analysis? Is confidence in the system or the result (expressed as a statistical measure of significance and confidence) reduced if data are missing, incorrectly included, or even intentionally changed? (And how can a decision maker determine this?) New (or heightened) risks and limitations will include how to set or determine analysis results that may set time limits on the validity of conclusions, sensitivity of the results or conclusions to erroneous, distorted, or missing data in a stream, linkages between the risks of error in the data streams, and consequences of decisions made in immediate time frames.
Architectures and designs must include not only analytical components for performing required calculations, but risk assessment applied through knowledge engines that transmit immediate signals or issues, and establish limitations on consequential decisions. Fault events must be responded to base on the data and business objectives of the decision outcomes. The systems must incorporate confidence assessments, and contingencies (showing limits under varying fault and unknown situations), trends and
1027

changes in inflection points, and deltas in the data streams. Methods of communicating this information may require dashboards and notification tools that meet today’s managers’ needs for high mobility and immediate information (leading to knowledge) that is not location or time dependent.
We have developed a meta data set that must be collected on the streaming Big Data sets for generation 3 systems. It includes: stream frequency, time (collect, ingest), synchronicity, rhythmic properties, bounds, etc. Subsequent violations of the meta data predicted or expected characteristics would invoke (as appropriate): detailed testing, rule application (exclusion, substitution, alternate insertions), other instream actions, processing changes, and warnings or halts to decisions and actions. As designers specify generation there systems, the meta data will be developed and actionable steps specified.
5. Examples of Big Data in Real-Time Applications and Tools
The architectures and supporting infrastructures required to manage streaming Big Data across a large geographically diverse set of federated sensors are subject to latency, connectivity, and recursive dependencies. For example, huge amounts of data are captured every second from the national power grid infrastructure which accumulates measures taken by SCADA, and Phasor Measurement Units (PMUs), which capture sub second resolution. This was reported to be over 10 terabytes of raw data per month in 2014. [16] Identifying potential failures, maintenance focus areas, and detecting externally created anomalies are just a few of the critical activities trying to simultaneously consume, process, and alert against this and similar huge datasets. The additional examples in the table below illustrate the magnitude and complexity of these systems and their potential faults.
In the near and not too distant future the sheer magnitude of data, and its near real-time analysis will have profound impacts on public safety and daily life. During a recent Google conference Google claimed to have more than a billion objects in their internet graph. People, places, and activities are all connected through well-known and lesser seen forces. In their University of California, Davis publication “Large-Scale Graph Visualization and Analytics” Kwan-Liu Ma and Chris W. Muelder, provide various visualizations of data including potential terrorist network identification. [17]
Huge amounts of data are captured from infrastructure such as the national power grid which accumulates measures taken by SCADA every second, and Phasor Measurement Units (PMUs), which capture
sub second resolution. In 2014 it was reported to be over 10 terabytes per month of raw data. [16] Identifying potential failures, maintenance focus areas, and detecting externally created anomalies are just a few of the critical activities trying to simultaneously consume, process, and alert against the dataset.
FAA flight control system
Description - A real-time application that replaces the computer systems controlling air traffic in the US.
Goals The En Route Automation Modernization (ERAM) is “…expected to increase air traffic flow, improve automated navigation and strengthen aircraft conflict detection services, with the end result being increased safety and less flight congestion.” [18]
Functionality Processes critical data that include aircraft identity, altitude, speed, and flight path.
Dependencies Critical to other key air traffic control systems that will be completed under the overarching NextGen technology upgrade plan. These systems include: (1) Performance Based Navigation (PBN), which implements procedures that enable controllers and flight crews to know exactly when to reduce the thrust on aircraft so they can then descend from cruising altitude to the runway with the engines set at idle power; (2) Automatic Dependent Surveillance-Broadcast (ADS-B), a satellite-based system that receives information from aircraft equipped with ADS-B that are displayed so controllers can maintain radar-like separation for aircraft operating where no radar is available (Gulf of Mexico, parts of Alaska). (3) Data Comm: enables controllers and pilots to communicate by direct digital link (similar to text) rather than voice. [19]
Success Metrics:
Integrate the applications, and protecting current and new air-traffic control information systems, ensure that aircraft avionics that operate and guide aircraft deliver correct and complete data to the controllers and systems; doubles the number of flights that controllers can display and track.
FAA Data, Visualization, Analysis, and Reporting System (DVARS)
Description: To improve the capability to access data and perform analyses on NAS operations for decision making analysis.
1028

Goals: Processes data and include metrics, reports, and briefings that the FAA uses to help identify deficiencies and performance gaps.
Functionality: A data warehouse with capacity of 250 TB; visualization of 50,000 geo-referenced flight trajectories; flight supporting data such as airspace volumes and weather; synthesizing 4500 flight trajectories / hour; incorporate three years of data in the production database. [19]
Dependencies: Huge quantities of data. A passenger aircraft in-flight - Boeing 787 creates half a terabyte of data per flight; other aircraft component generate data and passenger generated telemetry force off-lining original data in many data centers; each different part of the plane is telling us what it is doing as the flight is going on. [20]
Success Metrics:
Improve access to data and perform analyses on NAS operations.
Tacoma Public Schools Child Data Description: A data-driven, outcomes-based
analytic program to “Measure the Whole Child” [21].
Goal: Leverage all test score, attendance, and interaction with the school systems to create predictive models that helped teachers and administrators increase graduation rates from 55% to 78%.
Functionality: Include data spanning five years for students from grades 6 through 12.
Dependencies: Student demographics, academic and student performance information; algorithms to predict if a student would be at risk of dropping out the following semester.
Success Metrics:
Almost 90 percent accurate. [21] Graduation rates increased from 55% to 78%.
Table 5. Example Big Data Solutions
6. Designing Systems with Fault Tolerance and Resilience
6.1 Technical Architecture Requirements for a Resilient New Design
To be resilient, Generation 3 systems must demonstrate two characteristics. The first ability is to tolerate fluctuations in the control systems without impacting normal operations. [5] The second is the ability to return to its original operating state after a disruption. [22]
For generation 3, a primary software and hardware architectural environment is proposed to manage the risks and serve as a crucible for merging Big Data that may be drawn from the Internet-of-Things (IoT), systems of systems, and multiple converging data and sources. The environment discussed in section 6.2 below addresses fault tolerance and the controlled and careful mixing and merging of these diverse data. The system architecture is based on complex operating models, and utilizes multiple infrastructure and object instances to achieve high levels of availability and to protect data consistency. Predefined low level services, explicit configuration, and device monitoring are combined to address many of the opportunities for error and distortions of the raw data that would quietly corrupt the resulting analytical findings.
It is useful to consider an example of the initial methods used to accomplish this by a user of streaming big data, As of April 2016, LinkedIn reported having 433 million users with 106 million unique site visits per month from 200 countries. [23] In their description of how LinkedIn evolved their data ingest process Das and Qiao [24] identified the following as common requirements of the LinkedIn continuous ingest process; • Centralized data lake: standardized data formats,
directory layouts; • Standardized catalog of lightweight
transformations: security filters, schema evolution, type conversion, etc;
• Data quality measurements and enforcement: schema validation, data audits, etc;
• Scalable ingest: auto-scaling, fault-tolerance, etc.
All of these are typical characteristics of large multi-tenant ingest solutions. All strive to create and maintain a standardized high quality information set. However, these useful techniques are limited because they only address the ingestion (front end) platform, but do not compensate for critical streaming real-time Big Data systems. These systems require the artful combination of a control plane, data plane, and management plane. We propose a system level version of the traditionally network layer routing concepts. [25]
In our proposed architecture, the control plane provides a context and is exposed with a consistent interface (API) to directly interact with the devices. The control plane operations may be actual commands, such as on or off or they may be control commands passing parameters to be consumed by the receiving device, a set of devices, or a class of devices causing them to vary in a specific operational way.
1029

The management plane is a separately secured and managed segment of the overall system management structures focused on ownership by providing allocation of resources, provisioning of the devices on and off the system as well as management users. A few examples include; provisioning and setting lease durations for connected devices. The management plane also contains the mechanics of communication between data sources and data ingest.
The data plane is focused on processing data, storage and tools optimization. The data plane is not aware of how the management plane connects sources and the management plane is not aware of the physical layout of the ingested or computed data. The data plane ensures data integrity, provides the means to monitor and roll back, as well as providing the only direct access to the raw data.
These design planes may be understood more easily by the following analogy that describes how the planes in routers perform distinct activities. These planes (1) process the transit traffic in the data plane; (2) utilize protocols to determine what else is going on around the router in adjacent devices and typology through the control plane protocols; and (3) communicate and relate with the Network Management Systems interfaces and subnet protocols, etc. through the management plane. All the control-plane protocols and data are combined into databases used for forwarding and routing the transit traffic. It is clear from the example that these planes recognize components and states, perform auditing and logging, and signal errors. [26]
The planes required in the streaming real-time Big Data systems must perform somewhat similar but highly more complex functions. The will require the meta data previously described, more detailed rules that govern their potential situations, states, and actions; and the management planes to implement the required actions as conditions are encountered.
6.2 Architecture, System Design, and Development are Interdependent
The model below [Fig 1] is a notional high level design for a real-time Big Data system. The Ingest pipeline feeds the event processing engine, stream analytics, data lakes, then structured storage in that order. The sequencing is driven by the inherent need to prioritize activities, and work with differing levels of risk among the various workflows and processing chains. In this high level design, the event processing engine receives the first, least latent pass on the inbound data to do integrity checking, mandatory auditing and related logging, as well as initiating additional simple value and range-based processing. If
there is a failure the system will have ‘black box’ recording to do post mortem and forensic analysis. The next processes to get access to the data are the stream analytics, because after the security and integrity checks, the stream analytics require the closest to real-time access. A failure after the stream analytics read the raw data would still result in data loss but the real-time calculations that typically drive user facing interfaces, such as dashboards will have been updated. The next step in this design ensures long term data safety. Raw data is added to the un-sorted, un-processed data lake for later retrieval and analysis. Only after all of the safety systems are fed and the write transactions are complete will the latent instances
of the data be exposed for consumption by long running processes.
This architectural design is intended to ensure the overall system needs remains a first class citizen in parity with the data ingest and reporting subsystems. The physical topology supporting and hosting backing real-time Big Data systems is also unique. Early, Big Data systems have leveraged a scale up resource model incorporating large, internally redundant disk arrays and compute subsystems. As the volume, speed of ingest, and number of source systems ballooned even the current legacy systems are moving to include scale out models. As data centers have matured the topologies have improved. Large, cold, white rooms have been replaced by hot / cold aisle layouts. And in many cases commodity hardware has replaced mainframes. The largest hosting providers created redundant systems spread across some distance for disaster recovery objectives. Failover scenarios were replaced with high availability and eventually with highly resilient continuity of operations designs. Resilience is achieved by; protecting the information inflight, in process, and at rest. Inbound data must have accompanying meta data for providence, and some minimal form of reliable hash to mitigate
Figure 1. High Level Conceptual Design
1030

tampering; ensuring availability of the systems and applications through redundant topologies, shared and duplicative state management, and transactional boundaries to ensure complete writes, and by implementing systems that can communicate and appropriately respond when required.
Consuming and storing large data sets are only one step in the Big Data process. Including real-time needs expands the problem space to include verification and validation; security and post failure forensics; and raw, computed and statistical dataset management. To be successful, a generation 3 Big Data architecture must support all of these needs. The hardware, network, communication, security, and identity are extremely inter-dependent. This is a significant shift from the older style of highly co-dependent structures which placed data consistency, manageability, and recoverability well behind performance, and scalability. The components of the overall solutions are independently strong, self-contained, and capable of managing most of their own lifecycles. They are equal contributors to the success of the overall solution and their volatility is well managed with limited impact on the other participating components. At its best, the solution components are externally reliable, scalable, and secure.
There is a necessary emphasis on security for generation 3 systems. Successful real-time Big Data systems are subject to attack while ingesting data, during pre-processing, storage, and again when latent processing occurs. But the defensive and reactive practices can be equally damaging. Each of the workloads have their own attack surfaces and threat vectors. Attempting to address all of them at once would induce an unacceptable level of delay in the system. To address this, we drive parallel processing with prioritization in the threading and intentional transactional boundaries around the slower, more latent activities. This allows us to implement governance in a concrete way.
In addition to clarity in architecture, a well thought out hardware and network topology and diligently applied levels of security, a heathy real-time Big Data system requires a high level of organizational maturity. Not just mature for consistency of operations, but a maturity that allows the organization's culture to adopt the latest in methodologies. Solution development and operations must share a DevOps process. Firewalled applications and data storage need to become composable services sharing a service fabric. These are key elements to operationalizing multiple requirements from multiple constituencies, current and future, both known and unknown.
7. Conclusions
The primary software and hardware architectural environment described above acts as a highly interactive milieu for merging Big Data that decision makers will draw from the IoT, systems of systems, multiple and multiple converging data and sources. It utilizes the fault tolerant architectural design to control and fuse these diverse data for managerial decision making. The system architecture is mature, and resilient because it flexibly addresses the many fault situations where errors, distortions and misinterpretations of the raw data and the analytical findings can lead to incorrect or inappropriate decisions and events. Stakeholders relying on the results from a system based on this analytical model, fault analysis, and architecture, will have a more complete understanding of the risks and limitations of real-time Big Data analytics, and a full appreciation of why the findings and results must be carefully and strictly applied to capture the value and positive benefits from big data.
8. References
[1] Kaisler, S. Armour, F., Espinosa, J. A., & Money, W. (2013, January). “Big data: issues and challenges moving forward,” In System Sciences (HICSS), 2013 46th Hawaii International Conference on System Sciences (pp. 995-1004). IEEE.
[2] Jacques da Silva, G. Partial fault tolerance in stream processing applications-methods and evaluation techniques, (Doctoral dissertation, University of Illinois at Urbana-Champaign), 2010.
[3] Madsen, K. G. S., Thyssen, P., & Zhou, Y. “Integrating fault-tolerance and elasticity in a distributed data stream processing system”, In Proceedings of the 26th International Conference on Scientific and Statistical Database Management, 2014, June. p. 48. ACM.
[4] Zhu, Q., Chen, L., & Agrawal, G. “Supporting fault-tolerance in streaming grid applications”, In Parallel and Distributed Processing, IPDPS April, 2008. IEEE International Symposium, April, 2008 (pp. 1-12). IEEE.
[5] Cowsalya, T., and S.R., Mugunthan. “Hadoop Architecture and Fault Tolerence Based Hadoop Clusters in Geographically Distributed Data Center”, ARPN Journal of Engineering and Applied Sciences. April, 2015, Vol. 10: No. 7. Pp. 2818-2821.
[6] Ananthanarayanan, R., Basker, V., Das, S., Gupta, A., Jiang, H., Qiu, T., & S. Venkataraman, “Photon: fault-tolerant and scalable joining of continuous data streams,” In Proceedings of the 2013 ACM SIGMOD International
1031

Conference on Management of Data ACM. 2013, June, pp. 577-588.
[7] “Fault Tolerance and Processing Semantics in Apache Apex.” http://www.slideshare.net/ApacheApexOrganizer/webinar-fault-toleranceandprocessingsemantics
[8] Young, S. J. Real-time languages: Design and development, Ellis Horwood, Chichester, 1982.
[9] Juvva, K. Real-Time Systems. Carnegie Mellon University, Pittsburg, Spring 1998. https://users.ece.cmu.edu/~koopman/des_s99/real_time/ Last accessed 4-23-2016.
[10] S. M. Mitchell, and M.S. Mannan, "Designing Resilient Engineered Systems," Chemical Engineering Progress 102 (4), April 2006, pp. 39–45.
[11] Mall, R. Real-Time Systems: Theory and Practice, Pearson Education, India, 2009. https://books.google.com/books?id=coPT7vaEjFsC
[12] D. A. Rennels, "Fault Tolerant Computing," http://web.cs.ucla.edu/~rennels/article98.pdf Last accessed 6-14-2016.
[13] K. Wahner, "Real-Time Stream Processing as Game Changer in a Big Data World with Hadoop and Data Warehouse," InfoQ, Sep 10 2014. http://www.infoq.com/articles/stream-processing-hadoop Last accessed 4-23-2016.
[14] Pressman, R. S. Software Engineering. McGraw Hill, New York. 2001.
[15] J. Kreps, "Putting Apache Kafka To Use: A Practical Guide to Building a Stream Data Platform (Part 1)," February 24, 2015. http://www.confluent.io/blog/stream-data-platform-1/ Last accessed 5-1-2016.
[16] Parashar. M. “Big Data Analytics for Power Grid Operations,” IEEE-Northwest Energy Systems Symposium (NWESS). Alston Grid, Inc. May 1, 2014.
[17] K. L. Ma, and C. W. Muelder, "Large-Scale Graph Visualization and Analytics," Computer. Vol. 46:7. July 2013. pp. 39-46. https://www.computer.org/csdl/mags/co/2013/07/mco2013070039-abs.html Last accessed 6-14-2016.
[18] "Just completed ERAM system almost doubles the number of flights that can be tracked in US airspace," Network World, Apr 30, 2015. http://www.networkworld.com/article/2917198/software/faa-
2-million-lines-of-code-process-new-air-traffic-system.html Last accessed: 5-31-2016.
[19] Data, Visualization, Analysis, and Reporting System (DVARS) Draft Section C, Statement of Work (SOW). February 29, 2016. https://faaco.faa.gov/index.cfm/announcement/view/23741 Last accessed 5-31-2016.
[20] M. Finnigan, "Boeing 787s to create half a terabyte of data per flight, says Virgin Atlantic," ComputerWorldUK. March 6, 2013. http://www.computerworlduk.com/news/data/boeing-787s-create-half-terabyte-of-data-per-flight-says-virgin-atlantic-3433595/ Last accessed 6-7-2016.
[21] Microsoft Customer Stories, "Predicting student dropout risks, increasing graduation rates with cloud analytics," August 5, 2015. http://enterprise.microsoft.com/en-us/industries/citynext/tacoma-public-schools/ Last accessed 6-7-2016.
[22] Dictionary.com "resiliency," in Collins English Dictionary - Complete & Unabridged 10th Edition. HarperCollins Publishers. Dictionary.com http://www.dictionary.com/browse/resiliency Last accessed: 6-12-2016.
[23] C. Smith, "By the Numbers: 125+ Amazing LinkedIn Statistics," Digital Stat Articles, DMR. June 2, 2016. http://expandedramblings.com/index.php/by-the-numbers-a-few-important-linkedin-stats/ Last Accessed 6-7-2016.
[24] S. Das, and L. Qiao, "Gobblin' Big Data With Ease," LinkedIn.com. November 25, 2014. https://engineering.linkedin.com/data-ingestion/gobblin-big-data-ease Last accessed 6-7-2016.
[25] I. Pepelniak, "Management. Control, and Data Planes in Network Devices and Software," inSpace, August 13, 2013. http://blog.ipspace.net/2013/08/management-control-and-data-planes-in.html Last accessed 6-2-2016.
[26] Vachon, B., "CCNA Security Portable Command Guide: Network Foundation Protection," in CCNA Security (640-554) Portable Command Guide. Cisco Press, CiscoPress.com. May 18, 2012.
1032