data smoothing, trend analysis and harmonic analysis of data data... · trend analysis...
TRANSCRIPT

4. Data smoothing, Trend analysis and Harmonic analysis of data
Dr. Prasad ModakEnvironmental Management Centre, Mumbai
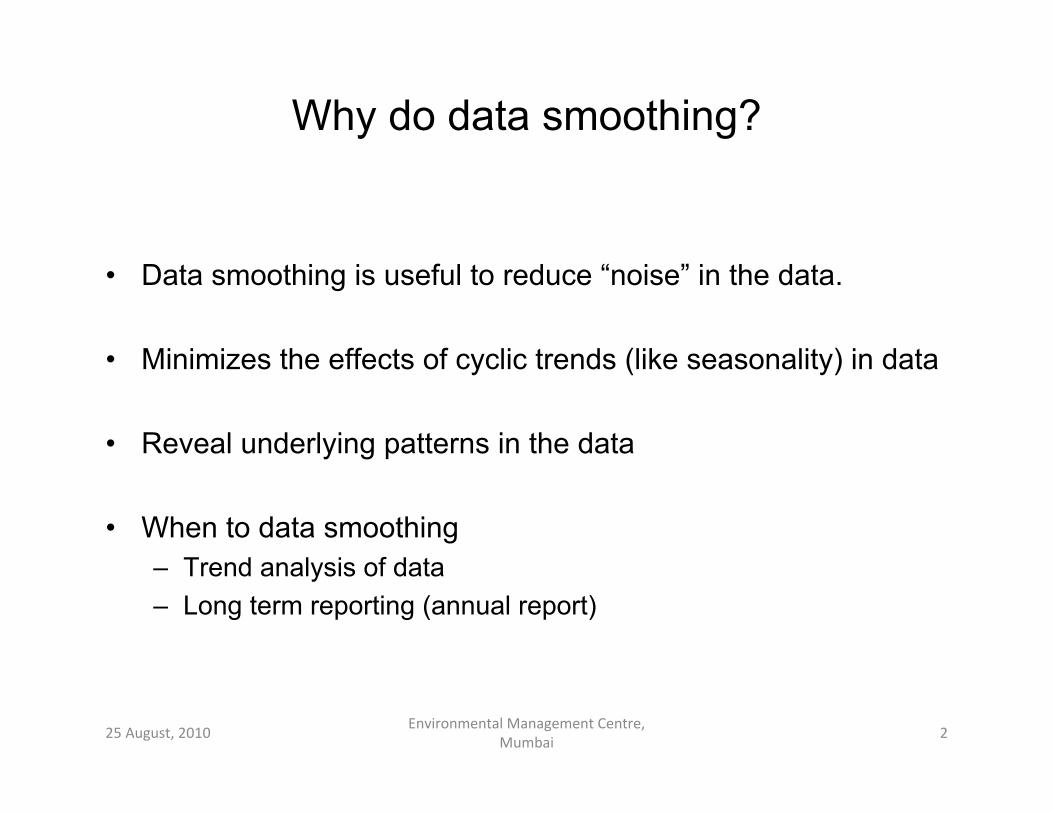
Why do data smoothing?
• Data smoothing is useful to reduce “noise” in the data.
• Minimizes the effects of cyclic trends (like seasonality) in data
• Reveal underlying patterns in the data
• When to data smoothing– Trend analysis of data – Long term reporting (annual report)
25 August, 2010Environmental Management Centre,
Mumbai2
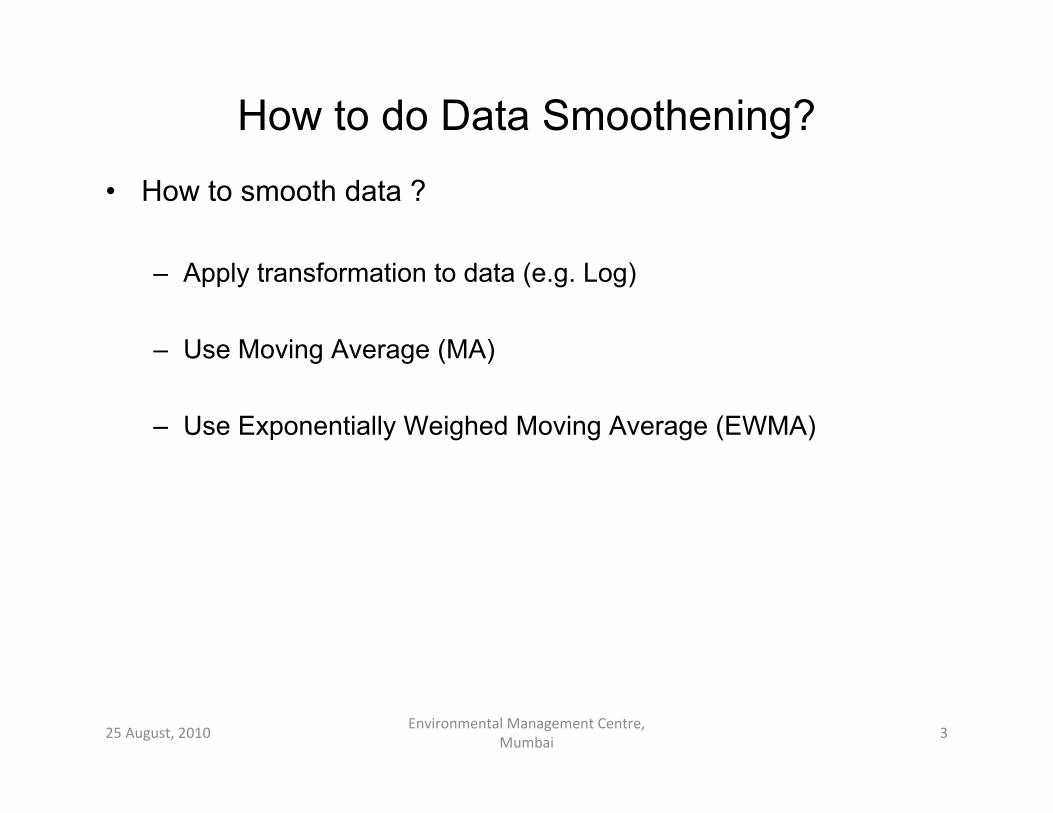
How to do Data Smoothening?
• How to smooth data ?
– Apply transformation to data (e.g. Log)
– Use Moving Average (MA)
– Use Exponentially Weighed Moving Average (EWMA)
25 August, 2010Environmental Management Centre,
Mumbai3

Using Log Scale • Take log10(number) of numbers• Very effective for large numbers
25 August, 2010Environmental Management Centre,
Mumbai4

Using Moving Average
25 August, 2010Environmental Management Centre,
Mumbai5
∑+−=
=i
kijji y
kky
1
1)(

Exponentially Weighted Moving Average
• EWMA gives more weightage to recent data than older data
• Influence of older data are essentially reduced in exponential
manner during smoothening
• It has a feature , which denotes the “memory” of the
system
• Lower denotes lower memory
• Equation is given by
• EWMA could be updated using:
25 August, 2010Environmental Management Centre,
Mumbai6
jioj
ji yZ −
∞
=∑ΦΦ−= )1(
Φ
Φ
iii yZZ )1(1 Φ−+Φ= −

Example of EWMA
25 August, 2010Environmental Management Centre,
Mumbai7
Φ = 0.9Φ = 0.3

Trend Analysis (Spearman's Rho)
• Trend in environmental data
– Seasonal
– Non-seasonal
• Spearman’s Rank Correlation Coefficient is often denoted by ρ.
• Spearman’s Rho can be calculated and then compared to standard values to test the significance of the trend.
• Positive or negative ρ value indicate positive or negative trend
• Trend could be compared with standard values at a definite level of significance (90% or 95%) and N-2 degrees of freedom
25 August, 2010Environmental Management Centre,
Mumbai8
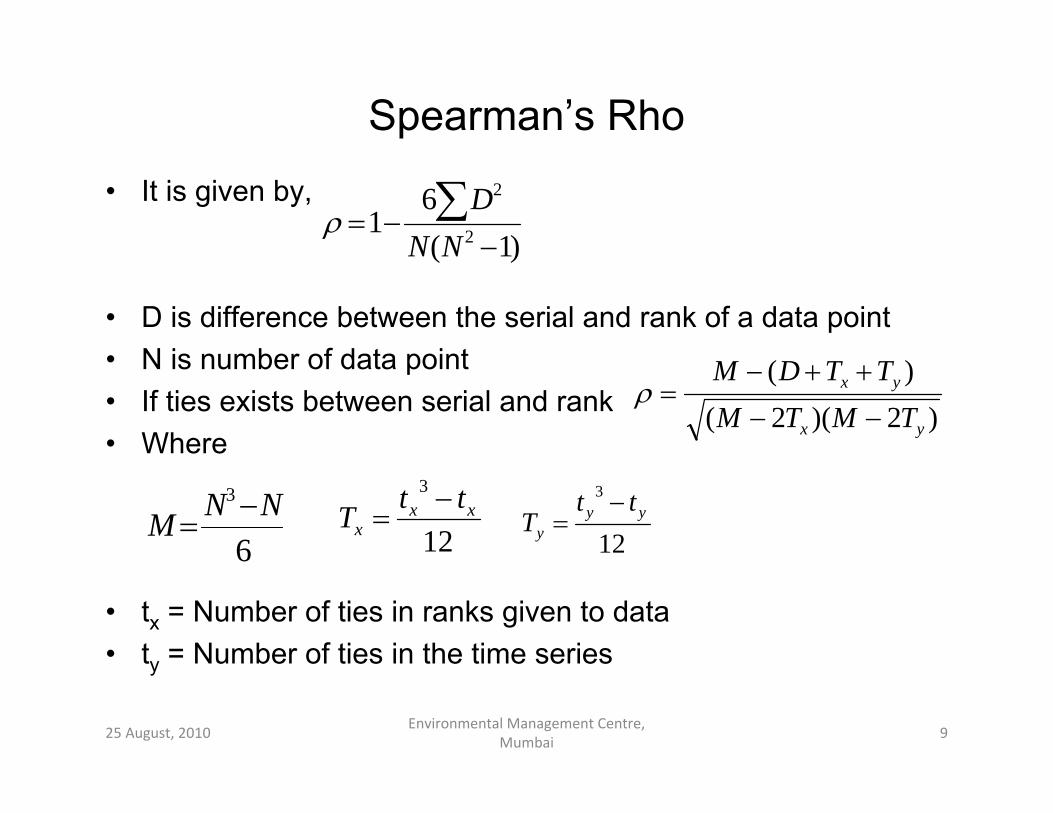
Spearman’s Rho
• It is given by,
• D is difference between the serial and rank of a data point• N is number of data point• If ties exists between serial and rank• Where
• tx = Number of ties in ranks given to data• ty = Number of ties in the time series
25 August, 2010Environmental Management Centre,
Mumbai9
)1(6
1 2
2
−−= ∑
NND
ρ
)2)(2()(
yx
yx
TMTMTTDM−−
++−=ρ
6
3 NNM −= 12
3xx
xttT −
=12
3yy
y
ttT
−=

Example Spearman’s Rho
25 August, 2010Environmental Management Centre,
Mumbai10
DO of Bhima River at Takli Month 2009 2010
Jan 6.22 5.95Feb 6.12 6.56Mar 6.01 4.61Apr 4.2 5.94May 5.1 5.25Jun 5.2 6.9Jul 5.49 6.25
source : MPCB website
Month 2009 Serial no. Rank Ties Month 2010 Serial no. Rank TiesJan 4.2 4 1 Jan 4.61 3 1Feb 5.1 5 2 Feb 5.25 5 2Mar 5.2 6 3 Mar 5.94 4 3Apr 5.49 7 4 Apr 5.95 1 4May 6.01 3 5 May 6.25 7 5Jun 6.12 2 6 Jun 6.56 2 6Jul 6.22 1 7 Jul 6.9 6 7
D= 92 D = 44
Example ….contd..
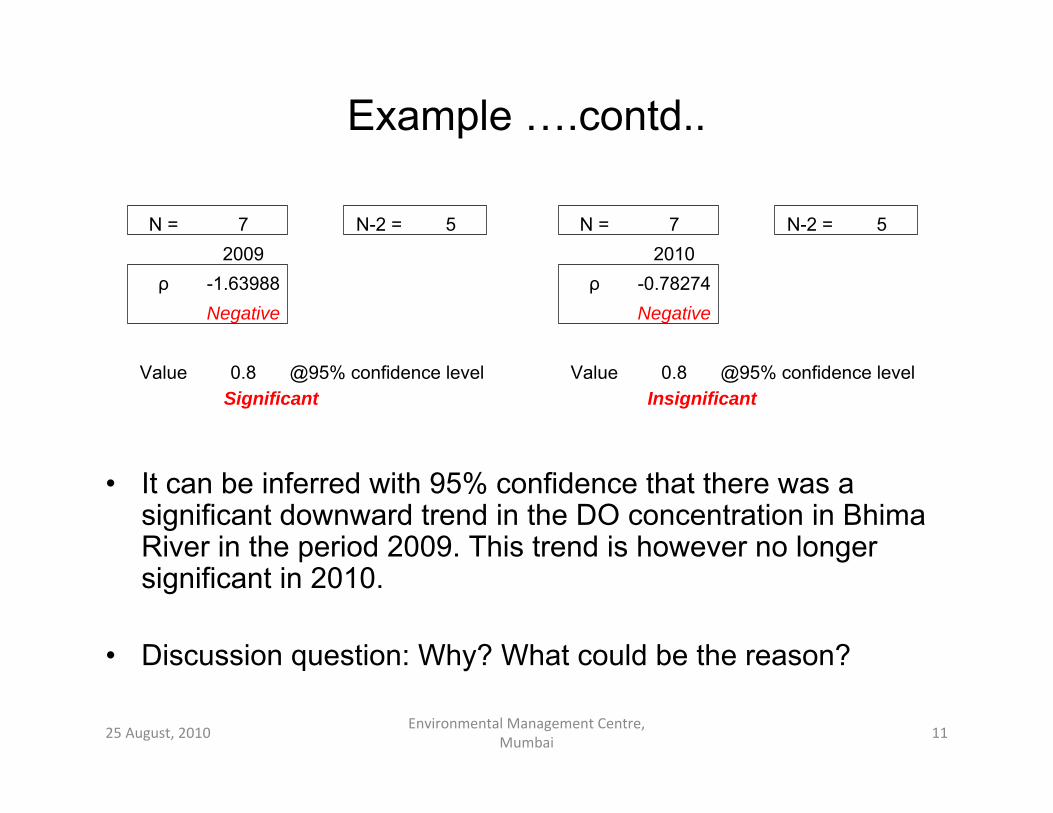
• It can be inferred with 95% confidence that there was a significant downward trend in the DO concentration in Bhima River in the period 2009. This trend is however no longer significant in 2010.
• Discussion question: Why? What could be the reason?
25 August, 2010Environmental Management Centre,
Mumbai11
N = 7 N-2 = 5 N = 7 N-2 = 52009 2010
ρ -1.63988 ρ -0.78274Negative Negative
Value 0.8 @95% confidence level Value 0.8 @95% confidence levelSignificant Insignificant
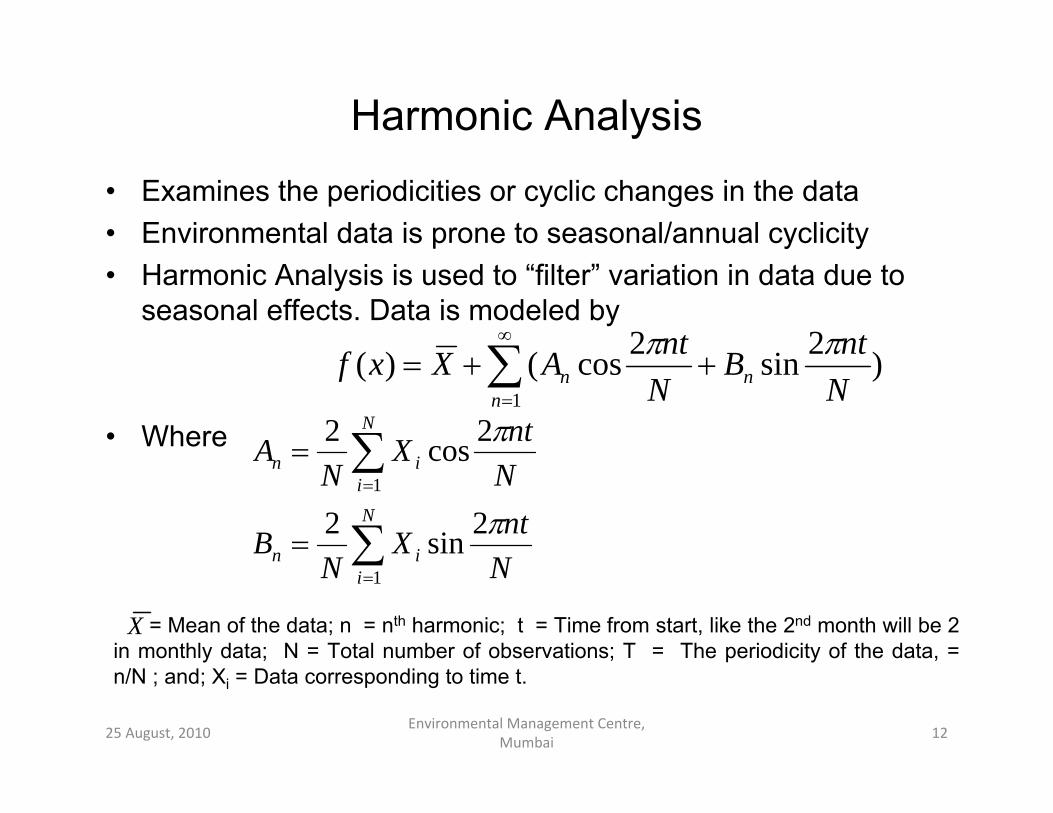
Harmonic Analysis
• Examines the periodicities or cyclic changes in the data• Environmental data is prone to seasonal/annual cyclicity• Harmonic Analysis is used to “filter” variation in data due to
seasonal effects. Data is modeled by
• Where
25 August, 2010Environmental Management Centre,
Mumbai12
)2sin2cos()(1∑∞
=
++=n
nn NntB
NntAXxf ππ
∑
∑
=
=
=
=
N
iin
N
iin
NntX
NB
NntX
NA
1
1
2sin2
2cos2
π
π
X = Mean of the data; n = nth harmonic; t = Time from start, like the 2nd month will be 2 in monthly data; N = Total number of observations; T = The periodicity of the data, = n/N ; and; Xi = Data corresponding to time t.

Harmonics …contd…• In the harmonic series, if the calculation has been done for m
harmonics, then sum up to n = 1 to m instead of ∞.
• Variance in the observed record accounted for by each harmonic is given by the following formula
• where σ2 is the total variance in the observed data. • p indicates which period is dominant in the data. • The largest value of p will show the most dominant period.25 August, 2010
Environmental Management Centre, Mumbai
13
2
2
2
1
22 )(21
σσ
σ
n
n
N
tn
p
BA
=
+= ∑=
where
2σ

Example of Harmonic Analysis
25 August, 2010Environmental Management Centre,
Mumbai14
0.00
5.00
10.00
15.00
20.00
25.00
30.00
35.00
Temperature Mean 3rd Harmonic Estimate

Additional Points
• Trend Mapping – How could this mapping system be used for “source diagnosis”?
• Can Model for Harmonic Analyses be used for predictions?
• What if harmonics for flow and concentration show different lags or contribution to Variance?
25 August, 2010Environmental Management Centre,
Mumbai15