data representation and fundamental algorithms - …aht/vis2014/viz3.pdfdata representation and...
TRANSCRIPT

Data Representation and Fundamental Algorithms
Anders Hast

Info
rmat
ions
tekn
olog
i
Institutionen för informationsteknologi | www.it.uu.se
Data Representation! Cells
" Linear " Non linear
! Topolygy vs. Geometry ! Attribute Data
" Scalar " Vectors " Normals " Texture Coordinates " Tensors

Info
rmat
ions
tekn
olog
i
Institutionen för informationsteknologi | www.it.uu.se
Cells! A dataset consists of one or more
cells ! They are the fundamental building
block ! Cells are defined by specifying:
" a type " an ordered list of points

Info
rmat
ions
tekn
olog
i
Institutionen för informationsteknologi | www.it.uu.se
Linear Cell Types

Info
rmat
ions
tekn
olog
i
Institutionen för informationsteknologi | www.it.uu.se
More Linear Cell Types

Info
rmat
ions
tekn
olog
i
Institutionen för informationsteknologi | www.it.uu.se
Non Linear Types

Info
rmat
ions
tekn
olog
i
Institutionen för informationsteknologi | www.it.uu.se
Strips

Info
rmat
ions
tekn
olog
i
Institutionen för informationsteknologi | www.it.uu.se
from vtk import * !points = vtk.vtkPoints() points.InsertPoint(0, 0.0, 0.0, 0.0) points.InsertPoint(1, 0.0, 1.0, 0.0) points.InsertPoint(2, 1.0, 0.0, 0.0) points.InsertPoint(3, 1.0, 2.0, 1.0) points.InsertPoint(4, 2.0, 0.0, 0.0) points.InsertPoint(5, 2.0, 2.0, -1.0) points.InsertPoint(6, 3.0, 0.0, 0.0) points.InsertPoint(7, 3.0, 1.0, 0.0)

Info
rmat
ions
tekn
olog
i
Institutionen för informationsteknologi | www.it.uu.se
!cells = vtkCellArray() cells.InsertNextCell(8) # number of points cells.InsertCellPoint(0) cells.InsertCellPoint(1) cells.InsertCellPoint(2) cells.InsertCellPoint(3) cells.InsertCellPoint(4) cells.InsertCellPoint(5) cells.InsertCellPoint(6) cells.InsertCellPoint(7) !strip = vtkPolyData() strip.SetPoints(points) strip.SetStrips(cells)

Info
rmat
ions
tekn
olog
i
Institutionen för informationsteknologi | www.it.uu.se
!map = vtkPolyDataMapper() map.SetInput(strip) !strip = vtkActor() strip.SetMapper(map) strip.GetProperty().SetColor(0.3800, 0.7000, 0.1600) !ren = vtkRenderer() ren.AddActor(strip) ren.SetBackground(0.2, 0.15, 0.25) !renWin = vtkRenderWindow() renWin.AddRenderer(ren) renWin.SetSize(250, 250) renWin.Render() !iren = vtkRenderWindowInteractor() iren.SetRenderWindow(renWin) iren.Initialize() iren.Start()

Info
rmat
ions
tekn
olog
i
Institutionen för informationsteknologi | www.it.uu.se
Result

Info
rmat
ions
tekn
olog
i
Institutionen för informationsteknologi | www.it.uu.se
PolyLine

Info
rmat
ions
tekn
olog
i
Institutionen för informationsteknologi | www.it.uu.se
# load VTK from vtk import * !lines = vtkPolyData() points = vtkPoints() cells = vtkCellArray() !points.InsertPoint(0,0,0,0) points.InsertNextPoint(0,0,1) points.InsertNextPoint(0,1,0) points.InsertNextPoint(0,1,1) points.InsertNextPoint(1,0,0) points.InsertNextPoint(1,0,1) points.InsertNextPoint(1,1,0) points.InsertNextPoint(1,1,1)

Info
rmat
ions
tekn
olog
i
Institutionen för informationsteknologi | www.it.uu.se
cells.InsertNextCell(8) cells.InsertCellPoint(0) cells.InsertCellPoint(1) cells.InsertCellPoint(2) cells.InsertCellPoint(3) cells.InsertCellPoint(4) cells.InsertCellPoint(5) cells.InsertCellPoint(6) cells.InsertCellPoint(7) !lines.SetPoints(points) lines.SetLines(cells) !lineMapper=vtkPolyDataMapper() lineMapper.SetInput(lines) lineActor=vtkActor() lineActor.SetMapper(lineMapper) lineActor.GetProperty().SetColor(0.3800, 0.7000, 0.1600)

Info
rmat
ions
tekn
olog
i
Institutionen för informationsteknologi | www.it.uu.se
!ren = vtk.vtkRenderer() ren.AddActor(lineActor) !renWin = vtk.vtkRenderWindow() renWin.AddRenderer(ren) renWin.SetWindowName("Line") renWin.SetSize(600,600) renWin.Render() !iren = vtk.vtkRenderWindowInteractor() iren.SetRenderWindow(renWin) iren.Initialize() iren.Start()

Info
rmat
ions
tekn
olog
i
Institutionen för informationsteknologi | www.it.uu.se
Result

Info
rmat
ions
tekn
olog
i
Institutionen för informationsteknologi | www.it.uu.se
Topology vs. Geometry! Each type has its topology ! Example:
" A triangle has three vertices but a line has only two, etc
! Geometry " Can differ within the same type

Info
rmat
ions
tekn
olog
i
Institutionen för informationsteknologi | www.it.uu.se
Dataset Types! Uniform Grid
" Regular Topology " regular Geometry
! Rectilininear Grid " Regular Topology " Partially Regular Geometry
! Structured grids " Regular Topology " Irregular Geometry
! Unstructured grids " Irregular Geometry " No Structure

Info
rmat
ions
tekn
olog
i

Info
rmat
ions
tekn
olog
i
Institutionen för informationsteknologi | www.it.uu.se
Examplefrom vtk import * from ReadAtoms import * !# Read the data into a vtkPolyData using the functions # in ReadPoints.py data = vtk.vtkPolyData() data.SetPoints(readPoints("coordinates.txt")) data.GetPointData().SetScalars(readScalars("radii.txt")) data.SetLines(readConnections("connections.txt")) . . .

Info
rmat
ions
tekn
olog
i
Institutionen för informationsteknologi | www.it.uu.se
# Reading Atom data !import string import vtk !def readPoints(filename): points = vtk.vtkPoints() file = open(filename) ! line = file.readline() while line: data = string.split(line) if data and data[0] != '#': x, y, z = float(data[0]), float(data[1]), float(data[2]) points.InsertNextPoint(x, y, z) line = file.readline() return points
ReadAtoms

Info
rmat
ions
tekn
olog
i
Institutionen för informationsteknologi | www.it.uu.se
def readScalars(filename): scalars = vtk.vtkFloatArray() file = open(filename) ! line = file.readline() while line: data = string.split(line) if data and data[0] != '#': x= float(data[0]) scalars.InsertNextValue(x) line = file.readline() return scalars !

Info
rmat
ions
tekn
olog
i
Institutionen för informationsteknologi | www.it.uu.se
def readConnections(filename): connections=vtk.vtkCellArray() file = open(filename) ! line = file.readline() while line: data = string.split(line) if data and data[0] != '#': a, b = int(data[0]), int(data[1]) connections.InsertNextCell(2) connections.InsertCellPoint(a) connections.InsertCellPoint(b) line = file.readline() return connections

Info
rmat
ions
tekn
olog
iResult

Info
rmat
ions
tekn
olog
i
Institutionen för informationsteknologi | www.it.uu.se
Summary! A dataset consists of one or more cells ! Cells are defined by specifying:
" a type " an ordered list of points
! The Topology describes the object ! The Geometry is defined by the coordinates of the
object with a certain topology ! The Dataset types are defined by regular or irregular
Toppology and Geometry

Info
rmat
ions
tekn
olog
i
Institutionen för informationsteknologi | www.it.uu.se
Fundamental Algorithms! Colour Mapping ! Streamlines ! Cut Planes ! Glyphs ! Contouring ! Marching Cubes ! Hedgehogs

Info
rmat
ions
tekn
olog
i
Institutionen för informationsteknologi | www.it.uu.se
Glyphs! Arrows ! Spheres ! etc !
! How many attributes can be encoded here?

Info
rmat
ions
tekn
olog
i
Institutionen för informationsteknologi | www.it.uu.se
Attributes! Ball
" Radius " Colour/texture
! Arrow " Length of shaft " radius of tip " Colour/texture
# Shaft # tip
! Etc... But don’t use too many!!
Info
rmat
ions
tekn
olog
i
29
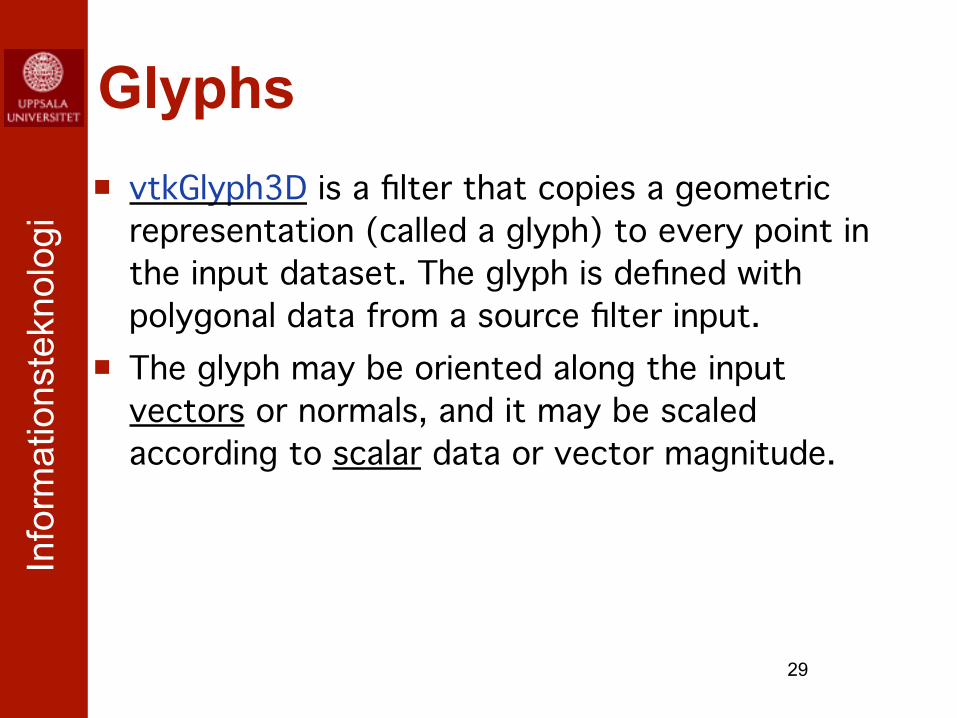
Glyphs! vtkGlyph3D is a filter that copies a geometric
representation (called a glyph) to every point in the input dataset. The glyph is defined with polygonal data from a source filter input. !
! The glyph may be oriented along the input vectors or normals, and it may be scaled according to scalar data or vector magnitude.

Info
rmat
ions
tekn
olog
i
# nb = 0.6744 0.1113 0.7300 0.5362 0.2407 0.8091 0.3671 0.3744 0.8515 0.1866 0.4948 0.8487 0.0175 0.5904 0.8069 -0.1259 0.6597 0.7409 -0.2399 0.7078 0.6644 -0.3273 0.7412 0.5860 -0.3929 0.7654 0.5096 -0.4409 0.7843 0.4364 -0.4746 0.8005 0.3661 -0.4958 0.8159 0.2973 -0.5053 0.8321 0.2287 -0.5023 0.8501 0.1581 -0.4845 0.8708 0.0830 -0.4472 0.8944 0.0000
# c = 0.8798 0.0573 -0.4718 0.9105 0.1226 -0.3950 0.9299 0.1968 -0.3107 0.9345 0.2806 -0.2189 0.9194 0.3746 -0.1200 0.8781 0.4783 -0.0154 0.8029 0.5890 0.0916 0.6864 0.7007 0.1944 0.5248 0.8028 0.2831 0.3230 0.8813 0.3449 0.0976 0.9243 0.3690 -0.1271 0.9275 0.3515 -0.3287 0.8966 0.2968 -0.4943 0.8425 0.2141 -0.6198 0.7766 0.1128 -0.7071 0.7071 -0.0000
data1.txt data2.txt
Your own Files (Unstructured Grid)

Info
rmat
ions
tekn
olog
i!!import sys from vtk import * !# This import style makes it possible to write just readPoints from ReadPoints import * !!# Read the data into a vtkPolyData using the functions in ReadPoints.py data=vtkUnstructuredGrid() !data.SetPoints(readPoints(sys.argv[1])) data.GetPointData().SetVectors(readVectors(sys.argv[2])) !# Put spheres at each point in the dataset. ball = vtkSphereSource() ball.SetRadius(0.05) ball.SetThetaResolution(12) ball.SetPhiResolution(12) !ballGlyph = vtkGlyph3D() ballGlyph.SetInput(data) ballGlyph.SetSourceConnection(ball.GetOutputPort())

Info
rmat
ions
tekn
olog
i
32
ballMapper = vtkPolyDataMapper() ballMapper.SetInputConnection(ballGlyph.GetOutputPort()) !ballActor = vtkActor() ballActor.SetMapper(ballMapper) ballActor.GetProperty().SetColor(0.8,0.4,0.4) !arrow = vtkArrowSource() arrow.SetTipRadius(0.2) arrow.SetShaftRadius(0.075) !arrowGlyph = vtkGlyph3D() arrowGlyph.SetInput(data) arrowGlyph.SetSourceConnection(arrow.GetOutputPort()) arrowGlyph.SetScaleFactor(0.2) !arrowMapper = vtkPolyDataMapper() arrowMapper.SetInputConnection(arrowGlyph.GetOutputPort() !arrowActor = vtkActor() arrowActor.SetMapper(arrowMapper) arrowActor.GetProperty().SetColor(0.9,0.9,0.1)

Info
rmat
ions
tekn
olog
i
33
!!ren = vtkRenderer() ren.AddActor(ballActor) ren.AddActor(arrowActor) ren.SetBackground(0.4, 0.4, 0.6)
renWin = vtkRenderWindow()renWin.AddRenderer(ren)renWin.SetWindowName("Balls and Arrows")renWin.SetSize(500,500)
iren = vtkRenderWindowInteractor()iren.SetRenderWindow(renWin) iren.Initialize() iren.Start()
Info
rmat
ions
tekn
olog
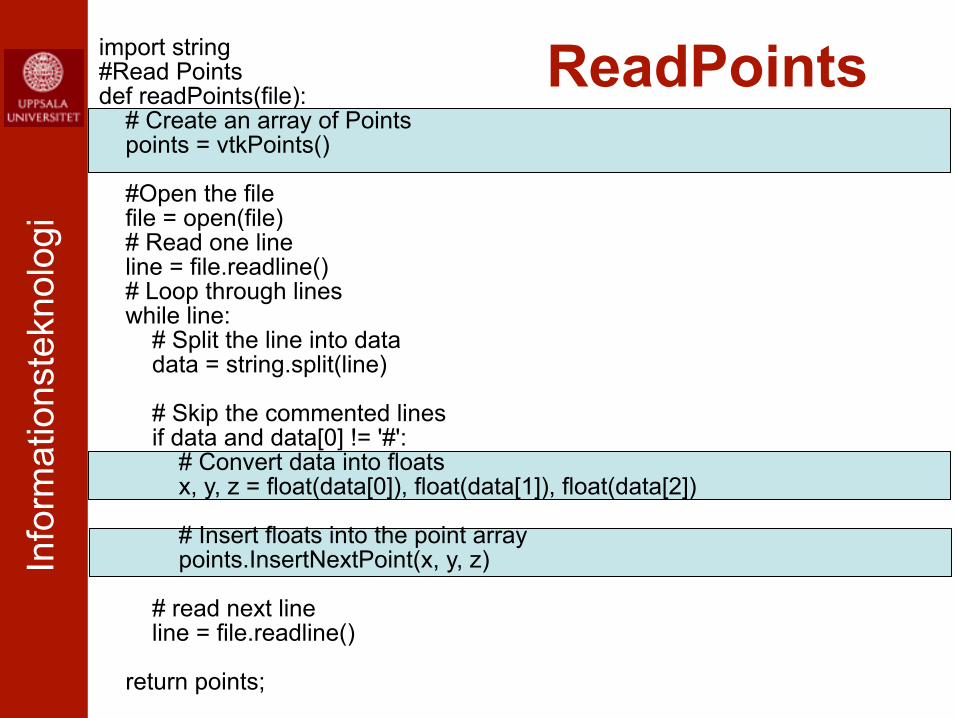
iimport string #Read Points def readPoints(file): # Create an array of Points points = vtkPoints() ! #Open the file file = open(file) # Read one line line = file.readline() # Loop through lines while line: # Split the line into data data = string.split(line) ! # Skip the commented lines if data and data[0] != '#': # Convert data into floats x, y, z = float(data[0]), float(data[1]), float(data[2]) ! # Insert floats into the point array points.InsertNextPoint(x, y, z) ! # read next line line = file.readline() ! return points;
ReadPoints

Info
rmat
ions
tekn
olog
i
!# Read Vectors. # This method works in the same way as readPoints but returns a different type of array def readVectors(file): # Create a Double array which represents the vectors vectors = vtkDoubleArray() ! # Define number of elements vectors.SetNumberOfComponents(3) ! file = open(file) line = file.readline() while line: data = string.split(line) if data and data[0] != '#': x, y, z = float(data[0]), float(data[1]), float(data[2]) vectors.InsertNextTuple3(x, y, z) line = file.readline() return vectors !
Read Vectors

Info
rmat
ions
tekn
olog
iResult
Info
rmat
ions
tekn
olog
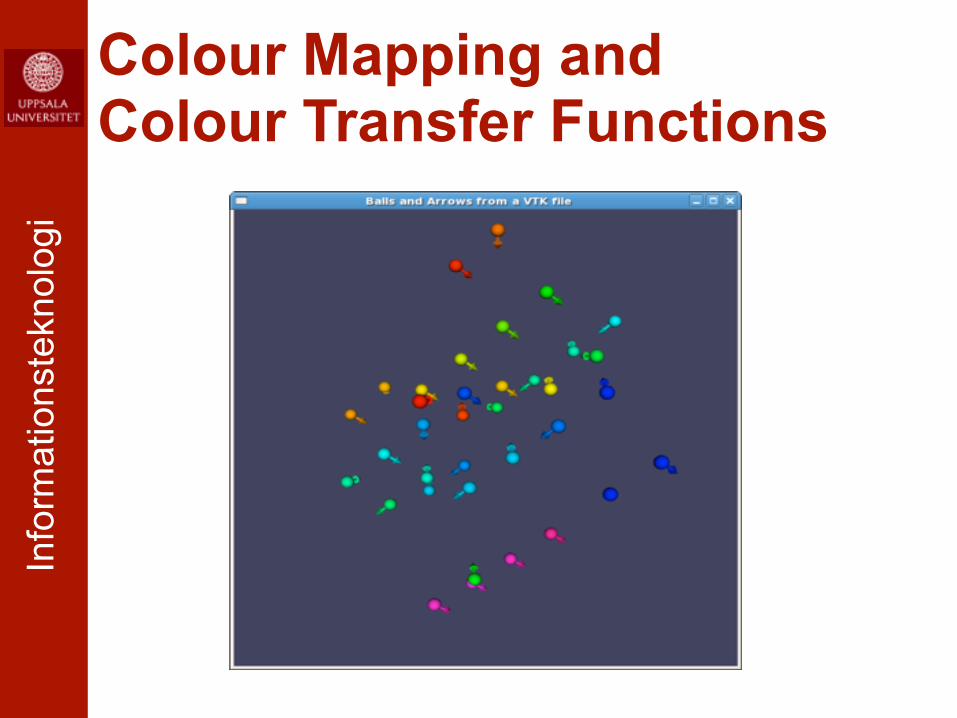
iColour Mapping and Colour Transfer Functions

Info
rmat
ions
tekn
olog
i!import sys from vtk import * !# Use the VTK reader to read the vtk file reader = vtkUnstructuredGridReader() !# Don't forget to give the file name as an argument: "python Vectors.py data.vtk" reader.SetFileName(sys.argv[1]) !# Put spheres at each point in the dataset ball = vtkSphereSource() ball.SetRadius(0.12) ball.SetThetaResolution(12) ball.SetPhiResolution(12) !ballGlyph = vtkGlyph3D() ballGlyph.SetSourceConnection(ball.GetOutputPort()) ballGlyph.SetInputConnection(reader.GetOutputPort()) !# We do not want the Ball to have the size depending on the Scalar ballGlyph.SetScaleModeToDataScalingOff() !ballMapper = vtkPolyDataMapper() ballMapper.SetInputConnection(ballGlyph.GetOutputPort())

Info
rmat
ions
tekn
olog
i # Create a color transfer function to be used for both the balls and arrows. colorTransferFunction = vtkColorTransferFunction() colorTransferFunction.AddRGBPoint(5.0 , 0.0, 0.0, 1.0) colorTransferFunction.AddRGBPoint(10.0, 0.0, 1.0, 1.0) colorTransferFunction.AddRGBPoint(15.0, 0.0, 1.0, 0.0) colorTransferFunction.AddRGBPoint(20.0, 1.0, 1.0, 0.0) colorTransferFunction.AddRGBPoint(25.0, 1.0, 0.0, 0.0) colorTransferFunction.AddRGBPoint(30.0, 1.0, 0.0, 1.0) !# Set colors depending on the color transfer functions ballMapper.SetLookupTable(colorTransferFunction) !ballActor = vtkActor() ballActor.SetMapper(ballMapper)
Colour Transfer Function

Info
rmat
ions
tekn
olog
i
#Put an arrow (vector) at each ball arrow = vtkArrowSource() arrow.SetTipRadius(0.2) arrow.SetShaftRadius(0.075) !arrowGlyph = vtkGlyph3D() arrowGlyph.SetInputConnection(reader.GetOutputPort()) arrowGlyph.SetSourceConnection(arrow.GetOutputPort()) arrowGlyph.SetScaleFactor(0.4) !# We do not want the Arrow's size to depend on the Scalar arrowGlyph.SetScaleModeToDataScalingOff() !arrowMapper = vtkPolyDataMapper() arrowMapper.SetInputConnection(arrowGlyph.GetOutputPort()) !# Set colors depending on the color transfer functions arrowMapper.SetLookupTable(colorTransferFunction) !arrowActor = vtkActor() arrowActor.SetMapper(arrowMapper)

Info
rmat
ions
tekn
olog
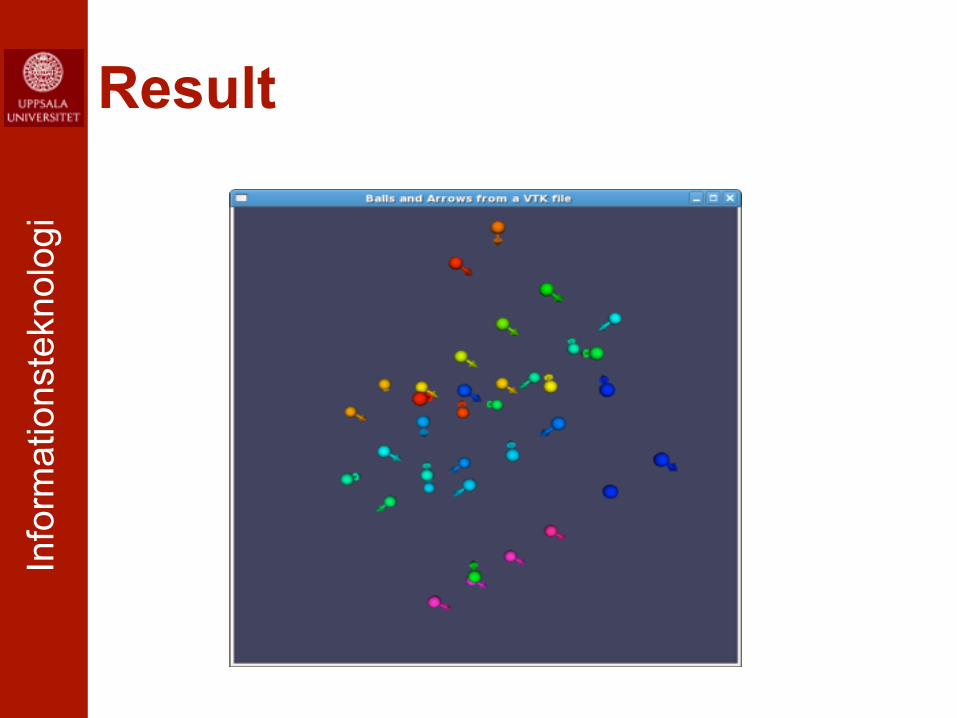
i # Create the RenderWindow,Renderer and Interator ren = vtkRenderer() ren.AddActor(ballActor) ren.AddActor(arrowActor) ren.SetBackground(0.2, 0.2, 0.3) !renWin = vtkRenderWindow() renWin.AddRenderer(ren) renWin.SetWindowName("Balls and Arrows from a VTK file") renWin.SetSize(600,600) !iren = vtkRenderWindowInteractor() iren.SetRenderWindow(renWin) iren.Initialize() iren.Start()
As usual...
Info
rmat
ions
tekn
olog
iResult

Info
rmat
ions
tekn
olog
i
Institutionen för informationsteknologi | www.it.uu.se
Colour Mapping! Maps scalar data to colour ! Can be done by a colour look up table

Info
rmat
ions
tekn
olog
i
Institutionen för informationsteknologi | www.it.uu.se
from vtk import * !reader = vtkStructuredPointsReader() reader.SetFileName("wind.vtk") reader.Update() !a,b = reader.GetOutput().GetScalarRange() W,H,D = reader.GetOutput().GetDimensions() !lut = vtkLookupTable() lut.SetHueRange(0.667, 0.0) lut.SetTableRange(a,b) !

Info
rmat
ions
tekn
olog
i
Institutionen för informationsteknologi | www.it.uu.se
Streamlines
! Like driving a car by following the GPS ! If you do not turn when the GPS tells you
to turn, you’ll get out of course. ! Hence, it is important to check direction
often = short sample step

Info
rmat
ions
tekn
olog
i
Institutionen för informationsteknologi | www.it.uu.se
Streamlinesstreamer = vtkStreamLine() plane = vtk.vtkPlaneSource() . . . streamer.SetSource(plane.GetOutput()) streamer.SetInput(reader.GetOutput()) streamer.SetIntegrationDirectionToForward() streamer.SetIntegrator(vtk.vtkRungeKutta4()) streamer.SetStepLength(0.05) !# Connect to streamer to a mapper etc... !

Info
rmat
ions
tekn
olog
i
Institutionen för informationsteknologi | www.it.uu.se
Cut Plane
sliceplane = vtkImageDataGeometryFilter() sliceplane.SetInput(reader.GetOutput()) sliceplane.SetExtent(0,W,0,H,D/2,D/2) sliceplaneMapper = vtkPolyDataMapper() sliceplaneMapper.SetLookupTable(lut) sliceplaneMapper.SetInput( sliceplane.GetOutput() ) sliceplaneMapper.SetScalarRange(a,b)

Info
rmat
ions
tekn
olog
i
Institutionen för informationsteknologi | www.it.uu.se
Cut Plane
plane=vtkImagePlaneWidget() plane.SetInput(reader.GetOutput()) plane.SetSliceIndex(20) !plane.SetInteractor(iren) !plane.EnabledOn() !plane.SetPlaneOrientationToXAxes()#plane.SetPlaneOrientationToYAxes()#plane.SetPlaneOrientationToZAxes()

Info
rmat
ions
tekn
olog
i
Institutionen för informationsteknologi | www.it.uu.se
Contouring! Creates an Isosurface ! That is: a surface where the volume data
has the same value (iso = same)

Info
rmat
ions
tekn
olog
i
Institutionen för informationsteknologi | www.it.uu.se
Surface Rendering! Use Computer Graphics Techniques to
render the surface (polygons) ! If triangles are used the surface is
”triangulated” ! These triangles are computed from the
volume data using Marching Cubes

Info
rmat
ions
tekn
olog
i
Institutionen för informationsteknologi | www.it.uu.se
Isosurfacesfrom vtk import * !# Read the volume reader = vtkStructuredPointsReader() reader.SetFileName("liver.vtk") !# Isosurface isoSurface = vtkContourFilter() isoSurface.SetInputConnection(reader.GetOutputPort()) isoSurface.SetValue(0, 160)

Info
rmat
ions
tekn
olog
i
Institutionen för informationsteknologi | www.it.uu.se
Marching Cubes! 8 neighbouring voxels can be intersected
in several ways.

Info
rmat
ions
tekn
olog
i
Institutionen för informationsteknologi | www.it.uu.se
Marching Cubes! These polygons must be stitched
together. ! Lorensen et al. 1987
" Ambiguities ! Similar techniques
" Marching Squares 2D " Marching Tetrahedrons
# No ambiguities

Info
rmat
ions
tekn
olog
i
Institutionen för informationsteknologi | www.it.uu.se
Hedgehogs! Vector data is visualized as arrows at the
point where they exist (looks like a hedgehog = sv. igelkott)

Info
rmat
ions
tekn
olog
i
Institutionen för informationsteknologi | www.it.uu.se
Conclusions! Fundamental Algorithms
" Colour Mapping " Streamlines " Cut Planes " Glyphs " Hedgehogs " Contouring " Marching Cubes