data relationship
DESCRIPTION
Explain the description of a linear relationship between data points. Best fit line and correlation includedTRANSCRIPT

Analyzing Data using the Graphing Calculators
Graphing
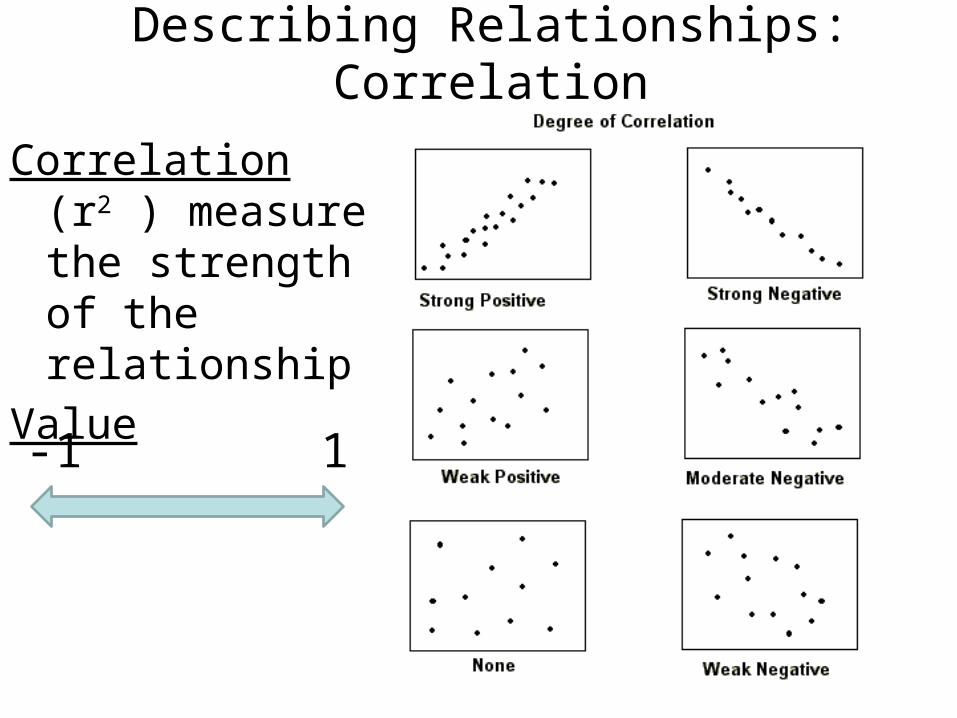
Describing Relationships: Correlation
Correlation (r2 ) measures the strength of the relationship
Value
-1 1
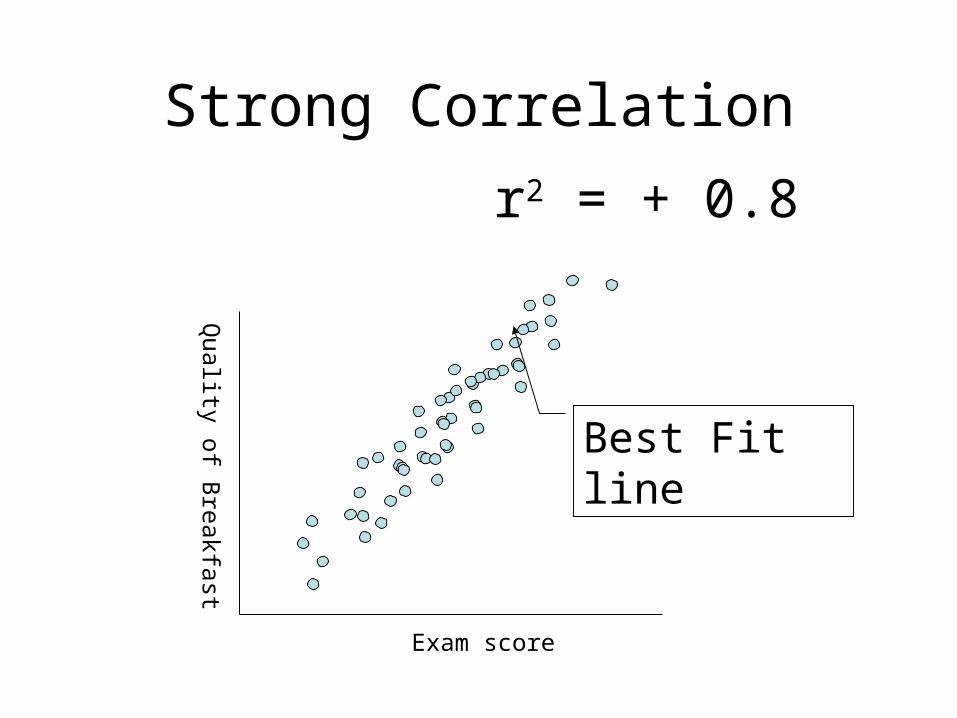
Strong Correlation
Exam score
Quality of B
reakfast
r2 = + 0.8
Best Fit line

Medium Correlation
Weight
Shoe S
ize
r2 = + 0.4
Best Fit line

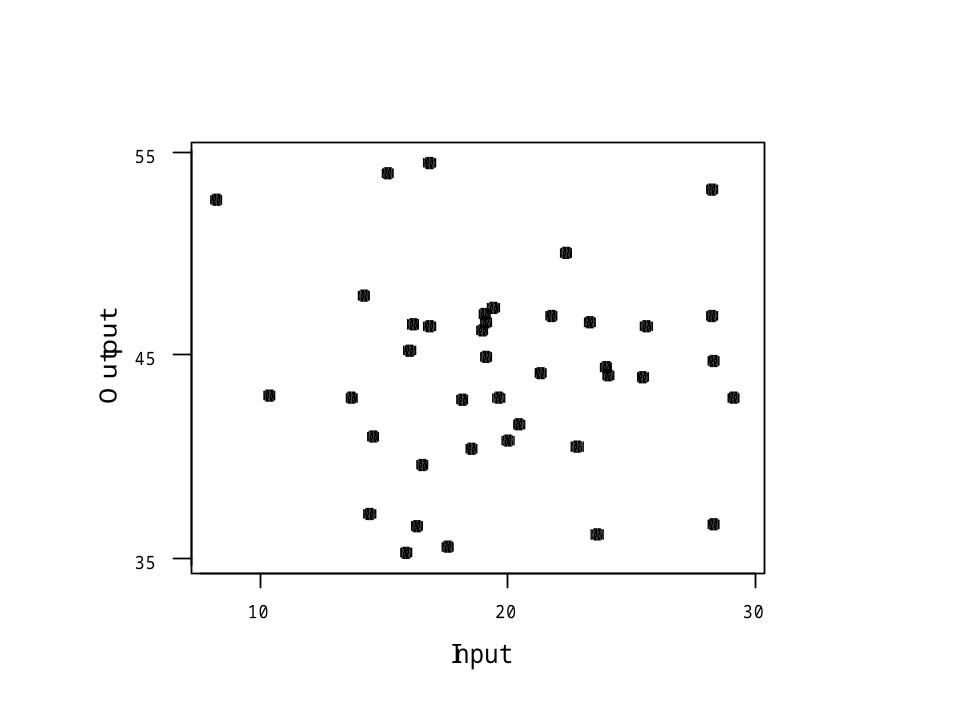
Weak Correlation
Weight
Shoe S
ize
r2 = - 0.2
Best Fit line

55504540353025201510
60
50
40
30
20
Input
Out
put

55504540353025201510
95
85
75
65
55
Input
Out
put
302010
55
45
35
Input
Out
put
Line of Best Fit: y = ax + b
Mathematically describes a linear relationship between data
• Slope (a)• Y-Intercept (b)
55504540353025201510
60
50
40
30
20
Input
Out
put
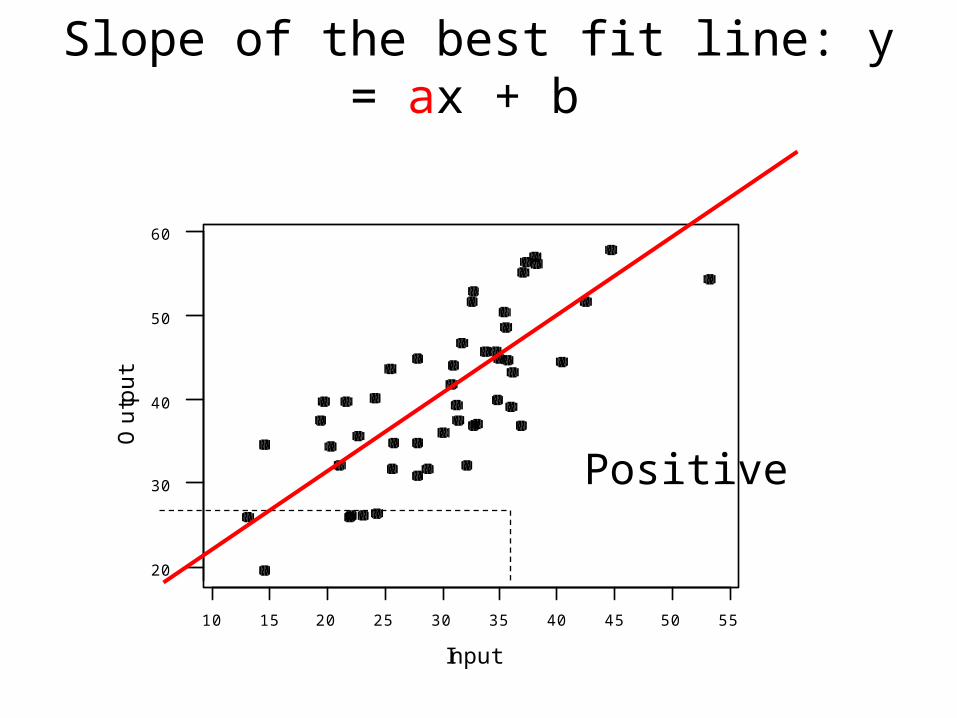
Slope of the best fit line: y = ax + b
Positive
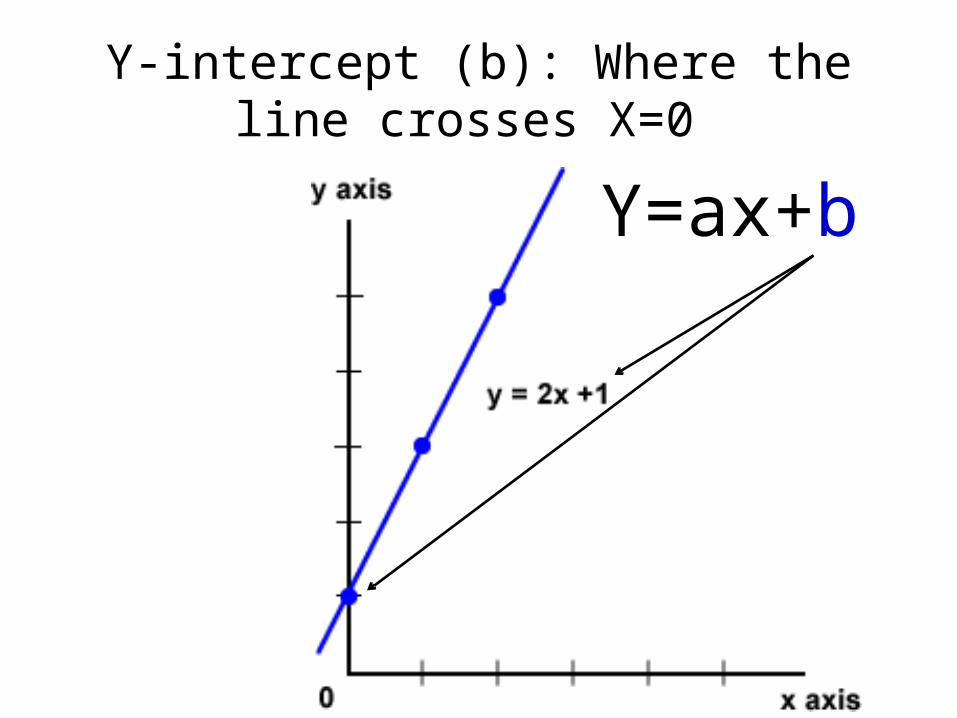
Y-intercept (b): Where the line crosses X=0
Y=ax+b
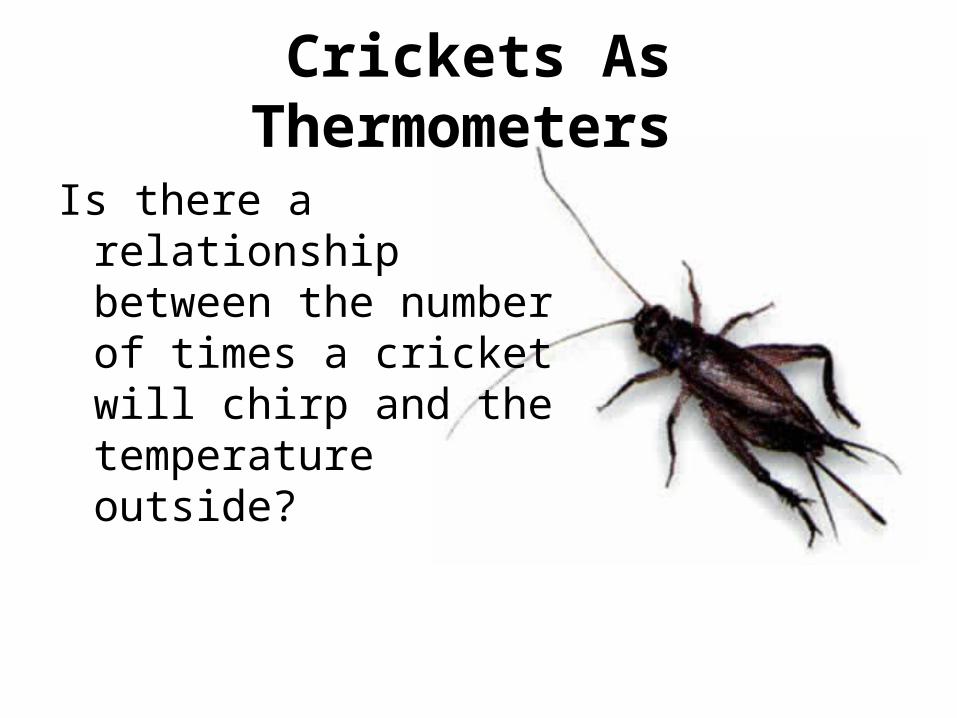
Crickets As Thermometers
Is there a relationship between the number of times a cricket will chirp and the temperature outside?
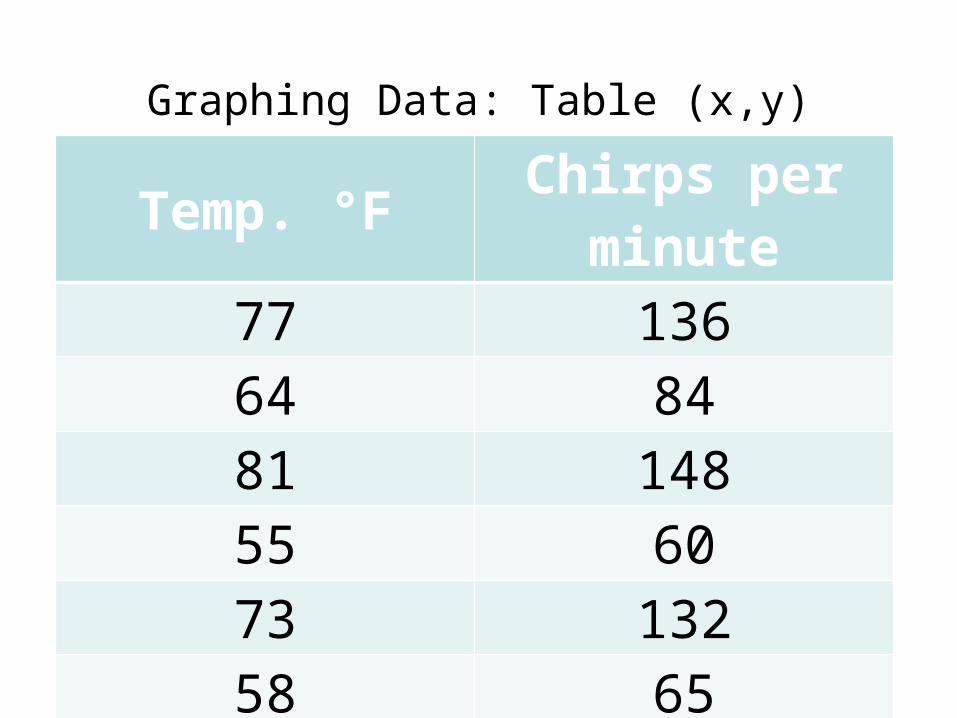
Graphing Data: Table (x,y)
Temp. °FChirps per
minute77 13664 8481 14855 6073 13258 65

Y is
the
out
put
or d
epen
dent
var
iabl
e
X axis input or independent variable
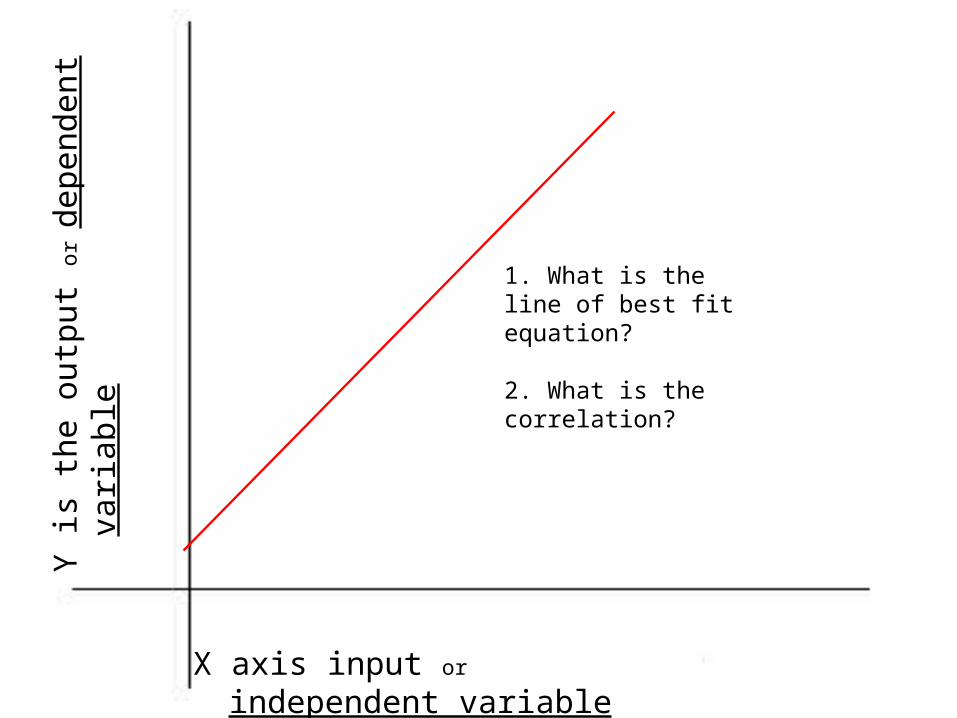
1. What is the line of best fit equation?
2. What is the correlation?

Can you Can-Can?
Is there a relationship between the circumference (distance around) and the diameter (the distance across) of various cylinder objects?
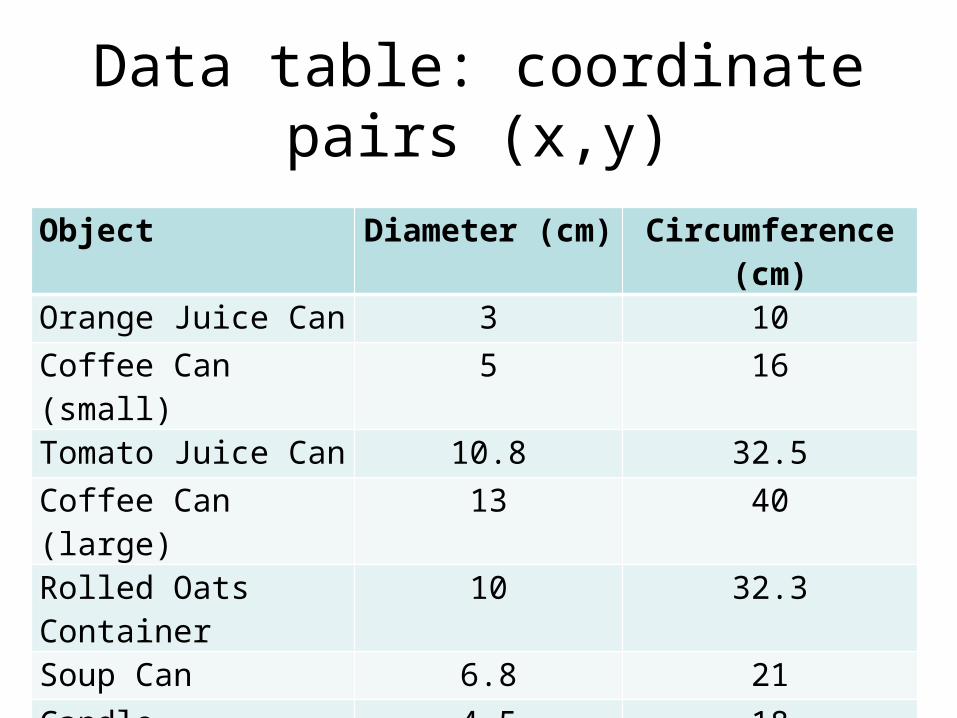
Data table: coordinate pairs (x,y)
Object Diameter (cm) Circumference (cm)Orange Juice Can 3 10Coffee Can (small) 5 16Tomato Juice Can 10.8 32.5Coffee Can (large) 13 40Rolled Oats Container 10 32.3Soup Can 6.8 21Candle 4.5 18
Y is
the
out
put
or d
epen
dent
var
iabl
e
X axis input or independent variable
1. What is the line of best fit equation?
2. What is the correlation?

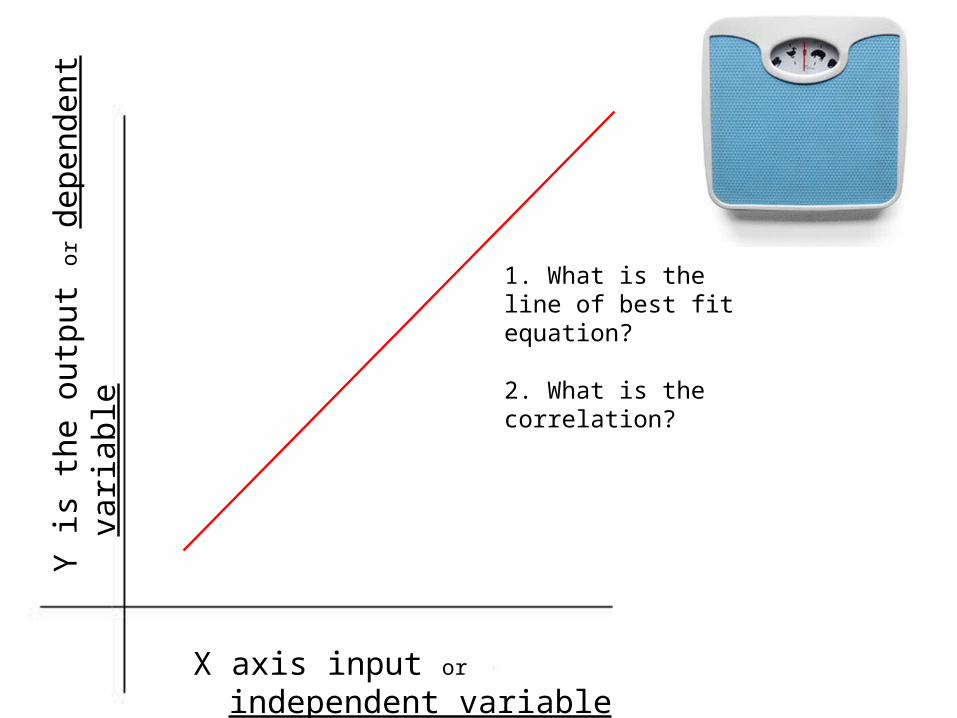
How much weight will I lose?
Is there a relationship between the circumference (distance around) and the diameter (the distance across) of various cylinder objects?

Data tableWeeks Attended
ProgramTotal Weight Loss
12 194 188 84 1612 26
7 125 129 2914 31
Y is
the
out
put
or d
epen
dent
var
iabl
e
X axis input or independent variable
1. What is the line of best fit equation?
2. What is the correlation?
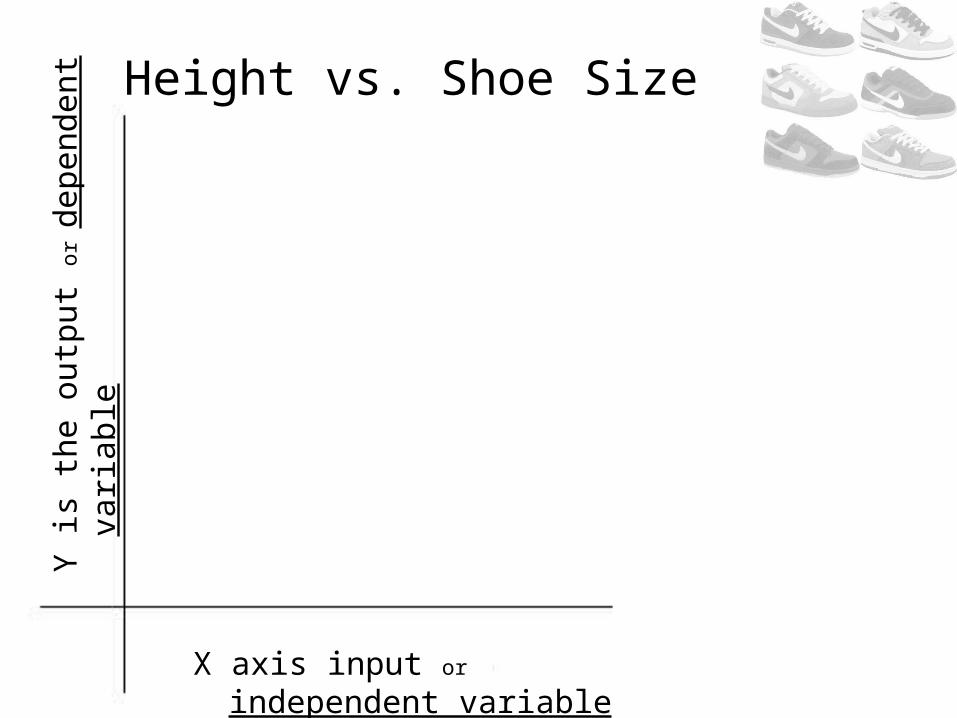
Height vs. Shoe SizeY
is t
he o
utpu
t or
dep
ende
nt v
aria
ble
X axis input or independent variable

Data tableName Height (in) Shoe Size
Proof of Causality?