data presentation
DESCRIPTION
scientific writingTRANSCRIPT

Data presentation
Elsadig Agabna Elahdi
Introduction• In scientific paper, report and thesis data are summarized and
presented either as tables or figures .They are used in the result section to show the general trend of the date and also helpful in discussion section. Sometimes tables are used in the materials and methods section.
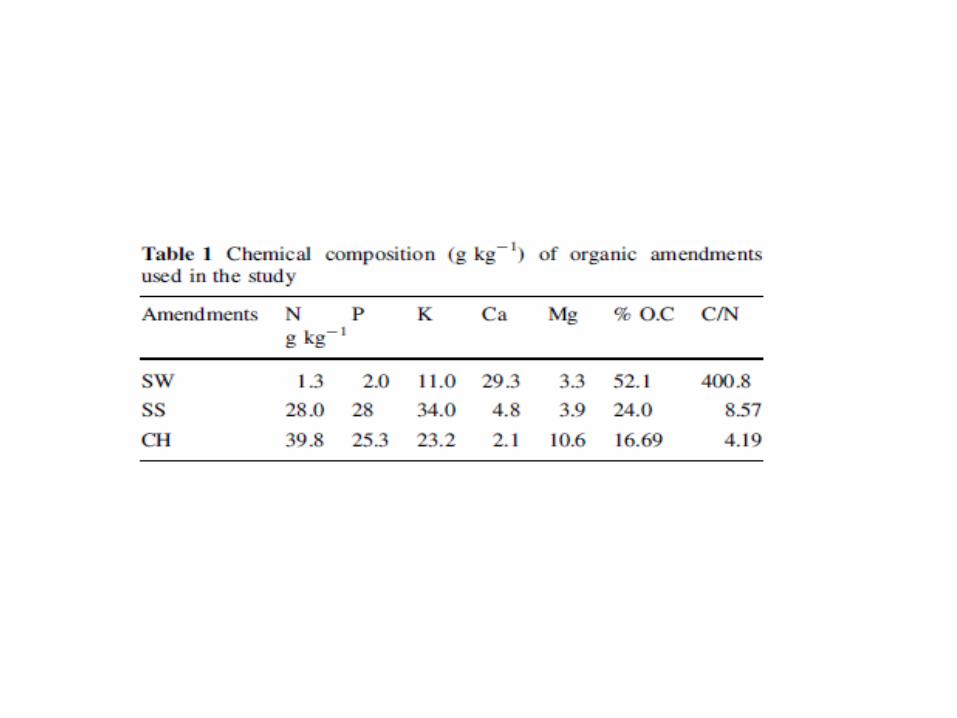
• A table has vertical columns and horizontal rows with headings for each.
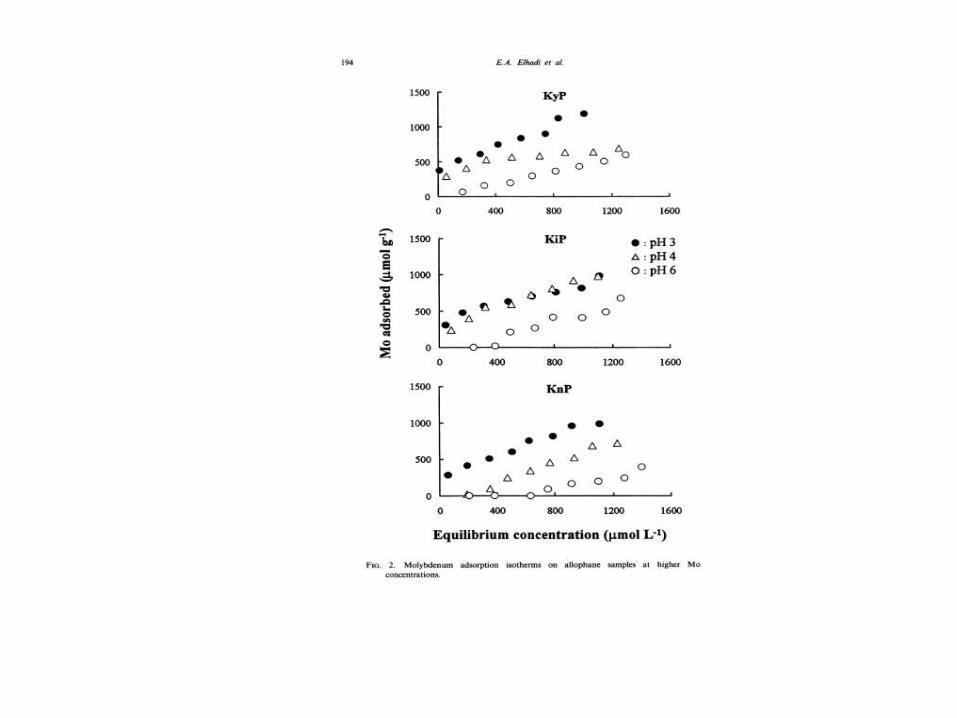
• A figure refers to all other graphic illustrations, such as graphs, maps, pie charts, diagrams and photographs.
• Data presented in tables should not be duplicated in• graphs, and vice versa.

What is the relationship between the text and a table or a figure?
• Tables and figures should complement information in the text although both the graphic and the text should also make sense alone.
• Tables and figures are often best placed immediately after discussion that relates directly to them in the text. The academic writer should make an explicit reference to the figure or table in the relevant part of the text (e.g. Figure 1 illustrates how...) and should pick out important information and highlight any connections of significance. By looking at the table or figure, the reader should be able to gain a more detailed understanding of the points being made in the text.
•
How should tables and figures be labelled?
• Every table and figure should have a title and a number. If they are being used in an extended piece of academic writing such as a dissertation it is helpful to use a sequence of numbers for each chapter, e.g. Table 1.1, Table 1.2 (in Chapter 1); Table 2.1, Table 2.2 (in Chapter 2) etc.
• Figures and tables usually have a different sequence of numbers, e.g. Figure 1, Figure 2, Table 1, Table 2. The title of each should be concise and include all the key words which clearly indicate the content of the figure or table.
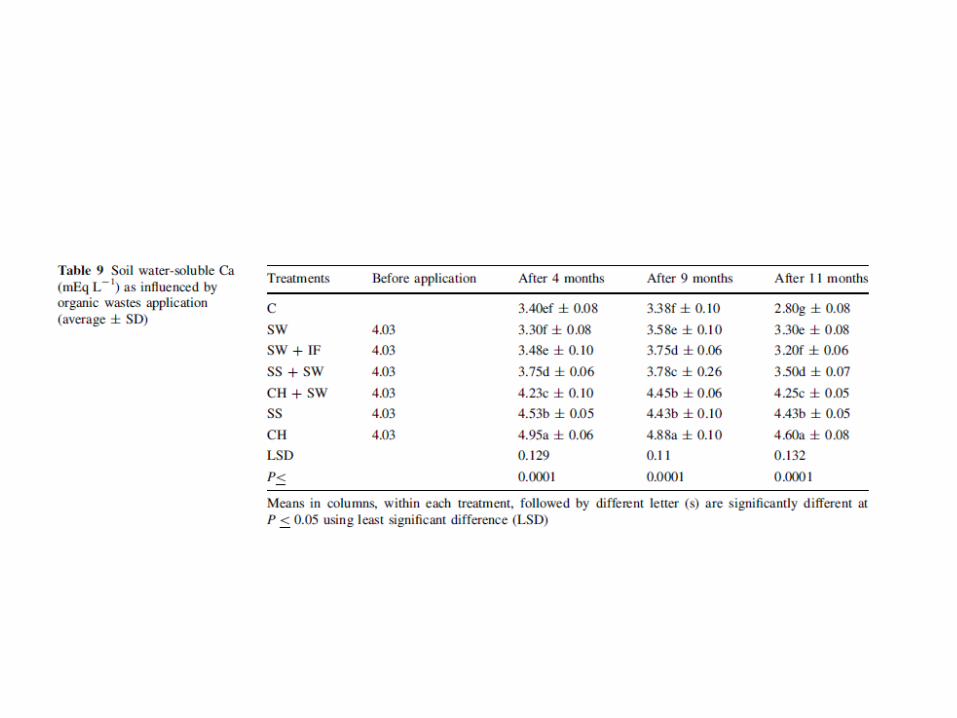
• The title for a table appears above it in the text whereas the title for a figure appears below it.
• If the figure or table comes from another source this should be clearly referenced immediately afterwards in the text.
Example of listing of tables and figures in thesis
• List of tables and figures • Table 2.1: Change in soil properties…………..11 • Table 2.2: Distribution of soil organism………13• Table 5.1 Plant height……………………………… 55• List of Figures• Figure 2.1…………………………………………………..17• Figure 5.1……………………………………………………57
• The table and figure should be understandable on its own, without reference to the text.
• . Each figure and table should be Numbered sequentially in the order in which they are referred to in the text
• Number figures and tables are separately. • . The tables and figures should be organized as if they tell story• Generally tables and figure appeared after the reference section in
separate page .• All figures and tables should be referenced in the text of the article.• Obtain permission from the copyright holder (usually the publisher)
and acknowledge the source, if you are including a table or figure that has already been published.

Figure• Label each axis including units of measurement and clearly identify the data you
are displaying (e.g. label each line in a graph). • Check with the journal, but most want the figure legends listed in numerical
order on a separate page and each figure on a separate page in numerical order.• Figures are usually in black and white. Color is extremely expensive to publish,
and should only be used when it provides unique information. • . Do not include experimental details in the legend; these details should be
included in the methods section.• Be sure that the overall style in the figures follows journal standards. For
example,• if you use Mg ha−1 in the text, do not use Mg/ha in the figures.• • Define all abbreviations in the caption, even if they appear in the overall
abbreviations list.• • Italicize variables • Check the spelling of all text in each figure.


Tables• Use table feature in word, don’t use excel software.• Do not use the enter key within the body of the table.
Instead, separate data horizontally with a new row.• Do not insert blank columns or rows.• Asterisks or letters next to values indicating statistical
significance should appear in the same cell as the value, not an adjacent cell (i.e., they should not have their own column).
• Spell out abbreviations on first mention in tables, even if they have already been defined in the text. (table should stand alone, complete and informative in itself.)

Structure of a table
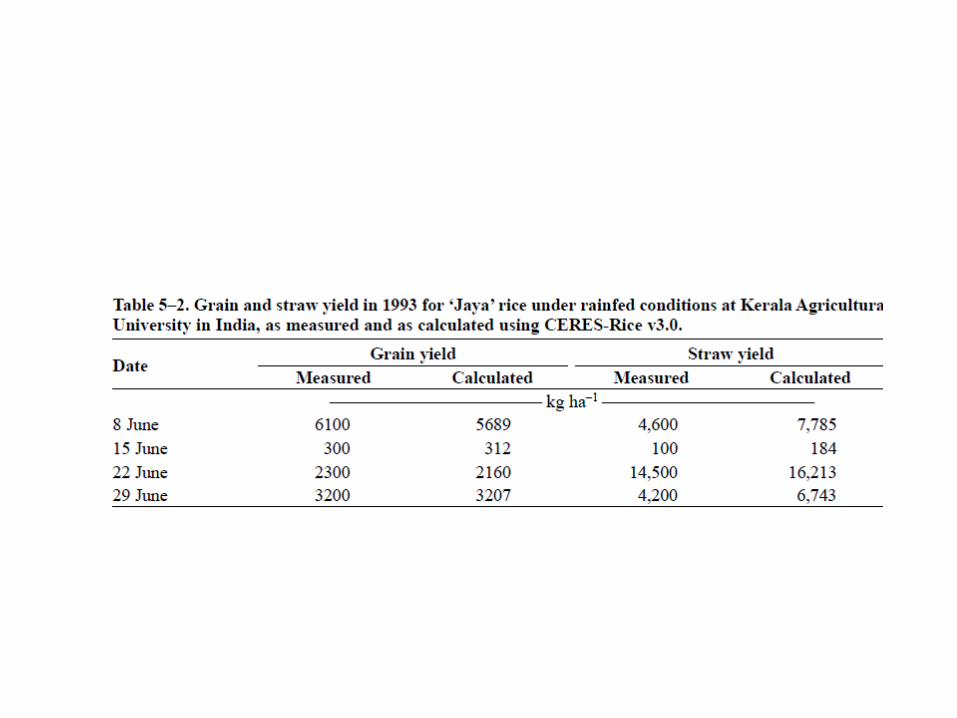
• Title should be brief but informative, with no • units of measurement• Each column should have a heading describing
the material below it. The units is shown in the first row below the headings. When the same units apply to adjacent columns, state the unit only once and use em dashes on each side of the unit to indicate how many columns
• are included.

Tables and figures in the appendices
• If tables and diagrams do not fit neatly into the text of your essay then place them in your Appendices section. Appendices begin on a new page after the references with a centred plain-text heading “Appendix” or “Appendix A”, “Appendix B”, and so on. Place the Appendix/Appendices after the reference list in the order in which they are
• mentioned in your writing. Each appendix must start on a new page. When you refer to a table or figure in an appendix, use the labels Appendix A, Appendix B, Appendix C in the text of your essay or report:
• • As shown in Appendix B,
CITING TABLESANDFIGURES in academic writing
• Example • Table show/ list ……the effect of salinity on plant height• Plant height decrease with increase in soil salinity (Table
1)• Figure 1 illustrate the effect of salinity on plant growth• Plant growth decrease significantly with increase in soil
salt solution (Fig.1)• The word “Figure” must be spelled out only at the start
of a sentence. Otherwise, OK to use “Fig.”. But always spell the word table.