data monitor market analysis nice
TRANSCRIPT
www.datamonitor.com Datamonitor USA
245 Fifth Avenue
4th Floor
New York, NY 10016
USA
t: +1 212 686 7400
f: +1 212 686 2626
Datamonitor Europe
119 Farringdon Road
London EC1R 3DA
United Kingdom
t: +44 20 7551 9000
f: +44 20 7675 7500
Datamonitor Middle East
and North Africa
Datamonitor
PO Box 24893
Dubai, UAE
t: +49 69 9754 4517
f: +49 69 9754 4900
e: datamonitormena@
datamonitor.com
Datamonitor Asia Pacific
Level 46, 2 Park Street
Sydney, NSW 2000
Australia
t: +61 2 8705 6900
f: +61 2 8705 6901
India - Dairy 0102 - 0711 - 2009
© Datamonitor. This profile is a licensed product and is not to be photocopied Page 1
INDUSTRY PROFILE
Dairy in
India
Reference Code: 0102-0711
Publication Date: October 2010
EXECUTIVE SUMMARY
India - Dairy 0102 - 0711 - 2009
© Datamonitor. This profile is a licensed product and is not to be photocopied Page 2
EXECUTIVE SUMMARY
Market value
The Indian dairy market grew by 13.9% in 2009 to reach a value of $4,388 million.
Market value forecast
In 2014, the Indian dairy market is forecast to have a value of $6,577.3 million, an increase of 49.9%
since 2009.
Market segmentation I
Milk is the largest segment of the dairy market in India, accounting for 90.5% of the market's total value.
Market segmentation II
India accounts for 9.5% of the Asia-Pacific dairy market value.
Market share
Gujarat Cooperative Milk Marketing Federation is the leading player in the Indian dairy market, generating
a 32.5% share of the market's value.
Market rivalry
The Indian dairy market is concentrated, with top three players holding 51.9% of the total market value.

CONTENTS
India - Dairy 0102 - 0711 - 2009
© Datamonitor. This profile is a licensed product and is not to be photocopied Page 3
TABLE OF CONTENTS
EXECUTIVE SUMMARY 2
MARKET OVERVIEW 6
Market definition 6
Research highlights 7
Market analysis 8
MARKET VALUE 9
MARKET SEGMENTATION I 10
MARKET SEGMENTATION II 11
MARKET SHARE 12
COMPETITIVE LANDSCAPE 13
LEADING COMPANIES 15
Gujarat Cooperative Milk Marketing Federation Ltd. 15
KCMMF (Kerala Cooperative Milk Marketing Federation) 17
Mother Dairy Fruit & Vegetable Pvt. Ltd. 18
MARKET DISTRIBUTION 19
MARKET FORECASTS 20
Market value forecast 20
MACROECONOMIC INDICATORS 21
APPENDIX 23
Methodology 23
Industry associations 24
Related Datamonitor research 24
Disclaimer 26
ABOUT DATAMONITOR 27
Premium Reports 27
Summary Reports 27
Datamonitor consulting 27
CONTENTS
India - Dairy 0102 - 0711 - 2009
© Datamonitor. This profile is a licensed product and is not to be photocopied Page 4
LIST OF TABLES
Table 1: India dairy market value: $ million, 2005–09 9
Table 2: India dairy market segmentation I:% share, by value, 2009 10
Table 3: India dairy market segmentation II: % share, by value, 2009 11
Table 4: India dairy market share: % share, by value, 2009 12
Table 5: Gujarat Cooperative Milk Marketing Federation Ltd.: key facts 15
Table 6: KCMMF (Kerala Cooperative Milk Marketing Federation): key facts 17
Table 7: Mother Dairy Fruit & Vegetable Pvt. Ltd.: key facts 18
Table 8: India dairy market distribution: % share, by value, 2009 19
Table 9: India dairy market value forecast: $ million, 2009–14 20
Table 10: India size of population (million), 2005–09 21
Table 11: India gdp (constant 2000 prices, $ billion), 2005–09 21
Table 12: India gdp (current prices, $ billion), 2005–09 21
Table 13: India inflation, 2005–09 22
Table 14: India consumer price index (absolute), 2005–09 22
Table 15: India exchange rate, 2005–09 22
CONTENTS
India - Dairy 0102 - 0711 - 2009
© Datamonitor. This profile is a licensed product and is not to be photocopied Page 5
LIST OF FIGURES
Figure 1: India dairy market value: $ million, 2005–09 9
Figure 2: India dairy market segmentation I:% share, by value, 2009 10
Figure 3: India dairy market segmentation II: % share, by value, 2009 11
Figure 4: India dairy market share: % share, by value, 2009 12
Figure 5: India dairy market distribution: % share, by value, 2009 19
Figure 6: India dairy market value forecast: $ million, 2009–14 20
MARKET OVERVIEW
India - Dairy 0102 - 0711 - 2009
© Datamonitor. This profile is a licensed product and is not to be photocopied Page 6
MARKET OVERVIEW
Market definition
The dairy market consists of retail sales of cheese, chilled desserts, cream, fromage frais, milk,
spreadable fats and yogurt. Any currency conversions used in the creation of this report have been
calculated using 2009 annual average exchange rates.
For the purpose of this report Asia-Pacific comprises Australia, China, Japan, India, Singapore, South
Korea and Taiwan.
MARKET OVERVIEW
India - Dairy 0102 - 0711 - 2009
© Datamonitor. This profile is a licensed product and is not to be photocopied Page 7
Research highlights
The Indian dairy market generated total revenues of $4.4 billion in 2009, representing a compound annual
growth rate (CAGR) of 11.9% for the period spanning 2005-2009.
Milk sales proved the most lucrative for the Indian dairy market in 2009, generating total revenues of $4
billion, equivalent to 90.5% of the market's overall value.
The performance of the market is forecast to decelerate, with an anticipated CAGR of 8.4% for the five-
year period 2009-2014, which is expected to lead the market to a value of $6.6 billion by the end of 2014.
MARKET OVERVIEW
India - Dairy 0102 - 0711 - 2009
© Datamonitor. This profile is a licensed product and is not to be photocopied Page 8
Market analysis
The Indian dairy market grew strongly in 2005-2009 period, reaching double digit rates, as a result of
strong sales growth in the cheese category. Gradual deceleration is expected in the forecast period;
however, the growth within the market will remain strong.
The Indian dairy market generated total revenues of $4.4 billion in 2009, representing a compound annual
growth rate (CAGR) of 11.9% for the period spanning 2005-2009. In comparison, the Chinese and
Japanese markets grew with CAGRs of 2.5% and 2.6% respectively, over the same period, to reach
respective values of $16.5 billion and $21.4 billion in 2009.
Milk sales proved the most lucrative for the Indian dairy market in 2009, generating total revenues of $4
billion, equivalent to 90.5% of the market's overall value. In comparison, sales of spreadable fats
generated revenues of $161.5 million in 2009, equating to 3.7% of the market's aggregate revenues.
The performance of the market is forecast to decelerate, with an anticipated CAGR of 8.4% for the five-
year period 2009-2014, which is expected to lead the market to a value of $6.6 billion by the end of 2014.
Comparatively, the Chinese and Japanese markets will grow with CAGRs of 8.9% and 2.9% respectively,
over the same period, to reach respective values of $25.2 billion and $24.8 billion in 2014.

MARKET VALUE
India - Dairy 0102 - 0711 - 2009
© Datamonitor. This profile is a licensed product and is not to be photocopied Page 9
MARKET VALUE
The Indian dairy market grew by 13.9% in 2009 to reach a value of $4,388 million.
The compound annual growth rate of the market in the period 2005–09 was 11.9%.
Table 1: India dairy market value: $ million, 2005–09
Year $ million Rs. million € million % Growth
2005 2,798.5 136,705.1 2,012.5
2006 2,982.6 145,701.5 2,145.0 6.6%
2007 3,174.5 155,075.6 2,283.0 6.4%
2008 3,851.6 188,148.7 2,769.9 21.3%
2009 4,388.0 214,355.7 3,155.7 13.9%
CAGR: 2005–09 11.9%
Source: Datamonitor D A T A M O N I T O R
Figure 1: India dairy market value: $ million, 2005–09
Source: Datamonitor D A T A M O N I T O R
MARKET SEGMENTATION I
India - Dairy 0102 - 0711 - 2009
© Datamonitor. This profile is a licensed product and is not to be photocopied Page 10
MARKET SEGMENTATION I
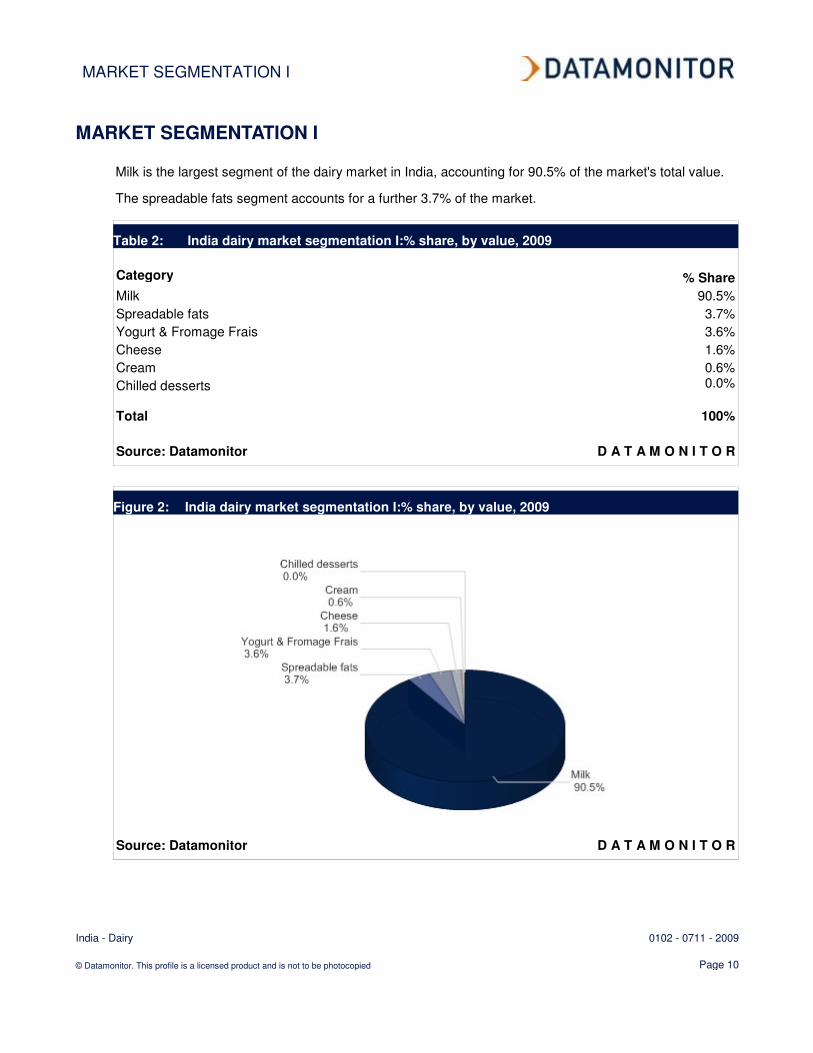
Milk is the largest segment of the dairy market in India, accounting for 90.5% of the market's total value.
The spreadable fats segment accounts for a further 3.7% of the market.
Table 2: India dairy market segmentation I:% share, by value, 2009
Category % Share
Milk 90.5%
Spreadable fats 3.7%
Yogurt & Fromage Frais 3.6%
Cheese 1.6%
Cream 0.6%
Chilled desserts 0.0%
Total 100%
Source: Datamonitor D A T A M O N I T O R
Figure 2: India dairy market segmentation I:% share, by value, 2009
Source: Datamonitor D A T A M O N I T O R
MARKET SEGMENTATION II
India - Dairy 0102 - 0711 - 2009
© Datamonitor. This profile is a licensed product and is not to be photocopied Page 11
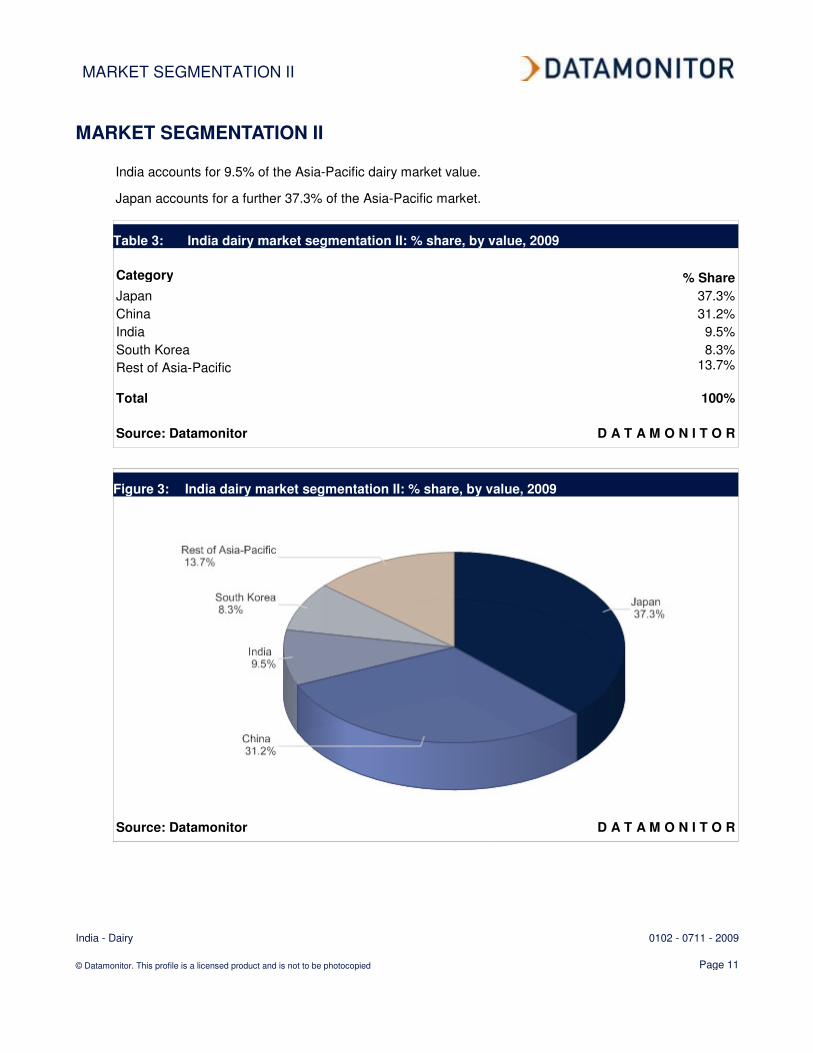
MARKET SEGMENTATION II
India accounts for 9.5% of the Asia-Pacific dairy market value.
Japan accounts for a further 37.3% of the Asia-Pacific market.
Table 3: India dairy market segmentation II: % share, by value, 2009
Category % Share
Japan 37.3%
China 31.2%
India 9.5%
South Korea 8.3%
Rest of Asia-Pacific 13.7%
Total 100%
Source: Datamonitor D A T A M O N I T O R
Figure 3: India dairy market segmentation II: % share, by value, 2009
Source: Datamonitor D A T A M O N I T O R
MARKET SHARE
India - Dairy 0102 - 0711 - 2009
© Datamonitor. This profile is a licensed product and is not to be photocopied Page 12
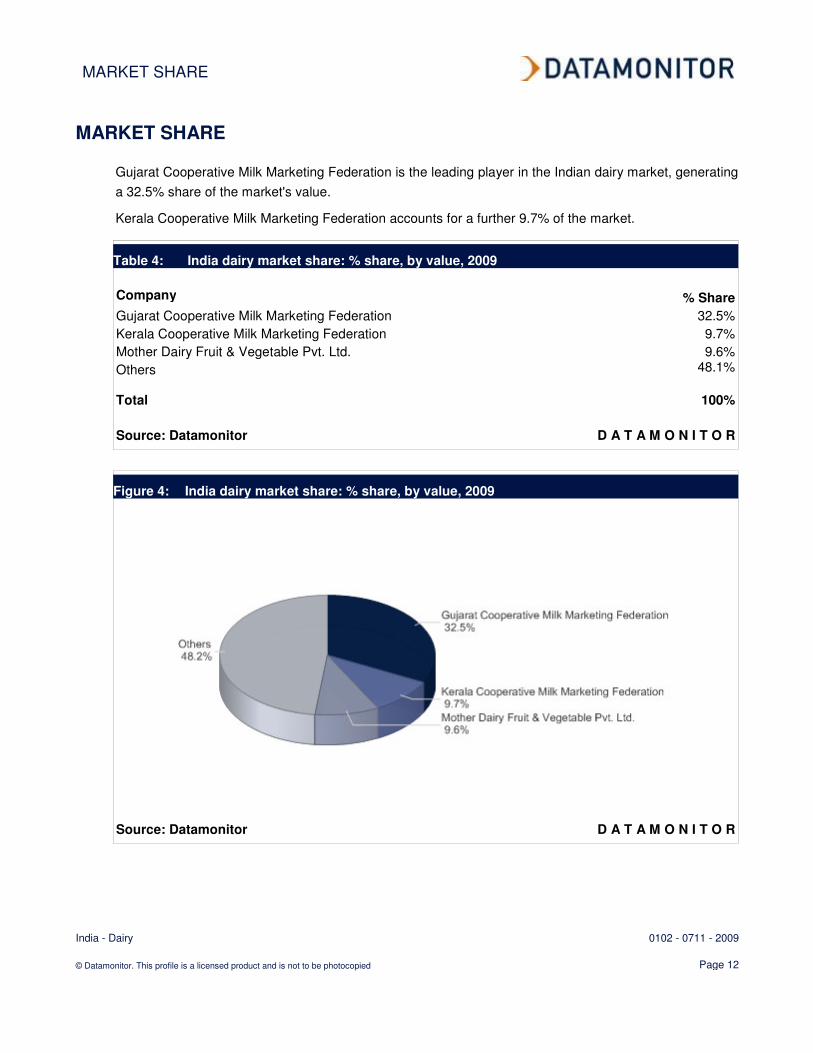
MARKET SHARE
Gujarat Cooperative Milk Marketing Federation is the leading player in the Indian dairy market, generating
a 32.5% share of the market's value.
Kerala Cooperative Milk Marketing Federation accounts for a further 9.7% of the market.
Table 4: India dairy market share: % share, by value, 2009
Company % Share
Gujarat Cooperative Milk Marketing Federation 32.5%
Kerala Cooperative Milk Marketing Federation 9.7%
Mother Dairy Fruit & Vegetable Pvt. Ltd. 9.6%
Others 48.1%
Total 100%
Source: Datamonitor D A T A M O N I T O R
Figure 4: India dairy market share: % share, by value, 2009
Source: Datamonitor D A T A M O N I T O R
COMPETITIVE LANDSCAPE
India - Dairy 0102 - 0711 - 2009
© Datamonitor. This profile is a licensed product and is not to be photocopied Page 13
COMPETITIVE LANDSCAPE
The dairy market will be analyzed taking manufacturers/packagers of dairy products as players. The key
buyers will be taken as food retailers, and dairy farmers as the key suppliers.
The Indian dairy market is concentrated, with top three players holding 51.9% of the total market value.
Suppliers commonly integrate forward, as dairy co-operatives offer farmers the opportunity to access
larger markets and use capital items, such as packaging and processing plants. The dairy market is fairly
easy to enter as a small enterprise, however in order to supply to the mass market consumer companies
must be large and have some level of integration, if successful market entry is to be secured. A wide
range of food and drink products can be used in similar ways to dairy products and therefore it becomes
easy for consumers to replace dairy products with such alternatives, if dairy prices rise too high. Rivalry,
however, is strong as there are numerous players present that are generally similar to one another
despite most operating diverse dairy portfolios.
In India, the main distribution channels for the dairy market are independent retailers, which account for
10.9% of the total market value. Food and beverage retail is fragmented in India: the non-organized
segment accounts for a significant share of its revenues, and independents and small supermarket chains
are significant in the organized segment. Stringent regulations make it difficult for large foreign retailers,
such as Wal-Mart, to gain access to the retail market. In these circumstances, where market players have
many small potential buyers, buyer power is weakened. It is difficult to differentiate staple foods, such as
milk and butter; however, cheese and yogurt products are more differentiated, with a number of niche
cheese markets in operation. The dairy market is highly price sensitive, as buyers will tend to choose the
cheaper option, especially in the milk market, subsequently enhancing buyer power. Manufacturers can
target end-users with their branding strategies, or develop more individual, premium products, such as
organic yoghurt, to counter balance the power of buyer to make purchasing decisions on price alone.
Overall, buyer power is assessed as strong.
Key suppliers to this market are dairy farmers. Dairy products are by definition made of milk, and there
are therefore no real alternatives to raw materials. Dairy cooperatives, which typically integrate dairy
farming, milk collection, processing, and packaging, are present in developed-economy markets (e.g.
Campina in Europe); however, they have a much more prominent role in India. Almost 100,000 dairy
cooperatives are organized into 170 "producer unions", which are combined at state level into 15
cooperative milk marketing federations. Some of the latter have strong brands and enjoy consumer
recognition, i.e. Amul. As the Indian market is dominated by such cooperatives, the suppliers of interest
are further upstream, and include manufacturers of cattle feed, milking machines, packaging, and
providers of service, such as veterinary care and artificial insemination. The products involved are fairly
commoditized, and there are a reasonable number of suppliers; also, the ability of cooperatives to
purchase on behalf of their members (who may be very small-scale farmers) means that supplier power is
correspondingly decreased. Overall, supplier power is moderate.
COMPETITIVE LANDSCAPE
India - Dairy 0102 - 0711 - 2009
© Datamonitor. This profile is a licensed product and is not to be photocopied Page 14
In the Indian dairy market, small-scale entry, perhaps as an artisanal producer of premium dairy products,
does not require very large amounts of capital. However, for new entrants aiming to challenge the major
players in the mass-consumer market, entry barriers are higher. Scale economies in production are
important, especially in countries, where a consolidated food retail sector means that players are forced to
compete intensely on price. Most dairy products are perishable, which means that reliable supply and
distribution chains are vital to avoid the costs of wastage - this can be a particular barrier to entry in less
developed economies. Leading dairy product manufacturers may have strong brands, more apparent
yogurt and butter products, aimed at retaining end-user loyalty, which means that new players will have a
more difficult task to distinguish their own brands. Overall, there is a strong likelihood of new players in
the dairy market.
From the consumer's point of view, dairy products may be used directly as food or beverages, but also
ingredients for other home-made foods. There is a wide range of food and drink that can be used in
similar ways to dairy products, so if dairy prices raise too high, it is possible for consumers to replace
them with alternatives. This reduces the pricing freedom of retailers and market players. Some of the
alternatives may have advantages for retailers, such as cheaper storage or higher margins. Dairy
products are important parts of most peoples' diet, with the benefits of calcium highly publicized, therefore
are unlikely to be completely replaced. Overall, the threat of substitutes is assessed as moderate.
The Indian dairy market is tending towards concentration, with top three players holding 51.9% of the total
market value. The market is dominated by milk federations, such as Gujarat Co-operative Milk Marketing
Federation and Kerala Cooperative Milk Marketing Federation. This indicates the presence of large sized
competitors, which boosts rivalry. Switching costs for buyers are not particularly high, although some
retailers may allocate contracts to single suppliers of dairy products. The larger multinational players tend
to operate in a number of fast moving consumer goods markets, therefore may not be as reliant on sales
of dairy products, which decreases rivalry. As dairy products are usually perishable, storage costs are
high. Industrial production of dairy products requires substantial, specialized assets, and the need to sell
these off when leaving the market translates into high exit costs. The strong growth in the Indian dairy
products market in recent years eases rivalry to a certain extent. Overall, rivalry is assessed as moderate.
LEADING COMPANIES
India - Dairy 0102 - 0711 - 2009
© Datamonitor. This profile is a licensed product and is not to be photocopied Page 15
LEADING COMPANIES
Gujarat Cooperative Milk Marketing Federation Ltd.
Table 5: Gujarat Cooperative Milk Marketing Federation Ltd.: key facts
Head office: Amul Dairy Road, Anand 388 001, Gujarat, IND
Telephone: 91 2692 258 506
Fax: 91 2692 240 208
Website: www.amul.com
Source: company website D A T A M O N I T O R
Gujarat Cooperative Milk Marketing Federation (GCMMF) is a dairy product co-operative engaged in the
marketing and distribution of dairy products, including milk powder, cheese, butter, ghee, ice cream and
baby milk. The company primarily operates in India, where it is headquartered in Anand, Gujarat.
GCMMF sells its products largely under the Amul brand name. It offers a range of fresh, UHT and low fat
milk products, as well as cheeses, flavored milk and yogurts under this name. The company also markets
a malt chocolate drink under the brand Nutramul.
The company's product lines include spreads, cheese, ethnic sweets, UHT milk, milk for infants, milk
powders, sweetened condensed milk, fresh milk, curd, ice creams, chocolate and confectionery, brown
beverages, milk drinks and health beverages.
The company offers spreads under the brands Amul Butter, Amul Lite and Delicious Table Margarine.
Its milk drinks portfolio consists of brands such as Amul Kool Millk Shaake, Amul Kool, Amul Kool Cafe,
Kool Koko, Nutramul energy drink, Amul Lassee, Amul Masti (spiced buttermilk), and Amul Kool Thandai.
GCMMF’s powder milk products comprises infant milk foods marketed under the Amul Spray Infant Milk
Food brand; full cream milk powder under the Amul Instant Full Cream Milk Powder brand; skimmed milk
powder and tea & coffee whitener under the brand Sagar; and dairy whitener under the brand Amulya.
Fresh milk with different pasteurizations are marketed under brands such as Amul Gold, Amul Fresh,
Amul Taaza (double toned milk), Amul Lite Slim and Trim Milk, Amul Fresh Cream, Amul Shakti (toned
milk), and Amul calci+ and Amul Buttermilk.
GCMMF markets pasteurized processed cheese under the brands Amul Pasteurised Processed Cheese,
Amul Cheese Spreads, Amul Emmental Cheese, Amul Pizza Mozzarella Cheese and Gouda Cheese.
LEADING COMPANIES
India - Dairy 0102 - 0711 - 2009
© Datamonitor. This profile is a licensed product and is not to be photocopied Page 16
The company also offers desserts such as ice creams (Amul Ice Creams), traditional sweets (Amul
Shrikhand), chocolates (Amul Chocolates), and concentrated milk based products (Amul Basundi).
The company provides cooking products such as butter, pizza (Amul Utterly Delicious Pizza), sweetened
condensed milk (Amul Mithai Mate), and packed curd (Amul Masti Dahi). The company also offers health
drinks under the brands such as Nutramul and Amul Shakti.
The company markets its products through dairy and ice-cream distributors, as well as online website.
GCMMF also exports its products to the US, the Gulf countries and Singapore. In July 2009, GCMMF
announced plans to set up 6,000 Amul retail parlors across India during the period 2009-2010. The
company currently has a network of 4,000 outlets of which 2,000 were added during 2008-2009.
Key Metrics
As this company is privately held, financial information is not available.
LEADING COMPANIES
India - Dairy 0102 - 0711 - 2009
© Datamonitor. This profile is a licensed product and is not to be photocopied Page 17
KCMMF (Kerala Cooperative Milk Marketing Federation)
Table 6: KCMMF (Kerala Cooperative Milk Marketing Federation): key facts
Head office: Milma Bhavan, Pattom Palace, Thiruvananthapuram, Kerala, IND
Telephone: 91 471 2555981
Fax: 91 471 2555992
Website: www.milma.com
Source: company website D A T A M O N I T O R
Kerala Co-operative Milk Marketing Federation (KCMMF) is engaged in the manufacturing and marketing
of milk and milk derivatives. Its product portfolio includes milk (fat free milk, toned milk, standardized milk
and pasteurized flavored skimmed milk); ice cream (available in a range of flavors: vanilla, chocolate,
mango, strawberry and fruit & nut); curd (butter milk, curd and sweetened curd); cattle feed; beverages
(flavored health drinks and mango drink); and sweets (cream roll).
These products are marketed under brands such as Milma milk, Milma ice-cream, Milma Sambharam
(butter milk), Milma Butter (butter), Milma Refresh (mango drink) and Milma Peda (sweets).
The company manufactures these products through 11 dairies, 13 milk chilling centers, two cattle feed
plants and one milk powder plant, and markets them through a chain of 5,200 retail outlets across Kerala.
Key Metrics
KCMMF generated revenues of $33.1 million in the financial year (FY) 2008-09, an increase of 14.6%
over FY2007-08. The company's net income totaled $3 million in FY2008-09.
LEADING COMPANIES
India - Dairy 0102 - 0711 - 2009
© Datamonitor. This profile is a licensed product and is not to be photocopied Page 18
Mother Dairy Fruit & Vegetable Pvt. Ltd.
Table 7: Mother Dairy Fruit & Vegetable Pvt. Ltd.: key facts
Head office: NDDB House, Opposite Kamal Cinema Complex, Safdarjung Enclave, New Delhi-110029, IND
Telephone: 91 11 41 52 91 00
Fax: 91 11 41 52 71 70
Website: www.motherdairy.com
Source: company website D A T A M O N I T O R
Mother Dairy Fruits & Vegetables (Mother Dairy) is an India based dairy and vegetable company. Mother
Dairy is a wholly owned subsidiary of National Dairy Development Board of India. Mother Dairy is
headquartered in New Delhi, India.
Mother Dairy markets and sells dairy products, vegetables and oils under the brand names Mother Dairy,
Safal and Dhara, respectively. Its range of dairy products includes liquid milk, UHT milk, yogurt, ice
creams, yogurt based drinks, flavored milk, cheese, and butter. Milk varieties offered include full cream,
standardized, toned, double toned, skimmed, cow and bulk vended token milk. It markets around 2.8
million liters of milk daily and operates around 845 exclusive outlets and also through 14,000 retail outlets.
Fresh and frozen fruits and vegetables are marketed under the brand name Safal through a chain of more
than 400 fruit and vegetable shops; and 20,000 retail outlets. Edible oils are marketed under the brand
Dhara, which includes range of oils, such as refined vegetable oil, refined soybean oil, refined sunflower
oil, refined rice bran oil, kachi ghani mustard oil and filtered groundnut oil. Mother Dairy also offers extra
virgin olive oil under the brand name Daroliva.
Mother Dairy also exports fruit pulp, pastes, purees and concentrates around the world and with its
marketing office in Rotterdam, Netherlands.
Key Metrics
Financial information of the company is not available.
DISTRIBUTION
India - Dairy 0102 - 0711 - 2009
© Datamonitor. This profile is a licensed product and is not to be photocopied Page 19
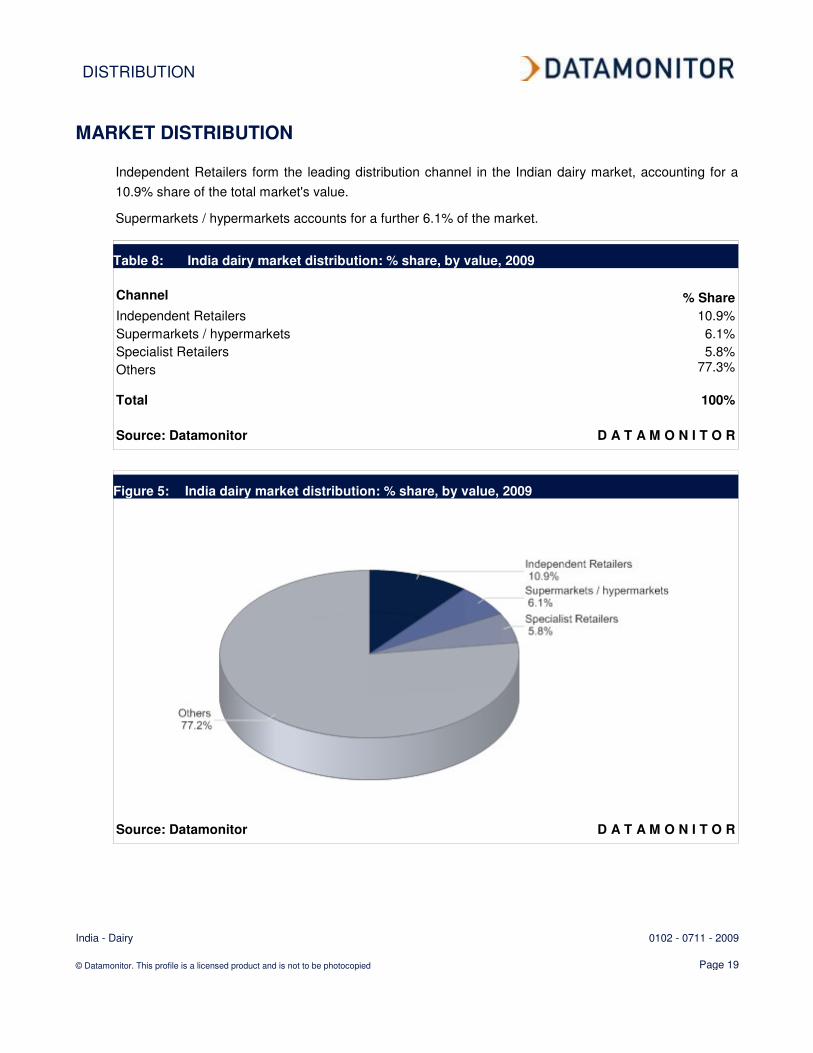
MARKET DISTRIBUTION
Independent Retailers form the leading distribution channel in the Indian dairy market, accounting for a
10.9% share of the total market's value.
Supermarkets / hypermarkets accounts for a further 6.1% of the market.
Table 8: India dairy market distribution: % share, by value, 2009
Channel % Share
Independent Retailers 10.9%
Supermarkets / hypermarkets 6.1%
Specialist Retailers 5.8%
Others 77.3%
Total 100%
Source: Datamonitor D A T A M O N I T O R
Figure 5: India dairy market distribution: % share, by value, 2009
Source: Datamonitor D A T A M O N I T O R
MARKET FORECASTS
India - Dairy 0102 - 0711 - 2009
© Datamonitor. This profile is a licensed product and is not to be photocopied Page 20
MARKET FORECASTS
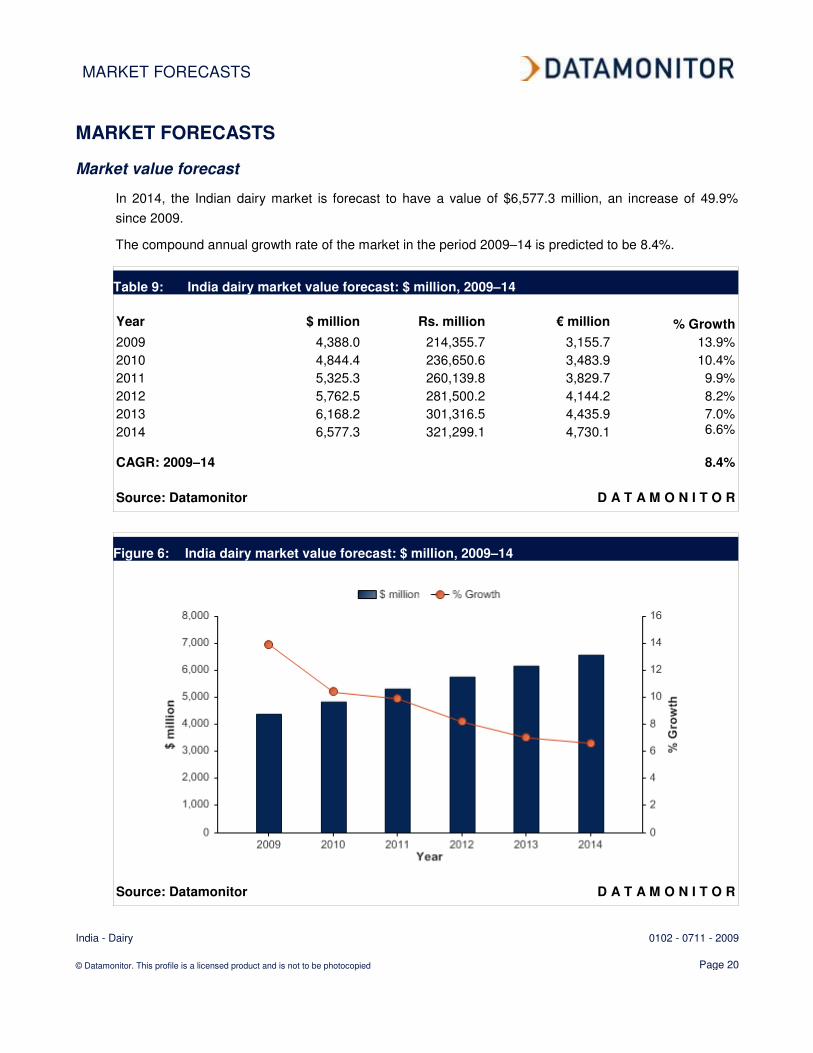
Market value forecast
In 2014, the Indian dairy market is forecast to have a value of $6,577.3 million, an increase of 49.9%
since 2009.
The compound annual growth rate of the market in the period 2009–14 is predicted to be 8.4%.
Table 9: India dairy market value forecast: $ million, 2009–14
Year $ million Rs. million € million % Growth
2009 4,388.0 214,355.7 3,155.7 13.9%
2010 4,844.4 236,650.6 3,483.9 10.4%
2011 5,325.3 260,139.8 3,829.7 9.9%
2012 5,762.5 281,500.2 4,144.2 8.2%
2013 6,168.2 301,316.5 4,435.9 7.0%
2014 6,577.3 321,299.1 4,730.1 6.6%
CAGR: 2009–14 8.4%
Source: Datamonitor D A T A M O N I T O R
Figure 6: India dairy market value forecast: $ million, 2009–14
Source: Datamonitor D A T A M O N I T O R
MACROECONOMIC INDICATORS
India - Dairy 0102 - 0711 - 2009
© Datamonitor. This profile is a licensed product and is not to be photocopied Page 21
MACROECONOMIC INDICATORS
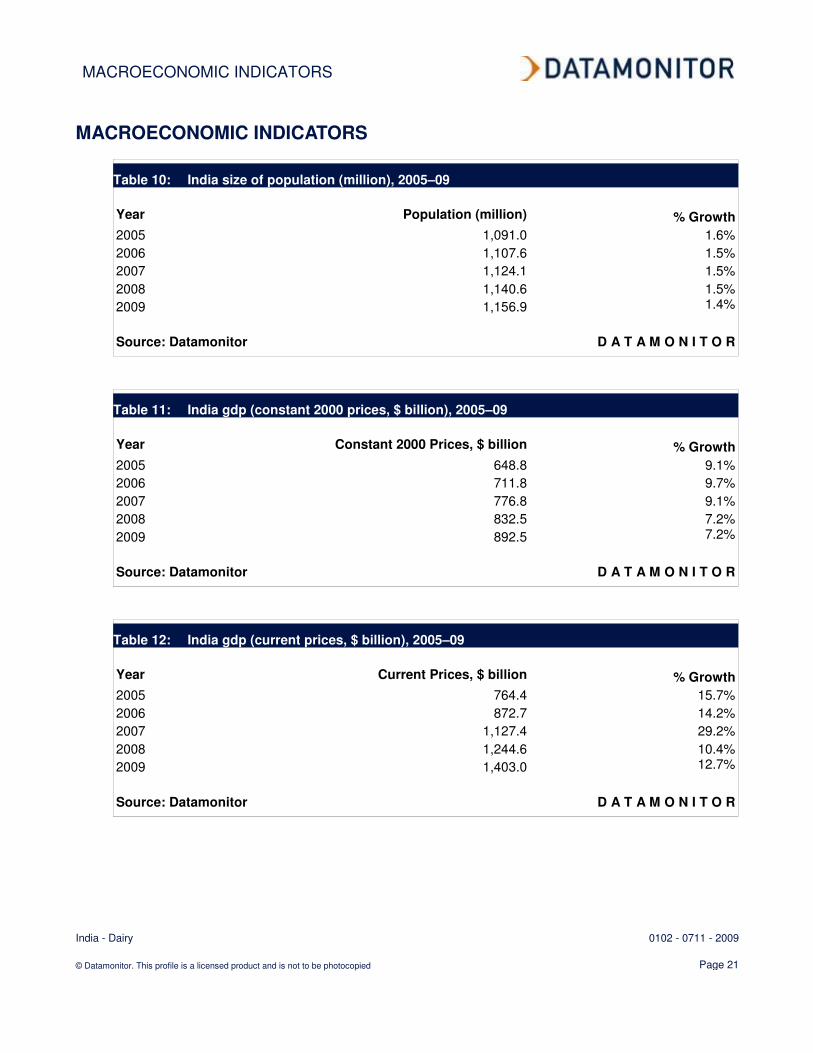
Table 10: India size of population (million), 2005–09
Year Population (million) % Growth
2005 1,091.0 1.6%
2006 1,107.6 1.5%
2007 1,124.1 1.5%
2008 1,140.6 1.5%
2009 1,156.9 1.4%
Source: Datamonitor D A T A M O N I T O R
Table 11: India gdp (constant 2000 prices, $ billion), 2005–09
Year Constant 2000 Prices, $ billion % Growth
2005 648.8 9.1%
2006 711.8 9.7%
2007 776.8 9.1%
2008 832.5 7.2%
2009 892.5 7.2%
Source: Datamonitor D A T A M O N I T O R
Table 12: India gdp (current prices, $ billion), 2005–09
Year Current Prices, $ billion % Growth
2005 764.4 15.7%
2006 872.7 14.2%
2007 1,127.4 29.2%
2008 1,244.6 10.4%
2009 1,403.0 12.7%
Source: Datamonitor D A T A M O N I T O R
MACROECONOMIC INDICATORS
India - Dairy 0102 - 0711 - 2009
© Datamonitor. This profile is a licensed product and is not to be photocopied Page 22
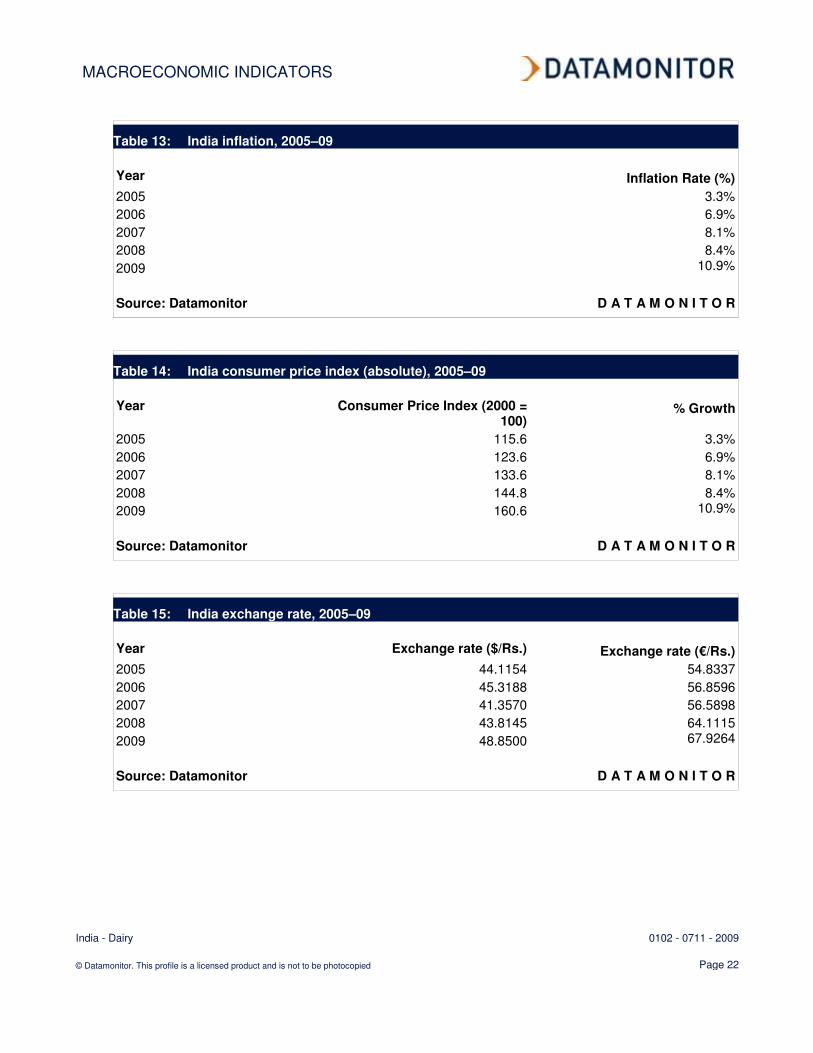
Table 13: India inflation, 2005–09
Year Inflation Rate (%)
2005 3.3%
2006 6.9%
2007 8.1%
2008 8.4%
2009 10.9%
Source: Datamonitor D A T A M O N I T O R
Table 14: India consumer price index (absolute), 2005–09
Year Consumer Price Index (2000 =
100) % Growth
2005 115.6 3.3%
2006 123.6 6.9%
2007 133.6 8.1%
2008 144.8 8.4%
2009 160.6 10.9%
Source: Datamonitor D A T A M O N I T O R
Table 15: India exchange rate, 2005–09
Year Exchange rate ($/Rs.) Exchange rate (€/Rs.)
2005 44.1154 54.8337
2006 45.3188 56.8596
2007 41.3570 56.5898
2008 43.8145 64.1115
2009 48.8500 67.9264
Source: Datamonitor D A T A M O N I T O R
APPENDIX
India - Dairy 0102 - 0711 - 2009
© Datamonitor. This profile is a licensed product and is not to be photocopied Page 23
APPENDIX
Methodology
Datamonitor Industry Profiles draw on extensive primary and secondary research, all aggregated,
analyzed, cross-checked and presented in a consistent and accessible style.
Review of in-house databases – Created using 250,000+ industry interviews and consumer surveys
and supported by analysis from industry experts using highly complex modeling & forecasting tools,
Datamonitor’s in-house databases provide the foundation for all related industry profiles
Preparatory research – We also maintain extensive in-house databases of news, analyst
commentary, company profiles and macroeconomic & demographic information, which enable our
researchers to build an accurate market overview
Definitions – Market definitions are standardized to allow comparison from country to country. The
parameters of each definition are carefully reviewed at the start of the research process to ensure they
match the requirements of both the market and our clients
Extensive secondary research activities ensure we are always fully up-to-date with the latest
industry events and trends
Datamonitor aggregates and analyzes a number of secondary information sources, including:
- National/Governmental statistics
- International data (official international sources)
- National and International trade associations
- Broker and analyst reports
- Company Annual Reports
- Business information libraries and databases
Modeling & forecasting tools – Datamonitor has developed powerful tools that allow quantitative
and qualitative data to be combined with related macroeconomic and demographic drivers to create
market models and forecasts, which can then be refined according to specific competitive, regulatory
and demand-related factors
Continuous quality control ensures that our processes and profiles remain focused, accurate and
up-to-date
APPENDIX
India - Dairy 0102 - 0711 - 2009
© Datamonitor. This profile is a licensed product and is not to be photocopied Page 24
Industry associations
Indian Dairy Association
IDA House, Sector-IV, R.K. Puram, New Delhi-110 022
Tel.: 91 11 2617 0781
Fax: 91 11 2617 4719
www.indairyasso.org
Related Datamonitor research
Industry profiles
Dairy in Europe
Dairy in Colombia
Dairy in Italy
Dairy in Denmark
Dairy in Ireland
Dairy in Mexico
Global Dairy
Dairy in the United Kingdom
Dairy in the Netherlands
Dairy in Venezuela
Dairy in the Czech Republic
Dairy in Sweden
Dairy in South Korea
Dairy in Japan
Dairy in Taiwan
Dairy in Norway
Dairy in Hungary
Dairy in Portugal
Dairy in Russia
Dairy in Peru
APPENDIX
India - Dairy 0102 - 0711 - 2009
© Datamonitor. This profile is a licensed product and is not to be photocopied Page 25
Dairy in France
Dairy in Poland
Dairy in Spain
Dairy in the United States
Dairy in Germany
Dairy in Singapore
Dairy in Chile
Dairy in Brazil
Dairy in Australia
Dairy in China
Dairy in Belgium
Dairy in Asia-Pacific
Dairy in Canada
Dairy in South Africa
Dairy in Saudi Arabia
Dairy in Egypt
Dairy in Israel
Dairy in United Arab Emirates
Dairy in Switzerland
APPENDIX
India - Dairy 0102 - 0711 - 2009
© Datamonitor. This profile is a licensed product and is not to be photocopied Page 26
Disclaimer
All Rights Reserved.
No part of this publication may be reproduced, stored in a retrieval system or transmitted in any form
by any means, electronic, mechanical, photocopying, recording or otherwise, without the prior
permission of the publisher, Datamonitor plc.
The facts of this report are believed to be correct at the time of publication but cannot be guaranteed.
Please note that the findings, conclusions and recommendations that Datamonitor delivers will be
based on information gathered in good faith from both primary and secondary sources, whose
accuracy we are not always in a position to guarantee. As such Datamonitor can accept no liability
whatever for actions taken based on any information that may subsequently prove to be incorrect.

ABOUT DATAMONITOR
India - Dairy 0102 - 0711 - 2009
© Datamonitor. This profile is a licensed product and is not to be photocopied Page 27
ABOUT DATAMONITOR
The Datamonitor Group is a world-leading provider of premium global business information, delivering
independent data, analysis and opinion across the Automotive, Consumer Markets, Energy & Utilities,
Financial Services, Logistics & Express, Pharmaceutical & Healthcare, Retail, Technology and
Telecoms industries.
Combining our industry knowledge and experience, we assist over 6,000 of the world’s leading
companies in making better strategic and operational decisions.
Delivered online via our user-friendly web platforms, our market intelligence products and services
ensure that you will achieve your desired commercial goals by giving you the insight you need to best
respond to your competitive environment.
Premium Reports
Datamonitor's premium reports are based on primary research with industry panels and consumers.
We gather information on market segmentation, market growth and pricing, competitors and products.
Our experts then interpret this data to produce detailed forecasts and actionable recommendations,
helping you create new business opportunities and ideas.
Summary Reports
Our series of company, industry and country profiles complements our premium products, providing
top-level information on 30,000 companies, 3,000 industries and 100 countries. While they do not
contain the highly detailed breakdowns found in premium reports, profiles give you the most important
qualitative and quantitative summary information you need - including predictions and forecasts.
Datamonitor consulting
We hope that the data and analysis in this profile will help you make informed and imaginative business
decisions. If you have further requirements, Datamonitor’s consulting team may be able to help you. For
more information about Datamonitor’s consulting capabilities, please contact us directly at

Copyright of Dairy Industry Profile: India is the property of Datamonitor Plc and its content may not be copied
or emailed to multiple sites or posted to a listserv without the copyright holder's express written permission.
However, users may print, download, or email articles for individual use.