data mining with weka
TRANSCRIPT

Data Mining with WEKA
Census Income Dataset(UCI Machine Learning Repository)Hein and Maneshka

Data Mining● non-trivial extraction of previously unknown and potentially useful information
from data by means of computers.● part of machine learning field.● two types of machine learning:
○ supervised learning: to find real values as output■ regression: to find real value(s) as output■ classification: to map instance of data to one of predefined classes
○ unsupervised learning: to discover internal representation of data■ clustering: to group instances of data together based on some characteristics ■ association rule mining: to find relationship between instances of data

Aim● Perform data mining using WEKA
○ understanding the dataset○ preprocessing○ task: classification

Dataset - Census Income Dataset● from UCI machine learning repository● 32, 561 instances● attributes: 14
○ continuous: age, fnlwgt, education-num, capital-gain, capital-loss, hours-per-week: ○ nominal: workclass, education, marital-status, occupation, relationship, race, sex, native-country
● salary - classes: 2 (<= 50K and > 50K)● missing values:
○ workclass & occupation: 1836 (6%)○ native-country: 583 (2%)
● imbalance distribution of values ○ age, capital-gain, capital-loss, native-country

Dataset - Census Income Dataset● imbalance distributions of attributes ● No strong seperation of classes
Blue: <=50K Red: >50K
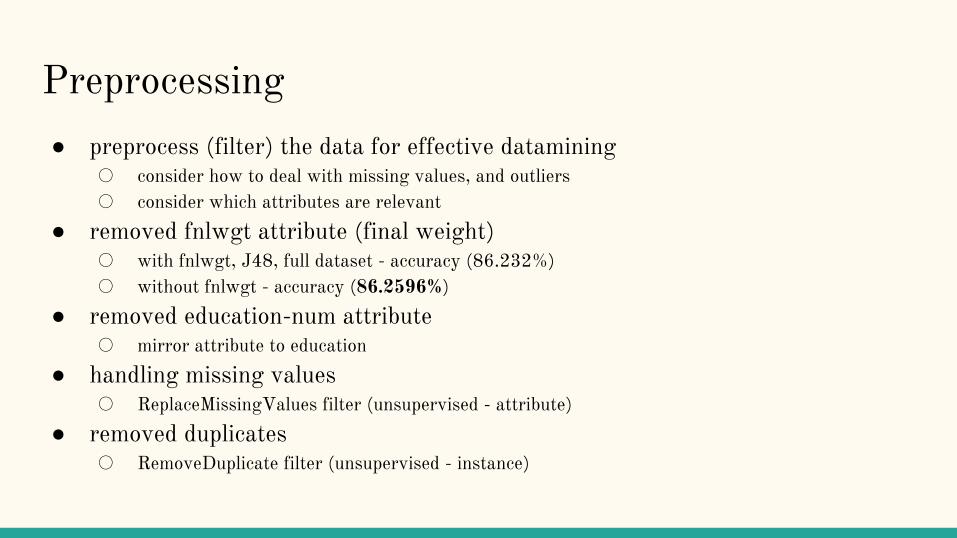
Preprocessing● preprocess (filter) the data for effective datamining
○ consider how to deal with missing values, and outliers○ consider which attributes are relevant
● removed fnlwgt attribute (final weight)○ with fnlwgt, J48, full dataset - accuracy (86.232%)○ without fnlwgt - accuracy (86.2596%)
● removed education-num attribute ○ mirror attribute to education
● handling missing values○ ReplaceMissingValues filter (unsupervised - attribute)
● removed duplicates○ RemoveDuplicate filter (unsupervised - instance)

Preprocessing
● grouped education attribute values○ 16 values → 9 values
HS-graduateSome-collegeBechalorProf-SchoolMastersDoctorateAssoc-acdmAssoc-voc
HS-not-finished
HS-graduateSome-collegeBechalorProf-SchoolMastersDoctorateAssoc-acdmAssoc-voc
Pre-school1st-4th5th-6th7th-8th9th10th11th12th
HS-not-finished
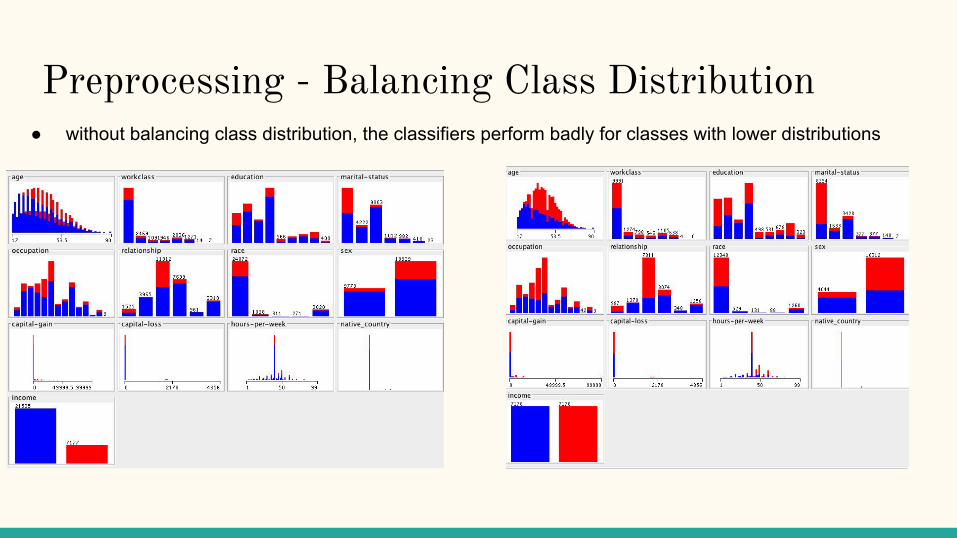
Preprocessing - Balancing Class Distribution ● without balancing class distribution, the classifiers perform badly for classes with lower distributions

Preprocessing - Balancing Class Distribution
Step 1: Apply the Resample filter
Filters→supervised→instance→Resample
Step 2: Set the biasToUniformClass parameter of the Resample Filter to 1.0 and click
‘Apply Filter’
Preprocessing - Outliers ● Outliers in data can skew and mislead the processing of algorithms. ● Outliers can be removed in the following manner

Preprocessing - Removing OutliersStep 1 : Select InterquartertileRange filter
Filters→unsupervised→attribute→InteruartileRange--> Apply
Result: Creates two attributes- outliers and extreme values with attribute no’s 14 and 15 respectively

Preprocessing - Removing OutliersStep 2 : a) Select another filter RemoveWithValues
Filters→unsupervised→instance→RemoveWithValues
b) Click on filter to get its parameters. Set attrıbuteIndex to 14 and nominalIndices to 2,since its only values set to yes that need to be removed.
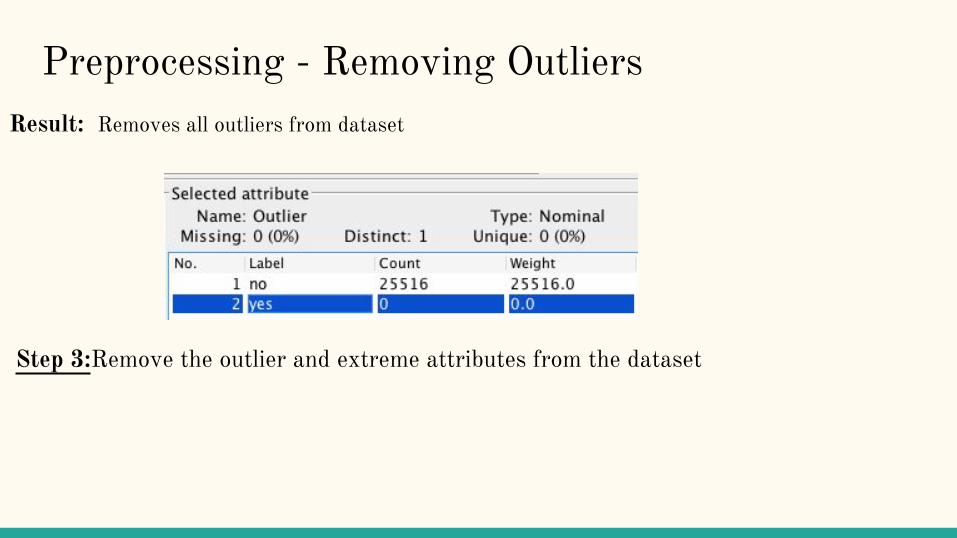
Preprocessing - Removing OutliersResult: Removes all outliers from dataset
Step 3:Remove the outlier and extreme attributes from the dataset

Preprocessing - Impact of Removing Outliers● With outliers in dataset - 85.3302% correctly classified instances
● Without Outliers in dataset - 84.3549% correctly classified instances
Since the percentage for correctly classified instances were greater for the dataset with outliers, this was selected!
The reduced accuracy is due to the nature of our dataset (very skewed distributions in attributes ( capital-gain)).
Preprocessing● Our preprocessing recap
○ removed fnlwgt, edu-num attributes○ removed duplicate instances○ fill in missing values○ grouped some attribute values for education○ rebalanced class distribution
● size of dataset: 14356 instances

Performance of Classifiers● simplest measure: rate of correct predictions
● confusion matrix:
● Precision: how many positive predictions are correct (TP/(TP + FP))● Recall: how many positive predictions are caught (TP/(TP + FN))● F Measure: consider both precision and recall
(2 * precision * recall / precision + recall)
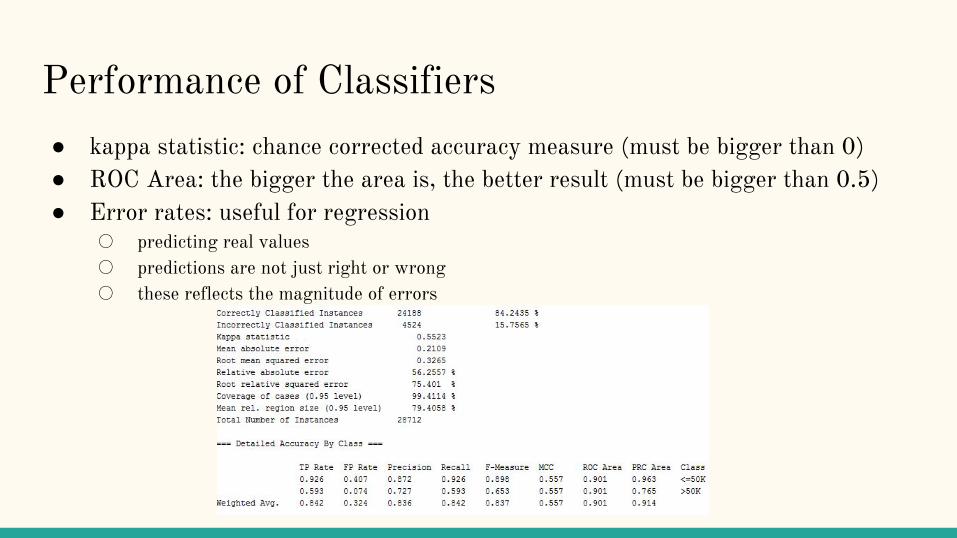
Performance of Classifiers● kappa statistic: chance corrected accuracy measure (must be bigger than 0) ● ROC Area: the bigger the area is, the better result (must be bigger than 0.5)● Error rates: useful for regression
○ predicting real values ○ predictions are not just right or wrong○ these reflects the magnitude of errors
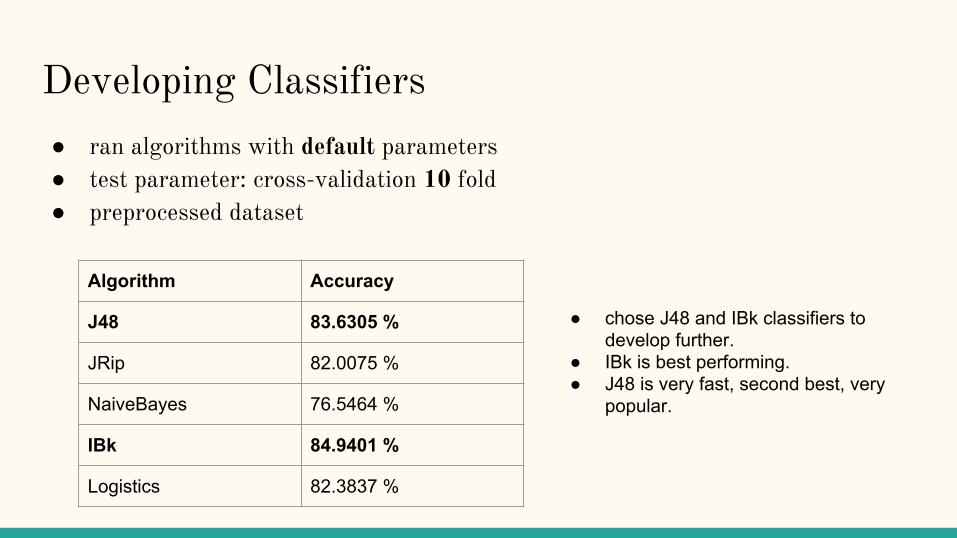
Developing Classifiers● ran algorithms with default parameters● test parameter: cross-validation 10 fold● preprocessed dataset
Algorithm Accuracy
J48 83.6305 %
JRip 82.0075 %
NaiveBayes 76.5464 %
IBk 84.9401 %
Logistics 82.3837 %
● chose J48 and IBk classifiers to develop further.
● IBk is best performing.● J48 is very fast, second best, very
popular.

J48 Algorithm● Open source Java implementation of the C4.5 algorithm in the Weka data
mining tools● It creates a decision tree based on labelled input data ● The trees generated can be used for classification and for this reason is called a
statistical classifier

Pros and Cons of J48Pros
● Easier to interpret results● Helps to visualise through a decision tree
Cons
● Run complexity of algorithm depends on the depth of the tree(i.e the no of attributes in the data set)
● Space complexity is large as values need to be stored in arrays repeatedly.

J48 - Using Default Parameters
Number of Leaves : 811Size of the tree : 1046

J48 -Setting bınarySplıts parameter to True

J48 -Setting unpruned parameter to True
Number of Leaves : 3479Size of the tree : 4214


J48 -Setting unpruned and bınarySplıts parameters to True
J48 - Observations● we initially thought Education would be most important factor in classifying
income.● J48 tree (without binarization) has CapitalGain as root tree, instead of
Education.● It means CapitalGain contributes larger towards income than we initially
thought.

IBk Classifier● instance-based classifier● k-nearest neighbors algorithm● takes nearest k neighbors to make decisions● use distance measures to get nearest neighbors
○ chi-square distance, euclidean distance (used by IBk)
● can use distance weighting ○ to give more influence to nearer neighbors○ 1/distance and 1-distance
● can use for classification and regression○ classification output - class value assigned as one most common among the neighbors
○ regression - value is the average of neighbors
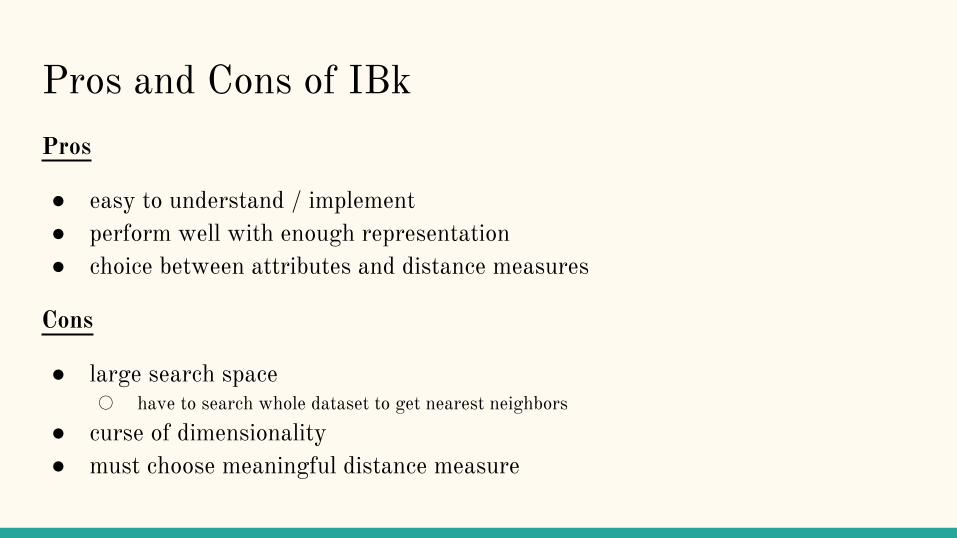
Pros and Cons of IBkPros
● easy to understand / implement● perform well with enough representation● choice between attributes and distance measures
Cons
● large search space○ have to search whole dataset to get nearest neighbors
● curse of dimensionality● must choose meaningful distance measure
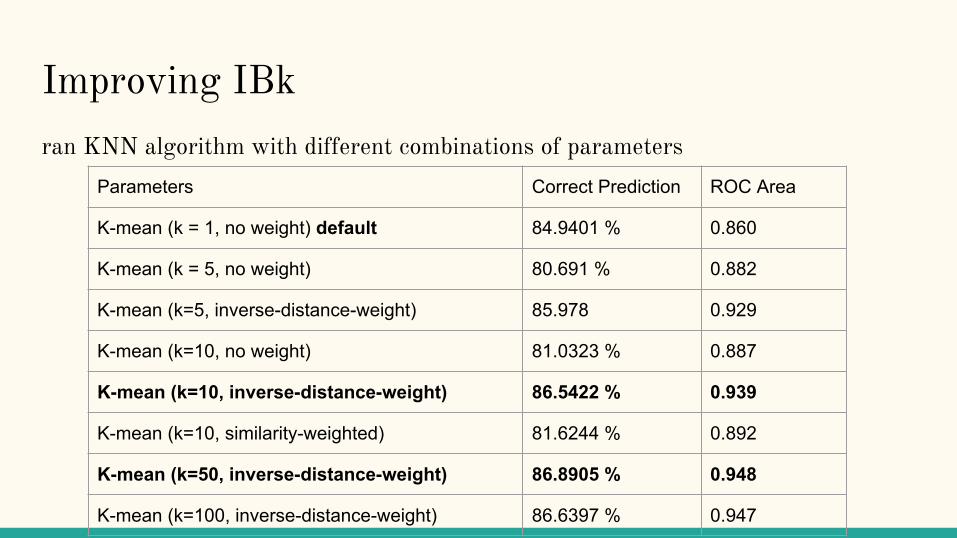
Improving IBkran KNN algorithm with different combinations of parameters
Parameters Correct Prediction ROC Area
K-mean (k = 1, no weight) default 84.9401 % 0.860
K-mean (k = 5, no weight) 80.691 % 0.882
K-mean (k=5, inverse-distance-weight) 85.978 0.929
K-mean (k=10, no weight) 81.0323 % 0.887
K-mean (k=10, inverse-distance-weight) 86.5422 % 0.939
K-mean (k=10, similarity-weighted) 81.6244 % 0.892
K-mean (k=50, inverse-distance-weight) 86.8905 % 0.948
K-mean (k=100, inverse-distance-weight) 86.6397 % 0.947
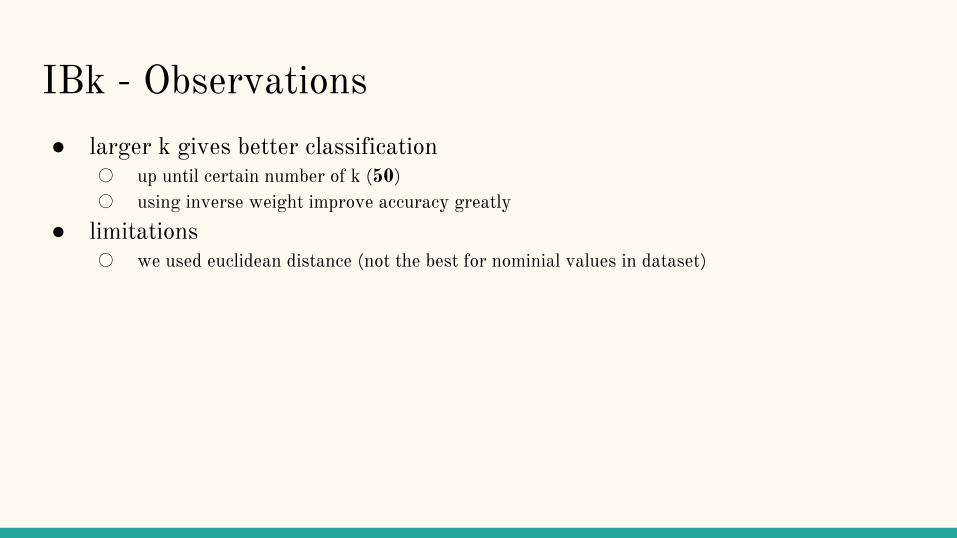
IBk - Observations ● larger k gives better classification
○ up until certain number of k (50)○ using inverse weight improve accuracy greatly
● limitations○ we used euclidean distance (not the best for nominial values in dataset)

Vote Classifier● we combined our classifier -> Meta
○ used average of probabilities
Classifier Accuracy ROC Area
J48 85.3998 % 0.879
K-mean (k=50, inverse-distance-weight) 86.8905 % 0.948
Logistics 82.3837 % 0.905
Vote 87.3084 % 0.947

What We Have Done● Developing classifier for Census Income Dataset
○ a lot of preprocessing○ learned in details about J48 and KNN classifiers
● Developed classifier with 87.3084 % accuracy and 0.947 ROC area.○ using VOTE

Thank You.