data mining of the caltrans pavement management system ... datamining report 2.0.pdf · data mining...
TRANSCRIPT

Data Mining of the Caltrans
Pavement Management System (PMS) Database
Draft report prepared for the California Department of Transportation by
Jeremy Lea, Research Engineer Infrastructure Engineering
Transportek, CSIR Republic of South Africa
John T. Harvey, Associate Professor
University of California, Davis Institute of Transportation Studies, Pavement Research Center
Pavement Research Center University of California, Berkeley
1353 S. 46th St., Bldg. 452 Richmond, CA 94804
August 2002
Revision December 2004

ii

TABLE OF CONTENTS
Table of Contents........................................................................................................................... iii
List of Figures ................................................................................................................................ iv
List of Tables ................................................................................................................................. iv
Executive Summary ........................................................................................................................ v
Acknowledgements......................................................................................................................... x
1.0 Introduction....................................................................................................................... 11
2.0 Background....................................................................................................................... 12
2.1 Conversion to Fixed Length Pavement Segments ............................................................ 14
2.2 Problems Encountered ...................................................................................................... 15
2.2.1 General Problems with the Caltrans PMS database.................................................. 15
2.2.2 1978-1992 Pavement data......................................................................................... 17
2.2.3 1992-1997 Pavement Data........................................................................................ 20
2.2.4 Awards Information .................................................................................................. 22
2.2.5 Traffic database......................................................................................................... 22
3.0 Restructured Database ...................................................................................................... 23
4.0 Data Analysis .................................................................................................................... 25
4.1 Reflection Cracking Performance of AC Overlays on PCC............................................. 25
4.2 Comparison of Climate Regions for AC Overlay of AC.................................................. 30
5.0 Conclusions....................................................................................................................... 35
6.0 Recommendations............................................................................................................. 38
7.0 References......................................................................................................................... 41
iii

LIST OF FIGURES
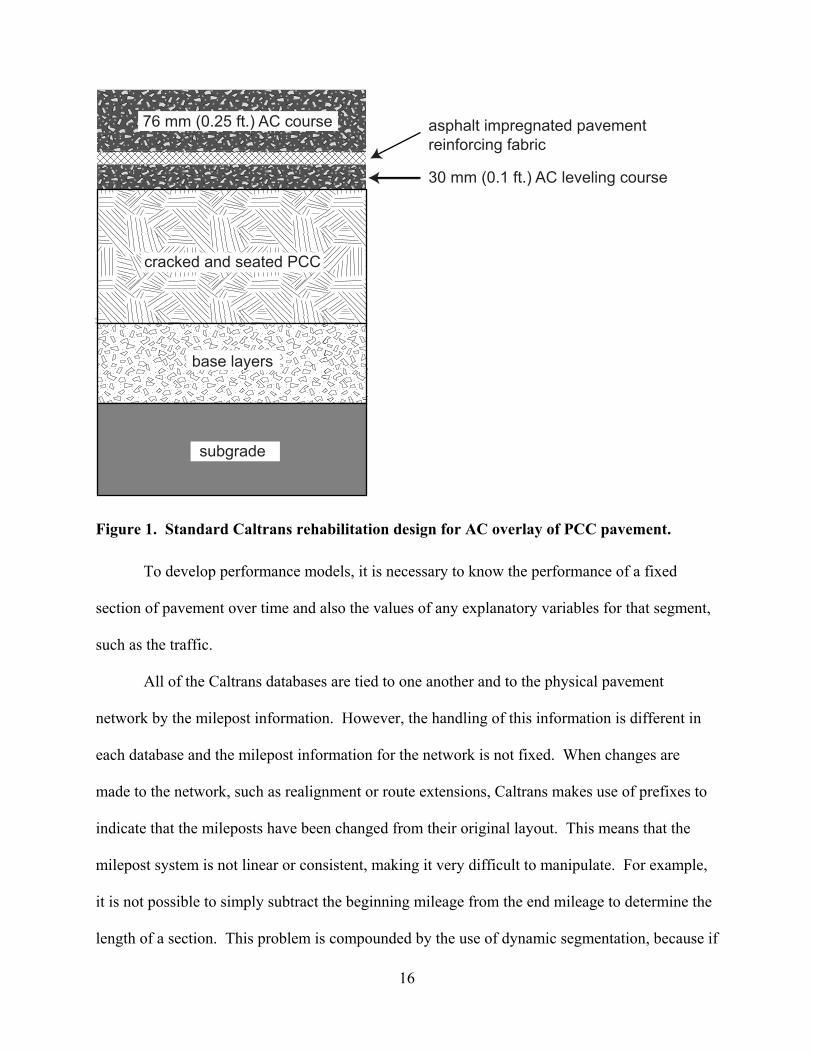
Figure 1. Standard Caltrans rehabilitation design for AC overlay of PCC pavement. ................ 16
Figure 2: Reconstructed database structure. ................................................................................ 24
Figure 3. Bayesian analysis of expected pavement life for reflection cracking in AC overlays of
PCC pavements..................................................................................................................... 28
Figure 4. Baysiean analysis of time to reflection cracking based on trafic class......................... 31
Figure 5. Bayesian analysis of stage three cracking of AC overlay of AC pavements. .............. 34
Figure 6. Bayesian analysis of reflection cracking by climate zone............................................ 36
LIST OF TABLES
Table 1 Observed Time to Reflection Cracking ........................................................................ 26
Table 2 Time to Reflection Cracking Based on Traffic Class ................................................... 29
Table 3 Time to Stage Three Cracking by Climate Zone .......................................................... 32
Table 4 Time to Reflection Cracking of AC Overlays on PCC by Climate Zone..................... 35
iv

EXECUTIVE SUMMARY
Since 1977, Caltrans has been routinely collecting performance information for its
pavement network and using a pavement management system (PMS) to manipulate this
information in order to aid in the management of the network. This report details the “mining”
of this database to extract environmental performance indicators for the various climate regions
in California, and to extract section information for portland cement concrete (PCC) pavements
that have been overlaid with asphalt concrete (with the specific goal of obtaining information
regarding the reflection cracking performance).
The first objective of this study is to provide the best possible estimate of the
performance of the standard Caltrans strategy for asphalt concrete overlays of PCC pavements,
to provide an estimate to Caltrans, and to provide calibration data for the development of
mechanistic-empirical models for reflection cracking. The second objective of this study is to
provide recommendations for short-term and long-term changes to the Caltrans PMS and the
operations that support and maintain it.
Before performance models could be developed, the PMS database required the
following work:
• Conversion from the data records that were collected following the Caltrans
“dynamic segmentation” procedure to fixed-length pavement segments. Dynamic
segmentation means that for each year, the nodes that define pavement segments
change depending upon the observed condition of the pavement surface. Dynamic
segmentation is a very good approach for maintenance scheduling, but does not lend
itself to predicting performance over time, which is necessary for any optimization of
expenditure and the extraction of a statistical sample for performance modeling.
v

• Conversion of data to appropriate formats for analysis (primarily conversion of text
strings to numeric values).
• Removal of empty and redundant fields.
• Establishment of a primary index to link records across time. This was necessary
because the “sequence numbers” used to identify sections over time were found to be
non-unique and not uniformly applied.
• Linking of the several databases of condition survey data with the traffic database and
the awards database.
Problems encountered while converting the data to fixed segments and merging of the
several PMS databases developed between 1978 and 2000 were as follows:
• The biggest problem with extracting pavement performance information from the
database is that the only information contained in the database that relates to the
pavement structure is whether the pavement surface is flexible (asphalt concrete) or
rigid (portland cement concrete). This is a major problem which it was hoped could
be solved by relying on the fact that Caltrans has used the same procedures for
designing and rehabilitating their pavements for most of the time period spanned by
the databases. In all analyses, it had to be assumed that the pavements are a
homogenous population that can be expected to have the same performance except
for external factors.
• All of the Caltrans databases are tied to one another and to the physical pavement
network by the milepost information. However, the handling of this information is
different in each database and the milepost information for the network is not fixed.
This means that the milepost system is not linear or consistent, making it very
vi

difficult to manipulate. This problem is compounded by different precisions
(decimals included in the milepost field) in the databases which causes problems due
to rounding, and by the dynamic segmentation which results in very short segments
across time which the rounding errors confuse.
The accumulated problems with the dynamic segmentation and the milepost rounding
resulted in the decision to use only the 1978 to 1992 data for performance modeling, and to not
try to merge that database with the 1992 to 1997 database. Similarly, the Awards database was
not merged with the pavement condition databases because: the awards information did not seem
to match changes in pavement condition, and there was very little information on what actual
maintenance or rehabilitation treatment was performed.
Problems were encountered with the milepost information in the Traffic database. In
particular, the milepost information is different from the milepost information in the pavement
condition databases.
The final outcome of the data processing was a single database containing pavement and
condition information based on fixed sections. This database is being delivered to Caltrans with
this draft report. This database is only based on the 1978 to 1992 data. The report contains a
description of the database structure.
The two queries performed on the database establish the performance of asphalt overlays
on existing cracked PCC pavements and the differences in performance of pavement in the
various climate regions in the state.
With regard to the reflection cracking performance of AC overlays of PCC pavements, 61
sections were included in the sample. It was found that there were two populations: one that
lasted about two years before cracking appeared, and one for which approximately 50 percent of
the overlays showed cracking after 10 years. It has been suggested that the short-lived overlays
vii

may be predominantly “maintenance” overlays of 30 to 45 mm, and are not “rehabilitation”
overlays of 106 mm, which are expected to provide a design life of about 10 years. However,
there is no information in the database regarding the thickness of the overlays, or the crack and
seat method used, the type of asphalt used, or the construction quality. The difficulty of using a
PMS database with no structural information is illustrated by this case.
The performance of the AC overlays of PCC pavements showed that sections with
medium traffic had the worst performance, followed by the high traffic sections and the low
traffic sections. This result could be due to the small data set for the low traffic sections, or
because the traffic counts in the PMS are not valid. A third possible reason is that the medium
traffic set contains many of the thin “maintenance” overlays, which results in a shorter mean life
for this group.
With regard to the performance of AC overlays of AC pavements, and AC overlays of
PCC pavements, performance was evaluated with regard to the seven climate zones defined in a
previous report (1): Bay Area, Central Valley, Desert, High Desert, Mountain, North Coast and
South Coast.
For AC overlays of AC pavements, the assumption is that the Caltrans AC overlay design
method (California Test Method 356) accounts for traffic volume and pavement condition to
provide a 10-year design life, but does not account for difference in climate region. Again, the
assumption is that the overlays are designed for 10-year life, but because of the lack of structural
information in the PMS, it is likely that the sample included some thin maintenance overlays.
The results indicated that in the Bay Area, Central Valley, and North Coast climate regions, the
overlays have good performance, while in the other climate zones the performance is not as
good. The South Coast and High Desert regions appear to be bimodal. The mean lives to Stage
3 cracking were between 9 and 12 years.
viii

For AC overlays of PCC pavements, there was little difference observed between the
climate regions.
Recommendations for changes in the operation of the Caltrans pavement management
system database are:
• Develop a new milepost system,
• Include structural information in the PMS database,
• Use fixed evaluation segments for the condition survey, and develop the dynamic
segmentation for maintenance management through post-processing,
• Rationalize the database structure used to store pavement related data, including the
use of more appropriate primary keys than the currently used concrete or asphalt
surface type, and
• Perform quality checking of the traffic database using Caltrans Weigh-In-Motion
(WIM) data.
Future research and performance model development using the Caltrans PMS database
requires implementation of the previous recommendations. Once these recommendations have
been implemented, it is recommended that the database be used to develop more sophisticated
models than those that could be developed with the current database. These models can look at
additional distress mechanisms and ride quality as measured using the International Roughness
Index (IRI). More sophisticated models should include:
• More distress mechanisms, and
• More explanatory variables, including materials types, rehabilitation strategies,
maintenance strategies, and if connected to the database, construction quality.
ix

ACKNOWLEDGEMENTS
This study was made possible by the help of the Caltrans Pavement Management unit of
Headquarters Maintenance.
x

1.0 INTRODUCTION
Since 1977, Caltrans has been routinely collecting performance information for its
pavement network, and using a pavement management system (PMS) to manipulate this
information in order to aid in the management of the network. This report details the “mining”
of this database to extract environmental performance indicators for the various climatic regions
in California, and to extract section information for portland cement concrete (PCC) pavements
that have been overlaid with asphalt concrete (with the specific goal of obtaining information
regarding reflection cracking performance). The first objective of this report is to provide the
best estimate possible of the performance of the standard Caltrans strategy for asphalt concrete
rehabilitation of PCC pavements.
The Caltrans PMS Database, as referred to in this report, consists of five separate
databases obtained by the University of California Pavement Research Center from the Caltrans
Maintenance Program. These databases are as follows:
• A database of pavement sections covering the period 1978 to 1992,
• a corresponding database of lane conditions covering the period 1978 to 1992,
• a combined section and condition database covering the period 1992 to 1997,
• a spreadsheet which contains awards information from 1978 to 1997, and
• a database of traffic counts for the network, covering the period 1980 to 1997.
These databases have been imported into Microsoft Access and (to the extent possible)
the tables have been cleaned and manipulated to try and provide a consistent set of data.
The Caltrans PMS database is used for maintenance scheduling, and therefore most of the
information contained within the systems is focused on institutional data rather than pavement
related data. This, along with the evolution of the system over time, has made the extraction of
11

meaningful statistical data from the system very difficult. Because of these difficulties, this
report also makes some recommendations for changes or improvements to be applied to any
future PMS system, especially any system directed towards research or strategic management
rather than the day to day management of the network.
The second objective of this report is to provide short-term and long-term
recommendations for change to the Caltrans PMS and the operations that support and maintain
it.
2.0 BACKGROUND
The University of California Pavement Research Center (PRC) along with its research
partners is currently developing a new pavement design methodology for Caltrans, compatible
with the AASHTO 2002 method, that will make use of a mechanistic-empirical design process.
As implied by the term “empirical,” the equations used by the methodology require calibration
from field data. Along with heavy vehicle simulator (HVS) test sections and experimental
sections, one of the main sources of data for calibration of empirical pavement performance
models is from historical pavement performance information collected and used by road agencies
in the context of day-to-day management of a highway network. This data is normally stored
within a pavement management system (PMS).
One of the goals in the Strategic Plan (2) for the PRC is the calibration of mechanistic-
empirical performance models. A task of this goal, also necessary for the development of the
Caltrans Mechanistic-Empirical Design Procedure, was to investigate the use of the Caltrans
PMS database as a source for information to build statistical models for pavement performance,
a task normally referred to as data mining. In particular, two sets of performance models are
difficult to develop using only HVS testing and field experimental test sections: differences in
12

pavement performance within various environmental regions in the state; and reflection cracking
of thin overlays on cracked pavements (either rigid or flexible), because of the effects of climate
on reflection cracking.
Caltrans first implemented a pavement management system in 1977, when the concept of
pavement management was relatively new, and computers were not as powerful as they are
today. Over the subsequent 25 years, there have been large improvements in computers and
significant changes in the theory and practice of pavement management, both within the way
pavements are maintained in the State of California, and within Caltrans itself. These changes
have led to the slow evolution of the Caltrans PMS database. In particular, the database
management software has been changed three times, with concurrent changes in the structure of
the database. There have also been changes in the structure and usage of various fields within
the database structure. These changes have primarily been made to improve the capability of the
PMS for day-to-day management of the network, but have sometimes made performance
modeling more difficult because of lack of compatibility of the data fields across the changes.
Within the set of databases referred to in this report, two distinct databases of pavement
condition information exist: 1978-1992 and 1992 onwards. The earlier data was stored in two
tables, which were not related; the more recent data was stored in one table. These tables were in
Microsoft FoxPro format. In addition, a table of traffic data (also in FoxPro format) and a
Microsoft Excel spreadsheet containing contact awards information were also obtained from
Caltrans.
Because of the evolution of the Caltrans PMS over the years, the historical information
contained in the database was difficult to extract. The evolution of the PMS has mostly been
guided by the way that the system has been used within Caltrans, and in today’s PMS literature,
the system would be referred to as a maintenance management system because it is geared
13

toward providing information for short-term maintenance activities rather than long-term
optimization of expenditure on the pavement network.
In particular, Caltrans has adopted a “dynamic segmentation’ procedure in which the
pavements are not evaluated over fixed lengths, rather, the pavement is divided into sections of
similar distress during each assessment. While this is a very good approach from the perspective
of maintenance scheduling, it does not lend itself to predicting performance over time, which is
necessary for any optimization of expenditure, nor to the extraction of a statistical sample for
performance modeling.
2.1 Conversion to Fixed Length Pavement Segments
Before any analysis of the data as a time series could be performed, the data had had to
be converted into a format amenable to performance modeling—performance information over
fixed sections from assessment to assessment. The process of converting to this format is
theoretically very easy, provided the data is clean. It involves extracting all of the dynamic
segment boundaries from the database and establishing these as a set of fixed boundaries.
Following this, the assessment data from each dynamic segment is assigned to each of the fixed
segments that it spans. Thus, a performance history for each fixed segment is constructed.
However, this conversion does not solve the underlying statistical problem with the use
of dynamic segments, which is that the performance information may have been collected (and
therefore averaged) over different sections of pavement, and thus does not necessarily reflect the
real performance of the converted “fixed” segment. While this is unlikely to introduce statistical
bias into any models developed from the data, it will mask the true performance of each fixed
segment, reducing the possibility of extracting meaningful models from the data.
14

2.2 Problems Encountered
While trying to convert the data to fixed segments and merge all of the databases
together, a number of problems were uncovered. This section outlines these problems according
to which of the five original databases contained the problem while describing the structure of
the original databases and the manipulations performed to clean them.
2.2.1 General Problems with the Caltrans PMS database
The biggest problem with extracting pavement performance information from the
database is that the only information contained in the database that relates to the pavement
structure is whether the pavement surface is flexible (asphalt concrete) or rigid (portland cement
concrete). This is a major problem, which it was hoped could be solved by relying on the fact
that Caltrans has used the same procedures for designing and rehabilitating their pavements for
most of the time period spanned by the databases. In particular, it was assumed that Caltrans has
used one strategy for overlaying PCC pavements with asphalt concrete (AC), as shown in Figure
1.
It was also assumed that the year the overlay was constructed would be obvious in the
database because the surface would change from PCC to AC. It was later learned that Caltrans
occasionally also applied 30 to 45 mm (0.1 to 0.15 ft.) maintenance AC overlays that were
indistinguishable in the database from the thicker rehabilitation overlays.
In all analyses, we had to assume that the pavements are a homogenous population that
can be expected to have the same performance except for external factors. However, there are
differences in the construction quality and materials across the state.
15
cracked and seated PCC
base layers
subgrade
30 mm (0.1 ft.) AC leveling course
asphalt impregnated pavementreinforcing fabric
76 mm (0.25 ft.) AC course
Figure 1. Standard Caltrans rehabilitation design for AC overlay of PCC pavement.
To develop performance models, it is necessary to know the performance of a fixed
section of pavement over time and also the values of any explanatory variables for that segment,
such as the traffic.
All of the Caltrans databases are tied to one another and to the physical pavement
network by the milepost information. However, the handling of this information is different in
each database and the milepost information for the network is not fixed. When changes are
made to the network, such as realignment or route extensions, Caltrans makes use of prefixes to
indicate that the mileposts have been changed from their original layout. This means that the
milepost system is not linear or consistent, making it very difficult to manipulate. For example,
it is not possible to simply subtract the beginning mileage from the end mileage to determine the
length of a section. This problem is compounded by the use of dynamic segmentation, because if
16

the milepost system is changed for a section of road, then the surveys from before the change are
relative to the old mileposts, while future surveys are relative to the new mileposts.
While it should be possible to relate all of the databases through the milepost system, the
prefix information is often missing, so that it is not possible to determine which set of mileposts
apply. Also the databases use different precision to store the mileage – some use one decimal
place, others two and others three, which prevents direct comparison within the database
software because of rounding. This problem is compounded by the dynamic segmentation,
which results in very short segments across time so that rounding of mileposts can move a
section from one segment to another over time.
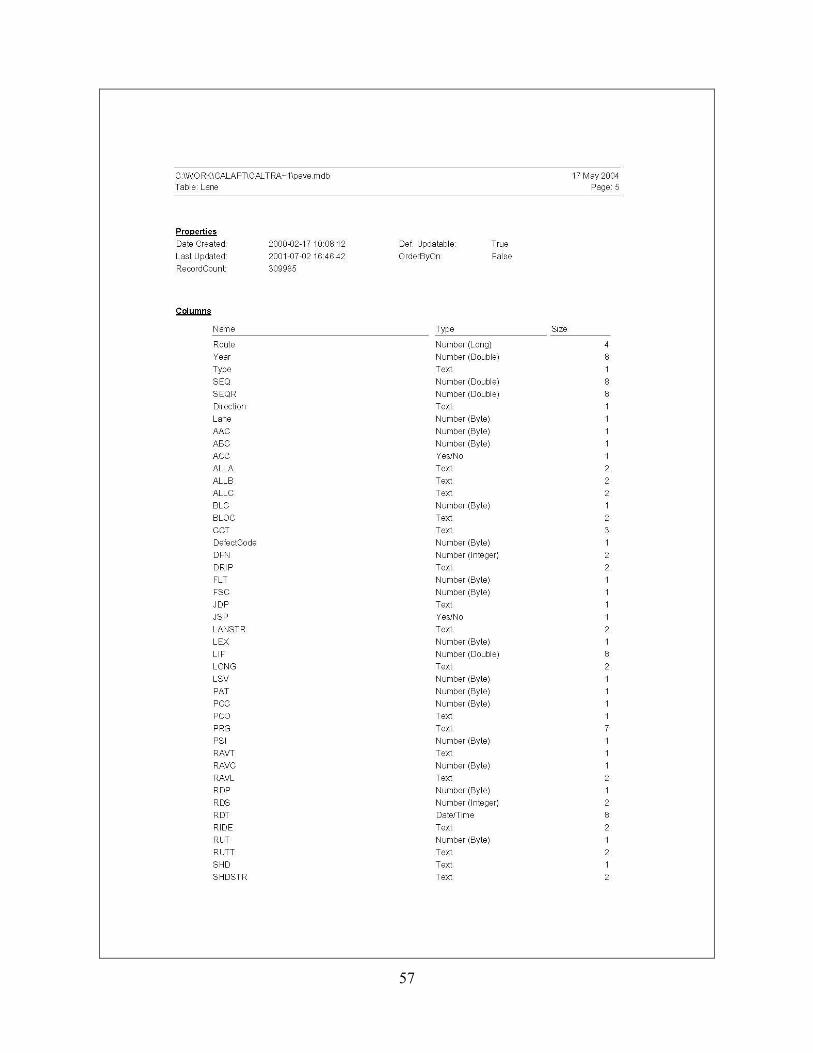
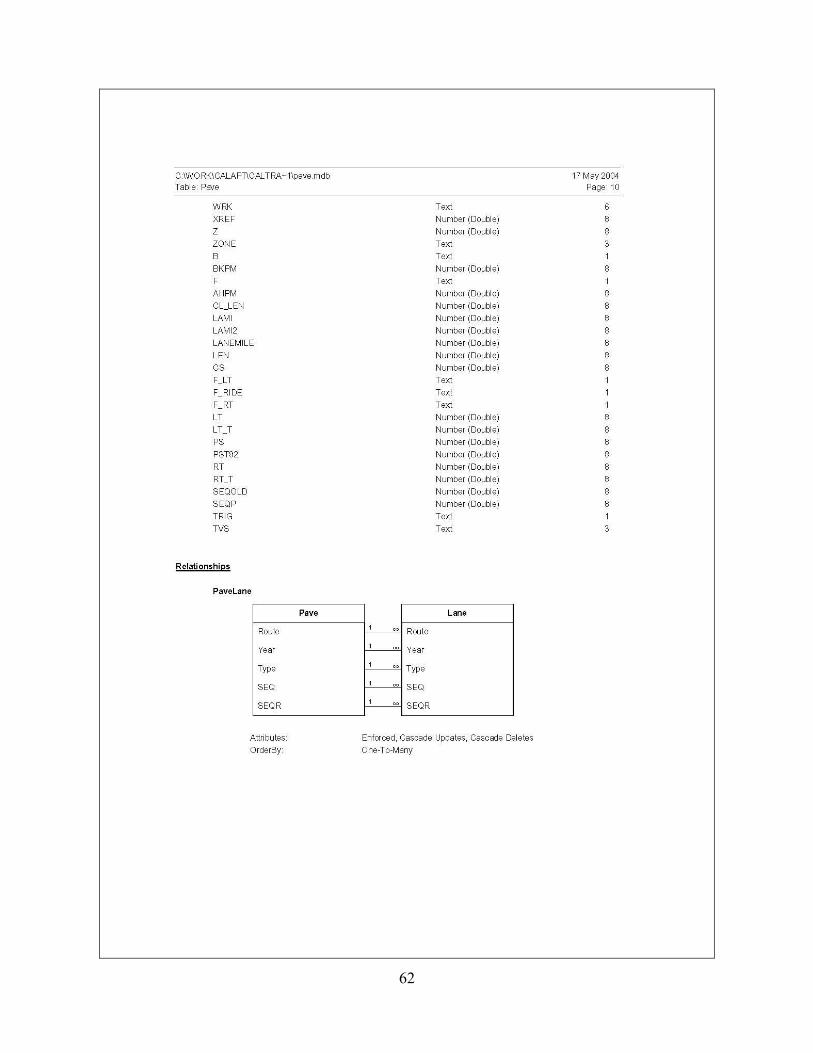
2.2.2 1978-1992 Pavement data
This section of the database was contained in two separate databases, which were not
linked together. The first (pave.dbf) contained information about the various pavement sections
during this period, including the route numbers, the county and district, and the milepost
information. Also included in this database was climatic and geographic information, along with
some other basic information and maintenance history. The section condition information was
contained in another database (lane.dbf), which contained one record for every lane that was
rated.
Because of the age of these databases, many of the fields were not formatted with the
appropriate data types (real, integer, date, or text), and the databases did not contain primary
indices, resulting in the records in the database not being unique. Also, there were no defined
relationships between the pavement sections and their condition ratings. The field types had also
been modified over time with the result that the database contained a large amount of redundant
information that is no longer synchronized.
17

The first stage of the processing of these databases was to convert the data types to the
appropriate formats for the data (such as converting text strings containing dates into date data
types). During this process, a number of redundant and empty fields were also removed.
Appendix A contains the database field definitions for the original databases and the resulting
structures. In this appendix, the original descriptions and data types are shown, along with any
revisions based on the processing of the data. As a result of the data type conversions, the size of
the lane database (lane.dbf) was reduced by 50 percent and the pavement database (pave.dbf) by
around 30 percent.
The second stage of processing was to remove any duplicate records from the database so
that a primary index could be established. The original databases contained some fields that
were a concatenation of several other fields, which were the original indices. However, these
indices contained incorrect data and also contained duplicates, and so a new index had to be
constructed.
The condition information was linked to the pavement information by a “sequence
number,” which should have been unique for each pavement section. These numbers were
assigned at the time that data was collected. However, there were two problems encountered
with these sequence numbers. The sequence number format was changed in 1985, however for
1985 and 1987, the pavements were rated with both sets of numbers. The result is that for these
years, many pairs of pavement segments have the same old style sequence number but
inconsistent new numbers, or alternatively, the same new style numbers but inconsistent old style
numbers. Thus both sets of sequence numbers proved to be necessary and had to be retained in
the database to maintain the continuity over time necessary for performance modeling.
The sequence numbers were also not unique for a particular route, which was the
minimum information available within the table to look up condition information for a pavement.
18

If the pavement type changed from flexible to rigid (or visa versa) along a route, then the
sequence numbers were restarted, and thus the pavement type also needed to be stored. If the
sequence numbers had been a continuously increasing series along a route, then they could have
been more effectively used to resolve conflicting milepost information. Also, the sequence
numbers normally started at a new value in each county. The sequence numbers should have
been unique to the entire route, rather than just the portion of the route in a particular county.
However, this was not strictly enforced, so the sequence numbers often started at the same value
in two or more counties.
The final index for the pavement table was the route, two sequence numbers, the year of
assessment, and the pavement type (flexible or rigid). The final index for the lane table was the
index for the pave table plus the lane direction and number. It took approximately three person-
months to manually resolve all of the conflicting sequence numbers in the two tables and to try
to resolve the milepost information so that the sequence numbers and the mileposts both
incremented in the same direction.
This still did not provide enough information to build a relationship between the
pavement and the lane tables sufficient to match the condition information to the milepost
information. Once the two tables had been cleaned, and the keys listed above established as
unique keys, there were still a large number of keys that existed in only one of the two tables.
For the database software to establish a relationship between the tables, it requires the full
(unique) index from one of the two tables and that other table only contains these values and no
additional values. Another two person-months was spent reconciling these values between these
two tables. This task was made more complex by the nature of the lane table, since it contained
no location information (other than the suspect sequence numbers).
19

After processing, the pavement database contained 80,999 records (i.e., unique sections),
and the lane database contained 309,965 individual condition assessments. Originally the
pave.dbf table contained 99,190 records, and the lane.dbf table contained 538,082 records. The
majority of the difference can be attributed to the fact that lane.dbf contained assessments for
ramps and other auxiliary pavements, which were deleted. The remainder of the difference was
in duplicate records.
The pavement table contained traffic information in the form of AADT (average annual
daily traffic) counts for the section, but upon preliminary inspection, it was found that these
counts were not reliable. The values were often very high, and the counts for a particular section
changed dramatically (sometimes by up to three orders of magnitude) from year to year.
2.2.3 1992-1997 Pavement Data
This database consisted of a single table containing both the information about pavement
sections and condition information (all_dbs.dbf). The data types were mostly the appropriate
types for the data they contained, and so this table required far less preprocessing. The structure
of this database was different from the earlier database in that it is divided by lane and mileposts,
as opposed to the earlier data in which all of the lanes are grouped under one set of milepost
information per survey. This not only made the database very big, but also meant that it was
much more difficult to detect problems in the milepost information because the mileposts for one
lane might stop and start as the lane is added/dropped in hilly topography or as the route passes
through more densely/sparsely populated areas.
This table also contained duplicate records that needed to be identified and removed
before a primary index could be established. A number of predefined indices, one of which
should have been the primary index, were included as additional data fields.
20

Besides the duplication in data caused by storing the segment specific information for
each lane, this database also contained a large amount of redundant information. In particular, it
contained the same section information in every lane record. It also contained two complete sets
of milepost information, two sets of odometer readings from when assessments were performed,
and four pavement length descriptions. After a great deal of data processing, it was decided that
the second set of milepost information was the most reliable and also best matched the route
lengths from the older data. The remainder of this redundant data was thus discarded.
Additionally, all of these lengths were stored in miles, to a precision of three decimal places, or a
resolution of 1.6 m (5.2 ft.), with a very large number of pavement sections less than 100 m (328
ft.) long. The milepost information in the other data was only stored to one decimal place.
After processing, this database contained 104,927 condition assessments, of which
approximately 40,000 (40 percent) have conflicting milepost information and conflicting
sequence numbers or other details required to establish a primary index. Processing of this
database was stopped at this point because of the fact that data was segmented on a lane-by-lane
basis, combined with the large number of very small sections, would have resulted in a very
large number of fixed sections when the database was processed to remove the dynamic
segmentation. Because merging this data with the 1978-1992 data would have required applying
this new set of fixed segments along with those obtained from the earlier data, this would have
resulted in too short and too many and segments to be handled effectively.
This database contains different condition rating fields from those in the older data, so a
consistent set of statistical variables could not be extracted anyway. It would appear that
Caltrans has standardized on this new method of condition assessment and database format, and
so any more recent data needs to be joined with past data, and a method needs to be devised to
extract fixed segments.
21

2.2.4 Awards Information
This spreadsheet contained information about the contracts awarded, organized by route
and milepost. However, because the information was contained in a spreadsheet and not a
database, the data integrity was even worse then that of that of the databases. Although there is a
great deal of financial information, there is very little information about the actual maintenance
or rehabilitation treatment performed, so the only real use of this database is to establish the
dates when maintenance might have taken place on various sections. However, upon inspection
of the data, none of the awards appear to match when there have been changes in the condition of
sections — this implies that either the award dates are not close to the actual dates of
maintenance or rehabilitation activities, or that the milepost information in the awards database is
not accurate. Only some preliminary inspection of this data, and conversion to a Microsoft
Access table was thus performed.
2.2.5 Traffic database
A single database table, containing traffic information from 1980 to 1997 was also
obtained from Caltrans. This table had a fairly simple structure, consisting of traffic information
at a particular milepost on a route for a particular year. This data also uses dynamic segments, so
that the mileposts at which traffic counts are performed need not be the same from year to year.
The quality of the traffic information was not verified in this study. It may be that many
of the traffic data are incorrect or out of date. It is not certain when the traffic database was last
subjected to a comprehensive audit and field check. It is known that Weigh-In-Motion (WIM)
traffic counts and axle weights are not included in the traffic database.(3)
Relatively little processing of the traffic database was needed; only some minor
corrections for mistyped county names or route numbers were required. The primary index for
22

this table should be the route, the county, the sequence number (different from that in the other
databases), and the year in which the count was performed. However, this key has not yet been
established because there are 7,450 records of the 67,243 records where the sequence number is
missing. All of these data points are from 1996 and 1997. These records should be fairly easy to
resolve once the milepost information is cleaned.
The problem with using this database is that it stores different milepost information from
the other databases. Not only are miles stored to two decimal places, the prefixes are also
different. To match this data to the fixed segments determined for the 1978-1992 data requires
working through every data point in this file to establish its true mileage along the route so that it
can be added into the fixed segment boundaries. This would be easy to automate if the milepost
prefixes were the same in both databases, but because of discrepancies the data, automatic
processing isn’t possible.
3.0 RESTRUCTURED DATABASE
The final outcome of the data processing was a single database containing pavement and
condition information based on fixed sections. This database is being delivered to Caltrans with
this draft report.
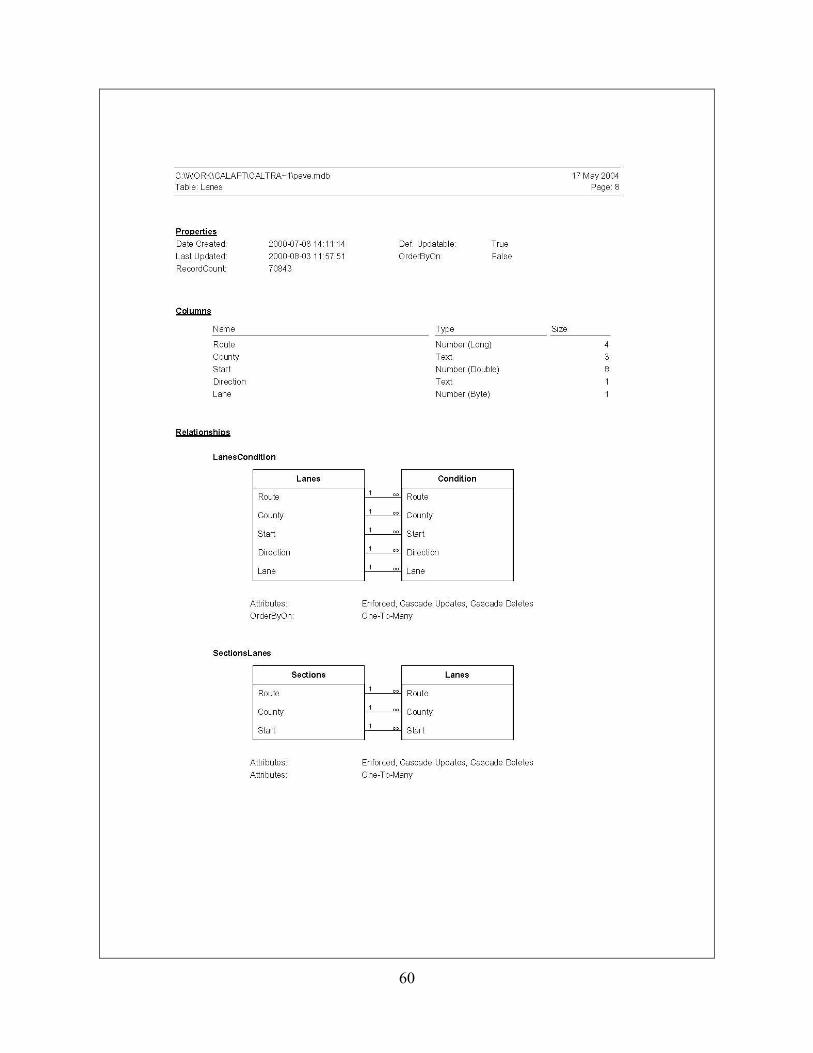
The database is only based on the 1978-1992 data and consists of a number of tables
linked by various relationships. The entry point into the database is the Roads table, which
contains one record per road within the state, broken up by route and county. There are 541
“roads” in the database.
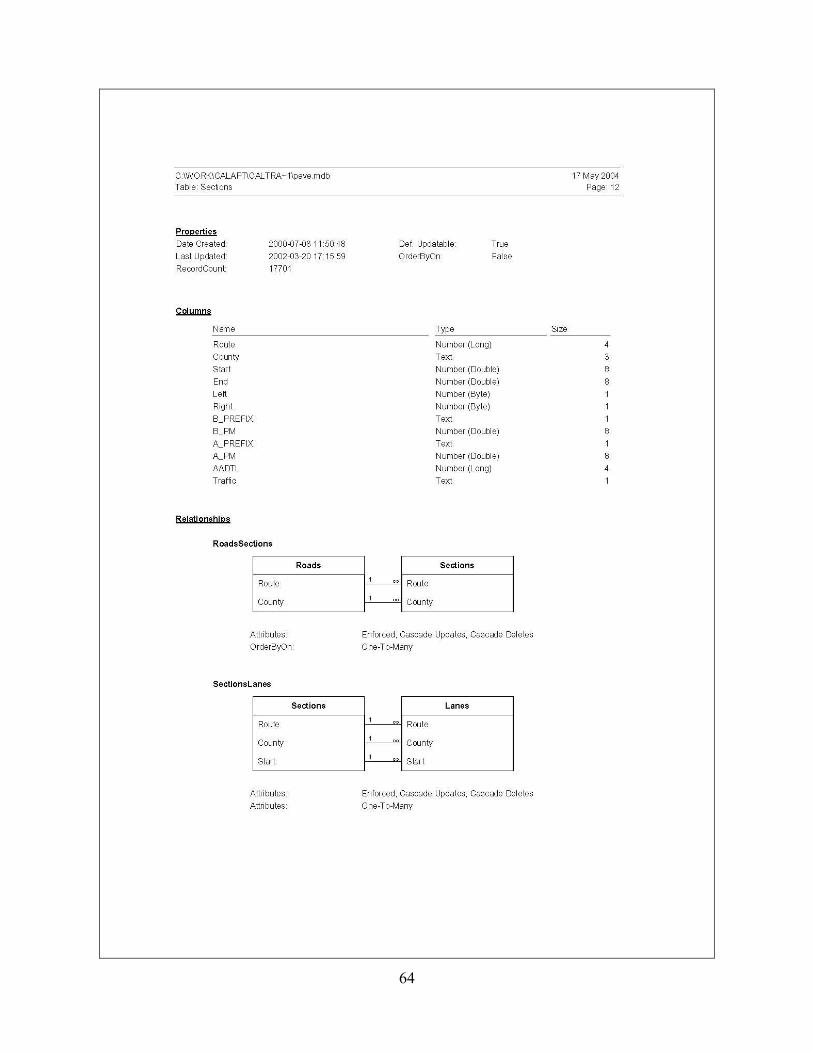
Below the Roads table is the Sections table, which contains the fixed beginning and
ending mileposts for each section in the database’s milepost system, and in terms of the Caltrans
milepost system (the milepost that occurred most frequently was used to populate this table),
23

along with the number of lanes in each direction. There are 17,701 fixed “sections” in the
database. Below the Sections table is a Lanes table, which adds the direction and lane number to
the index, and represents a single lane of the pavement. Below this table is a Condition table,
which contains the annual condition information for each of the lane segments.
Currently the Condition table holds a link to the corresponding Lane table entry, which
holds the original condition data. In the future, the condition data will be held in this table
directly, and the original data tables removed from the database.
The relationships between these tables is shown in Figure 2.
Figure 2: Reconstructed database structure.
Future work on this database will be to link the roads and Caltrans mileposts to the
Caltrans state highway GIS coverage. This will involve the determination of the actual mileages
along each road (from the GIS data) and linking these to the Caltrans highway log to establish a
transformation from the milepost system to a physical location. Once this has been performed,
the traffic data and the condition data from 1992 onwards can be linked into the structure above.
24
This work needs to be performed using GIS because it is designed to handle physical location
referencing systems, and so can perform analyses that are impossible in a relational database.
4.0 DATA ANALYSIS
The processed database has sufficient information to perform some basic queries about
the performance of pavements within the state, albeit only from 1978 to 1992. For the
development of the Caltrans mechanistic-empirical pavement design method, the two most
pressing queries were to establish the performance of asphalt overlays on existing cracked PCC
pavements, and the differences in performance of pavements in the various climate regions in the
state.
4.1 Reflection Cracking Performance of AC Overlays on PCC
One of the standard Caltrans maintenance practices is to overlay cracked PCC pavements
with asphalt. While these overlays are designed with a 10-year design life, it was suspected that
the actual performance of the overlays was considerably less. One of the primary reasons for the
analysis of the database was to determine if a transfer function could be developed for reflection
cracking of asphalt overlays. However, the various statistical problems described in other
sections of this report prevented a proper statistical analysis.
What has been performed is an analysis of the expected life of an asphalt overlay, based
on Bayesian updating of the original statistical analysis.(4) In this analysis of 61 sections, the
mean life was 7.33 years, with a standard deviation of 1.76 years. This standard deviation was
split into a deviation of the mean of 0.29 years and a sample deviation of 1.74 years.
To obtain a data set, a series of database queries were executed, which extracted all
sections where the surfacing changed from concrete to asphalt. The time from this change to the
25

last condition assessment where no cracking was observed, and the time until the first condition
assessment where cracking was observed was determined. Thus, expected life was defined as
the point when cracking is visible. Observed time to reflection cracking is shown in Table 1.
As can be seen, the range is normally four years: two years from the last assessment
when the pavement was concrete and the first when it was asphalt, and then another two from the
last assessment without cracks and the first assessment with cracks.
Table 1 Observed Time to Reflection Cracking Observed Life (Years) Number of Sections Lane Length (miles)>1 4 0.4 >2 21 9.1 >3 485 309.5 >4 3 2.1 >5 380 198.9 >7 467 217.1 >9 60 35.1 >11 5 1.5 >12 12 2.0 0-1 70 15.3 0-2 469 191.8 0-3 195 48.2 0-4 562 284.9 0-5 16 8.7 1-5 53 28.4 2-5 37 12.9 2-6 253 120.1 2-7 52 27.7 3-7 32 10.2 4-7 44 13.4 4-8 18 9.0 4-9 99 57.5 5-9 30 14.7 6-9 2 0.2 7-11 8 1.4 8-12 2 0.7
26

Based on the original distribution (which is what is assumed by the Caltrans design
method), the likelihood that these various lives would be computed is calculated and this is used
to update the distribution to obtain a new distribution for the mean life.
Given that all of the sections have different lengths, the likelihood function was weighted
by the section length. A “weight” of 50 miles was assigned to the original distribution. Based
on preliminary analysis of the likelihood, it was observed that there appear to be two distinct
groups in the data: pavements that have failed and pavements that have not. In the analysis,
these were split into “poor” and “good” groups, respectively. This might not be the best
grouping as some of the pavements that had not failed only had very short service, and some of
the pavements that had failed had much longer service lives.
The results of the analysis are shown in Figure 3, where the likelihood functions, the
probability density functions of the mean, and the expected life can be seen. It is fairly obvious
from this figure that the “poor” pavements have an expected life considerably less than the mean
life expected by the Caltrans design method, while the “good” pavements are performing fairly
well compared to the design. It is thus likely that there are two statistical populations: pavements
for which the overlay was successful and pavements for which the overlay failed prematurely. It
has been suggested that the short-lived overlays may be predominantly “maintenance” overlays
of 30 to 45 mm, and are not “rehabilitation” overlays of 106 mm shown in Figure 1. The
difficulty of using a PMS database with no structural information is illustrated by this case.
It is possible to determine which sections had short lives and which had long lives in
order to establish a data set for further investigation to determine which factors contributed to the
differences in life. For example, construction records could be found to determine the crack and
seat method used, the type of asphalt used, and whether a membrane was used.
27

0
0.2
0.4
0.6
0.8
1
0 5 10 15 20
Nor
mal
ized
Lik
elih
ood
Likelihood functions
good performancepoor performance
0
0.5
1
1.5
2
2.5
3
0 5 10 15 20
Pro
babi
lity
dens
ity
Probability density of mean
originalgood performancepoor performance
all data
0
0.05
0.1
0.15
0.2
0.25
0 5 10 15 20
Pro
babi
lity
dens
ity
Years
Probability density of expected life
originalgood performancepoor performance
all data
Figure 3. Bayesian analysis of expected pavement life for reflection cracking in AC overlays of PCC pavements.
28

The most obvious explanatory variable in any pavement is traffic, and so the traffic data
from the 1978-1992 PMS database was used to determine three traffic categories for these
sections based on the average annual daily vehicles per lane. As has been mentioned previously,
this data does have several problems, but due to the inadequacies of the milepost system, the
traffic database cannot be related to the PMS sections and so the this data had to be used despite
its problems. The traffic was broken into three traffic classes: light, medium, and heavy. These
classes were further split at 2000 and 10000 vehicles per lane per day. The breakdown on
section lengths is shown in Table 2.
Table 2 Time to Reflection Cracking Based on Traffic Class Observed Life (Years) Low Medium High >1 0.4 >2 2.0 7.1 >3 15.8 105.5 188.2 >4 2.1 >5 13.5 89.9 95.5 >7 7.2 99.6 109.9 >9 2.6 32.5 >11 0.1 1.4 >12 0.2 0.1 1.7 0-1 2.4 9.1 3.8 0-2 6.5 143.5 41.8 0-3 2.7 15.2 30.3 0-4 3.9 192.5 88.5 0-5 0.5 7.3 0.9 1-5 3.2 25.3 2-5 11.7 1.2 2-6 0.4 51.6 67.8 2-7 3.0 18.1 6.6 3-7 5.7 4.5 4-7 9.9 3.5 4-8 0.9 8.1 4-9 48.6 8.9 5-9 6.2 8.5 6-9 0.2 7-11 0.2 1.2 8-12 0.8
29

Few pavements fell into in the low traffic class because these pavements tend to be
flexible pavements, and secondly, seldom require an asphalt overlay if they were constructed as
rigid pavements. The results of the Bayesian analysis are shown in Figure 4, where it can be
seen that although the traffic does have a significant influence, the sections with between 2000
and 1000 vehicles/lane/day have the lowest mean time to reflection cracking, followed by the
high traffic pavements; the low traffic pavements have the highest mean. There are three
possible reasons for this, other than some real effect from traffic on reflection cracking. The first
is that the data set for low traffic volumes is very small. The second is that, as mentioned, the
traffic counts from the PMS database may not be valid. The third is that the “maintenance”
overlays may have been primarily placed on the medium (2,000 to 10,000 vehicles/lane/day)
sections.
4.2 Comparison of Climate Regions for AC Overlay of AC
With accelerated pavement testing, it is difficult to include the effects of climate on
pavement performance. It was hoped that the PMS data could be used to develop calibration
factors for the various climate regions in the state, and to obtain some idea of the relative
performance of pavements within the various areas. A sample of all of the single lane asphalt
roads from across the state was taken, and all of the roads classified by the climate zone into
which they fell. The climate zones were those determined for the new Caltrans Mechanistic-
Empirical design method,(1) which divides the state into seven climate regions: North Coast,
High Desert, Mountains, Bay Area, Central Valley, Desert, and South Coast. Once this subset of
the data had been extracted, the time between a condition of no distress and the occurrence of
stage three alligator cracking was determined. These results are shown in Table 3.
30

0
0.2
0.4
0.6
0.8
1
0 5 10 15 20
Nor
mal
ized
Lik
elih
ood
Years
Likelihood functions
LowMedium
High
0
0.5
1
1.5
2
2.5
0 5 10 15 20
Pro
babi
lity
dens
ity
Years
Probability density of mean
LowMedium
High
0
0.05
0.1
0.15
0.2
0.25
0 5 10 15 20
Pro
babi
lity
dens
ity
Years
Probability density of expected life
LowMedium
High
Figure 4. Baysiean analysis of time to reflection cracking based on trafic class.
31

Table 3 Time to Stage Three Cracking by Climate Zone Climate Zone Observed
Life Bay Area
Central Valley Desert High
Desert Mountain North Coast
South Coast
>2 40.8 307.5 165.0 2.4 79.0 12.2 16.6 1-3 1.9 27.8 0.8 10.9 81.2 4.4 17.8 2-3 2.7 15.8 1.7 15.7 0.4 >3 71.7 162.9 17.8 10.4 162.3 0.2 35.0 2-4 15.9 0.3 1.0 34.4 0.2 3-5 44.4 20.9 29.7 36.2 1.2 4-5 3.5 1.4 3.1 3.6 >5 237.6 200.5 272.2 30.4 186.1 9.8 64.5 4-6 2.2 11.2 8.4 5-7 10.6 38.1 3.7 11.6 28.4 6-7 7.5 9.6 0.1 >7 148.6 421.0 369.2 14.9 144.0 30.4 49.0 6-8 0.1 4.5 0.2 7-9 0.1 59.8 9.0 31.3 0.1 6.6 8-9 28.8 0.2 0.3 >9 119.9 459.1 138.5 13.0 87.1 14.7 93.4 9-11 0.2 31.1 5.4 16.4 1.9 >11 116.7 652.4 172.3 29.9 83.9 56.4 138.6 >12 5.2 119.9 12.6 16.8 19.5 55.5 7.5 >14 300.9 1977.6 423.5 30.4 405.2 358.7 227.3
Several things are apparent from the data in Table 3. The first is that the sample sizes
from the various regions differ significantly, ranging from about 200 lane miles in the High
Desert to 4600 miles in the Central Valley. Also, there are large differences in observed life
between the various climate regions: In the North Coast 66percent of the roads have >14 years
(the full survey period) without any observed stage three cracking, while in the High Desert this
is only 15 percent, and nearly 50 percent fail before 5 years.
The same Bayesian analysis technique was applied to this data set except that a mean
initial life of 7 years 4 months was assumed to match Caltrans AC rehabilitation overlay
expected life and the initial distribution was weighted by 200 miles. A sample standard
deviation of 1.74 years and a mean standard deviation of 4 months was used. These where
32

chosen based on the Caltrans practice of designing overlays for a 10-year design period. The
results of this analysis are shown in Figure 5.
It appears that in the Bay Area, Central Valley and North Coast climate zones, the
overlays have good performance, while in the other climate zones, the performance is poor. The
South Coast and High Desert zones appear to be bimodal.
The reflection cracking data set analyzed previously was also broken into climate zones.
To do this, all of the roads that passed through more than one climate zone had to be discarded
thereby reducing the total length of pavement considered. The data is shown in Table 4.
The same Bayesian technique was applied as in the initial analysis, and the results are
shown in Figure 6. In this case, all of the posterior distributions fall below the original
probability distribution function.
Although there are differences in the resulting probability distributions for the various
climate zones, these do not appear to be large compared to one another, with the means ranging
over just more than a year. Given all of the other factors that might influence this analysis,
especially traffic levels between regions, it is unlikely that there are significant climatic
influences on reflection cracking of AC overlays on PCC.
33

Figure 5. Bayesian analysis of stage three cracking of AC overlay of AC pavements.
34
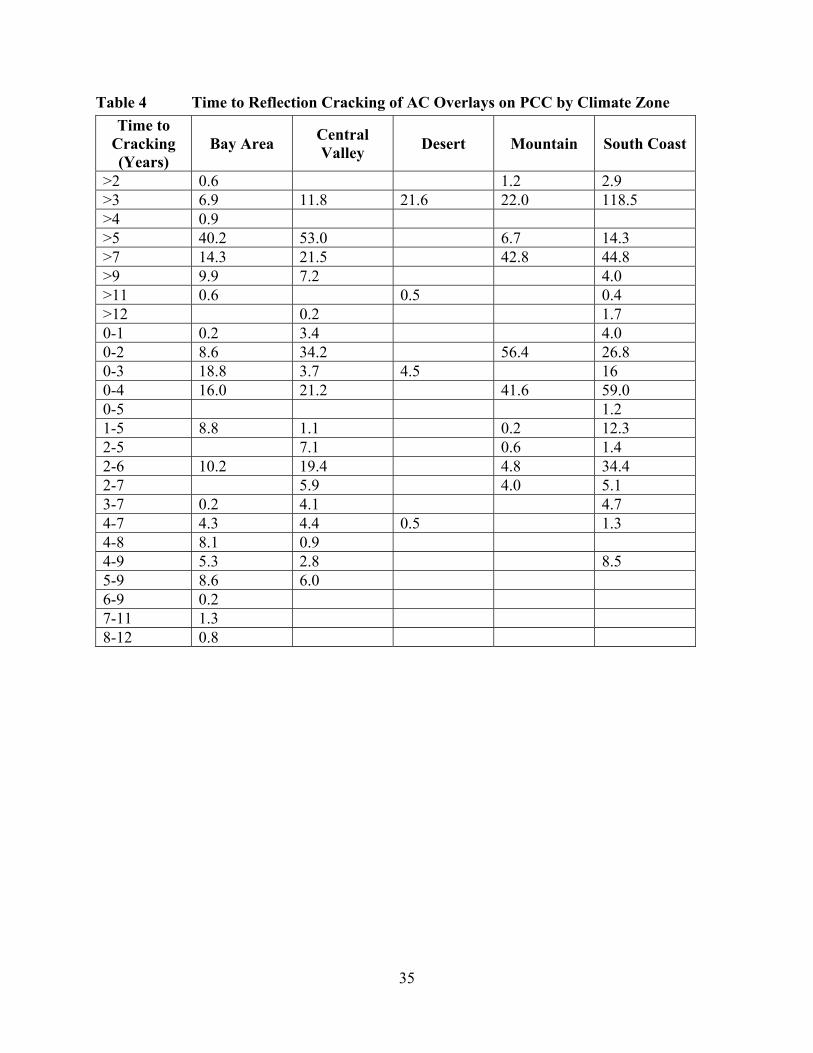
Table 4 Time to Reflection Cracking of AC Overlays on PCC by Climate Zone Time to
Cracking (Years)
Bay Area Central Valley Desert Mountain South Coast
>2 0.6 1.2 2.9 >3 6.9 11.8 21.6 22.0 118.5 >4 0.9 >5 40.2 53.0 6.7 14.3 >7 14.3 21.5 42.8 44.8 >9 9.9 7.2 4.0 >11 0.6 0.5 0.4 >12 0.2 1.7 0-1 0.2 3.4 4.0 0-2 8.6 34.2 56.4 26.8 0-3 18.8 3.7 4.5 16 0-4 16.0 21.2 41.6 59.0 0-5 1.2 1-5 8.8 1.1 0.2 12.3 2-5 7.1 0.6 1.4 2-6 10.2 19.4 4.8 34.4 2-7 5.9 4.0 5.1 3-7 0.2 4.1 4.7 4-7 4.3 4.4 0.5 1.3 4-8 8.1 0.9 4-9 5.3 2.8 8.5 5-9 8.6 6.0 6-9 0.2 7-11 1.3 8-12 0.8
35

0
0.2
0.4
0.6
0.8
1
0 5 10 15 20
Nor
mal
ized
Lik
elih
ood
Years
Likelihood functions
Bay AreaCentral Valley
DesertMountain
South Coast
00.20.40.60.8
11.21.41.61.8
0 5 10 15 20
Pro
babi
lity
dens
ity
Years
Probability density of mean
Bay AreaCentral Valley
DesertMountain
South Coast
0
0.05
0.1
0.15
0.2
0.25
0 5 10 15 20
Pro
babi
lity
dens
ity
Years
Probability density of expected life
Bay AreaCentral Valley
DesertMountain
South Coast
Figure 6. Bayesian analysis of reflection cracking by climate zone.
36

5.0 CONCLUSIONS
Caltrans has been collecting pavement management data for the past twenty-three years,
although the systems that have been used to collect this data have changed a number of times
during this period. The data collected, as with all data, reflects the purpose for which it was
collected, which was to aid in the project-level maintenance of the network. Because of this, it
has been difficult to organize the data into a useful format for statistical analysis.
Several major hurdles have arisen in the process of organizing the data. The first is that
the Caltrans milepost system is not a fixed reference system, but changes from year to year. This
has made it almost impossible to correctly link the survey, traffic, and maintenance activity data
on a year-by-year basis. The second factor is that within this changing milepost system, the
surveyed sections changed from year to year. This has necessitated a major restructuring of the
database. Finally, the databases do not include any information concerning pavement structure,
which is vital for the accurate statistical modeling of pavement performance.
In spite of these difficulties, the databases were cleaned and manipulated sufficiently to
make it possible to extract some performance information. In particular, the data provided
enough information to address two problems: reflection cracking of AC overlays of PCC and the
performance of AC overlays of both AC and PCC pavements within each of the climate regions
in the state.
It was found that the mean expected life of an asphalt overlay on a concrete pavement
(whose predominant failure mode is reflection cracking) is just over seven years, about two and a
half years less than the estimated design life. Also, two populations appear to exist within these
overlays: one group that has performed as designed, and one group that has failed prematurely.
These two groups may alternatively represent thin “maintenance” overlays and thicker
“rehabilitation” overlays. In future studies, this data can be used to determine sections for
37

further investigation and field testing to determine why some overlays failed while others
performed satisfactorily.
There appears to be a strong influence of traffic on mean time to reflection cracking, but
until the traffic database is linked to the performance information, it is not possible to explore
this effect in more detail. The WIM database (3) offers extensive traffic data for a selected set of
links, but has not been included or used to cross check the traffic database.
The modeling of climate effects has not produced such conclusive results. Although a
subset of the data was extracted and processed, it is not easy to explain the reasons for differing
performance for the various climatic regions in the state. It is thus likely that this factor includes
influence from factors such as the regional economics, differences in truck traffic, and
differences in construction quality, maintenance practices, and materials among the various
regions in the state.
If any further work is to be carried out on these databases, then the major problem of
incorrect milepost information needs to be overcome. To this end, the data needs to be linked
with a GIS coverage of the state roads and the milepost system needs to be linked with a fixed
reference system, so that the year-to-year data can be correctly related. Doing so would allow
traffic data to be linked to condition data, allowing traffic to be used as explanatory variable.
6.0 RECOMMENDATIONS
The recommendations from this research can be grouped into two sets: 1) advice for
Caltrans on improvements to pavement management strategy with the goal of increasing the
value of the data collected, not only for research purposes, but for the day-to-day management of
the network, and 2) recommendations for further research.
38

To continue this research requires that the PMS database be linked to the traffic database,
and that the newer condition survey data also be incorporated into the database. This will require
the use of a GIS to link the highway log to true distances along each route. The final outcome of
this process will be a GIS coverage of all of the state highways, split at each of the points where
there is a discontinuity in the milepost system. This will enable each milepost, with its
associated prefix and suffix information, to be linked to an absolute distance from the start of the
route as well as geographic coordinates.
Once this has been accomplished, it will be possible to link the milepost information
from each database to the true mileage, and hence compare the databases and determine new
fixed evaluation sections. The historical condition and traffic information can then be
determined over these new fixed sections.
The problems noted in this report are already being faced on a daily basis by Caltrans
engineers and pavement managers, who are attempting to use the condition survey information to
maintain the network. Issues with the milepost system and with the type of data being captured
have been repeatedly raised by Caltrans Maintenance staff during meetings over this work, and
so it is felt that some recommendations for resolving these issues in the future should be made.
The primary recommendations are detailed below:
• Development of a new milepost system.
• Inclusion of structural information into the PMS database.
• Use of fixed evaluation segments for the condition survey, and development of
dynamic segments through post-processing.
• Rationalization of the database structures used to store pavement related data.
• Quality checking of the traffic database using the Weigh-In-Motion database.
39

While the development of a new milepost system may seem excessive, it is the key to
easing management of the road network. The current system conflicts with the basic nature of a
road network and has resulted in a great deal of unneeded complexity within the entire
organization. There has been a significant amount of research published on normalized rational
milepost systems, and the primary finding of this research has been that any linear referencing
system needs to be built around the basic node and link structure of a road network rather than
around arbitrary boundaries such as county or district boundaries. Also, the entire motivation for
using a linear referencing system, as opposed to geographic coordinates, is the ability to easily
determine distances along the link. This doesn’t mean a total abandonment of the existing
system because there is always a one-to-one mapping between any two location referencing
systems, but a gradual shift to the new system as systems are updated and developed and routine
maintenance on the network occurs.
To manage pavements requires knowing something about the pavements themselves.
While condition information can and is used to understand pavement performance, it is not
particularly useful for predicting future performance without at least knowing something about
the pavement structure. Thus, it is important for the PMS to include at least rudimentary
structural information and information on past maintenance and rehabilitation actions.
While dynamic segmentation is very useful for maintenance planning, it prohibits using
any form of performance prediction, which is vital for true pavement management. Therefore,
the PMS database should be restructured around fixed segments. It is a simple task to extract
dynamic segments from fixed segments, especially in GIS-based software.
Finally, the PMS database structures currently in use are not correctly designed for the
storage of the information. In particular, properties of the pavement, such as its structure
40

(flexible or rigid) should not form part of any primary key for tables, since these change with
time.
Future research using the PMS database requires implementation of the previous
recommendations.
Once these recommendations have been implemented, it is recommended that the
database be used to develop more sophisticated models than those that could be developed with
the current database. These models can look at additional distress mechanisms and ride quality
as measured using the International Roughness Index. More sophisticated models should
include:
• more distress mechanisms
• more explanatory variables, including materials types, rehabilitation strategies,
maintenance strategies, and if connected to the database, construction quality.
7.0 REFERENCES
1. Harvey, J. T., A. Chong, and J. Roesler. Climate Regions for Mechanistic-Empirical Pavement Design in California and Expected Effects on Performance (Draft). Pavement Research Center, Institute of Transportation Studies, University of California, Berkeley. June 2000.
2. University of California at Berkeley CAL/APT Project Contract Team. Strategic Plan for Partnered Pavement Research. University of California Pavement Research Center, Institute of Transportation Studies. December 2000.
3. Q. Lu, J. Harvey, T. Le, J. Lea, R. Quinley, D. Redo, J. Avis. Truck Traffic Analysis using Weigh-In-Motion (WIM) Data in California (Draft). University of California Pavement Research Center, Institute of Transportation Studies. June 2002.
4. Murray, B. D. Establish Criteria for Rehabilitation of California Pavements. Report No. FHWA-CE-TL-78-36. Sacramento, California: California Department of Transportation. February 1979.
41

APPENDIX A
lane.dbf
Column Name Description Range AAC Alligator A Cracking % 0 - 99 ABC Alligator B Cracking % 0 - 99 ACC Alligator C Cracking Exists X = Exists at this location ALLA Alligator A Cracking Strategy Code 2 Letters ALLB Alligator B Cracking Strategy Code 2 Letters ALLC Alligator C Cracking Strategy Code 2 Letters BLC Block Crack % 0 - 99 BLOC Block Cracking 2 Letters CCT Caltrans Cost Center 3 Digits Code DEFECT Dominant Defect Description 12 Letters DIR Direction L, R DIS District 1 - 12 DPN District Project Number 1 - 500 DRIP Drip Track Raveling 2 Letters FLT Faulting S(Severe), L(Light) FSC First Stage Cracking %- Rigid Pavement 0 - 99 JDP Joint Displacement U(Up), D(Down) JSP Joint Seperation Y or blank LAN Lane Number 1 - 6 LANSTR Dominant Lane Strategy 2 Letters LEX Longitudinal Cracking Extent 1 Letter LIF ? LONG Longitudinal Cracking Strategy KL or blank LSV Longitudinal Cracking Severity 1 - 4 for crack size in 1/4" PAT Patches % 0 - 99 PAV Pavement Type F, R, A PCC Percent Corner Cracking 0 - 99 PCO Patch Condition 1 Letter PRG Program for Repair HM12, HM1, HA22, HM11 PSI Pavement Servicability Index 1 - 5 RAVEL Raveling - F or C plus % value 0 - 99 RAVL Raveling Strategy 2 Letters RDP ? RDS Ride Score IRI 95+ RDT Ride Date Date RIDE Ride Strategy 2 Letters RTE Route Route Number RUT Rutting % 0 - 99 RUTT Rutting Strategy TD or blank S Route Suffix 1 Letter SEQ Sequence Number for 1978 - 1985 Number SEQR Sequence Number for 1987 - 1992 Number SHD Shoulder Condition Good, Fair, Poor, Missing
42

Column Name Description Range SHDSTR Shoulder Strategy 2 Letters SKD Skid Resistance 0 - 99 SP_D Special Designation Number - (District+Counter) 7 Letters STSL Strategy code 2 Letters STSN Strategy code 2 Letters STSS Strategy code 2 Letters TEX Transverse Cracks Extent 1 Letter TRAN Transverse Cracks KP or blank TSC Third Stage Cracking % 0 - 99 TSV Transverse Cracking Severity 1 Letter VEL Velocity - speed for ride score collection 0 - 55
43

pave.dbf
Column Name Description Range M_KEY Key M_SURKEY Alt Key 1 M_ALTKEY Alt Key 2 M_ADT1 Average Daily Traffic 2 8 Digits M_ADT Average Daily Traffic 7 Digits M_ADTCAT Average Daily Traffic Catagory H, M, L M_AFY Awarded Fiscal Year 2 Digits M_AHPM Ahead Post Mile with 1 Decimal 1 Decimal M_AHPM2 Ahead Post Mile with 3 Decimals 3 Decimals M_AMO Awarded Month 1 - 12 M_AVEABC Average Alligator A, B, C Cracking 0 - 99 M_AVEPAT Average Patches 0 - 99 M_AVERDS Average Ride Score 3 Digits M_AVETSC Average Third Stage Cracking 0 - 99 M_AWY Awarded Sequence 4 Digits M_AYR Awarded Year 2 Digits M_B Back Post Mile Prefix 1 Letter M_BKPM Back Post Mile 1 Decimal M_BKPM2 Back Post Mile 2 3 Decimals M_CL_LEN Distance Between Ahead and Back PM 1 Decimal M_CO County 3 Letters M_CS County Sequence 2 Digits M_CST Cost Amount M_CST2 Cost Amount M_DAT Date Date M_DESC Location Description Description M_DIS District 1 - 12 M_F Ahead Post Mile Prefix 1 Letter M_F_LT ? 1 Letter M_F_RIDE Triggered Ride 1 Letter M_F_RT ? 1 Letter M_FED ? 1 Letter M_FEDI ? 1 Letter
M_FUN ? 3 Characters - Alphanumeric
M_FY Fiscal Year 2 Digits M_GNDLT Ground Left Lane 0 - 9 M_GNDRT Ground Right Lane 0 - 9 M_H2O Rainfall 3 Digits M_LAMI Triggered Lane Mile 1 Decimal M_LAMI2 Actual Triggered Lane Mile 1 Decimal M_LANEMILE Lane Mile 1 Decimal M_LEN Length in Miles 1 Decimal M_LNS Lanes 0 - 16 M_LT Number of Left Lanes 1 - 9
44

Column Name Description Range M_LT_T Triggered Left Lane 0 - 9 M_MAXABC Maximum Alligator A, B, C Cracking % 0 - 99 M_MAXTSC Maximum Third Stage Cracking % 0 - 99 M_MC Maintenance Cost Per Mile Amount M_MC1 Maintenance Cost Per Mile Year 1 Amount M_MC2 Maintenance Cost Per Mile Year 2 Amount M_MC3 Maintenance Cost Per Mile Year 3 Amount M_MO Survey Month 1 - 12 M_MSL Maintenance Service Level 1, 2, 3 M_NALLOT Partial Contract Allotment (by length) 4 Digits M_OCC ? 0 - 99 M_PALLOT Allotment Amount M_PAV Pavement Type F, R, A M_PI Priority Index 2 Decimals M_PPN Project Priority Number 0 - 99
M_PRG Program HA22, HA21, HA43, HM1, etc.
M_PS Post Mile Sequence 0 - 99 M_PST82 Sorted Sequence Number 4 Digits M_RT Number of Right Lanes 1 - 9 M_RT_T Triggered Right Lane 0 - 9 M_RTE Route Number Route Number M_S Route Suffix 1 Letter M_SEQ Pavement Condition Sequence 7 Digits M_SEQOLD ? 4 Digits M_SEQP PMS Sequence Number 5 Digits M_SEQR Sequence Number 7 Digits M_STR Strategy 2 Letters M_TRIG Trigger Lanes Left, Right, or Both M_TRK Truck 0 - 99 M_TVS Low ADT 3 Letters M_TYP Road Type 1, 2, 3, 4, 5, 6, B
M_TYP2 Lane Type MLD, MLU, 2LN, BA, BL, City
M_WRK Program - Work Type HA22, HA21, HA43, HM1, etc.
M_XREF Cross Reference 0 - 99 M_YEAR Year Year M_YR Servey Year 2 Digits M_Z Main Year 2 Digits
M_ZONE Geographic Zone 3 Characters - Alphanumeric
45

all_dbs.dbf
Column Name Description Range PTCH_PCT Patching % 0 - 99 SIDE_LNS Side Lanes Not In Report DMG_DIR Damage Direction Not In Report DMG_LN Damage Lane Not In Report TRIG_LNMI Trigger Lane Miles Not In Report DISTRICT District 1 - 12 BEG_PRFX Begin Prefix 1 Letter END_PRFX2 End Prefix 1 Letter BEG_PM Begin Post Mile 3 Decimals END_PM2 End Post Mile 3 Decimals ACT_LEN Actual Length 3 Decimals STRT_ODOM Start Odometer reading Numeric END_ODOM End Odometer reading Numeric NEW_PRIOR New Priority Index Number 1 - 15 MSL_96 Maintenance Service Level for 1996 1, 2, 3 RSU ? FED_SYS ? FUN_CLS Functional Classification DIS_PRE_95 District Boundaries Changed July 1996 District Pre 1995 1 - 12 COUNTY County 3 Characters ROUTE Route Route Number MSL_A MSL Class 1, 2, or 3 BEGIN_PRFX Begin Post Mile Prefix 1 Letter BEGIN_PM Begin Post Mile 3 Decimals END_PM End Post Mile 3 Decimals LENGTH Length between begin and end post mile 3 Decimals ODOMETER Odometer reading of distance 3 Decimals LANE_NUM Lane number L or R + 1 - 6
RD_TYP Road type MLD, MLU, 2LN, BA, BL, City
SRF_TYPE Surface type 2 Letters PVMNT_TYPE Pavement type F=Flex, R=Rigid SHLDR_COND Shoulder condition G, M, F, P ASCNDNG_PM Ascending Post Mile when collect data T or F HOV High Occupancy Vehicle Lane T or F NUM_LEFT Number of Left lanes 1 - 6 NUM_RIGHT Number of Right lanes 1 - 6 DATE_CMPLT Date Complete Project Date SEQ_NUM Sequence Number 6 Numbers ADJ_RS Adjust Ride Score 0 - 999 NO_DSTRSS No Distress pavement Date NOT_RATED Not Rated pavement T or F RCNT_CONST Recent Construction T or F RCNT_MAINT Recent Maintenance T or F UDR_CONST Under Construction Date UNABLE_RTE Unable to Rate Route Date
46

Column Name Description Range UNSAFE_RTE Unsafe to Rate Route Date BA_CNR_CRK Bridge Approach Corner Crack T or F BA_3RD_SPL Bridge Approach 3rd stage Crack Spalling T or F SHLDR_DISP Shoulder Displacement U or D JNT_SEP Joint Separation T or F JNT_DSP Joint Displaced 0, 1, or Blank SLDR_J_SLD Shoulder Joint Sealed T or F SHLDR_GRND Shoulder Grinded T or F SLDR_SEALD Shoulder Sealed T or F SLDR_TRAFFC Traffic on shoulder T or F EDGE_CRKG Edge Cracking T or F PATCHING Patching T or F POOR_PTCH Poor Patching T or F PTCH_EXT Patching Extent 0 - 999 ALIG_A Alligator A Cracking 0 - 999 ALIG_B Alligator B Cracking 0 - 999 ALIG_C Alligator C Cracking T or F CRK_WIDTH Crack Width 0, 1, 2 CRKS_SEALD Cracks Sealed T or F BLCK_CRK Block Cracking T or F LNG_EXT Longitudinal Cracking Extent 1 - 9 LNG_UPDWN Longitudinal Cracking Up Down U or D TRNS_EXT Transverse Cracking Extent 1 - 9 TRNS_UPDWN Transverse Cracking Up Down U or D LIT_RAVEL Light Raveling T or F CRSE_RAVEL Course Raveling T or F DRIP_TRACK Drip Track Raveling T or F BLEEDING Bleeding T or F POTHOLES Potholes T or F RUTTING Rutting T or F LIT_SLB_BP Light Slab Breakup % 0 - 99 SEV_SLB_BP Severe Slab Breakup % 0 - 99 SEV_CK_25 Severe Cracking > 25% T or F SEV_CK_50 Severe Cracking > 50% T or F CNR_CRK Corner Cracking % 0 - 99 AC_REPL AC Replace CRK_SPAL Crack Spalling T or F JNT_SPAL Joint Spalling T or F SPLG Spalling T or F FLTNG Faulting T or F SLAB_LEN Rigid Slab Length Feet SLAB_CURL Rigid Slab Curled T or F GRINDING Grinding T or F SEV_AL_C Severe Alligator Cracking T or F BA_SPLG Bridge Approach Spalling T or F BA_RS Bridge Approach Ride Score 0 - 999 COMP_LEN ? 3 Decimals SHLDR_STAT Shoulder Status Good, Fair, Poor, Missing
47

Column Name Description Range MSL MSL Class 1, 2, 3 END_PRFX2 End Prefix 1 Letter SRI Skid Resistance Indicator 0 - 99 COSTS Current year expenditures Amount COST_YR Current year Year COSTS_1 Prior year expenditures Amount COST__YR1 Prior year Year COSTS_2 Previous Prior year expenditures Amount COST_YR2 Previous Prior years Year LT_TRIG Left Triggered Lane 0 - 9 RT_TRIG Right Triggered Lane 0 - 9 ICES_RTE Intermodal Corridors of Economic Significanice Route 1 - 1000 LOS_GRADE Level of Service Grade A - E LOS_SCORE Level of Service Score Pass or Fail
48

awards
Column Name Description Range rte route number 1 - 9999
ea expenditure authorization number 5 characters - alphanumeric
work type type of treatment Rehab, CAMP, MM, etc... prg program HA22, HA21, HM1, etc... fy fiscal year 2 digits amo awarded month 2 digits ayr awarded year 2 digits allot allotment up to 9 digits tot_lnmi total lane miles 0 - 9999 original pm original post mile numeric/alphanumeric b back post mile prefix 1 letter bkpm back post mile 1 decimal f ahead post mile prefix 1 letter ahpm ahead post mile 1 decimal
hwy_grp highway group (independent alignment) R, L, or X (X=unconstructed)
beg_hwy_gr begin highway group R, L, or X end_hwy_grp end highway group R, L, or X pm post mile numeric/alphanumeric pave_type pavement type flex or rigid pt project type 2 letters pi priority index 3 decimals est estimated amount amount bid bid amount amount ablm ac/ac lane mile 4 decimals aclm ac/pc lane mile 4 decimals awy award sequence 5 numbers edmi edge mile 0 - 105 flex flexible pavement lane miles 3 decimals grlm cpr mile 3 decimals ramplm ramp lane mile 3 decimals rigid rigid pavement lane miles 3 decimals link ? awadate award date date comments comments comments compdate complete date date
49

Dynatest PMS Data
Dynatest PMS data variable comments
name name of road could be a hyear year of data ie for 2000 it District # typically a county or districfrom mile deliniates start of section to mile deliniates end of section lane number number of the particular laall lanes total number of lanes in allength - ft length of section in feet width - ft width of section in feet area - sq ft calculated from l*w Normal speed typically the speed limit description a verbal description of thenotes an open field to store just functional class used to separate say highconstruction date year of original constructio
maintenance Camp used in some cases to demayt be different from dis
pavement layer 1to 4 material / thickness / modTRAFFIC YEAR date of traffic info aadt total traffic esal 18 kip loads cvpd commercial vehicles per dsurvey year for each condition data typ
iri IRIskid friction value from test rut depth in inches visual rating PCI or what ever
surface repair resuired crack filling - may
structural repair required patching - may bsafety repair painting, signing etc
1
Direct import from Caltrans DB
ighway number yes would be 2000 no t possible
yes yes
ne to allow for multiple lanes yes l directions possible
yes no no yes
section yes about anything - contact numbers etc multiple details speed from HOV or whatever yes n or last reconstruction or overlay yes
termine maintenance group which trict possible ulus / year - repeat for each layer no
possible possible possible
ay no e below possible
possibleyes no not as depth multiple details
be generated from crack details possible generate from distress
e generated from distress details possible generate from distress
no

residual value
dollar value not required
Additional fields can be added to store just about any info Also need : budgets 1 to 10 year material types material costs interest rates delay times delay costs
Can be set up in either US or SI units, but not both
2
no
rmation.

52

53

54

55
56
57

58

59
60

61
62

63
64

65