data mining: introduction - computer science: indiana ...predrag/classes/2017fallb365/ch1.pdf ·...
TRANSCRIPT

Data Mining: Introduction
Lecture Notes for Chapter 1
Introduction to Data Miningby
Tan, Steinbach, Kumar
(modified by Predrag Radivojac, 2017)

● Lots of data is being collected and warehoused – web data, e-commerce– purchases at department/
grocery stores– bank/credit card
transactions
● Computers have become cheaper and more powerful
● Competitive pressure is strong – Provide better, customized services for an edge (e.g. in
customer relationship management)
Why Mine Data? Commercial Viewpoint

Why Mine Data? Scientific Viewpoint
● Data collected and stored at enormous speeds (GB/hour)
– remote sensors on a satellite
– telescopes scanning the skies
– microarrays and sequencing generating gene expression data
– scientific simulations generating terabytes of data
● Traditional techniques infeasible for raw data● Data mining may help scientists
– in classifying and segmenting data– in hypothesis generation

Mining Large Data Sets - Motivation● There is often information “hidden” in the data that is
not readily evident● Human analysts may take weeks to discover useful
information● Much of the data is never analyzed at all● Also…
https://www.ibm.com/blogs/ibm-training/three-ways-to-close-the-big-data-skills-gap/

What is Data Mining?
●Many definitions– Non-trivial extraction of implicit, previously unknown
and potentially useful information from data
– Exploration & analysis, by automatic or semi-automatic means, of large quantities of data in order to discover meaningful patterns

What is Data Mining?
●Many definitions– Non-trivial extraction of implicit, previously unknown
and potentially useful information from data
– Exploration & analysis, by automatic or semi-automatic means, of large quantities of data in order to discover meaningful patterns
– End-to-end processof pattern disco-very

What is (not) Data Mining?
● What is Data Mining?
– Certain names are more prevalent in certain US locations (O’Brien, O’Rurke, O’Reilly… in Boston area)– Group together similar documents returned by search engine according to their context (e.g. Amazon rainforest, Amazon.com,)
● What is not Data Mining?
– Look up phone number in phone directory
– Query a Web search engine for information about “Amazon”
Some (not so useful) patterns...
● “rules” for American presidents (before 2004 elections)
Some (not so useful) patterns...
● “rules” for American presidents (before 2004 elections)
– if the Washington Redskins win their last home game before the election, the incumbent’s party will be re-elected

Some (not so useful) patterns...
● “rules” for American presidents (before 2004 elections)
– if the Washington Redskins win their last home game before the election, the incumbent’s party will be re-elected
– no Republican has ever won a presidential election without carrying Ohio
Some (not so useful) patterns...
● “rules” for American presidents (before 2004 elections)
– if the Washington Redskins win their last home game before the election, the incumbent’s party will be re-elected
– no Republican has ever won a presidential election without carrying Ohio
– no incumbent with a four-letter last name has ever been re-elected (Polk, Taft, Ford, Bush Sr.)
– Americans won’t unseat a wartime President

Some (not so useful) patterns...
● “rules” for American presidents (before 2004 elections)
– if the Washington Redskins win their last home game before the election, the incumbent’s party will be re-elected (Redskins vs. Panthers: 13-21)
– no Republican has ever won a presidential election without carrying Ohio
– no incumbent with a four-letter last name has ever been re-elected (Polk, Taft, Ford, Bush Sr.) (GWB)
– Americans won’t unseat a wartime President

● Draws ideas from machine learning/AI, pattern recognition, statistics, and database systems
● Traditional techniquesmay be unsuitable due to – enormity of data– high dimensionality
of data– heterogeneous,
distributed nature of data
Origins of Data Mining
Machine Learning/Pattern
Recognition
Statistics/AI
Data Mining
Database systems

Data Mining Tasks
● Prediction Methods– Use some variables to predict unknown or
future values of other variables.
● Description Methods– Find human-interpretable patterns that
describe the data.
From [Fayyad, et.al.] Advances in Knowledge Discovery and Data Mining, 1996

Data Mining Tasks...
● Classification [Predictive]
● Regression [Predictive]
● Deviation detection [Predictive]
● Clustering [Descriptive]
● Association rule discovery [Descriptive]
● Sequential pattern discovery [Descriptive]

Classification: Definition
● Given a collection of objects (training set)– Objects may be records that contain a set of
attributes; one of the attributes is the class. Objects may also be defined by a similarity measure between them.
● Find a model that maps an object into the class value; e.g. as a function of the values of other attributes.
● Goal: previously unseen objects should be assigned a class as accurately as possible.– A test set is used to determine the accuracy of the
model. Usually, the given data set is divided into training and test sets, with training set used to build the model and test set used to validate it.

Classification: Example
Tid Refund MaritalStatus
TaxableIncome Cheat
1 Yes Single 125K No
2 No Married 100K No
3 No Single 70K No
4 Yes Married 120K No
5 No Divorced 95K Yes
6 No Married 60K No
7 Yes Divorced 220K No
8 No Single 85K Yes
9 No Married 75K No
10 No Single 90K Yes10
Refund MaritalStatus
TaxableIncome Cheat
No Single 75K ?
Yes Married 50K ?
No Married 150K ?
Yes Divorced 90K ?
No Single 40K ?
No Married 80K ?10
TestSet
Training Set Model
Learn Classifier

Classification: Application 1
● Direct Marketing– Goal: Reduce cost of mailing by targeting a set of
consumers likely to buy a new cell-phone product.– Approach:
u Use the data for a similar product introduced before. u We know which customers decided to buy and which
decided otherwise. This {buy, don’t buy} decision forms the class attribute.
u Collect various demographic, lifestyle, and company-interaction related information about all such customers.
– Type of business, where they stay, how much they earn, etc.u Use this information as input attributes to learn a classifier.
From [Berry & Linoff] Data Mining Techniques, 1997

Classification: Application 2
● Fraud Detection– Goal: Predict fraudulent cases in credit card
transactions.– Approach:
u Use credit card transactions and the information on its account-holder as attributes.
– When does a customer buy, what does he buy, how often he pays on time, etc.
u Label past transactions as fraud or fair transactions. This forms the class attribute.
u Learn a model for the class of the transactions.u Use this model to detect fraud by observing credit card
transactions on an account.

Classification: Application 3
● Customer Attrition/Churn:– Goal: To predict whether a customer is likely to be lost
to a competitor.– Approach:
u Use detailed record of transactions with each of the past and present customers, to find attributes.
– How often the customer calls, where he calls, what time-of-the day he calls most, his financial status, marital status, etc.
u Label the customers as loyal or disloyal.u Find a model for loyalty.
From [Berry & Linoff] Data Mining Techniques, 1997

Classification: Application 4
● Sky Survey Cataloging– Goal: To predict class (star or galaxy) of sky objects,
especially visually faint ones, based on the telescopic survey images (from Palomar Observatory).
– 3000 images with 23,040 x 23,040 pixels per image.– Approach:
u Segment the image. u Measure image attributes (features) - 40 of them per object.u Model the class based on these features.u Success Story: Could find 16 new high red-shift quasars,
some of the farthest objects that are difficult to find!
From [Fayyad, et.al.] Advances in Knowledge Discovery and Data Mining, 1996

Classifying Galaxies
Early
Intermediate
Late
Data Size: • 72 million stars, 20 million galaxies• Object Catalog: 9 GB• Image Database: 150 GB
Class: • Stages of Formation
Attributes:• Image features, • Characteristics of light
waves received, etc.
Courtesy: http://aps.umn.edu

R175H: Metal-binding
V143A: Stability
K120R: Acetylation
R273H: DNA-binding
G245S: Protein-binding
p53 – tumor suppressor protein
PDB structures: 2ybg, 2j1w, 1ycs and 1tup
Classification: Application 5Disease mechanisms

Let’s look at classification again!
Tid Home Owner
Marital Status
Taxable Income Cheat
1 Yes Single 125K No
2 No Married 100K No
3 No Single 70K No
4 Yes Married 120K No
5 No Divorced 95K Yes
6 No Married 60K No
7 Yes Divorced 220K No
8 No Single 85K Yes
9 No Married 75K No
10 No Single 90K Yes 10
Home Owner
Marital Status
Taxable Income Cheat
No Single 75K ?
Yes Married 50K ?
No Married 150K ?
Yes Divorced 90K ?
No Single 40K ?
No Married 80K ? 10
TestSet
Training Set Model
Learn Classifier

Home Owner
Marital Status
Taxable Income Cheat
No Single 75K ?
Yes Married 50K ?
No Married 150K ?
Yes Divorced 90K ?
No Single 40K ?
No Married 80K ? 10
No: ® 0Yes: ® 1
___________________Single: ® 0
Married: ® 1
Divorced: ® 2
®
úúúúúúúú
û
ù
êêêêêêêê
ë
é
8010400090211501050117500
¬ this is a 6-by-3 MATRIX!!!
6 rows
3 columns
6 rows
3 columns
A small digression: why MATLAB?

úúúúúúúú
û
ù
êêêêêêêê
ë
é
8010400090211501050117500
row vector (3-dimensional vector; 1-by-3)
column vector(6-dimensional vector)
(6-by-1)
x2
x1
(3, 5)
5
3
2-d case
A small digression: why MATLAB?

x2
x1
(3, 5)
5
3
2-dimensional case
Assume medical situation:
x1 is blood pressure
x2 is temperature
Then, each vector (x1, x2) corresponds to one patient
patient 1 (data point 1)
7
4
(7, 4)
patient 2 (data point 2)
úû
ùêë
é4753
Dataset:
Let’s introduce some notation…
úúúúúú
û
ù
êêêêêê
ë
é
-
-
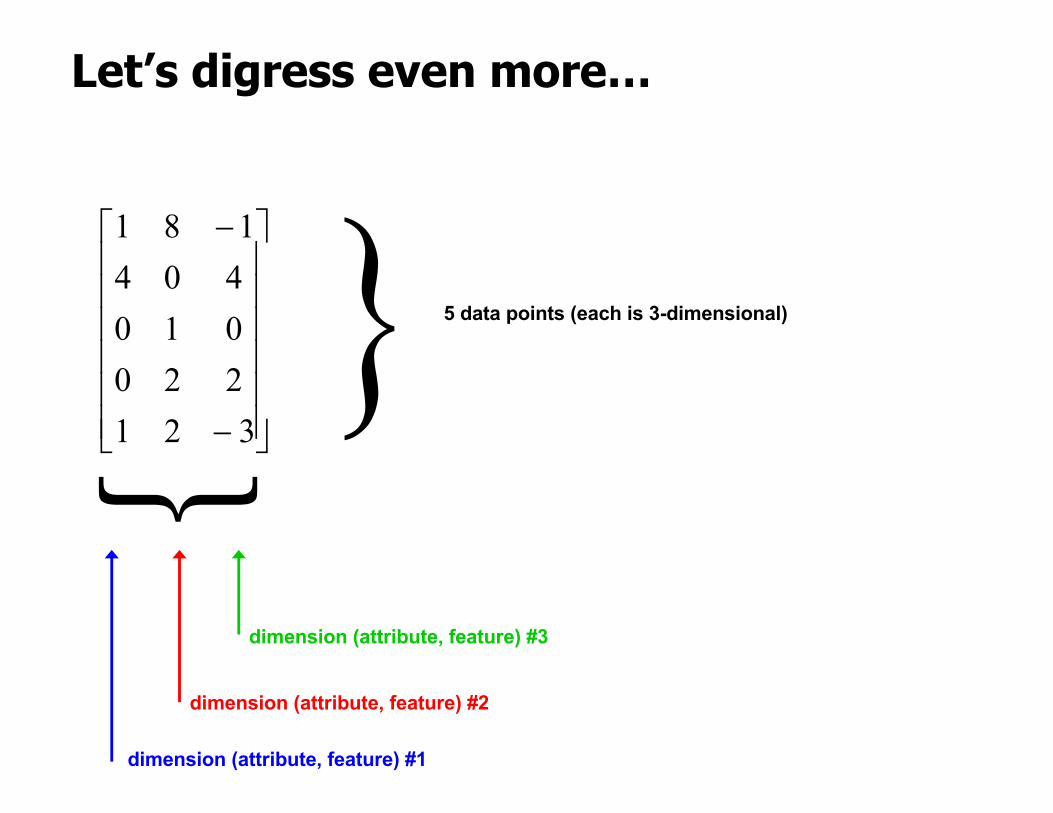
321220010404181 } 5 data points (each is 3-dimensional)
!
dimension (attribute, feature) #1
dimension (attribute, feature) #2
dimension (attribute, feature) #3
Let’s digress even more…

Sets
● set is an arbitrary collection of objects● most frequently, data set is an arbitrary collection of data
points (vectors)
● we use boldface to denote sets (e.g. A, B...)
● means that x is not a member of A
● subsets (A is subset of B; A Ì B)

More on sets
● Union● Intersection● Difference
Union
Intersection
Difference
Venn diagrams

Ordered Sets
● let’s look at ordered pairs (x, y) such that x Î A and y Î B● Cartesian product A x B is a set of all possible pairs (x, y)
Example:
Let’s look at subsets of this!!

Functions
● Let A and B be sets. A function f is an assignment of exactly one element of B to each element of A. We write f(a) = b if b is the unique element of B assigned by the function f to the element a of A.
● More formally

Types of functions
f not 1-1 or onto f onto but not 1-1
f 1-1 and onto - bijection f 1-1 but not onto
A B A B

Not a function
f Í A ´ B but is not a function
mapped to two elements of B
A B

Functions in MATLAB
A = {1, 2, 3, 4, 5}
B = {2, 4, 6, 8}
Consider the following function f: A® Bf = {(1, 2), (2, 4), (3, 6), (4, 8), (5, 8)}
for example, f(2) = 4; f(5) = 8;
>> a = [1 2 3 4 5];
>> b = [2 4 6 8 8];
>> plot(a, b, ‘*’)
>> axis([0 6 0 10])
1
2
3
4
5
2
4
6
8

More functions in Matlab
● Let’s plot y = f(x), where f(x) = x2 for every integer x from -10 to 10.
>> x = -10 : 1 : 10;
>> y = x .^ 2;
>> plot(x, y, ‘*’)
>> axis([-11 11 0 101])

Now, back to classification!

x2
x1
(3, 5)
5
3
Assume medical situation:
x1 is blood pressure
x2 is temperature
Then, each vector (x1, x2) corresponds to one patient
7
4
(7, 4)
Toy classification problem

x2
x1
(3, 5)
5
3 7
4
(7, 4)
úúúúúú
û
ù
êêêêêê
ë
é
4945724753
Dataset
Assume medical situation:
x1 is blood pressure
x2 is temperature
Then, each vector (x1, x2) corresponds to one patient
Toy classification problem

x2
x1
Dataset
úúúúúú
û
ù
êêêêêê
ë
é
149145072147053
?
2 patients with class 03 patients with class 1
1 patient with unknown class (we need to predict)
Toy classification problem
Assume medical situation:
x1 is blood pressure
x2 is temperature
Then, each vector (x1, x2) corresponds to one patient

Do you see it differently now?
Tid Home Owner
Marital Status
Taxable Income Cheat
1 Yes Single 125K No
2 No Married 100K No
3 No Single 70K No
4 Yes Married 120K No
5 No Divorced 95K Yes
6 No Married 60K No
7 Yes Divorced 220K No
8 No Single 85K Yes
9 No Married 75K No
10 No Single 90K Yes 10
Home Owner
Marital Status
Taxable Income Cheat
No Single 75K ?
Yes Married 50K ?
No Married 150K ?
Yes Divorced 90K ?
No Single 40K ?
No Married 80K ? 10
TestSet
Training Set Model
Learn Classifier

Clustering: Definition
● Given a set of data points, each having a set of attributes, and a similarity measure among them, find clusters such that– Data points in one cluster are more similar to
one another.– Data points in separate clusters are less
similar to one another.
● Similarity Measures:– Euclidean distance if attributes are continuous.– Other problem-specific measures.
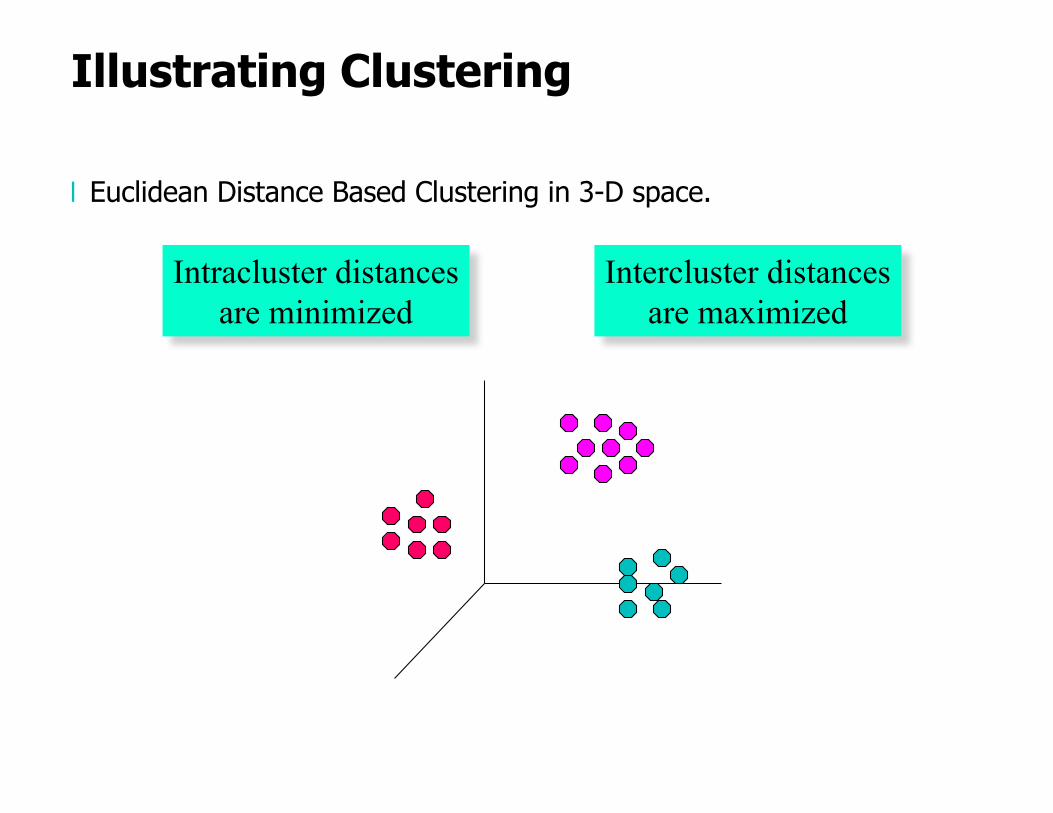
Illustrating Clustering
❘ Euclidean Distance Based Clustering in 3-D space.
Intracluster distancesare minimized
Intercluster distancesare maximized

Clustering: Application 1
● Market Segmentation:– Goal: subdivide a market into distinct subsets of
customers where any subset may conceivably be selected as a market target to be reached with a distinct marketing mix.
– Approach: u Collect different attributes of customers based on their
geographical and lifestyle related information.u Find clusters of similar customers.u Measure the clustering quality by observing buying patterns
of customers in the same cluster vs. those from different clusters.
Clustering: Application 2
● Document Clustering:– Goal: To find groups of documents that are similar to
each other based on the important terms appearing in them.
– Approach: u To identify frequently occurring terms in each document, form a
similarity measure based on the frequencies of different terms. Use it to cluster.
– Gain: Information retrieval can utilize the clusters to relate a new document or search term to clustered documents.

Illustrating Document Clustering
● Clustering Points: 3204 Articles of Los Angeles Times.● Similarity Measure: How many words are common in
these documents (after some word filtering).
Category TotalArticles
CorrectlyPlaced
Financial 555 364
Foreign 341 260
National 273 36
Metro 943 746
Sports 738 573
Entertainment 354 278

Clustering of S&P 500 Stock Data
Discovered Clusters Industry Group
1 Applied-Matl-DOWN,Bay-Network-Down,3-COM-DOWN, Cabletron-Sys-DOWN,CISCO-DOWN,HP-DOWN,
DSC-Comm-DOWN,INTEL-DOWN,LSI-Logic-DOWN, Micron-Tech-DOWN,Texas-Inst-Down,Tellabs-Inc-Down,
Natl-Semiconduct-DOWN,Oracl-DOWN,SGI-DOWN, Sun-DOWN
Technology1-DOWN
2 Apple-Comp-DOWN,Autodesk-DOWN,DEC-DOWN, ADV-Micro-Device-DOWN,Andrew-Corp-DOWN,
Computer-Assoc-DOWN,Circuit-City-DOWN, Compaq-DOWN, EMC-Corp-DOWN, Gen-Inst-DOWN,
Motorola-DOWN,Microsoft-DOWN,Scientific-Atl-DOWN
Technology2-DOWN
3 Fannie-Mae-DOWN,Fed-Home-Loan-DOWN, MBNA-Corp-DOWN,Morgan-Stanley-DOWN
Financial-DOWN
4 Baker-Hughes-UP,Dresser-Inds-UP,Halliburton-HLD-UP, Louisiana-Land-UP,Phillips-Petro-UP,Unocal-UP,
Schlumberger-UP
Oil-UP
❚ Observe Stock Movements every day. ❚ Clustering points: Stock-{UP/DOWN}❚ Similarity Measure: Two points are more similar if the events
described by them frequently happen together on the same day. ❚ We used association rules to quantify a similarity measure.

Association Rule Discovery: Definition
● Given a set of records each of which contain some number of items from a given collection;– Produce dependency rules which will predict
occurrence of an item based on occurrences of other items.
TID Items
1 Bread, Coke, Milk2 Beer, Bread3 Beer, Coke, Diaper, Milk4 Beer, Bread, Diaper, Milk5 Coke, Diaper, Milk
Rules Discovered:{Milk} --> {Coke}{Diaper, Milk} --> {Beer}

Association Rule Discovery: Application 1
● Marketing and Sales Promotion– Let the rule discovered be
{Bagels, … } --> {Potato Chips}– Potato Chips as consequent => Can be used to
determine what should be done to boost its sales.– Bagels in the antecedent => Can be used to see
which products would be affected if the store discontinues selling bagels.
– Bagels in antecedent and Potato chips in consequent=> Can be used to see what products should be sold with Bagels to promote sale of Potato chips!
Association Rule Discovery: Application 2
● Supermarket shelf management– Goal: To identify items that are bought together by
sufficiently many customers.– Approach: Process the point-of-sale data collected
with barcode scanners to find dependencies among items.
– A classic rule --u If a customer buys diaper and milk, then he is very likely to
buy beer.u So, don’t be surprised if you find six-packs stacked next to
diapers!

Association Rule Discovery: Application 3
● Inventory Management
– Goal: A consumer appliance repair company wants to anticipate the nature of repairs on its consumer products and keep the service vehicles equipped with right parts to reduce on number of visits to consumer households.
– Approach: Process the data on tools and parts required in previous repairs at different consumer locations and discover the co-occurrence patterns.

Sequential Pattern Discovery: Definition
● Given is a set of objects, with each object associated with its own timeline of events, find rules that predict strong sequential dependencies among different events.
● Rules are formed by first discovering patterns. Event occurrences in the patterns are governed by timing constraints.
(A B) (C) (D E)
<= ms
<= xg >ng <= ws
(A B) (C) (D E)

Sequential Pattern Discovery: Examples
● In telecommunications alarm logs,– (Inverter_Problem Excessive_Line_Current)
(Rectifier_Alarm) --> (Fire_Alarm)
● In point-of-sale transaction sequences,– Computer Bookstore:
(Intro_To_Visual_C) (C++_Primer) --> (Perl_for_dummies,Tcl_Tk)
– Athletic Apparel Store: (Shoes) (Racket, Racketball) --> (Sports_Jacket)

Regression
● Predict a value of a given continuous valued variable based on the values of other variables, assuming a linear or nonlinear model of dependency.
● Greatly studied in statistics, machine learning, etc.
● Examples:– Predicting sales amounts of new product based on
advertising expenditure.– Predicting wind velocities as a function of
temperature, humidity, air pressure, etc.– Time series prediction of stock market indices.

Deviation/Anomaly Detection
● Detect significant deviations from normal behavior● Applications:
– Credit card fraud detection
– Network intrusion detection
Typical network traffic at University level may reach over 100 million connections per day

(Some) Challenges of Data Mining
● Scalability● Dimensionality● Complex and heterogeneous data● Data quality● Data ownership and distribution● Privacy preservation● Streaming data