data mining in bioinformatics day 8: graph mining for
TRANSCRIPT

Data Mining in BioinformaticsDay 8: Graph Mining for Chemoinformatics
and Drug Discovery
Chloé-Agathe Azencott
Machine Learning & Computational Biology Research GroupMPIs Tübingen
C.-A. Azencott Graph Mining for Chemoinformatics February 16, 2012 1

Drug Discovery
Modern Therapeutic Research
From serendipity to rationalized drug design
Ancient Greeks treatinfections with mould
CH 3
N
S
O
NH
O
HO
NH 2
O
HO
CH 3
Biapenem in PBP-1A
C.-A. Azencott Graph Mining for Chemoinformatics February 16, 2012 2

Drug Discovery
Drug Discovery Process
C.-A. Azencott Graph Mining for Chemoinformatics February 16, 2012 3

Drug Discovery
Drug Discovery Process
C.-A. Azencott Graph Mining for Chemoinformatics February 16, 2012 4

Drug Discovery
Drug Discovery Process
C.-A. Azencott Graph Mining for Chemoinformatics February 16, 2012 5

Drug Discovery
Chemoinformatics
How can computer science help?
→ Chemoinformatics!“...the mixing of information resources to transform data into information, and information into knowledge, forthe intended purpose of making better decisions faster in the arena of drug lead identification and optimisation.”– F. K. Brown
“... the application of informatics methods to solve chemical problems.” – J. Gasteiger and T. Engel
C.-A. Azencott Graph Mining for Chemoinformatics February 16, 2012 6

Drug Discovery
Chemoinformatics
C.-A. Azencott Graph Mining for Chemoinformatics February 16, 2012 7

Drug Discovery
The Chemical Space
É 1060 possible small moleculesÉ 1022 stars in the observable
universe
(Slide courtesy of Matthew A. Kayala)
C.-A. Azencott Graph Mining for Chemoinformatics February 16, 2012 8

Structure-Based Approaches
Drug Discovery Process
QSAR: Qualitative Structure-Activity Relationship (classification)QSPR: Quantititive Structure-Property Relationship (regression)
C.-A. Azencott Graph Mining for Chemoinformatics February 16, 2012 9

Structure-Based Approaches
Representing Chemicals in silico
É Expert knowledge molecular descriptors→ hard, potentially incomplete
É How to get a “complete” enough representation?
CH 3
N
S
O
NH
O
HO
NH 2
O
HO
CH 3
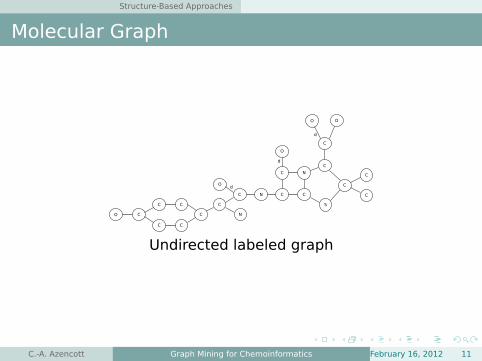
Similar Property Principle: molecules having similar structuresshould exhibit similar activities.
É → Structure-based representations
É Compare molecules by comparing substructures
C.-A. Azencott Graph Mining for Chemoinformatics February 16, 2012 10
Structure-Based Approaches
Molecular Graph
Undirected labeled graph
C.-A. Azencott Graph Mining for Chemoinformatics February 16, 2012 11

Structure-Based Approaches
Feature Vectors based on Patterns
É Define feature vectors that record the presence/absence (ornumber of occurrences) of particular patterns in a givenmolecular graph
ϕ(A) = (ϕs(A))s substructure
where
ϕs(A) =
�
1 if s occurs in A0 otherwise
É Extension of traditional chemical fingerprints
C.-A. Azencott Graph Mining for Chemoinformatics February 16, 2012 12

Structure-Based Approaches
Feature Vectors based on Patterns
Classical machine learning and data mining techniques can beapplied to these vectorial feature representations.
É Any distance / kernel can be used
É Dot product → “How many substructures do two compoundsshare?”
É Classification
É Feature selection
É Clustering
C.-A. Azencott Graph Mining for Chemoinformatics February 16, 2012 13
Structure-Based Approaches
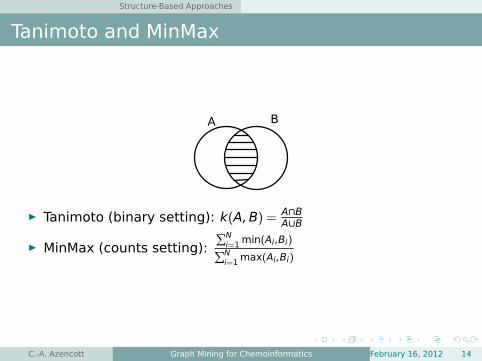
Tanimoto and MinMax
É Tanimoto (binary setting): k(A,B) = A∩BA∪B
É MinMax (counts setting):∑N
i=1 min(Ai,Bi)∑N
i=1 max(Ai,Bi)
C.-A. Azencott Graph Mining for Chemoinformatics February 16, 2012 14
Structure-Based Approaches
Tanimoto and MinMax
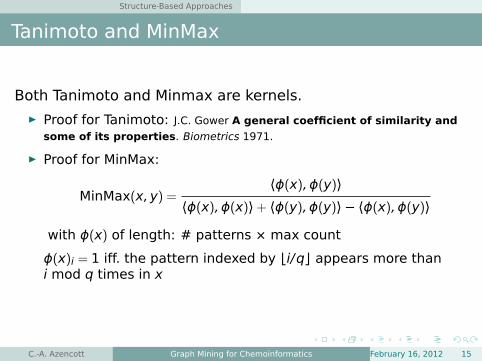
Both Tanimoto and Minmax are kernels.É Proof for Tanimoto: J.C. Gower A general coefficient of similarity and
some of its properties. Biometrics 1971.
É Proof for MinMax:
MinMax(x,y) =⟨ϕ(x), ϕ(y)⟩
⟨ϕ(x), ϕ(x)⟩+ ⟨ϕ(y), ϕ(y)⟩ − ⟨ϕ(x), ϕ(y)⟩
with ϕ(x) of length: # patterns × max count
ϕ(x)i = 1 iff. the pattern indexed by bi/qc appears more thani mod q times in x
C.-A. Azencott Graph Mining for Chemoinformatics February 16, 2012 15

Structure-Based Approaches
Fingerprint Compression
É Systematic enumeration → long, sparse vectorse.g. 50,000 random compounds from ChemDB→ 300,000 paths of length up to 8→ 300 non-zeros on average
É “Naive” CompressionÉ List the positions of the 1sÉ 219 = 524,288É average encoding: 300× 19 = 5,700 bits
É ModuloCompression(lossy)
É Elias-Gamma Monotone Encoding(lossless) [Baldi 2007]
É index j → blog(j)c 0 bits + binaryencoding of j
É ji < ji+1: blog(ji+1)c → blog(ji)− log(ji+1)cÉ average compressed size = 1,800 bits
C.-A. Azencott Graph Mining for Chemoinformatics February 16, 2012 16

Frequent Patterns MOLFEA
Frequent Pattern Mining: Mutagenicity InducingSubstructures
[Helma et al., 2004]
É P = positive (mutagenic) compoundsN = negative compounds
É features: fragments (= patterns) f such thatboth freq(f ,P) ≥ t and freq(f ,N ) ≤ t
É Limited to frequent linear patterns
É ML algorithm: SVM with linear or quadratic kernel
C.-A. Azencott Graph Mining for Chemoinformatics February 16, 2012 17

Frequent Patterns MOLFEA
Frequent Pattern Mining: Mutagenicity InducingSubstructures[Helma et al., 2004]
É CPDB – Carcinogenic Potency DataBaseÉ 684 compounds classified in 341 mutagens and 343
non-mutagens according to Ames test on Salmonella
1% 3% 5% 10%Frequency threshold
50
60
70
80
90
100
Cross-validated sensitivity
Mutagenicity prediction [Hema04]
Linear kernelQuadratic kernel
C.-A. Azencott Graph Mining for Chemoinformatics February 16, 2012 18
Frequent Patterns gBoost
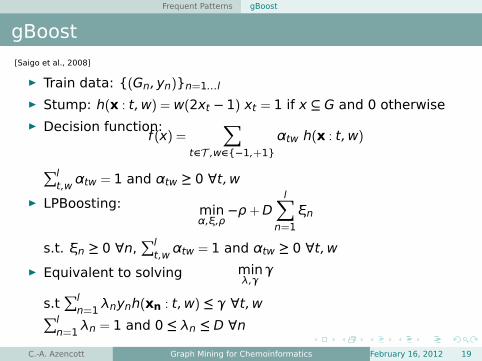
gBoost[Saigo et al., 2008]
É Train data: {(Gn,yn)}n=1...l
É Stump: h(x : t,w) = w(2xt − 1) xt = 1 if x ⊆ G and 0 otherwiseÉ Decision function:
f (x) =∑
t∈T ,w∈{−1,+1}
αtw h(x : t,w)
∑lt,w
αtw = 1 and αtw ≥ 0 ∀t,w
É LPBoosting: minα,ξ,ρ
−ρ+Dl∑
n=1
ξn
s.t. ξn ≥ 0 ∀n,∑l
t,wαtw = 1 and αtw ≥ 0 ∀t,w
É Equivalent to solving minλ,γ
γ
s.t∑l
n=1 λnynh(xn : t,w) ≤ γ ∀t,w∑l
n=1 λn = 1 and 0 ≤ λn ≤ D ∀n
C.-A. Azencott Graph Mining for Chemoinformatics February 16, 2012 19
Frequent Patterns gBoost
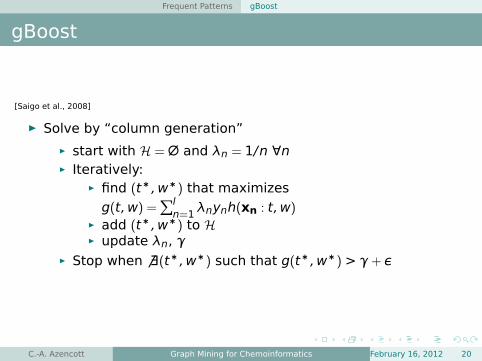
gBoost
[Saigo et al., 2008]
É Solve by “column generation”
É start with H =∅ and λn = 1/n ∀nÉ Iteratively:
É find (t∗,w∗) that maximizesg(t,w) =
∑ln=1 λnynh(xn : t,w)
É add (t∗,w∗) to HÉ update λn, γ
É Stop when 6 ∃(t∗,w∗) such that g(t∗,w∗) > γ+ ε
C.-A. Azencott Graph Mining for Chemoinformatics February 16, 2012 20

Frequent Patterns gBoost
gBoost
[Saigo et al., 2008]
É Finding (t∗,w∗): DFS code tree
É Pruning condition (g∗ optimal gain so far): if
max
2∑
n:yn=1,t⊆Gn
λn −l∑
n=1
ynλn,2∑
n:yn=−1,t⊆Gn
λn +l∑
n=1
ynλn
< g∗
then ∀t′ : t ⊆ t′,∀w′,g∗ > g(t′,w′)
C.-A. Azencott Graph Mining for Chemoinformatics February 16, 2012 21

Frequent Patterns gBoost
gBoost
[Saigo et al., 2008]
Application to CPDB:
É Accuracy similar toHelma et al. (79%)
É Most discriminativepatterns
C.-A. Azencott Graph Mining for Chemoinformatics February 16, 2012 22

All Patterns 2D Kernels
Paths-Based Fingerprints
É Labeled sub-paths (walks)
Figure: Some sub-paths of length 3
C.-A. Azencott Graph Mining for Chemoinformatics February 16, 2012 23

All Patterns 2D Kernels
Circular Fingerprints
É Labeled sub-trees - Extended-Connectivity (or Circular)features
Figure: Example of a circular substructure of depth 2
C.-A. Azencott Graph Mining for Chemoinformatics February 16, 2012 24

All Patterns 2D Kernels
Two-Dimensional Kernels[Azencott et al., 2007]
É Systematically extract paths / circular fingerprints,for various maximal depths
É SVM with Tanimoto / Minmax
É DataÉ Mutagenicity (Mutag): 188 compoundsÉ Benzodiazepine receptor affinity (BZR): 181+ 125
compoundsÉ Cyclooxygenase-2 ihibitors (COX2): 178+ 125
compoundsÉ Estrogen receptor affinity: 166+ 180 compounds
Data SVM Previous bestMutag 90.4% 85.2% (gBoost)BZR 79.8% 76.4%
COX2 70.1% 73.6%ER 82.1% 79.8%
C.-A. Azencott Graph Mining for Chemoinformatics February 16, 2012 25

All Patterns 3D Kernels
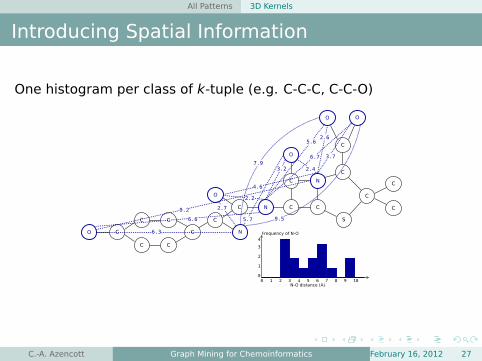
Introducing Spatial Information
É 3D Histograms [Azencott et al, 2007]
É Groups of k atoms
É Associated size:É Pairwise distances (k = 2)É diameter of the smallest sphere that
contains all k atoms
C.-A. Azencott Graph Mining for Chemoinformatics February 16, 2012 26
All Patterns 3D Kernels
Introducing Spatial Information
One histogram per class of k-tuple (e.g. C-C-C, C-C-O)
C.-A. Azencott Graph Mining for Chemoinformatics February 16, 2012 27

All Patterns 3D Kernels
Hist3D Performance
Data 2D kernel Hist3D kernelMutag 90.4% 88.8%
BZR (loo) 82.0% 79.4%ER (loo) 87.0% 86.1%COX2 76.9% 78.6%
C.-A. Azencott Graph Mining for Chemoinformatics February 16, 2012 28

All Patterns 3D Kernels
Introducing Spatial InformationÉ 3D Decomposition Kernels Ceroni et al, 2007
É Try to match patterns in 3D space as well
É e−γ(li−l′i )2
li (resp l′i): length of edge i in molecule x (resp. x′)
É edges are lexicographically orderedÉ kernel between two patterns:
Ks(σ, σ′) =r∏
i=1
δ(ei,e′i)e−γ(li−l′i )
2
É kernel between two molecules:
K(x,x′) =∑
σ∈x
∑
σ∈x′Ks(σ, σ′)
É can be reduced to a class of patterns (e.g. circularsubstructures)
C.-A. Azencott Graph Mining for Chemoinformatics February 16, 2012 29

All Patterns 3D Kernels
3DDK Performance
Data 2D kernel Hist3D kernel 3DDK Circ3DDKMutag 90.4% 88.8% 86.7% 83.5%
BZR (loo) 82.0% 79.4% 78.4% 81.4%ER (loo) 87.0% 86.1% 82.3% 82.1%COX2 76.9% 78.6% 75.6% 75.2%
É How relevant is 3D information?É How good is 3D information?
C.-A. Azencott Graph Mining for Chemoinformatics February 16, 2012 30

Virtual HTS
Drug Discovery Process
C.-A. Azencott Graph Mining for Chemoinformatics February 16, 2012 31

Virtual HTS
High-Throughput Screening
É Assay a large libraryof potential drugsagainst their target
É Very costly
É → docking
É → virtualhigh-throughputscreening (vHTS)
C.-A. Azencott Graph Mining for Chemoinformatics February 16, 2012 32

Virtual HTS Measuring Performance
Imbalanced Data
É Typically, most compounds are inactive ⇒ many more negativethan positive examples
É E.g. DHFR data setÉ 99,995 chemicals screened for activity against
dihydrofolate reductaseÉ < 0.2% active compounds
É Accuracy is not appropriate:predicting all compounds negative ⇒ accuracy = 99.8%
É sensitivity = # True Positives# Positives
É specificity =# True Negatives
# NegativesÉ For many methods, the output is continuous⇒ accuracy, sensitivity and specificity depend on a threshold θ
C.-A. Azencott Graph Mining for Chemoinformatics February 16, 2012 33
Virtual HTS Measuring Performance
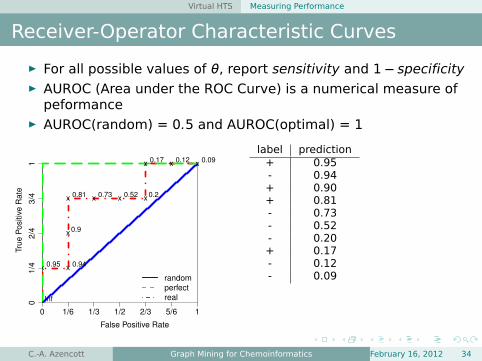
Receiver-Operator Characteristic Curves
É For all possible values of θ, report sensitivity and 1− specificityÉ AUROC (Area under the ROC Curve) is a numerical measure of
peformanceÉ AUROC(random) = 0.5 and AUROC(optimal) = 1
0 1/6 1/3 1/2 2/3 5/6 1
01
/42
/43
/41
False Positive Rate
Tru
e P
ositiv
e R
ate
x
x x
x
x x x x
x x x
Inf
0.95 0.94
0.9
0.81 0.73 0.52 0.2
0.17 0.12 0.09
random
perfect
real
label prediction+ 0.95- 0.94+ 0.90+ 0.81- 0.73- 0.52- 0.20+ 0.17- 0.12- 0.09
C.-A. Azencott Graph Mining for Chemoinformatics February 16, 2012 34

Virtual HTS Measuring Performance
Inhibition of DHFR: ROC Curves
method AUCIRV 0.71SVM 0.59kNN 0.59
MAX-SIM 0.54
0.0 0.2 0.4 0.6 0.8 1.0
0.0
0.2
0.4
0.6
0.8
1.0
FPR
TP
R
RANDOM
IRV
SVM
MAXSIM
C.-A. Azencott Graph Mining for Chemoinformatics February 16, 2012 35
Virtual HTS Measuring Performance
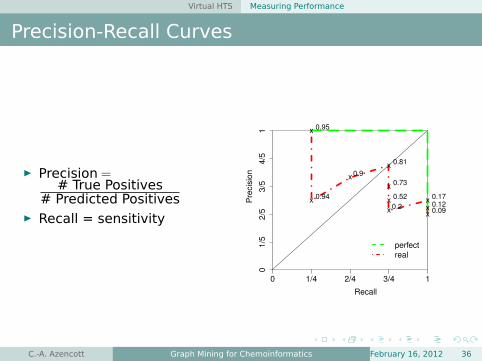
Precision-Recall Curves
É Precision =# True Positives
# Predicted PositivesÉ Recall = sensitivity
0 1/4 2/4 3/4 1
01
/52
/53
/54
/51
Recall
Pre
cis
ion
x
x
x
x
x
x
x
xxx
0.95
0.94
0.9
0.81
0.73
0.52
0.2
0.170.120.09
perfect
real
C.-A. Azencott Graph Mining for Chemoinformatics February 16, 2012 36

Other Graph Mining Applications
Other Applications
É Database indexing and searchÉ Prediction of 3D structures of small compounds and
proteinsÉ Reaction Prediction
C.-A. Azencott Graph Mining for Chemoinformatics February 16, 2012 37
Other Graph Mining Applications
ReferencesC.-A. Azencott, A. Ksikes, S. J. Swamidass, J. H. Chen, L. Ralaivola, and P. Baldi.One- to Four-Dimensional Kernels for Virtual Screening and the Prediction of Physical, Chemical, andBiological Properties. J. Chem. Inf. Model, 2007http://www.igb.uci.edu/~pfbaldi/publications/journals/2006/ci600397p.pdf
P. Baldi, R. Benz, J. S. Swamidass, and D. S. Hirschberg.Lossless Compression of Chemical Fingerprints Using Integer Entropy Codes Improves Storage andRetrieval J. Chem. Inf. Model, 2007 http://www.ics.uci.edu/~dan/pubs/ci700200n.pdf
A. Ceroni, F. Costa, and P. Frasconi.Classification of Small Molecules by Two- and Three-Dimensional Decomposition Kernels. Bioinformatics,2007 http://bioinformatics.oxfordjournals.org/content/23/16/2038
T. Fawcett.ROC Graphs: Notes and Practical Considerations for Researchers HP Labs Tech Report, 2004http://citeseer.ist.psu.edu/viewdoc/summary?doi=10.1.1.10.9777
C. Helma, T. Cramer, S. Kramer, and L. De Raedt.Data Mining and Machine Learning Techniques for the Identification of Mutagenicity Inducing Substructuresand Structure Activity Relationships of Noncongeneric Compounds. J. Chem. Inf. Comput. Sci., 2004http://cbio.ensmp.fr/~jvert/svn/bibli/local/Helma2004Data.pdf
H. Saigo, S. Nowozin, T. Kadowaki, T. Kudo, and K. Tusda.gBoost: a mathematical programming approach to graph classification and regression Mach. Learn., 2009http://www.nowozin.net/sebastian/papers/saigo2008gboost.pdf
C.-A. Azencott Graph Mining for Chemoinformatics February 16, 2012 38