data mining for improving textbooks · · 2018-01-04data mining for improving textbooks ......
TRANSCRIPT
Data Mining for Improving Textbooks
Rakesh Agrawal Sreenivas Gollapudi Anitha Kannan Krishnaram KenthapadiSearch Labs, Microsoft Research
Mountain View, CA, USA{rakesha, sreenig, ankannan, krisken}@microsoft.com
ABSTRACTWe present our early explorations into developing a datamining based approach for enhancing the quality of text-books. We describe a diagnostic tool to algorithmicallyidentify deficient sections in textbooks. We also discusstechniques for algorithmically augmenting textbook sectionswith links to selective content mined from the Web. Ourevaluation, employing widely-used textbooks from India, in-dicates that developing technological approaches to help im-prove textbooks holds promise.
1. INTRODUCTIONEducation is known to be a key determinant of economicgrowth and prosperity [49; 25]. While the issues in devis-ing a high-quality educational system are multi-faceted andcomplex, textbooks form one type of educational input mostconsistently associated with gains in student learning [46].They are the primary conduits for delivering content knowl-edge to the students and the teachers base their lesson plansmainly on the material given in textbooks [21].
Considerable research has gone into investigating what makesfor good textbooks [24; 30; 48]. There has also been work ondesigning ideal textbooks [9; 32; 43]. While several factorsdetermine the quality of a textbook, there is general agree-ment that the good textbooks should present concepts in acoherent manner and provide adequate coverage of impor-tant concepts.
Unfortunately, many textbooks, particularly from emergingregions, suffer from two major problems: (1) the lack of clar-ity of language and incoherent presentation of concepts, and(2) inadequacy of information provided [1]. We quote froma critique of a grade IX Indian History textbook [36]: “Thewhole (medieval) period has been presented as a dull anddry history of dynasties, cluttered with the names and mili-tary conquests of kings, followed by brief acknowledgementsof ‘social and cultural life’, ‘art and architecture’, ‘revenueadministration’, and so on. The entire Mughal period (1526-1707) is disposed of in six pages.”
In order to address the first problem, we present a diag-nostic tool for algorithmically identifying those sections ofa textbook that are not well-written and hence can benefitfrom rewriting. The tool uses a probabilistic decision model,
which is based on the notion of the dispersion of key con-cepts occurring in the section and the syntactic complexityof writing [5].
To address the second problem, we draw upon the learn-ing research that shows that the linking of encyclopedicinformation to educational material can improve both thequality of the knowledge acquired and the time needed toobtain such knowledge [13]. It is also shown that the useof visual material enhances learning, not only by enablingretention of information but also by promoting comprehen-sion and transfer [11; 39]. We, therefore, present techniquesfor algorithmically augmenting textbook sections with linksto selective articles and images mined from the Web. Forthis purpose, we identify key concept phrases occurring in asection, which are then used to find web articles represent-ing the central concepts presented in the section [6]. Usingthem, we also mine web images most relevant to a section,while respecting the constraint that the same image is notrepeated in different sections of the same chapter [4].
We have applied the proposed techniques to high school text-books published by the Indian National Council of Educa-tional Research and Training (NCERT). The preliminaryresults are encouraging and indicate that developing tech-nological approaches to improving textbooks is a promisingdirection for research.
The paper proceeds as follows. We first describe our methodfor determining key concepts and the relationships betweenthem in §2. We then discuss our methodology for diagnosingdeficient sections in §3. Techniques for augmenting sectionswith authoritative web articles and images are presented in§4 and §5 respectively. Illustrative results from the empiricalevaluation of these techniques are presented in §6. Finally,§7 presents conclusions and directions for future work. Wehave derived this paper from papers published elsewhere [4;5; 6]. Here, we focus on describing the main ideas and tech-niques and refer the reader to the original papers for in-depth descriptions.
2. KEY CONCEPTSThe basic building block underlying our approach is theidentification of key concepts described in the book and in-ferring the relationships between them. We discuss it first.
2.1 Determining Key ConceptsIf a textbook includes a back-of-the-book index [38], it canbe used for obtaining concept phrases. Unfortunately, notall books contain such indices; e.g., in a study reported in [8],only 55% of the 113 books examined included them. Fortu-
SIGKDD Explorations Volume 13, Issue 2 Page 7

Algorithm 1 DetermineKeyConcepts
Input: A section of text s; Pattern R for detectingterminological noun phrases; Pruning parameters Θ.Output: The set of key concept phrases for s.
1: Tag every sentence in s using a POS tagger. (§2.1.1)2: Compute the set C of terminological noun phrases that
maximally match the pattern R. (§2.1.2)3: Prune phrases from C whose POS tagging is inconsistent
with a lexical database, but the tag cannot be uniquelycorrected using the latter. (§2.1.3)
4: Prune common phrases from C based on the probabilityof occurrence of the phrases on the web and Θ. (§2.1.4)
5: Return C.
nately, there is rich literature on algorithmically extractingkey phrases from a document that can guide the task ofextracting key concepts [7; 42; 50].
After studying several textbooks, we devised the followingapproach (Algorithm 1). Concepts in our system correspondto terminological noun phrases. We first form a candidateset of concepts using linguistic patterns, with the help of apart-of-speech tagger. We used two of the linguistic patternsproposed in [31] that have been used widely in the NLPcommunity. We supplemented this set by a third patternbased on our inspection of the key concepts we identified bystudying books on different subjects. We then exploit com-plementary signals from a different source, namely, a lexicaldatabase, to correct errors made by the part-of-speech tag-ger. Next we eliminate both malformed phrases and verycommon phrases, based on the probabilities of occurrencesof these phrases on the Web. The reason for eliminatingcommon phrases is that they would be already well under-stood.
Our implementation employs the Stanford POS Tagger [45]for part-of-speech tagging, WordNet [18] as the lexical database,and Microsoft Web N-gram Service [47] to aid pruning ofmalformed and common phrases. Our methodology, how-ever, is oblivious to the specific tools, though the perfor-mance of the system is dependent on them. We summarizeour approach in Algorithm 1 and discuss each step in detailbelow.
2.1.1 Part-of-speech TaggingWe tag every sentence in the given text using Stanford POSTagger. We note that one could also use a shallow parser(e.g. [2]) for this task. The tagger assigns a unique part-of-speech to each word in a sentence. It predicts the part-of-speech tag even for an unknown word (such as a propernoun) by exploiting the context of the word in a sentence.The corpus may contain poorly formed sentences, due to pdfparsing issues as well as the presence of text extracted fromtables, mathematical equations, and other non-grammaticalstructures. For such sentences, the assigned part-of-speechtags may be incorrect.
2.1.2 Detecting Terminological Noun PhrasesWe next form a candidate set of concepts by determiningthe terminological noun phrases present in the text. Theconcepts of interest in our application typically consist ofnoun phrases containing adjectives, nouns, and sometimesprepositions. It is rare for concepts to contain other parts
of speech such as verbs, adverbs, or conjunctions.
We consider three patterns (P1, P2, and P3) for determin-ing terminological noun phrases. The first two of these arefrom [31] and the third is the one we added. We can expressthe three patterns using regular expressions as:
P1 = C∗N
P2 = (C∗NP )?(C∗N)
P3 = A∗N+
where N refers to a noun, P a preposition, A an adjective,and C = A|N . The pattern P1 corresponds to a sequence ofzero or more adjectives or nouns, ending with a noun, whileP2 is a relaxation of P1 that also permits two such pat-terns separated by a preposition. Examples of the formerinclude “cumulative distribution function”, “fiscal policy”,and “electromagnetic radiation”. Examples of the latter in-clude “degrees of freedom” and “Kingdom of Asoka”. P3
corresponds to a sequence of zero or more adjectives, fol-lowed by one or more nouns. This pattern is a restrictedversion of P1, where an adjective occurring between twonouns is not allowed. The motivation for this pattern comesfrom sentences such as the following: “The experiment withSwadeshi gave Mahatma Gandhi important ideas about us-ing cloth as a symbolic weapon against British rule”. Asa consequence of allowing arbitrary order of adjectives andnouns, “Mahatma Gandhi important ideas” is detected asa terminological noun phrase by pattern P1. On the otherhand, pattern P3 would result in the better phrases, “Ma-hatma Gandhi” and “important ideas”.
Our candidate concepts comprise of maximal pattern matches.Thus, we will not have “distribution function” as a candi-date in the presence of “cumulative distribution function”.The intuition is that it is better to have more specific con-cepts than general concepts. A similar strategy was usedin [33].
It was found in the empirical study reported in [6] thatthe pattern P1 outperforms P2. The pattern P3 exhibitedslightly better performance than P1 in this study.
2.1.3 Correcting Errors using WordNetThe Stanford POS Tagger can make errors on poorly formedsentences. We experimented with using WordNet to detectthese errors and correct them. WordNet is a large lexicaldatabase that groups words into sets of cognitive synonymscalled synsets, each expressing a distinct concept. We useWordNet to determine possible parts of speech (noun, ad-jective, verb, adverb) for words in its knowledge base. How-ever, WordNet would fail to recognize words absent in itsdatabase. WordNet being a hand curated system shouldhave better accuracy than an automated parsing tool, butlower coverage. We therefore use WordNet as a validationand error-correcting tool.
We check whether the parts of speech tags assigned by theStanford POS Tagger are consistent with those provided byWordNet. We say that disagreement occurs for a phrase iffor some word w in the phrase, (a) WordNet recognizes wand returns one or more part-of-speech tags and (b) the part-of-speech tag assigned by the Stanford POS Tagger is notamong the part-of-speech tags assigned by WordNet. Forexample, for the phrase “steatite micro beads”, the Stan-ford POS Tagger assignment is <Adjective><Noun><Noun>
SIGKDD Explorations Volume 13, Issue 2 Page 8

whereas the WordNet assignment is <Noun><Adjective><Noun>.In such cases, we change the POS Tagger assignment to theWordNet assignment, provided the latter still satisfies thelinguistic pattern. In the above example, the assignmentwill be modified to <Noun><Adjective><Noun>.
However, there may be cases where the WordNet assignmentis not unique. For example, for the phrase “control mea-sures”, WordNet has a non-unique assignment:<Noun|Verb><Noun|Verb>. Thus, the POS Tagger assign-ment <Adjective><Noun> is in disagreement with the Word-Net assignment, but it cannot be uniquely corrected andhence we drop the phrase from the candidate set.
The empirical evaluation demonstrated that a lexical databasesuch as WordNet can be quite complementary to a genericpart-of-speech tagger such as the Stanford POS Tagger, andwe were able to successfully use WordNet for correcting er-rors made by the POS tagger [6].
2.1.4 Pruning using the Web N-gram ServiceThe set of candidate phrases generated in the previous stepis likely to contain a number of common knowledge phrasesas well as some malformed or unimportant long phrases.For identifying such phrases, we obtain the probability ofoccurrence of the phrase on the Web using the MicrosoftWeb N-gram Service. We use this probability as a proxyfor whether the phrase is part of common knowledge, sincea common knowledge phrase is likely to have a significantpresence on the Web. Similarly this probability can alsoindicate whether the phrase is malformed, as such phrasesare less likely to occur on the Web. Thus, after obtainingthe probability scores for each phrase, we compute the scoredistribution across phrases over the entire corpus, and prunebased on this distribution to remove undesirable phrases.
The Microsoft Web N-gram Service provides the probabilityof occurrence of a given phrase over three corpora: bod-ies of web pages, titles of pages, and anchor texts for webpages. Compared to title or body, we found that the an-chor provided a stronger signal, perhaps because the anchortext represents how other web authors succinctly describethe target page.
Given the distribution D of N-gram log probability scores ofcandidate phrases, we compute certain parameterized statis-tical boundaries. Let Q1 denote the first quartile, that is, Q1
satisfies Prx∈D(x ≤ Q1) = 0.25. Similarly let Q3 denote thethird quartile, that is, Q3 satisfies Prx∈D(x ≤ Q3) = 0.75.The interquartile range IQR = Q3 − Q1 is a measure ofmid-spread of the distribution. Given non-negative param-eters t1 and t2, we can define fences on both ends of thedistribution:
LF (t1) = Q1 − t1 · IQR,
UF (t2) = Q3 + t2 · IQR.
We prune phrases whose scores are not within the fences asthe phrases with scores below the lower fence (LF (t1)) arelikely to be malformed and those with scores above the upperfence (UF (t2)) are likely to be of common knowledge. Asthe distribution of scores is not symmetric around the mean,we may need to select different pruning parameters.
Our empirical evaluation showed that our approach wasquite effective in identifying and pruning concepts that weremalformed or represented common knowledge concepts [6].
Algorithm 2 DetermineConceptGraph
Input: The set of key concept phrases C for a givensection s; An authoritative structured external source ofconcepts that also contains relationships between them (e.g.Wikipedia).Output: The concept graph for s.
1: Determine the set V of nodes corresponding to conceptsin C that match an article title from the external source.
2: Let W denote the set of all links in the external source.Define E = {(v1, v2)|v1, v2 ∈ V ∧ (v1, v2) ∈ W}. Com-pute the directed graph G = (V,E) thus induced by thelinks in W .
3: Return G.
2.2 Concept GraphHaving determined the set of concepts, a straightforward ap-proach to derive relationships between concepts would be tomanually label the concept pairs. However, labeling is a la-borious and subjective task. We instead consider an author-itative structured external source of concepts that also con-tains relationships between the concepts and use it to inferrelationships between the textbook concepts (Algorithm 2).
Our implementation maps textbook concepts to Wikipediaarticles and treats a concept c1 to be related to anotherconcept c2 if the Wikipedia article corresponding to c1 hasa link to the Wikipedia article corresponding to c2. We onlyconsider concept phrases that match the title of a Wikipediaarticle exactly. If any Wikipedia article is redirected to an-other article, we follow the redirect link till an article isfound. We then consider the directed graph induced by thesemapping articles and the Wikipedia links between them,thereby obtaining a concept graph that encapsulates the re-lationships between the concepts.
3. DIAGNOSING DEFICIENT SECTIONSOur decision model for identifying a poorly written sec-tion is based on the dispersion of key concepts mentionedin the section and the syntactic complexity of the writing.The model requires a tune set for learning its parameters.While human judgments may seem like an obvious way toobtain a tune set, it is difficult to assemble a sufficientlylarge group of qualified judges who can provide consistentratings. Hence we generate the tune set automatically ina novel way. This procedure maps sampled text book sec-tions to the closest versions of Wikipedia articles havingsimilar content and uses the maturity of those versions toassign need-for-exposition labels. The maturity of a versionis computed by considering the revision history of the cor-responding Wikipedia article and convolving the changes insize with a smoothing filter. We first discuss the rationale forchoosing these decision variables and formally define them,followed by a discussion of the model and the generation ofthe tune set.
3.1 Decision Variables
3.1.1 DispersionAfter going through several textbooks, we observed that asection that discussed concepts related to each other wasmore comprehensible than one that discussed many unre-
SIGKDD Explorations Volume 13, Issue 2 Page 9

(a) A section with very low dispersion(Grade IX Mathematics book)
(b) A section with low dispersion (GradeIX Science book)
(c) A section with very large dispersion(Grade XII Sociology book)
Figure 1: Concept graphs illustrating dispersion
Algorithm 3 ComputeDispersion
Input: A textbook section s.Output: Dispersion value for section s.
1: Compute the set of concepts C present in s. (§2.1)2: Infer the concept graph E for the concepts in C. (§2.2)
3: dispersion(s) := 1− |E||V |(|V |−1)
.
lated concepts. We formally capture this intuition by defin-ing a measure of dispersion over key concepts.
Let V represent the set of key concepts in a section s. Letrel be a binary relation that determines whether a conceptin V is related to another concept in V , that is, rel(x, y) istrue if concept x is related to concept y and false otherwise.We define dispersion of a section as the fraction of orderedkey concept pairs that are not related:
dispersion(s) :=|{(x, y)|x, y ∈ V ∧ x 6= y ∧ ¬rel(x, y)}|
|V |(|V | − 1).
(1)We note that dispersion takes values between 0 and 1, with0 corresponding to a section where all key concepts are mu-tually related and 1 corresponding to a section with mutu-ally unrelated key concepts.
Algorithm 3 describes the computation of dispersion fora given section. We first identify concepts following themethod discussed in §2.1, employing the pattern A∗N+,where A is an adjective and N a noun. We then obtainthe concept graph of relationships as described in §2.2, withisolated nodes removed. We note that the dispersion as de-fined in Eq. 1 is the same as 1 minus the edge density ofthis resulting graph, which we compute in the last step ofAlgorithm 3.
We illustrate our notion of dispersion through some exam-ples from the NCERT textbooks. Figure 1(a) and 1(b) showthe concept graphs for two sections with small dispersion.The first section titled “Types of Quadrilaterals” from theGrade IX Mathematics book has 19 directed edges over 6nodes with dispersion 0.37 and the second section titled“Charged Particles in Matter” from the Grade IX Sciencebook has 29 directed edges over 8 nodes with dispersion 0.48.
Indeed the concepts within each of these sections are quiterelated to each other, resulting in low dispersion values. Fig-ure 1(c) shows the concept graph for a section with largedispersion (with some isolated nodes also shown). This sec-tion titled “Variety of Methods” from Grade XII Sociologybook has 9 edges over 13 non-isolated nodes, contributingto a dispersion value of 0.94. The section discusses ratherunrelated concepts, leading to large dispersion.
3.1.2 Syntactic ComplexityTo measure syntactic complexity of writing, our first in-stinct was to use readability formulas [16]. Table 1 sum-marizes some of the popular ones and the variables theyuse. We observe that all formulas base their calculationson two classes of variables. First, they all use a sentencestructure measure, generally sentence length, the underly-ing intuition being that longer sentences are harder to readand comprehend. The sentence length can be in terms ofthe number of letters or the number of words, though theempirical evidence from past studies overwhelmingly favorsthe number of words. The second measure they use cap-tures the difficulty of the vocabulary at word level in termsof word familiarity or word length. The Dale long list [14]is frequently used for computing word familiarity. We donot employ word familiarity because of potential vocabu-lary mismatch between textbooks written in local variantsof English and the Dale list. The word length can be definedin terms of the number of syllables or the number of letters.Both the Coleman-Liau Index and the Automated Readabil-ity Index calculate word lengths as the number of letters.Their primary consideration, however, is data processing ef-ficiency and the effectiveness of this approach is suspicious[16]. Another approach is to compute word length in termsof the number of syllables, the intuition being that wordswith more syllables are more complex.
We also note that different readability formulas combinethe above two measures differently and the combinationsare learned with respect to specific datasets (often McCall-Crabbs Standard Test Lessons in Reading [35]). As a result,these formulas are highly correlated, a fact we confirmed inour experiments. We find it unnatural to directly use thereadability scores determined by these formulas as variablesin the decision model.
SIGKDD Explorations Volume 13, Issue 2 Page 10

Flesch Reading Ease Score 206.835 − 84.6 × S/W − 1.015 × W/TFlesch-Kincaid Grade Level −15.59 + 11.8 × S/W + 0.39 × W/TDale-Chall Grade Level 14.862 − 11.42 × D/W + 0.0512 × W/TGunning Fog Index 40 × C/W + 0.4 × W/T
SMOG Index 3.0 +√30 ×
√C/T
Coleman-Liau Index −15.8 + 5.88 × L/W − 29.59 × T/WAutomated Readability Index −21.43 + 4.71 × L/W + 0.50 × W/T
C = Number of words withthree syllables or more
D = Number of words onthe Dale Long List
L = Number of lettersS = Number of syllablesT = Number of sentencesW = Number of words
Table 1: Popular readability formulas and their variables
After considerable experimentation, we settled on the follow-ing two variables as measures for the syntactic complexityof writing:
1. Average sentence length: average number of words persentence in the section.
2. Average word length: average number of syllables perword in the section.
See [12; 17] for algorithms for computing the number of syl-lables per word. The number of syllables in a word can alsobe approximated by counting consonant-separated vowels.Each group of adjacent vowels counts as one syllable (for ex-ample, ‘ea’ in ‘real’ contributes one syllable, whereas ‘e...a’in ‘regal’ contributes two syllables), but an ‘e’ occurring atthe end of a word does not contribute to syllable count. Eachword has at least one syllable.
3.2 Decision ModelWe take a learning approach to arrive at the model for de-ciding whether a book section can benefit from rewriting.Our proposed model is probabilistic and its parameters arelearned using an algorithmically generated tune set. Thetune set consists of sections with different maturity, the in-tuition being that the more immature a section, the greaterthe need for its revision.
3.2.1 ModelOur goal is to learn a decision model that can provide aprobabilistic score of whether a textbook section requiresrevision based on the values of decision variables for thatsection. We would also like such a decision model to auto-matically learn the relative importance between the decisionvariables. The binary logistic regression eminently lends it-self to this desiderata.
Let z represent a section’s decision variables: a three di-mensional vector whose components are the average sen-tence length, average word length, and dispersion. Given z,the binary logistic regression predicts the probabilistic scorethat a section needs revision (i.e., label y = 1) through thelogistic function:
P (y = 1|z,w) =1
1 + exp {−(b+ zTw)} .
The parameter w is the weight vector of the function, witheach component wj measuring the relative importance of thedecision variable zj for predicting the label y.
The weight vector w is learned from a tune set consistingof N textbook sections: {Z,y} = {(z1, y1), . . . , (zN , yN )},with (zi, yi) representing the decision variable vector zi andthe label yi for the ith textbook section. The optimal w is
Algorithm 4 GenerateTuneSet
Input: A collection of sections from a textbook corpus;A collection of versioned documents from an authoritativeweb resource such as Wikipedia; Threshold parameters θ1and θ2.Output: A tune set consisting of a subset of sections, eachlabeled either 1 (Revise) or 0 (Don’t).
1: for each section s do2: Map section s to a set W (s) of most similar versioned
documents from the web resource, along with theirsimilarity scores sim(s, v) ∀v ∈W (s). (§3.2.3)
3: Compute immaturity score m(v) for each versioneddocument v ∈W (s). (§3.2.4)
4: Compute immaturity score m(s) for section s by ag-gregating immaturity scores m(v) for v ∈ W (s),weighted by their similarity scores sim(s, v).
5: Label(s) := 1 if m(s) > θ1; 0 if m(s) < θ2; undefinedotherwise.
6: Output 〈s, Label(s)〉 for sections s where Label(s) is ei-ther 1 or 0.
the one that maximizes the conditional log-likelihood of thelabels in the tune set:
arg maxw
logP (y|Z,w) = arg maxw
N∑i=1
logP (yi|zi,w).
3.2.2 Generating Tune SetGiven the difficulty of obtaining manual judgments, we pro-pose using meta data associated with textbooks to obtainlabels. One such meta data is the immaturity level of a sec-tion; an immature section hinders the positive learning ex-perience of a student, and therefore calls for revision. How-ever, immaturity computation requires access to rich datasuch as extent and timing of the revisions, which is typi-cally not available for textbooks. We, therefore, resort to anindirect device for estimating the maturity of a section.
We note that authoritative information resources on theWeb, such as Wikipedia, are created through collective ef-forts of multiple authors. The content gets repeatedly up-dated until writers expressing opinions on the subject cometo a consensus. As new information becomes available, thiscycle of revisions repeats. A key aspect of such web re-sources is that the revisions are recorded and maintainedby the source. Hence, we map a textbook section to themost similar version of a similar article in a web resourceand use the immaturity of that version as the proxy for theimmaturity of the textbook section.
The tune set generation is outlined in Algorithm 4. Wesample a subset of textbook sections across all subjects and
SIGKDD Explorations Volume 13, Issue 2 Page 11

classes. For each section, we find a small set of closest match-ing versions in the web resource that are similar in con-tent. The matches are found using the technique describedin §3.2.3. We then compute the immaturity for these ver-sions using the technique given in §3.2.4. The immaturityscores are then aggregated through a weighted combination(weights are the normalized similarity scores) to produce thematurity score for the textbook section. This score is thenconverted into a decision on what label should be assignedto this book section. Note that we need only a small amountof labeled data since the model has a very small number ofparameters.
We observe that the immaturity computation is reliable onlyat the extreme ends: very high values or very low values ofscores. The parameters θ1 and θ2 allow us to achieve thisgoal. Their values are empirically determined, balancing theneed for high precision with the need for having sufficientlabeled data.
3.2.3 Computing similarityIn a document model where each document is treated as abag (multi-set) of words, a well-known measure of similaritybetween documents A and B is the Jaccard index, defined assim(A,B) := |A ∩B|/|A ∪B|. Here, we note that the termsand their associated weight, i.e., importance (e.g., tf-idf) inthe document gives raise to the multi-set representation ofthe document. Thus A = {< x1, wx1 >,< x2, wx2 >, . . . , <xn, wxn >}. The large and often varying sizes of documents(i.e., cardinality of the sets) and further, terms with varyingweights can make this similarity computation expensive. Weuse the well-known min-wise independent permutations [10]to get around these problems.
We proceed as follows. Given a document A, we convertit to a set A = {x ∈ A|x ∈ A
∧R(x) ≤ wx} using a con-
sistent hash function R(x) that maps words in the docu-ment uniformly and randomly in the interval [0, 1]. In otherwords, we include the significant terms in the document inthe newly defined document set. Next, we compute the min-wise independent permutation of A as MH(A) := arg minx{R(x)| x ∈ A}. Thus, MH(A) denotes the leftmost ele-
ment of A in the permutation. Now, for any two documentsA and B, |A ∩B|/|A ∪B| ≈ Pr[MH(A) = MH(B)] [23].Finally, we compute H min-hashes to yield the sketch ofA, S(A) = {MH1(A),MH2(A), . . . ,MHH(A)}. Repeat forB. Now, |S(A) ∩ S(B)|/|S(A) ∪ S(B)| gives the estimatefor sim(A,B).
3.2.4 Computing immaturityConsider a web repository in which a new version of a doc-ument is created at the end of the day, ignoring multipleupdates to the document within a day. Older versions of adocument are saved when a new version is created. We ob-serve that paraphrasing, additions or deletions indicate theamount of revision. Thus, the relative change in the size ofthe document is an indicator of the maturity of a version (thesmaller the change, the higher the maturity). The numberof days for which a version remains the latest version is alsoan indicator of the maturity of the version (the longer theduration, the higher the maturity). Finally, people tend toconsult nearby versions when creating a revision. Thus, ma-turity is a local phenomenon driven by local context. Armedwith these observations, we proceed as follows.
Assume days are numbered from 1 to the current day T .
Algorithm 5 AugmentWithArticles
Input: A textbook section s.Output: An ordered list of links to top k articles forembellishing section s.
1: Compute the set C of concepts present in s. (§2.1)2: Infer the concept graph E for the concepts in C. (§2.2)3: Compute k. (Eq. 2)4: Compute the authority score of nodes in E.5: Return the top k nodes in the decreasing order of node
authority score, excluding any node corresponding to aconcept embellished earlier in the textbook.
Consider a document whose initial version v1 was created onday 1. Let L be a vector of length T whose ith componentLi is equal to the size of the document (in number of words)on day i. Define a vector δ(L) whose ith component is therelative change in document size between neighboring daysi and i− 1:
δ(L)i = |Li − Li−1|/Li.
For a particular version v created on day d, we define itsimmaturity m(v) to be the value of convolution betweenδ(L) and a smooth filter h on day d:
m(v) := (δ(L) ∗ h)d =
min(K/2,T−d)∑j=max(−K/2,1−d)
hjδ(L)d+j ,
where K is a parameter of the filter used in the convolution.
The convolution with a smooth filter allows for modelingimmaturity as a smooth continuous process, and the use oflocal neighborhood enables incorporating local context. Weemploy the frequently used Hann Filter
hj = 0.5(1 + cos(2πj/K))
that has K days spatial support with a smooth fall off in thechosen K sized neighborhood.
We note that there have been efforts (e.g. [26]) to assignquality index to Wikipedia articles taking into account edithistory of the article such as the frequency and size of editsand the type and reputation of the authors. However, weare not aware of any work targeted at computing the matu-rity of an arbitrary version of a Wikipedia article, and thetechnique we presented could be of independent interest.
4. AUGMENTING WITH AUTHORITATIVEARTICLES
Our goal is to embellish a textbook section with links to au-thoritative articles most relevant to the central concepts dis-cussed in the section. Our implementation uses Wikipediaas the source of supplementary material. In order to con-tain the cognitive burden on the reader, we add only up tok links.
As described in Algorithm 5, we first identify key conceptphrases present in the section. We use the algorithm from§2.1 for this purpose. We next form the concept graphfor the section, inferring relationships between the conceptsthus identified, using the algorithm from §2.2. We now com-pute the authority score (e.g. page rank) of the nodes in theconcept graph. We then sort the nodes in the decreasing or-der of their authority scores, select top k nodes, and augment
SIGKDD Explorations Volume 13, Issue 2 Page 12

the section with links to articles corresponding to them. Theintuition is that the central concepts present in a section willbe related to many concepts mentioned in the section. Fur-ther, given the progressive learning nature of the textbooks,it is worthwhile to exclude concepts that have already beenused for augmentation earlier in the textbook.
The number of articles, k, selected for embellishing a sec-tion can be determined using the distribution of the nodeauthority scores. The node authority scores appear to fol-low Zipf’s ranked distribution, Xr ∝ r−1/α, where Xr is thevalue of the rth ranked node authority score and α is the tailindex parameter of the underlying Pareto distribution. Thetail index can be estimated by regressing the log of orderstatistics on the log of the scores. For a desired coverage, c(say, 80%) and a limit k0 (say, 3) on the maximum numberof concepts to be shown, we obtain
k = min
(k0,(c+ (1− c)n( 1
α−1)) αα−1 · n
), (2)
where n is the number of nodes in the induced graph. Whilethis determination can be made empirically as well, we pro-pose fitting Zipf’s distribution to the node authority scoresas it will help to characterize the distributions over differ-ent subjects and over different grade levels, with varying αvalues.
5. AUGMENTING WITH AUTHORITATIVEIMAGES
Our goal is to find a small number of images that are mostrelevant to enhance the understanding of a particular sectionof the textbook, shunning repetition of an image in differ-ent sections of the same chapter. Our solution has threecomponents:
Image Mining. This component comprises of algorithmsthat mine the web for images relevant to a particular sec-tion and provide a ranked list of top k images along withtheir relevance scores. It is preferable to have algorithmsthat make use of orthogonal signals in their search for im-ages in order to have a broad selection of images to choosefrom. We provide two specific algorithms, namely Comityand Affinity, which satisfy these properties.
Image Assignment. The image mining algorithms providelocally optimal solution in that they yield images that arebest suited for the given section. Consequently, the sameimage might be selected for different sections of a chapter,giving rise to the need for chapter level optimal assignmentof images.
Given a set of candidate images and their relevance scores forevery section of a chapter, the image assignment componentassigns images to various sections in a way that maximizesthe relevance score for the chapter while maintaining theconstraints that no section has been assigned more than acertain maximum number of images and no image is usedmore than once in the chapter. We provide a polynomialtime algorithm for implementing the optimizer.
Image Ensembling. Since the relevance scores provided bydifferent image mining algorithms will in general be incom-parable, the assignment of images to different sections ofa chapter needs to be performed separately for each algo-rithm. The image ensembling component aggregates theranked lists of image assignments to produce the final re-sult.
Algorithm 6 Comity
Input: A textbook section j; Number of desired imageresults k; Number of desired image search results per queryt; Number of desired concept phrases c.Output: A list of top k image results from web, along withrelevance scores.
1: Obtain c concept phrases from section j. (§2.1)2: Form queries consisting of two and three concepts
phrases each ((c2
)+(c3
)queries in total).
3: Obtain top t image search results for each of the queriesfrom e different search engines.
4: Aggregate over (potentially e((c2
)+(c3
))) lists of images,
to obtain λij values for each image.5: Return top k images along with their λij values.
While it is possible to use any rank aggregation algorithm,we wanted a voting scheme that considers all the elements ofa ranked list and provides consensus ranking. The popularBorda’s method fits the bill [41]. Ensembling is done sequen-tially within a chapter, starting from the first section. Topimages selected for a section are eliminated from the poolof available images for the remaining sections. The imageassignment is then rerun, followed by an ensembling for thenext section.
We first present two algorithms for mining relevant imagesfrom the web, followed by the image assignment componentconsisting of an optimization problem, and finally the imageensembling component.
5.1 Image MiningHere we give particulars of the Comity and Affinity al-gorithms, the two algorithms used for obtaining the rankedlist of top k images along with their relevance scores for agiven section. Note that our system design admits variouspossible variants of these algorithms as well as additionalimage mining algorithms one could conceive.
Algorithm Comity
One might think that one could simply use the text stringof a section to query a commercial image search engine andobtain the relevant images. However, the current searchengines do not perform well with long queries [27]. Indeed,when we queried the search engines using even the first para-graph of a section, we got none or meaningless results. In onemajor stream of research on information retrieval with longqueries, the focus is on selecting a subset of the query, whilein another it is on weighting the terms of the query [51].This body of research however is not designed to work forqueries consisting of arbitrary textbook sections.
Algorithm 6 (Comity) is based on using the key conceptspresent in a section to query the commercial image searchengines. However, each concept phrase in isolation may notbe representative of the section as a typical book section candiscuss multiple concepts. Hence we form
(c2
)+(c3
)image
search queries by combining two and three concept phraseseach, in order to provide more context about the section. Arelevant image for the section is likely to occur among thetop results for many such queries. Thus, by aggregating theimage result lists over all the combination queries, we endup boosting the relevance scores of very relevant images forthe section. We further increase the coverage by obtaining
SIGKDD Explorations Volume 13, Issue 2 Page 13

Algorithm 7 Affinity
Input: A textbook section j; Number of desired imageresults k; Number of desired closest articles from anauthoritative external source t′; Number of desired conceptphrases c.Output: A list of top k image results from the authorita-tive source, along with value scores.
1: Obtain c concept phrases from section j. (§2.1)2: Obtain top t′ closest articles from the authoritative ex-
ternal source, based on content similarity with sectionj. (§3.2.3)
3: Extract the set of images present in these t′ articles, aswell as the metadata associated with each image aggre-gated over all occurrences of the image.
4: For each image i, let nij := Number of articles in whichimage i appears, dij := Number of concept phrases con-tained in the metadata for image i, wij := Number ofmatching words from all concepts in the metadata forimage i.
5: Assign the relevance score λij := nw1ij ·d
w2ij ·w
w3ij for image
i (w1, w2, w3 determine the relative weight given to thethree counts above).
6: Return top k images along with their λij values.
and merging results across e different search engines. Wetreat each search engine as a blackbox [27], that is, we haveaccess to the ranking of results but do not have access tothe internals of the search engine such as the score given toa document with respect to a query.
Aggregation across multiple lists is performed as follows.Each of t images in a result list is assigned a position-discounted score equal to 1/(p+ θ) where p denotes the po-sition and θ is a smoothing parameter. For the same imageoccurring in multiple lists, the scores are added, weightedby a function f of the importance of the concept phrasepresent in the underlying query: λij :=
∑q f(Importance
scores of concept phrases used in q) ×(1/(p(i, q, R(q)) + θ)).Here the summation is over e(
(c2
)+(c3
)) queries issued and
p(i, q, R(q)) denotes the position of image i in the result listR(q) for query q if i is present in R(q) and ∞ otherwise.This choice is based on our empirical observation that animage occurring among the top results for multiple querieswas more relevant to the section than an image that occurredamong the top results for only one query.
Algorithm Affinity
The intuition behind this algorithm is the observation thatthe images included in an authoritative article relevant toa topic are often illustrative of the key concepts underlyingthe topic. We therefore find authoritative articles whosecontents have high textual similarity with a given section ofthe book. We then extract images contained in these articlesand use their relevance scores to find top k images for thesection.
Algorithm 7 (Affinity) first obtains the key concept phrasespresent in a section as well as the closest authoritative arti-cles from the web. Thus the key topics discussed in the sec-tion are available in the form of the concept phrases whilethe search space for images is refined to the set of articleswith high document similarity to the section. The relevance
score for an image is computed by analyzing the overlapbetween the concept phrases and the cumulative metadataassociated with the various copies of the image present in thenarrowed set of articles. The metadata for an image com-prises of text adjacent to the image including caption andalternative text, filename of the image, anchor texts point-ing to the image, and queries that led to clicks on the image.The scoring has desirable properties such as: (a) an imageoccurring in multiple articles gets a higher score, (b) an im-age whose metadata contains multiple concept phrases getsa higher score, and (c) an image whose metadata containswords from many concepts gets a higher score.
5.2 Image AssignmentGiven a set of candidate images relevant to the various sec-tions of a chapter and their relevance scores, the goal of theimage assignment component is to allocate to each sectionthe most relevant images, while respecting the constraintsthat each section is not augmented with too many imagesand that each image is used no more than once in a chapter.The rationale for these constraints is that an augmentationof a section with too many images will put undue cogni-tive burden on the reader while the repetition of an imageacross sections in the same chapter would be redundant forthe reader.
First, a few notations. Let I = {1, 2, . . . , n} denote the setof images and S = {1, 2, . . . ,m} denote the set of sectionsin a chapter. Let λij denote the (non-negative) relevancescore of image i ∈ I for section j ∈ S (λij = 0 if the image iis not present in the candidate set of images for section j).Let Kj denote the maximum number of images that can beassociated with section j. Kj could be either a fixed integerfor all sections or a function of the length of the section j.
This problem admits a natural greedy algorithm. Sort theλij values in decreasing order and go through them. Ateach step, the greedy algorithm picks the highest λij valuesuch that an image can still be assigned to section j (thatis, less than Kj images have so far been assigned to j) andthen assigns image i to section j. This process ends wheneither all sections have been assigned the maximum numberof images or there are no more images to be assigned.
At a first glance, the greedy algorithm might seem optimal interms of the sum of relevance scores of all assigned images.But the following counterexample shows that the optimalvalue can be substantially larger. Consider a chapter con-sisting of two sections and suppose that we want two imageseach for a section (K1 = K2 = 2). Represent by (i, λ) thatimage i’s relevance score is λ. Let the top images and theirrelevance scores obtained by an image mining algorithm forvarious sections be as follows: s1 ← 〈(i1, 1), (i2, 1−ε), (i3, 1−3ε)〉, s2 ← 〈(i2, 1− 2ε), (i4, ε), (i5, ε)〉, where ε = 0.01. Thenthe greedy assignment would be s1 ← 〈i1, i2〉, s2 ← 〈i4, i5〉with a total score of 2 + ε. On the other hand, an optimalassignment is s1 ← 〈i1, i3〉, s2 ← 〈i2, i4〉 with a total scoreof 3− 4ε.
We, therefore, instantiate the image assignment componentas an optimization problem. We show that this optimizationproblem can be solved optimally in polynomial time andprovide an efficient algorithm as part of the proof. Thefollowing is the statement of the optimization problem:
SIGKDD Explorations Volume 13, Issue 2 Page 14

MaxRelevantImageAssignment
max∑i∈I
∑j∈S
xij · λij (3)
s.t.
xij ∈ {0, 1} ∀i ∈ I ∀j ∈ S (4)∑i∈I
xij ≤ Kj ∀j ∈ S (5)
∑j∈S
xij ≤ 1 ∀i ∈ I (6)
Here, xij is an indicator variable that takes value 1 if image iis selected for section j and 0 otherwise. Eq. 4 captures thisbinary constraint. Eq. 5 ensures that the number of imagesassigned to a section is at most Kj . Eq. 6 enforces that eachimage is assigned to at most one section in a chapter. Theoptimization objective (Eq. 3) is the total relevance score forthe chapter, defined as the sum over all sections of relevancescores of the images assigned to the section. Thus the goal ofthe optimization is to compute the binary variables xij suchthat the total relevance score for the chapter is maximized.
Theorem 5.1. MaxRelevantImageAssignment can besolved optimally in polynomial time.
Proof. The proof follows by showing an efficient reduc-tion from MaxRelevantImageAssignment to the Maxi-mum Weighted Bipartite Matching problem [40], whichadmits an efficient polynomial time solution. Given an in-stance of MaxRelevantImageAssignment, form a com-plete weighted bipartite graph G = (V,E) as follows. As-sociate a node ui with each image i ∈ I and associateKj nodes, vj1, vj2, . . . , vjKj , with each section j. Createan edge between every image node and every section nodecopy. Weight of the edge (ui, vjk) is set to λij for eachk ∈ {1, 2, . . . ,Kj}, that is, each of the Kj edges joining animage i to the section j has the same weight, equal to thecorresponding relevance score.
We observe that any feasible solution to MaxRelevantIm-ageAssignment corresponds to selecting a matching in G.Given a satisfying assignment of xij ’s, we can obtain a match-ing in G by picking one of the Kj edges corresponding to anyxij that is set to 1. Similarly, given any matching in G, thereis a corresponding feasible solution. Further the objectiveof MaxRelevantImageAssignment can be maximized byobtaining the maximum weight bipartite matching in G. Asthe Maximum Weighted Bipartite Matching problemcan be solved optimally in O(nm(n + m)) time, it followsthat MaxRelevantImageAssignment can also be solvedoptimally in O(nm(n+m)) time.
5.3 Image EnsemblingWe next describe our ensembling algorithm for combiningthe different image assignments. Since the relevance scorescomputed by the image mining algorithms will be incompa-rable in general, we combine the results after the MaxRel-evantImageAssignment optimization has been performedindependently for each algorithm. We use only the order-ing returned by these algorithms and do rank aggregationwithout considering the magnitudes of the scores.
We employ Borda’s method to merge l ranked lists corre-sponding to l different image mining algorithms. Borda’s
Algorithm 8 Ensemble
Input: Set of sections S = {1, 2, . . . ,m} in a textbookchapter; Set of images I = {1, 2, . . . , n}; Number of desiredimages Kj for each section j ∈ S; Scores assigned by ldifferent image mining algorithms for each image i ∈ I;Orderings produced after the optimization for these lalgorithms.Output: A new assignment of images to sections.
1: Let I0 := I and S0 := S. For each of l image miningalgorithms, perform MaxRelevantImageAssignmentoptimization over I and S to get an assignment of imagesfor all sections in S.
2: for section j = 1 to m do3: Merge l ranked lists (corresponding to l algorithms)
for section j using Borda’s method, and assign the topKj images from the merged list to section j. Let Ajdenote the set of assigned images.
4: Remove the assigned images from consideration forsubsequent sections, that is, Ij := Ij−1 \Aj and Sj :=Sj−1 \ {j}.
5: For each of l image mining algorithms, performMaxRelevantImageAssignment optimization overIj as the set of images and Sj as the set of sections,and thereby obtain the new assignment of images forsections j + 1 through m.
method tries to achieve a consensus ranking and satisfiescertain desirable properties such as reversal symmetry [41].It assigns a score corresponding to the positions in which animage appears within each ranked list of preferences, andthe images are sorted by their total score.
However, a consequence of performing rank aggregation foreach section independently is that the same image may ap-pear more than once in a chapter. Consider a chapter con-sisting of two sections and suppose that we want two im-ages for every section. Assume that the optimal assignments(ranked lists) corresponding to the two image mining algo-rithms are as follows. Alg1(OPT): s1 ← 〈i1, i2〉, s2 ← 〈i3, i4〉(that is, image i1 has the highest relevance score and i2 hasthe second highest score for section s1 and similarly 〈i3, i4〉in that order are the top two images for section s2), andAlg2(OPT): s1 ← 〈i3, i4〉, s2 ← 〈i1, i2〉. Then the rank ag-gregation would give: s1 ← 〈i1, i3〉, s2 ← 〈i1, i3〉.Algorithm 8 (Ensemble) avoids this problem by taking ad-vantage of the logical linear organization of sections within achapter. It considers sections in a chapter sequentially fromthe first section to the last, ensembling at a section level, andthen removing images selected for this section from the poolof available images for the remaining sections. Before mov-ing to a subsequent section, it reruns the image assignmentoptimization for the remaining sections over the remainingimages. Thus images discarded due to merging for a sectionare taken into account for consideration in subsequent sec-tions as such images may be more relevant than any of thecandidate images for a section.
Consider a chapter consisting of three sections and supposethat we want two images for every section. Assume thatthe images and their relevance scores for different sectionsfound by the two image mining algorithms are as follows.Alg1: s1 ← 〈(i1, 1), (i2, 0.9)〉, s2 ← 〈(i7, 0.7), (i8, 0.6)〉, s3 ←
SIGKDD Explorations Volume 13, Issue 2 Page 15

〈(i2, 0.5), (i3, 0.4), (i5, 0.3)〉, andAlg2: s1 ← 〈(i3, 1), (i4, 0.9)〉,s2 ← 〈(i7, 0.6), (i8, 0.4)〉, s3 ← 〈(i4, 0.5), (i1, 0.4), (i6, 0.3)〉.The optimal assignments would be: Alg1(OPT): s1 ← {i1, i2},s2 ← {i7, i8}, s3 ← {i3, i5}, andAlg2(OPT): s1 ← {i3, i4}, s2 ←{i7, i8}, s3 ← {i1, i6}. The rank aggregation for the firstsection would give: s1 ← {i1, i3}, thereby dropping i2 fromAlg1 and i4 from Alg2 respectively. We note that i2 is morerelevant than current assignments for section s3 under Alg1and similarly, i4 is more relevant than current assignmentsfor section s3 under Alg2. The benefit of rerunning the op-timization is that such dropped images can be assigned tolater sections (s3 in our example). Ensemble would resultin the final assignment: s1 ← {i1, i3}, s2 ← {i7, i8}, s3 ←{i2, i4}, which is more desirable than an assignment thatexcludes assigned images from later sections but does notrerun optimization (s3 ← {i5, i6}).
6. ILLUSTRATIVE RESULTSWe now present some illustrative results from the empiricalevaluation of the proposed techniques [4; 5; 6]. The corpusused in the study consisted of high school textbooks pub-lished by the Indian National Council of Educational Re-search and Training. It included books from grades IX–XII,covering four broad subject areas, namely, Sciences, SocialSciences, Commerce, and Mathematics. We selected thiscorpus as these book are used by millions of students everyyear and are freely available online.
6.1 Diagnosis of Deficient SectionsWhen applied to the corpus under study, our techniqueswere able to identify those sections of the books that couldbenefit from revision. The sections with high predictedscores for the need for revision often had a combination oflarge dispersion values (close to unity), lengthy sentences(up to six standard deviations to the right of the mean),and a large number of complex words.
One such section was found in Grade XII Sociology bookand titled “Variety of Methods”. We can see from the con-cept graph shown in Fig. 1(c) that this section has a numberof disparate concepts leading to large dispersion. In addi-tion, the section contains many long sentences, making thecomprehension hard, e.g.: “Interviews may be structured,that is, follow a pre-determined pattern of questions or un-structured, where only a set of topics is pre-decided, and theactual questions emerge as part of a conversation.”
Sections not needing update typically had low dispersion val-ues (up to eight standard deviations left of the mean). Theconcept graph for one such section from Grade XI Mathe-matics book is given in Fig. 1(a). They also had simplersentence structure making it easier for the reader to graspthe material well.
6.2 Augmentation with ArticlesFig. 2 reproduces the section titled “Emergence of Macroe-conomics” from Grade XII Economics books. Our approachidentified ‘Macroeconomics’,‘unemployment rate’, ‘Keynes’,‘economics’, ‘Great Depression’, ‘Goods’, and ’Demand’ asthe key concepts occurring in the section and and proposedthe link to the Wikipedia article titled “Great Depression”as the best link for augmenting the section, though there isa Wikipedia article titled “Macroeconomics”. If one readsthe section carefully, one would notice that the large part
Figure 2: A section from Grade XII Economics
of the section (starting from “However, the Great Depres-sion...” to “...33 per cent”) describes the calamitous effectof great depression. Interestingly, we found after careful ex-amination that the book had no other section where therewas even a mention of great depression. We also examinedthe corresponding Wikipedia article and found that it con-tained information that a curious student would find veryvaluable.
We also identified the following two images for augmentingthis section: (a) the famous Dorothea Lange’s 1936 paint-ing of migrant mother that depicts destitute pea pickers inCalifornia during great depression, and (b) image of JohnMaynard Keynes. Clearly, these images can further enhanceunderstanding of this section.
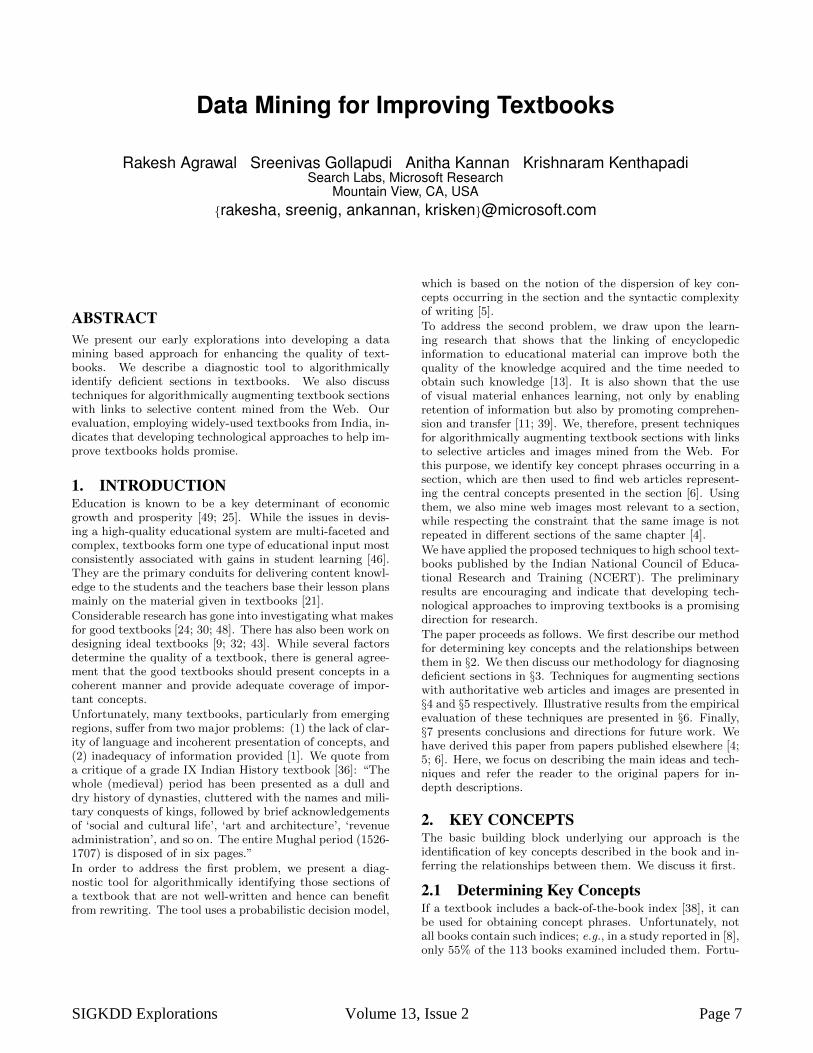
6.3 Augmentation with ImagesFig. 3 shows the top five images proposed for three differentsections from three different subjects. We can see that theimages are quite relevant. We discuss the first example inmore depth. This example shows the proposed augmenta-tions for the section on how organisms create exact copiesof themselves, appearing in the eighth chapter titled “Howdo organisms reproduce” in the grade X Science book. Thissection discusses three main points: (1) due to evolution,organisms are similar in their blueprint; (2) DNA replicatesto pass on genetic material; and (3) DNA copying during re-production should be consistent so that the organism is welladjusted to its ecosystem. We observe that the proposedimages convey related information. The image on Phylo-genetic trees captures the evolutionary relationships amongbiological species. The two images of DNA (chemical andphysical structure) are illustrative of how the DNA can beeasily replicated by breaking its double Helix structure. Thesection describes the consistency requirement of DNA copy-ing using bacteria as the example organism. The images ofRecBCD pathway in E. coli bacterium are complementaryas it plays crucial role of initiating recombinational repairof potentially lethal double strand breaks in DNA.
We also conducted a user study employing the Amazon Me-chanical Turk platform [28]. Seven judges each, coming froma population of 56 judges, judged the results produced byour implementation for a random sample of 100 textbooksections. The results demonstrate the promise of the pro-
SIGKDD Explorations Volume 13, Issue 2 Page 16
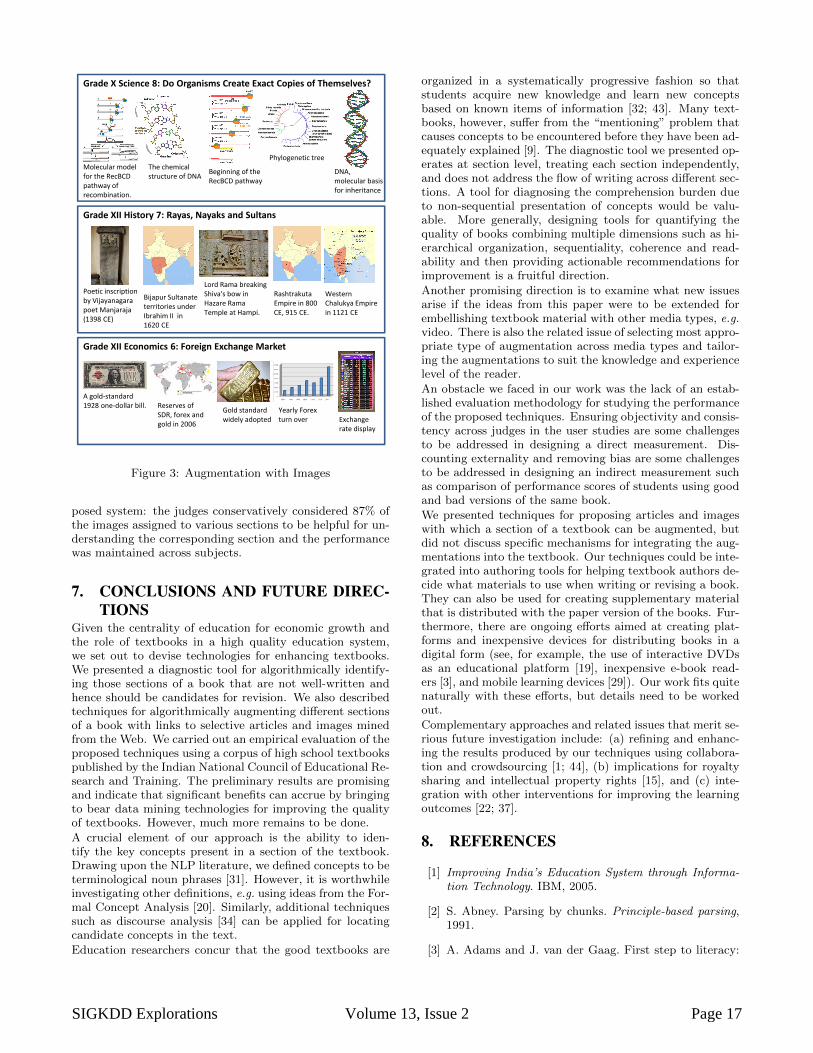
Grade XII History 7: Rayas, Nayaks and Sultans
Grade X Science 8: Do Organisms Create Exact Copies of Themselves?
Molecular model for the RecBCDpathway of recombination.
The chemical structure of DNA Beginning of the
RecBCD pathway
Phylogenetic tree
DNA, molecular basis for inheritance
Poetic inscription by Vijayanagarapoet Manjaraja(1398 CE)
Bijapur Sultanateterritories underIbrahim II in1620 CE
Lord Rama breaking Shiva's bow in Hazare Rama Temple at Hampi.
RashtrakutaEmpire in 800 CE, 915 CE.
Western Chalukya Empire in 1121 CE
Grade XII Economics 6: Foreign Exchange Market
A gold-standard 1928 one-dollar bill. Reserves of
SDR, forex and gold in 2006
Gold standard widely adopted
Yearly Forexturn over Exchange
rate display
Figure 3: Augmentation with Images
posed system: the judges conservatively considered 87% ofthe images assigned to various sections to be helpful for un-derstanding the corresponding section and the performancewas maintained across subjects.
7. CONCLUSIONS AND FUTURE DIREC-TIONS
Given the centrality of education for economic growth andthe role of textbooks in a high quality education system,we set out to devise technologies for enhancing textbooks.We presented a diagnostic tool for algorithmically identify-ing those sections of a book that are not well-written andhence should be candidates for revision. We also describedtechniques for algorithmically augmenting different sectionsof a book with links to selective articles and images minedfrom the Web. We carried out an empirical evaluation of theproposed techniques using a corpus of high school textbookspublished by the Indian National Council of Educational Re-search and Training. The preliminary results are promisingand indicate that significant benefits can accrue by bringingto bear data mining technologies for improving the qualityof textbooks. However, much more remains to be done.
A crucial element of our approach is the ability to iden-tify the key concepts present in a section of the textbook.Drawing upon the NLP literature, we defined concepts to beterminological noun phrases [31]. However, it is worthwhileinvestigating other definitions, e.g. using ideas from the For-mal Concept Analysis [20]. Similarly, additional techniquessuch as discourse analysis [34] can be applied for locatingcandidate concepts in the text.
Education researchers concur that the good textbooks are
organized in a systematically progressive fashion so thatstudents acquire new knowledge and learn new conceptsbased on known items of information [32; 43]. Many text-books, however, suffer from the “mentioning” problem thatcauses concepts to be encountered before they have been ad-equately explained [9]. The diagnostic tool we presented op-erates at section level, treating each section independently,and does not address the flow of writing across different sec-tions. A tool for diagnosing the comprehension burden dueto non-sequential presentation of concepts would be valu-able. More generally, designing tools for quantifying thequality of books combining multiple dimensions such as hi-erarchical organization, sequentiality, coherence and read-ability and then providing actionable recommendations forimprovement is a fruitful direction.
Another promising direction is to examine what new issuesarise if the ideas from this paper were to be extended forembellishing textbook material with other media types, e.g.video. There is also the related issue of selecting most appro-priate type of augmentation across media types and tailor-ing the augmentations to suit the knowledge and experiencelevel of the reader.
An obstacle we faced in our work was the lack of an estab-lished evaluation methodology for studying the performanceof the proposed techniques. Ensuring objectivity and consis-tency across judges in the user studies are some challengesto be addressed in designing a direct measurement. Dis-counting externality and removing bias are some challengesto be addressed in designing an indirect measurement suchas comparison of performance scores of students using goodand bad versions of the same book.
We presented techniques for proposing articles and imageswith which a section of a textbook can be augmented, butdid not discuss specific mechanisms for integrating the aug-mentations into the textbook. Our techniques could be inte-grated into authoring tools for helping textbook authors de-cide what materials to use when writing or revising a book.They can also be used for creating supplementary materialthat is distributed with the paper version of the books. Fur-thermore, there are ongoing efforts aimed at creating plat-forms and inexpensive devices for distributing books in adigital form (see, for example, the use of interactive DVDsas an educational platform [19], inexpensive e-book read-ers [3], and mobile learning devices [29]). Our work fits quitenaturally with these efforts, but details need to be workedout.
Complementary approaches and related issues that merit se-rious future investigation include: (a) refining and enhanc-ing the results produced by our techniques using collabora-tion and crowdsourcing [1; 44], (b) implications for royaltysharing and intellectual property rights [15], and (c) inte-gration with other interventions for improving the learningoutcomes [22; 37].
8. REFERENCES
[1] Improving India’s Education System through Informa-tion Technology. IBM, 2005.
[2] S. Abney. Parsing by chunks. Principle-based parsing,1991.
[3] A. Adams and J. van der Gaag. First step to literacy:
SIGKDD Explorations Volume 13, Issue 2 Page 17

Getting books in the hands of children. The BrookingsInstitution, January 2011.
[4] R. Agrawal, S. Gollapudi, A. Kannan, and K. Kentha-padi. Enriching textbooks with images. In CIKM, 2011.
[5] R. Agrawal, S. Gollapudi, A. Kannan, and K. Kentha-padi. Identifying enrichment candidates in textbooks.In WWW, 2011.
[6] R. Agrawal, S. Gollapudi, K. Kenthapadi, N. Srivas-tava, and R. Velu. Enriching textbooks through datamining. In ACM DEV, 2010.
[7] J. Anderson and J. Perez-Carballo. The nature of in-dexing: how humans and machines analyze messagesand texts for retrieval. Part II: Machine indexing, andthe allocation of human versus machine effort. Infor-mation Processing & Management, 37(2), 2001.
[8] K. Bakewell. Research in indexing: more needed? In-dexer, 18(3), 1993.
[9] M. Chambliss and R. Calfee. Textbooks for Learning:Nurturing Children’s Minds. Wiley-Blackwell, 1998.
[10] M. Charikar. Similarity estimation techniques fromrounding algorithms. In STOC, 2002.
[11] J. Coiro, M. Knobel, C. Lankshear, and D. Leu, edi-tors. Handbook of research on new literacies. LawrenceErlbaum, 2008.
[12] E. Coke and E. Rothkopf. Note on a simple algorithmfor a computer-produced reading ease score. Journal ofApplied Psychology, 54(3), 1970.
[13] A. Csomai and R. Mihalcea. Linking educational mate-rials to encyclopedic knowledge. In AIED, 2007.
[14] E. Dale and J. Chall. A formula for predicting readabil-ity. Educational research bulletin, 27(1), 1948.
[15] L. Downes. The laws of disruption: Harnessing the newforces that govern life and business in the digital age.Basic Books, 2009.
[16] W. DuBay. The principles of readability. Impact Infor-mation, 2004.
[17] I. Fang. By computer: Flesch’s reading ease score anda syllable counter. Behavioral Science, 13(3), 1968.
[18] C. Fellbaum. WordNet: An electronic lexical database.MIT Press, 1998.
[19] K. Gaikwad, G. Paruthi, and W. Thies. InteractiveDVDs as a platform for education. In ICTD, 2010.
[20] B. Ganter, G. Stumme, and R. Wille. Formal conceptanalysis: Foundations and applications. Springer, 2005.
[21] J. Gillies and J. Quijada. Opportunity to learn: A highimpact strategy for improving educational outcomes indeveloping countries. USAID Educational Quality Im-provement Program (EQUIP2), 2008.
[22] P. Glewwe, M. Kremer, and S. Moulin. Many childrenleft behind? Textbooks and test scores in Kenya. Amer-ican Economic Journal: Applied Economics, 1(1), 2009.
[23] S. Gollapudi and R. Panigrahy. Exploiting asymmetryin hierarchical topic extraction. In CIKM, 2006.
[24] W. Gray and B. Leary. What makes a book readable.University of Chicago Press, 1935.
[25] E. A. Hanushek and L. Woessmann. The role of ed-ucation quality for economic growth. Policy ResearchDepartment Working Paper 4122, World Bank, 2007.
[26] M. Hu, E. Lim, A. Sun, H. Lauw, and B. Vuong. Mea-suring article quality in Wikipedia: models and evalu-ation. In CIKM, 2007.
[27] S. Huston and W. B. Croft. Evaluating verbose queryprocessing techniques. In SIGIR, 2010.
[28] P. G. Ipeirotis. Analyzing the Amazon mechanical turkmarketplace. ACM Crossroads, 17(2), 2010.
[29] A. Jawa, S. Datta, S. Nanda, V. Garg, V. Varma,S. Chande, and M. K. P. Venkata. SMEO: A platformfor smart classrooms with enhanced information ac-cess and operations automation. In International Con-ference on Next Generation Wired/Wireless AdvancedNetworking, 2010.
[30] E. B. Johnsen. Textbooks in the Kaleidoscope: A Crit-ical Survey of Literature and Research on EducationalTexts. Scandinavian University Press, 1992.
[31] J. S. Justeson and S. M. Katz. Technical terminology:Some linguistic properties and an algorithm for inden-tification in text. Natural Language Engineering, 1(1),1995.
[32] D. Kieras and C. Dechert. Rules for comprehensibletechnical prose: A survey of the psycholinguistic lit-erature. Technical Report TR-85/ONR-21, Universityof Michigan, 1985.
[33] B. Lent, R. Agrawal, and R. Srikant. Discovering trendsin text databases. In KDD, 1997.
[34] D. Marcu. Discourse trees are good indicators of impor-tance in text. In I. Mani and M. Maybury, editors, Ad-vances in Automatic Text Summarization. MIT Press,1999.
[35] W. McCall and L. Crabbs. Standard test lessons inreading. Columbia University Teachers College Press,1926.
[36] P. Menon. Mis-oriented textbooks. Frontline, August2002.
[37] J. Moulton. How do teachers use textbooks and otherprint materials: A review of the literature. The Improv-ing Educational Quality Project, 1994.
[38] N. Mulvany. Indexing books. University of ChicagoPress, 2005.
[39] S. Panjwani, L. Micallef, K. Fenech, and K. Toyama.Effects of integrating digital visual materials with text-book scans in the classroom. International Journalof Education and Development using Information andCommunication Technology, 5(3), 2009.
SIGKDD Explorations Volume 13, Issue 2 Page 18

[40] C. Papadimitriou and K. Steiglitz. Combinatorial opti-mization: Algorithms and complexity. Dover, 1998.
[41] D. Saari. Decisions and elections: Explaining the unex-pected. Cambridge University Press, 2001.
[42] S. Sarawagi. Information extraction. Foundations andTrends in Databases, 1(3):261–377, 2008.
[43] R. Seguin. The elaboration of school textbooks. Tech-nical report, ED-90/WS-24, UNESCO, 1989.
[44] B. W. Speck, T. R. Johnson, C. P. Dice, and L. B.Heaton. Collaborative writing: An annotated bibliogra-phy. Greenwood Press, 1999.
[45] K. Toutanova, D. Klein, C. D. Manning, and Y. Singer.Feature-rich part-of-speech tagging with a cyclic depen-dency network. In NAACL-HLT, 2003.
[46] A. Verspoor and K. B. Wu. Textbooks and educationaldevelopment. Technical report, World Bank, 1990.
[47] K. Wang, C. Thrasher, E. Viegas, X. Li, and P. Hsu.An overview of Microsoft Web N-gram corpus and ap-plications. In NAACL-HLT, 2010.
[48] A. Woodward, D. L. Elliott, and C. Nagel. Textbooksin School and Society: An Annotated Bibliography andGuide to Research. Garland, 1988.
[49] World-Bank. Knowledge for Development: World De-velopment Report: 1998/99. Oxford University Press,1999.
[50] S. E. Wright and G. Budin. Handbook of TerminologyManagement. John Benjamins, 2001.
[51] X. Xue, S. Huston, and W. B. Croft. Improving verbosequeries using subset distribution. In CIKM, 2010.
SIGKDD Explorations Volume 13, Issue 2 Page 19