data mining-chapter 1-hann
TRANSCRIPT

8/6/2019 Data Mining-chapter 1-Hann
http://slidepdf.com/reader/full/data-mining-chapter-1-hann 1/32
1
Data Mining
Lecture 1: Introduction

8/6/2019 Data Mining-chapter 1-Hann
http://slidepdf.com/reader/full/data-mining-chapter-1-hann 2/32
2
What is Data Mining?
Non- trivial extraction of implicit, previouslyunknown and potentially useful informationfrom data
Knowledge Discovery in Databases (KDD)

8/6/2019 Data Mining-chapter 1-Hann
http://slidepdf.com/reader/full/data-mining-chapter-1-hann 3/32
3
Knowledge Discovery in the old days
From: http://csep10.phys.utk.edu/astr161/lect/history/newtongrav.html
1. Observe phenomena
2. Formulate theory3. Validate theory via
experimentation

8/6/2019 Data Mining-chapter 1-Hann
http://slidepdf.com/reader/full/data-mining-chapter-1-hann 4/32
4
Nowadays
1. Lots of data
2. Lack of theory
3. Data mining can helpto generate new
hypothesis or help
analysts to make
sense out of the data
8/6/2019 Data Mining-chapter 1-Hann
http://slidepdf.com/reader/full/data-mining-chapter-1-hann 5/32
5
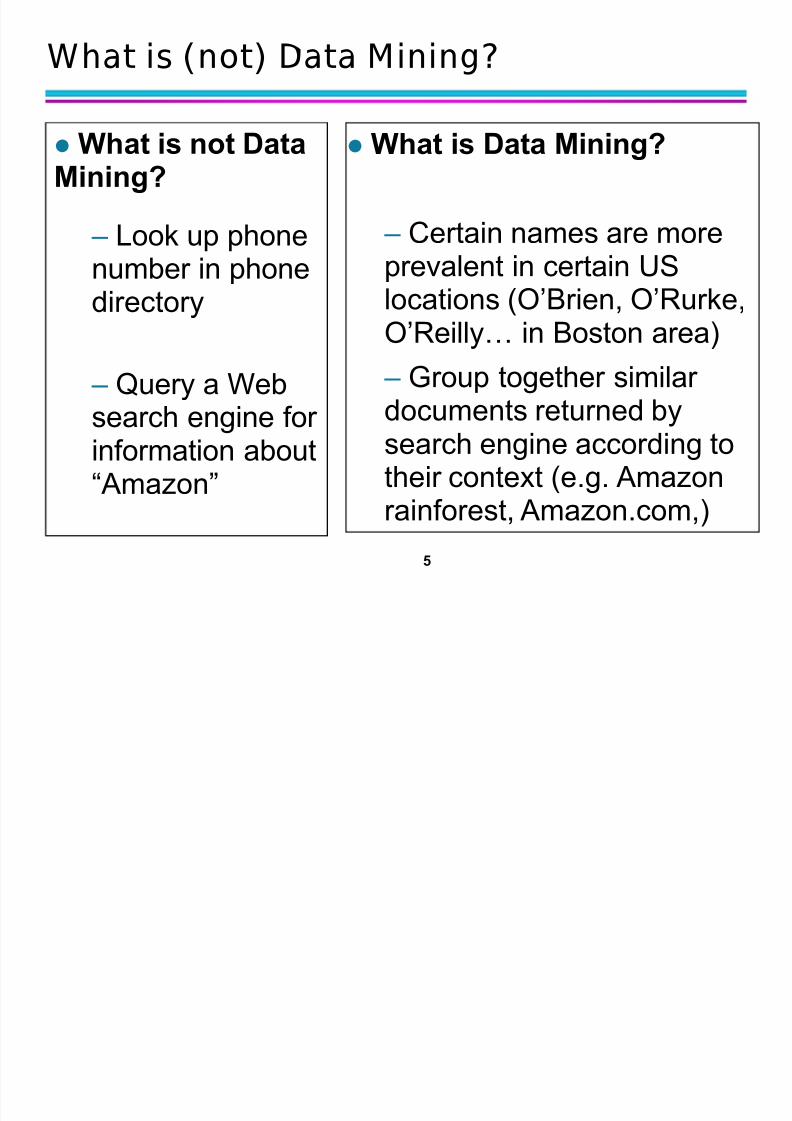
What is (not) Data Mining?
What is Data Mining?
± Certain names are more
prevalent in certain USlocations (O¶Brien, O¶Rurke,O¶Reilly« in Boston area)
± Group together similar
documents returned bysearch engine according totheir context (e.g. Amazonrainforest, Amazon.com,)
What is not DataMining?
± Look up phone
number in phonedirectory
± Query a Web
search engine for information about³Amazon´

8/6/2019 Data Mining-chapter 1-Hann
http://slidepdf.com/reader/full/data-mining-chapter-1-hann 6/32
6
Lots of data is being collectedand warehoused
± Walmart: ~20 million txn/day
± Google: > 3 billion Web pages
± Yahoo: ~10 GB Web data/hr
Computers have become
cheaper and more powerful
Competitive Pressure is Strong
± Provide better, customized services for an edge
(e.g. in Customer Relationship Management)
Why Mine Data? Commercial Viewpoint

8/6/2019 Data Mining-chapter 1-Hann
http://slidepdf.com/reader/full/data-mining-chapter-1-hann 7/32
Why Mine Data? Scientific Viewpoint
D
ata collected and stored atenormous speeds (GB/hour)
± remote sensors on a satellite
± telescopes scanning the skies
± microarrays generating gene
expression data
± scientific simulations
generating terabytes of data Traditional techniques infeasible for raw data
Need techniques that can automatically
analyze the data and form new hypotheses
for further evaluation by scientists

8/6/2019 Data Mining-chapter 1-Hann
http://slidepdf.com/reader/full/data-mining-chapter-1-hann 8/32
8
Mining Large Data Sets - Motivation
There is often information ³hidden´ in the data that isnot readily evident
Human analysts may take weeks to discover useful information
Much of the data is never analyzed at all
5
5
5
5
4
995 996 997 998 999
The Data Gap
Total new disk (TB) since 1995
Number of
analysts
From: R. Grossman, C. Kamath, V. Kumar, ³Data Mining for Scientific and Engineering Applications´

8/6/2019 Data Mining-chapter 1-Hann
http://slidepdf.com/reader/full/data-mining-chapter-1-hann 9/32
9
Origins of Data Mining
Draws ideas from machine learning/AI, patternrecognition, statistics, and database systems
Traditional Techniques
may be unsuitable due to
± Enormity of data
± High dimensionality
of data
± Heterogeneous,distributed nature
of data
Machine Learning/ AI/ Pattern
Recognition
Statistics
Data Mining
Database
systems

8/6/2019 Data Mining-chapter 1-Hann
http://slidepdf.com/reader/full/data-mining-chapter-1-hann 10/32
10
Data Mining Tasks
Predictive Methods ± Use some variables to predict unknown or
values of other variables.
Descriptive Methods
± Find human-interpretable patterns that
describe the data.
From [Fayyad, et.al.]Advances in K nowledge Discovery and Data Mining, 1996

8/6/2019 Data Mining-chapter 1-Hann
http://slidepdf.com/reader/full/data-mining-chapter-1-hann 11/32
11
Data Mining Tasks...
Classification [Predictive]
Clustering [Descriptive]
Association Rule Discovery [Descriptive]
Sequential PatternD
iscovery [D
escriptive]
Regression [Predictive]
Anomaly Detection [Predictive]

8/6/2019 Data Mining-chapter 1-Hann
http://slidepdf.com/reader/full/data-mining-chapter-1-hann 12/32
12
Classification: Definition
Given a collection of records (training set ) ± Each record contains a set of attribut es, one of the
attributes is the cl ass.
Task: Find a model for class attribute as a
function of the values of other attributes.
Goal: previously unseen records should be
assigned a class as accurately as possible.
± A t est set is used to determine the accuracy of the
model. Usually, the given data set is divided into
training and test sets, with training set used to build the
model and test set used to validate it.

8/6/2019 Data Mining-chapter 1-Hann
http://slidepdf.com/reader/full/data-mining-chapter-1-hann 13/32
13
Classification Example
T id Ref rit lSt t
T le
Income Cheat
1 Yes i le 125K No
2 No Marri
ed 100K No
3 No Si le 70K No
4 Yes Married 120K No
5 No i orced 95K Yes
6 No Married 60K No
7 Yes Di orced 220K No
8 No Si le 85K Yes
9 No Married 75K No
10 No Si le 90K Yes10
Ref nd MaritalStat s
Taxable
Income Cheat
No Si le 75K
Yes
Marri
ed 50K
No Married 150K
Yes Di orced 90K
No Si le 40K
No Married 80K10
Test
Set
Tr aining
SetModel
Lear n
Classifier

8/6/2019 Data Mining-chapter 1-Hann
http://slidepdf.com/reader/full/data-mining-chapter-1-hann 14/32

8/6/2019 Data Mining-chapter 1-Hann
http://slidepdf.com/reader/full/data-mining-chapter-1-hann 15/32
15
Classification: Application 2
Fraud Detection
± Goal: Predict fraudulent cases in credit cardtransactions.
± Approach:
Use credit card transactions and the information on itsaccount-holder as attributes.
± When does a customer buy, what does he buy, how often he pays on time, etc
Label past transactions as fraud or fair transactions. Thisforms the class attribute.
Learn a model for the class of the transactions.
Use this model to detect fraud by observing credit cardtransactions on an account.
8/6/2019 Data Mining-chapter 1-Hann
http://slidepdf.com/reader/full/data-mining-chapter-1-hann 16/32

8/6/2019 Data Mining-chapter 1-Hann
http://slidepdf.com/reader/full/data-mining-chapter-1-hann 17/32
17
Classification: Application 4
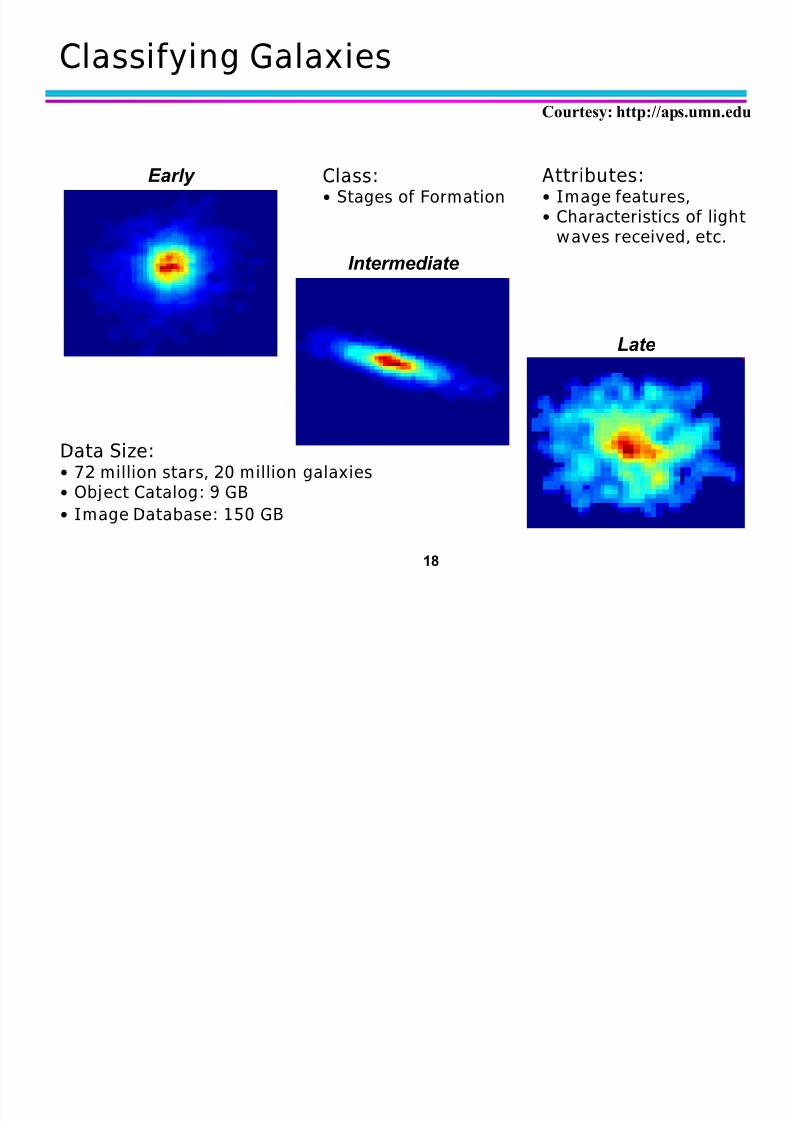
Sky Survey Cataloging ± Goal: To predict class (star or galaxy) of sky objects,
especially visually faint ones, based on the telescopic
survey images (from Palomar Observatory).
± 3000 images with 23,040 x 23,040 pixels per image.
± Approach:
Segment the image.
Measure image attributes (features) - 0 of them per object.
Model the class based on these features.
Success Story: Could find 1 new high red-shift quasars,
some of the farthest objects that are difficult to find!
From [Fayyad, et.al.]Advances in K nowledge Discovery and Data Mining, 1996
8/6/2019 Data Mining-chapter 1-Hann
http://slidepdf.com/reader/full/data-mining-chapter-1-hann 18/32

8/6/2019 Data Mining-chapter 1-Hann
http://slidepdf.com/reader/full/data-mining-chapter-1-hann 19/32
19
Clustering Definition
Given a set of data points, each having a set of attributes, and a similarity measure among them,find clusters such that
± Data points in one cluster are more similar to
one another. ± Data points in separate clusters are less
similar to one another.
Similarity Measures:
± Euclidean Distance if attributes arecontinuous.
± Other Problem-specific Measures.

8/6/2019 Data Mining-chapter 1-Hann
http://slidepdf.com/reader/full/data-mining-chapter-1-hann 20/32
20
Illustrating Clustering
Euclidean Distance Based Clustering in 3-D space.
Intracluster distances
are minimized
Intracluster distances
are minimized
Intercluster distances
are maximized
Intercluster distances
are maximized

8/6/2019 Data Mining-chapter 1-Hann
http://slidepdf.com/reader/full/data-mining-chapter-1-hann 21/32
21
Clustering: Application 1
Market Segmentation: ± Goal: subdivide a market into distinct subsets of
customers where any subset may conceivably beselected as a market target to be reached with adistinct marketing mix.
± Approach: Collect different attributes of customers based on their
geographical and lifestyle related information.
Find clusters of similar customers.
Measure the clustering quality by observing buying patterns
of customers in same cluster vs. those from differentclusters.

8/6/2019 Data Mining-chapter 1-Hann
http://slidepdf.com/reader/full/data-mining-chapter-1-hann 22/32

8/6/2019 Data Mining-chapter 1-Hann
http://slidepdf.com/reader/full/data-mining-chapter-1-hann 23/32
23
Illustrating Document Clustering
Clustering Points: 320 Articles of Los Angeles Times. Similarity Measure: How many words are common in
these documents (after some word filtering).
Category Total
Articles
Correctly
Placed Financial 555 364
Foreign 341 260
National 273 36
Metro 943 746
Sports 738 573
Entertainment 354 278

8/6/2019 Data Mining-chapter 1-Hann
http://slidepdf.com/reader/full/data-mining-chapter-1-hann 24/32
24
Clustering of S&P 500 Stock Data
Discovered Clusters Industry Group
1 Applied-Matl-DOWN,Bay-Network-Down,3-COM-DOWN,
Cabletron-Sys-DOWN,C SCO-DOWN,HP-DOWN,DSC-Comm-DOWN, NTEL-DOWN,LS -Logic-DOWN,
Micron-Tech-DOWN,Texas- nst-Down,Tellabs- nc-Down, Natl-Semiconduct-DOWN,Oracl-DOWN,SG -DOWN,
Sun-DOWN
Technology1-DOWN
2 Apple-Comp-DOWN,Autodesk-DOWN,DEC-DOWN,
ADV-Micro-Device-DOWN,Andrew-Corp-DOWN,Computer-Assoc-DOWN,Circuit-City-DOWN,
Compaq-DOWN, EMC-Corp-DOWN, Gen- nst-DOWN,Motorola-DOWN,Microsoft-DOWN,Scientific-Atl-DOWN
Technology2-DOWN
3 Fannie-Mae-DOWN,Fed-Home-Loan-DOWN,MBNA-Corp-DOWN,Morgan-Stanley-DOWN Financial-DOWN
4 Baker-Hughes-UP,Dresser- nds-UP,Halliburton-HLD-UP,
Louisiana-Land-UP,Phillips-Petro-UP,Unocal-UP,Schlumberger-UP
Oil-UP
Observe Stock Movements every day. Clustering points: Stock-{UP/DOWN} Similarity Measure: Two points are more similar if the events
described by them frequently happen together on the same day. We used association rules to quantify a similarity measure.

8/6/2019 Data Mining-chapter 1-Hann
http://slidepdf.com/reader/full/data-mining-chapter-1-hann 25/32
25
Association Rule Discovery: Definition
Given a set of records each of which contain somenumber of items from a given collection;
± Produce dependency rules which will predict
occurrence of an item based on occurrences of other
items.
TID Items
1 Brea , oke, Milk
2 Beer, Brea
3 Beer, oke, Dia er, Milk
4B
eer,B
rea , Dia er, Milk 5 oke, Dia er, Milk
R ules Discovered:
{Milk} --> {Coke}{Diaper, Milk} --> {Beer}
R ules Discovered:
{Milk} --> {Coke}{Diaper, Milk} --> {Beer}

8/6/2019 Data Mining-chapter 1-Hann
http://slidepdf.com/reader/full/data-mining-chapter-1-hann 26/32
26
Association Rule Discovery: Application 1
Marketing and Sales Promotion:
± Let the rule discovered be
{Bagels, « } --> {P otat o Chips }
± Potato Chips as consequent => Can be used to
determine what should be done to boost its sales. ± Bagels in the antecedent => Can be used to see
which products would be affected if the storediscontinues selling bagels.
± Bagels in antecedent and Potato chips in consequent=> Can be used to see what products should be soldwith Bagels to promote sale of Potato chips!

8/6/2019 Data Mining-chapter 1-Hann
http://slidepdf.com/reader/full/data-mining-chapter-1-hann 27/32
27
Association Rule Discovery: Application 2
Supermarket shelf management. ± Goal: To identify items that are bought
together by sufficiently many customers.
± Approach: Process the point-of-sale data
collected with barcode scanners to find
dependencies among items.
± A classic rule --
If a customer buys diaper and milk, then he is verylikely to buy beer.
So, don¶t be surprised if you find six-packs stacked
next to diapers!

8/6/2019 Data Mining-chapter 1-Hann
http://slidepdf.com/reader/full/data-mining-chapter-1-hann 28/32
28
Association Rule Discovery: Application 3
Inventory Management: ± Goal: A consumer appliance repair company wants to
anticipate the nature of repairs on its consumer
products and keep the service vehicles equipped with
right parts to reduce on number of visits to consumer
households.
± Approach: Process the data on tools and parts
required in previous repairs at different consumer
locations and discover the co-occurrence patterns.

8/6/2019 Data Mining-chapter 1-Hann
http://slidepdf.com/reader/full/data-mining-chapter-1-hann 29/32
29
Sequential Pattern Discovery: Definition
Given is a set of obj ec t s, with each object associated with its own ti mel ine of event s, find rules that predict strong sequential dependencies amongdifferent events.
Rules are formed by first disovering patterns. Event occurrences in thepatterns are governed by timing constraints.
(A B) (C) (D E)
<= ms
<= xg >ng <= ws
(A B) (C) (D E)

8/6/2019 Data Mining-chapter 1-Hann
http://slidepdf.com/reader/full/data-mining-chapter-1-hann 30/32
30
Sequential Pattern Discovery: Examples
In telecommunications alarm logs, ± (Inverter_Problem Excessive_Line_ Current)
(Rectifier_Alarm) --> (Fire_Alarm)
In point-of-sale transaction sequences,
± Computer Bookstore:
(Intro_To_Visual_ C) (C++ _Primer) -->
(Perl_for_dummies,Tcl_Tk)
± Athletic Apparel Store:
(Shoes) (Racket, Racketball) --> (Sports_Jacket)

8/6/2019 Data Mining-chapter 1-Hann
http://slidepdf.com/reader/full/data-mining-chapter-1-hann 31/32
31
Regression
Predict a value of a given continuous valued variablebased on the values of other variables, assuming a
linear or nonlinear model of dependency.
Greatly studied in statistics, neural network fields.
Examples: ± Predicting sales amounts of new product based on
advertising expenditure.
± Predicting wind velocities as a function of
temperature, humidity, air pressure, etc. ± Time series prediction of stock market indices.

8/6/2019 Data Mining-chapter 1-Hann
http://slidepdf.com/reader/full/data-mining-chapter-1-hann 32/32
32
Deviation/Anomaly Detection
Detect significant deviations from normal behavior
Applications:
± Credit Card Fraud Detection
± Network Intrusion
Detection
Typical network traffic at University level may reach over 100 million connections per day