data mining – algorithms: oner chapter 4, section 4.1
TRANSCRIPT

Data Mining – Algorithms: OneR
Chapter 4, Section 4.1

Simplicity First
• Simple Algorithms sometimes work surprisingly well
• It is worth trying simple approaches first• Different approaches may work better for
different data• There is more than one simple approach • First to be examined: OneR (or 1R) – learns
one rule for the dataset – actually a bit of a misnomer – one level decision tree

OneR – Holte (1993)• Simple, cheap method• Often performs surprisingly well• Many real datasets may not have complicated things
going on• Idea:
– Make rules that test a single attribute and branch accordingly (each branch corresponds to a different value for that attribute)
– Classification for a given branch is the “majority” class for that branch in the training data
– Evaluate use of each attribute via “error rate” on training data– Choose the best attribute
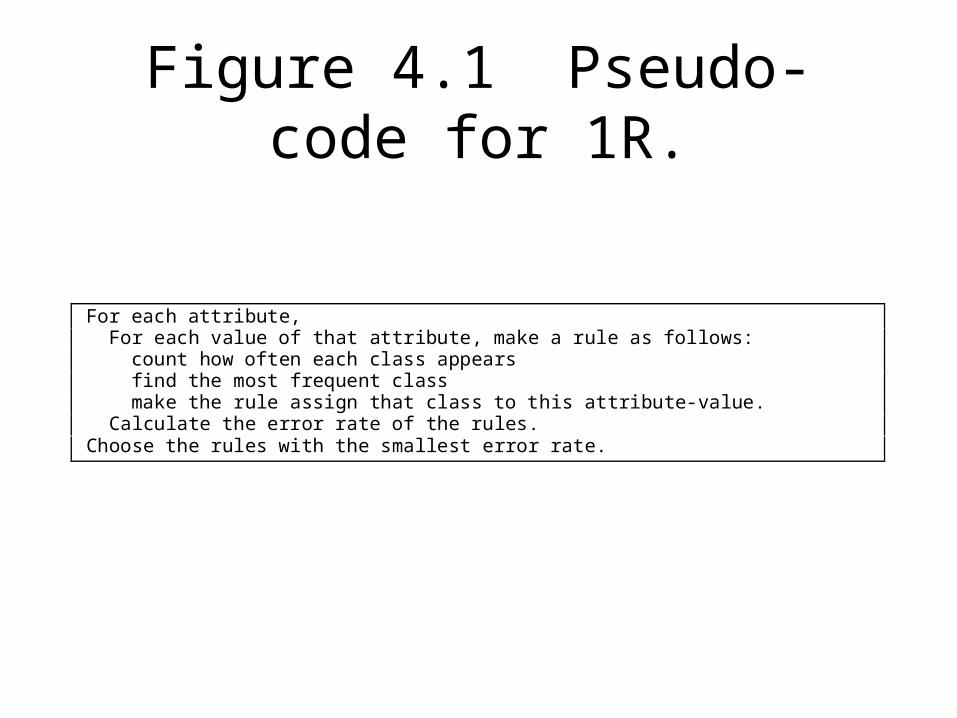
Figure 4.1 Pseudo-code for 1R.
For each attribute, For each value of that attribute, make a rule as follows: count how often each class appears find the most frequent class make the rule assign that class to this attribute-value. Calculate the error rate of the rules.Choose the rules with the smallest error rate.
At least in the simplest version, “missing” is treated as a separate value

Example: My Weather (Nominal)Outlook Temp Humid Windy Play?sunny hot high FALSE nosunny hot high TRUE yesovercast hot high FALSE norainy mild high FALSE norainy cool normal FALSE norainy cool normal TRUE noovercast cool normal TRUE yessunny mild high FALSE yessunny cool normal FALSE yesrainy mild normal FALSE nosunny mild normal TRUE yesovercast mild high TRUE yesovercast hot normal FALSE norainy mild high TRUE no

Let’s take this a little more realistic than book does
• Divide into training and test data
• Let’s save the last record as a test

For each attribute – start with Outlook
• Make a rule for each value– Sunny yes 1/5 errors– Overcast yes* 2/4 errors– Rainy no 0/4 errors– Total errors = 3/13
• Move on to next attribute – temperature– Hot no 1/4 errors– Mild yes 2/5 errors– Cool no* 2/4 errors– Total errors = 5/13
* - means tie – arbitrarily broken (maybe random)

Continue with Humidity• Make a rule for each value
– High yes* 3/6 errors– Normal no 3/7 errors– Total errors = 6/13
• Move on to next attribute – windy– False no 2/8 errors– True yes 1/5 errors– Total errors = 3/13
•- means tie – arbitrarily broken (maybe random)
• First and last attributes tie – one would have to be arbitrarily chosen
• On the test record, the first would end up being correct, the last wouldn’t

Again being more realistic than the book,
• this will be cross validated
• Normally 10-fold is used, but with 14 instances that is a little awkward –– 6 of the tests would be on 1 instance– 4 of the tests will be on 2 instances
• I’m going to do 14-fold instead – having one test instance for each test
• Next test, save 13th instance out as test data

For each attribute – start with Outlook
• Make a rule for each value– Sunny yes 1/5 errors– Overcast yes 1/3 errors– Rainy no 0/5 errors– Total errors = 2/13
• Move on to next attribute – temperature– Hot no 1/3 errors– Mild yes* 3/6 errors– Cool no* 2/4 errors– Total errors = 6/13
* - means tie – arbitrarily broken (maybe random)

Continue with Humidity• Make a rule for each value
– High no 3/7 errors– Normal yes* 3/6 errors– Total errors = 6/13
• Move on to next attribute – windy– False no 2/7 errors– True yes 2/6 errors– Total errors = 4/13
•- means tie – arbitrarily broken (maybe random)
• First attribute wins
•On the test record, this makes an incorrect prediction

In a 14-fold cross validation, this would continue 12 more times
• Let’s run WEKA on this …

WEKA results – first look near the bottom
=== Stratified cross-validation ===
=== Summary ===
Correctly Classified Instances 9 64.2857 %
Incorrectly Classified Instances 5 35.7143 %
============================================• On the cross validation – it got 9 out of 14 tests correct (I don’t know which way it went on arbitrary decisions so we may not re-create exactly if we walk all of the way through

More Detailed Results=== Confusion Matrix ===
a b <-- classified as
4 2 | a = yes
3 5 | b = no
====================================•Here we see –the program 7 times predicted play=yes, on 4 of those it was correct
•The program 7 times predicted play = no, on 5 of those it was correct
•There were 6 instances whose actual value was play=yes, the program correctly predicted that on 4 of them
•There were 8 instances whose actual value was play=no, the program correctly predicted that on 5 of them

Part of our purpose is to have a take-home message for humans
• Not 14 take home messages!
• So instead of reporting each of the things learned on each of the 14 training sets …
• … The program runs again on all of the data and builds a pattern for that – a take home message
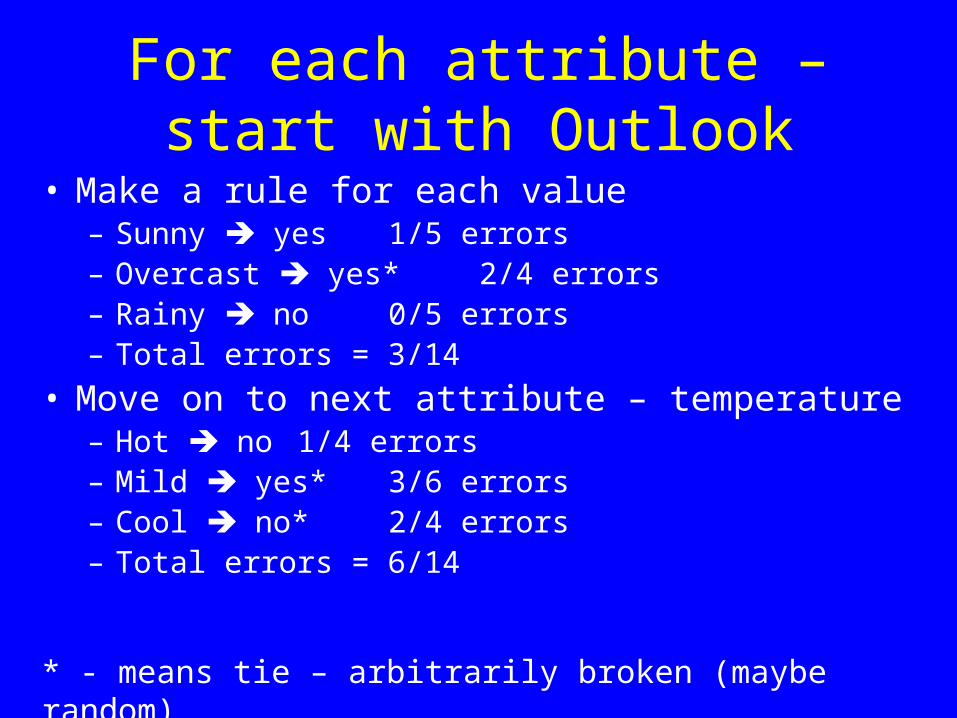
For each attribute – start with Outlook
• Make a rule for each value– Sunny yes 1/5 errors– Overcast yes* 2/4 errors– Rainy no 0/5 errors– Total errors = 3/14
• Move on to next attribute – temperature– Hot no 1/4 errors– Mild yes* 3/6 errors– Cool no* 2/4 errors– Total errors = 6/14
* - means tie – arbitrarily broken (maybe random)

Continue with Humidity• Make a rule for each value
– High no 3/7 errors– Normal no 3/7 errors– Total errors = 6/14
• Move on to next attribute – windy– False no 2/8 errors– True yes 2/6 errors– Total errors = 4/14
•- means tie – arbitrarily broken (maybe random)
• First attribute wins - see WEKA results on next slide

WEKA - Take-Home=== Classifier model (full training set) ===outlook:
sunny -> yesovercast -> yesrainy -> no
(11/14 instances correct)
•This very simple classifier rule-set could be the take home message from running this algorithm on this data – if you are satisfied with the results!
•This 11/14 correct is NOT a good indicator of quality – it is looking at % correct on TRAINING DATA
•The cross validation results previously shown (9/14) is a much more fair judgment because it is on TEST DATA

Let’s Try WEKA OneR on njcrimenominal
• Try 10-fold
unemploy:
hi -> bad
med -> ok
low -> ok
(27/32 instances correct)
=== Confusion Matrix ===
a b <-- classified as
1 6 | a = bad
3 22 | b = ok

Numeric Attributes• For OneR, numeric attributes are “discretized” – the range
of values is divided into a set of intervals• (Too) simple method:
– Sort– Put breakpoint wherever class changes (this is “supervised”
discetization)– See my weather data …
Temp-erature
64 65 68 69 70 71 72 72 75 75 80 81 83 85
Play? Y N N Y N N Y Y N Y Y N N N
•With OneR, there would only be one error on the training data … but ..

This is “overfitting”• What makes 64 a different group than 65?
• Using this technique, ideal division would be with a numeric primary key – every attribute value could get its own group and error on training data would be 0 (but unlikely to be valuable for future prediction)
• Improvement via a Heuristic – each group must have at least N members of majority class (and go further if keep having majority class)
• In book, example N = 3.
• In WEKA, default N = 6.

With N = 3 on My Weather temperature
• Hit 3rd No with 70, then continue and include 71• Hit 3rd Yes with 75, then continue and include 80• We’re actually just lucky here that the last group
reaches 3 in a majority class. If one had been No, that still would have been the last group – no choice
Temp-erature
64 65 68 69 70 71 72 72 75 75 80 81 83 85
Play? Y N N Y N N Y Y N Y Y N N N
•3 errors on this training data with this discretized attribute, but more likely to be useful for future predictions

With N = 3 on My Weather humidity
• In Class Exercise – What groups will we have?
Humidity
65 70 70 70 75 80 80 85 86 90 90 91 95 96
Play? Y N Y Y N N N N N Y Y N Y N

Let’s run WEKA
• My Weather Data
• First with default options
• Next with 3 (double click option area – WEKA option B)
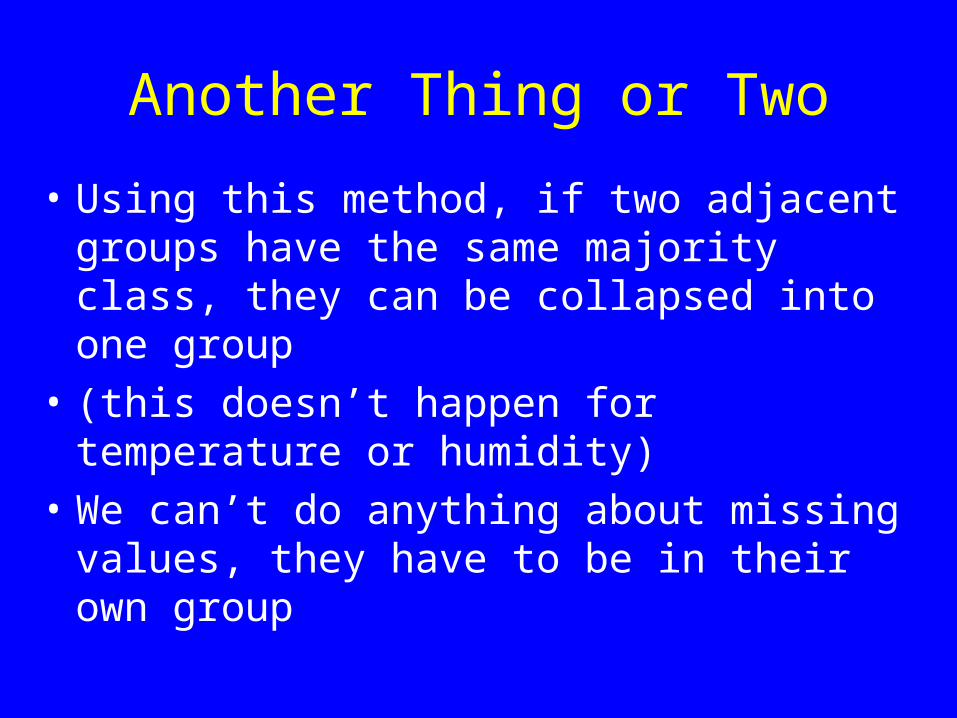
Another Thing or Two
• Using this method, if two adjacent groups have the same majority class, they can be collapsed into one group
• (this doesn’t happen for temperature or humidity)
• We can’t do anything about missing values, they have to be in their own group
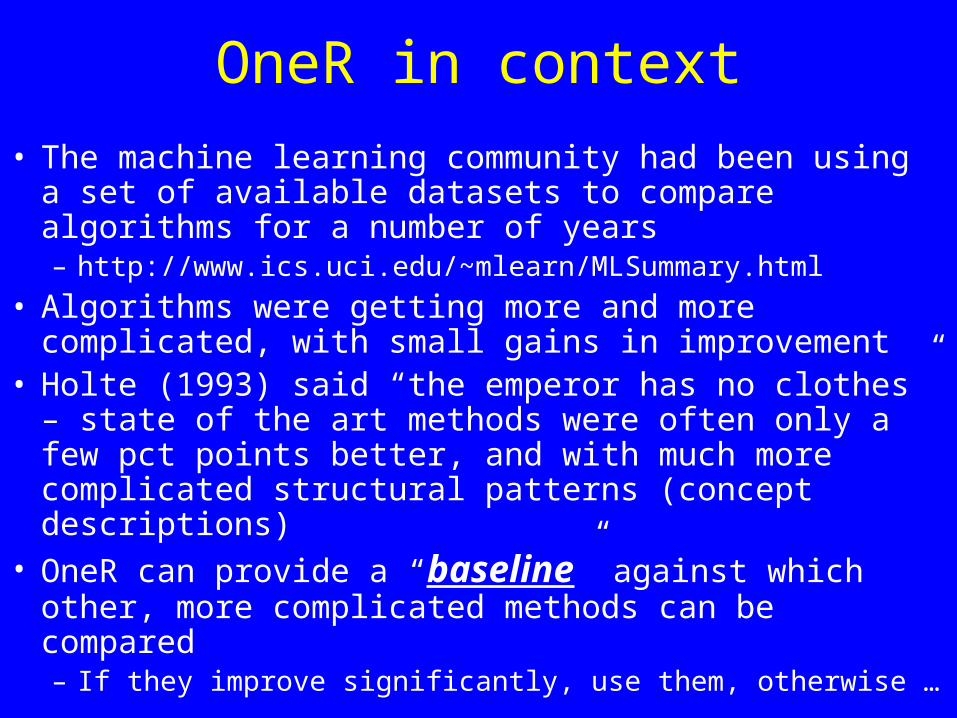
OneR in context
• The machine learning community had been using a set of available datasets to compare algorithms for a number of years– http://www.ics.uci.edu/~mlearn/MLSummary.html
• Algorithms were getting more and more complicated, with small gains in improvement
• Holte (1993) said “the emperor has no clothes” – state of the art methods were often only a few pct points better, and with much more complicated structural patterns (concept descriptions)
• OneR can provide a “baseline” against which other, more complicated methods can be compared– If they improve significantly, use them, otherwise …

Class Exercise

Let’s run WEKA OneR on japanbank
• B option = 3

We can actually discretize and save data for future use using
WEKA• Preprocess Tab• Select Choose Unsupervised > Attribute > Discretize• Choose Options
– Attribute indices (#s to be binned – e.g. attr 3-4)– FindNumBins – to have WEKA find a good number of
groups for this data– NumBins = max # groups to consider
• Choose Apply Button• Choose Save Button, to save in permanent file• Undo if necessary

End Section 4.1