data metric system (si) taking measurements organization presentation
DESCRIPTION
DATA Metric System (SI) Taking Measurements Organization Presentation. Data. Your data are all the records you have gathered from an investigation. The types of data collected depend on the activity. Data may be a series of weights of volumes, a set of color changes, - PowerPoint PPT PresentationTRANSCRIPT
DATADATA
Metric System (SI) Metric System (SI) Taking MeasurementsTaking Measurements
Organization Organization PresentationPresentation
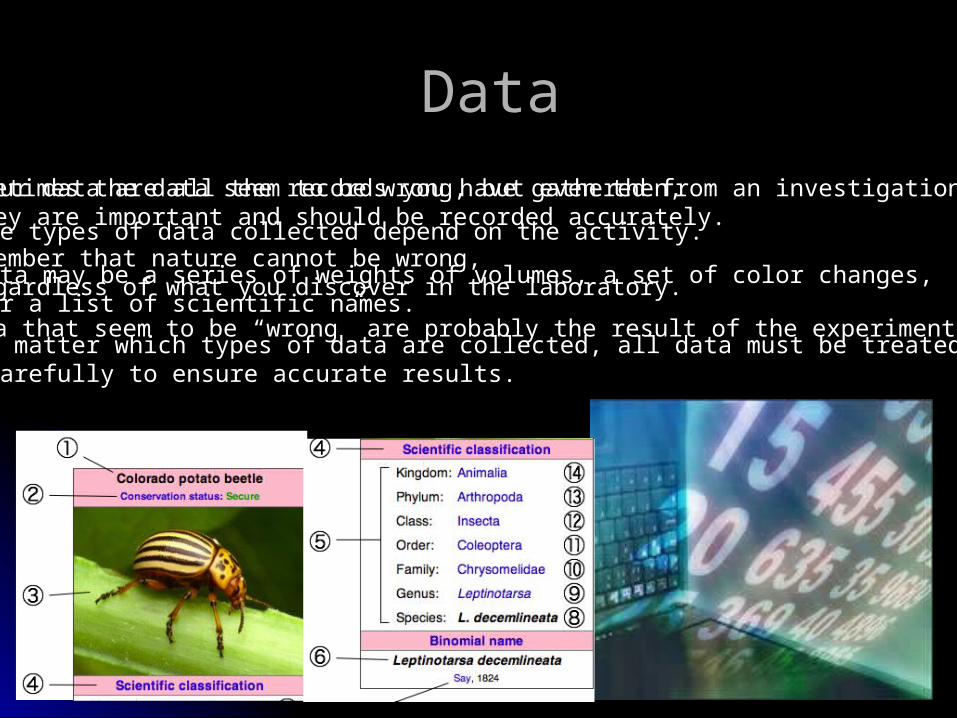
• Your data are all the records you have gathered from an investigation.
• The types of data collected depend on the activity.
• Data may be a series of weights of volumes, a set of color changes, or a list of scientific names.
• No matter which types of data are collected, all data must be treated carefully to ensure accurate results.
DataData
• Sometimes the data seem to be wrong, but even then, they are important and should be recorded accurately.
• Remember that nature cannot be wrong, regardless of what you discover in the laboratory.
• Data that seem to be “wrong” are probably the result of the experimental error.

Metric SystemMetric System A decimal system of A decimal system of
measurement whose units are measurement whose units are based on certain physical based on certain physical standards and standards and scaled on scaled on multiples of ___ multiples of ___
Based on Based on units of 10units of 10
tenten
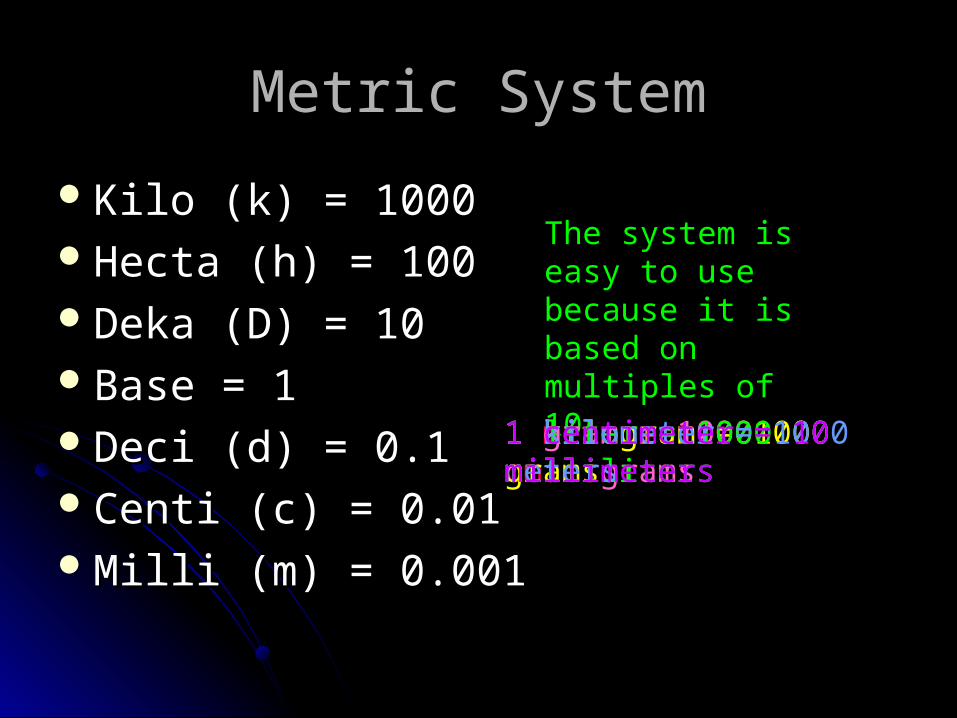
Kilo (k) = 1000Kilo (k) = 1000Hecta (h) = 100Hecta (h) = 100Deka (D) = 10Deka (D) = 10Base = 1Base = 1Deci (d) = 0.1Deci (d) = 0.1Centi (c) = 0.01Centi (c) = 0.01Milli (m) = 0.001Milli (m) = 0.001
Metric SystemMetric System
The system is easy to use because it is based on multiples of 10
1 meter = 100 cm1 kilogram = 1000 grams1 gram = 1000 milligrams1 liter = 1000 milliliters1 kilometer = 1000 meters1 centimeter = 10 millimeters
Measurement in ScienceMeasurement in Science
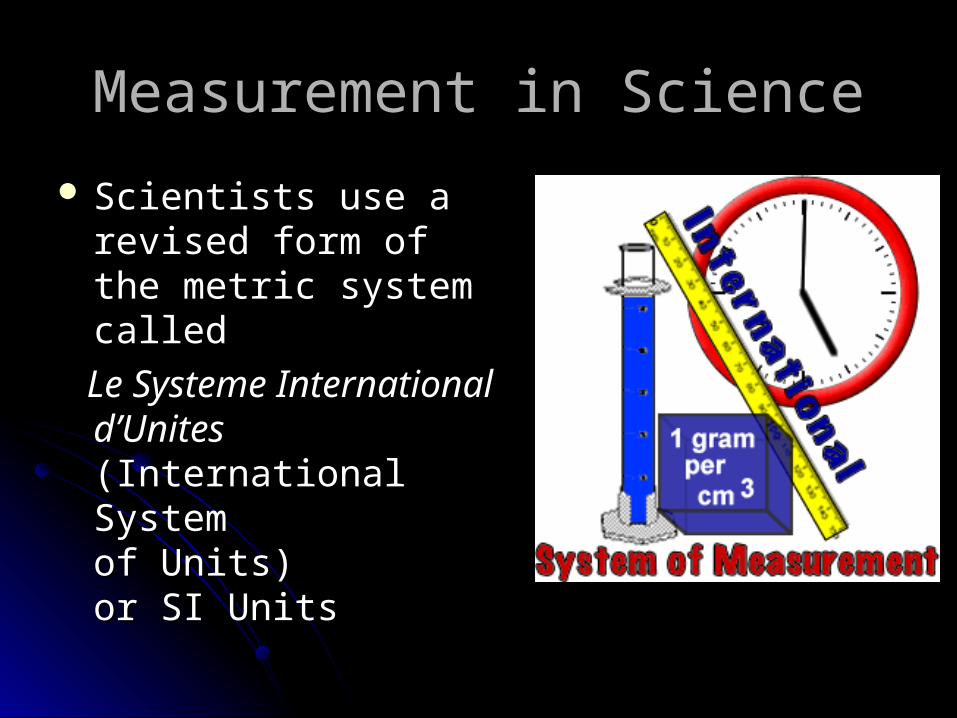
Scientists use a revised Scientists use a revised form of the metric form of the metric system called system called
Le Systeme International Le Systeme International d’Unitesd’Unites(International System (International System of Units) of Units) or SI Units or SI Units

S.I. Base UnitsS.I. Base UnitsThe International System of Units (S.I.) defines seven base units for the seven base quantities:
Quantity Name Symbol
length meter m
mass kilogram kg
time second s
electric current ampere A
thermodynamic temperature kelvin K
luminous intensity candela cd
amount of substance mole mol

S.I. Base UnitsS.I. Base Units
LengthLength
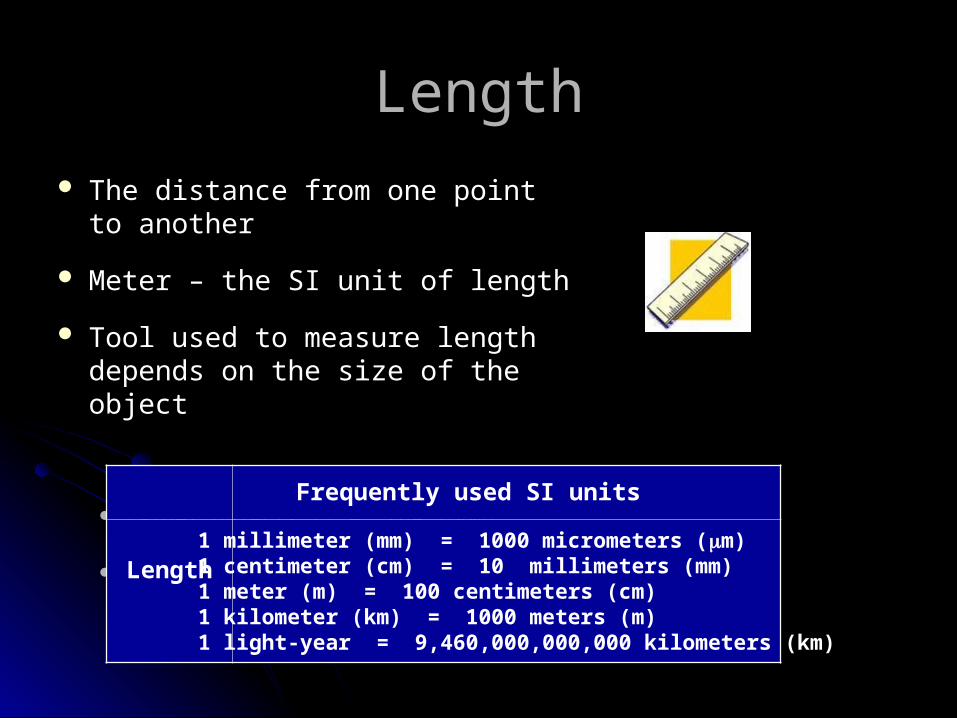
The distance from one point to The distance from one point to anotheranother
Meter – the SI unit of lengthMeter – the SI unit of length
Tool used to measure length Tool used to measure length depends on the size of the objectdepends on the size of the object
Larger objects (i.e. the room) Larger objects (i.e. the room) – – meter stickmeter stick
Smaller objects (i.e. pencil length) Smaller objects (i.e. pencil length) – – centimeter rulercentimeter ruler
Frequently used SI units
Length1 millimeter (mm) = 1000 micrometers (m)1 centimeter (cm) = 10 millimeters (mm)1 meter (m) = 100 centimeters (cm)1 kilometer (km) = 1000 meters (m)1 light-year = 9,460,000,000,000 kilometers (km)
Measuring LengthMeasuring Length
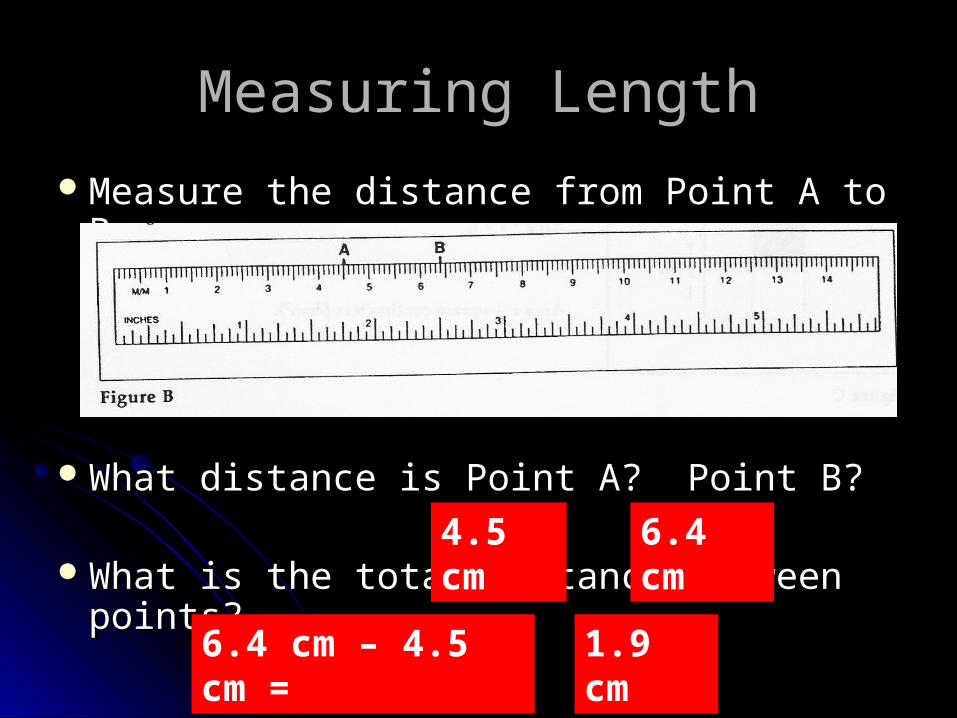
Measure the distance from Point A to BMeasure the distance from Point A to B
What distance is Point A? Point B?What distance is Point A? Point B?
What is the total distance between points?What is the total distance between points?
4.5 cm 6.4 cm
6.4 cm – 4.5 cm = 1.9 cm

MassMass The amount of matter in somethingThe amount of matter in something Mass is measured using a balance or triple Mass is measured using a balance or triple
beam balancebeam balance Or an electronic balanceOr an electronic balance

MassMass
The SI unit for mass The SI unit for mass is the kilogram (kg)is the kilogram (kg)
The gram is the base The gram is the base unitunit
However, some However, some measurements of mass measurements of mass like the mass of vitamins like the mass of vitamins or medicines are so small or medicines are so small that we use milligrams that we use milligrams (mg) to measure their (mg) to measure their massmass
Frequently used SI units
Mass1 gram (g) = 1000 milligrams (mg)1 kilogram (kg) = 1000 grams (g)1 metric ton = 1000 kilograms (kg)

Measuring MassMeasuring MassMeasured using a balanceMeasured using a balance
What is the mass of this object?What is the mass of this object? 175 g

AreaAreaAreaArea is a physical quantity expressing the is a physical quantity expressing the
size of a part of a surface. size of a part of a surface. The term can also be used in a non-The term can also be used in a non-
mathematical context to be mean mathematical context to be mean "vicinity"."vicinity".
Surface areaSurface area is the summation of the is the summation of the areas of the exposed sides of an object.areas of the exposed sides of an object.
Frequently used SI units
Area 1 square meter (m2) = 10,000 square centimeters (cm2)1 square kilometer (km2) = 1,000,000 square meters (m2)
Measuring AreaMeasuring Area
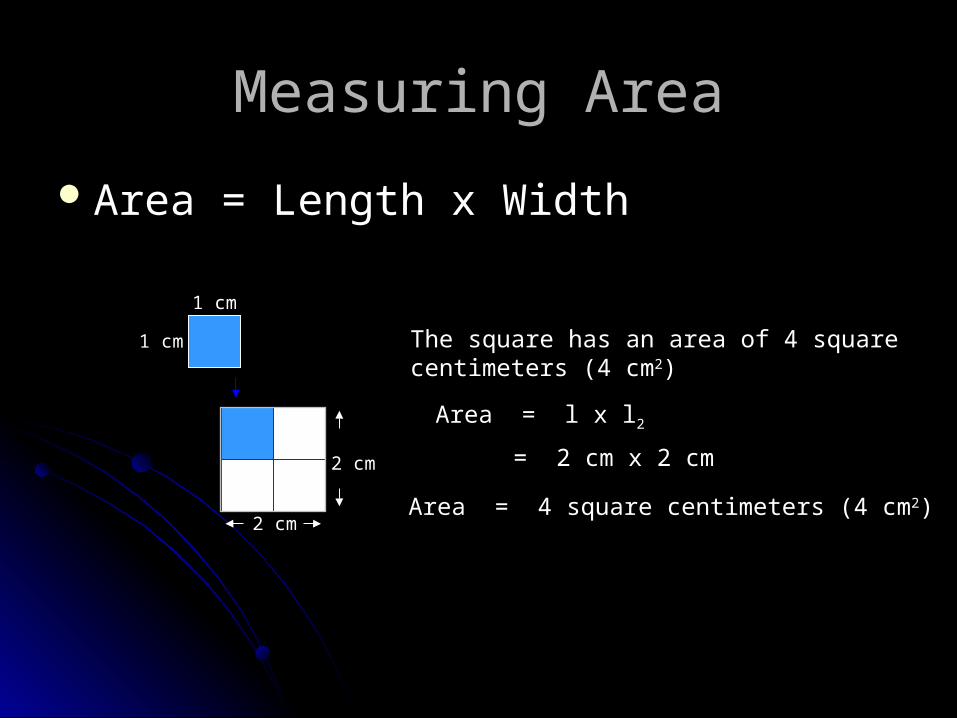
Area = Length x WidthArea = Length x Width
2 cm
2 cm
1 cm
1 cm The square has an area of 4 squarecentimeters (4 cm2)
Area = l x l2
= 2 cm x 2 cm
Area = 4 square centimeters (4 cm2)
Measuring AreaMeasuring Area
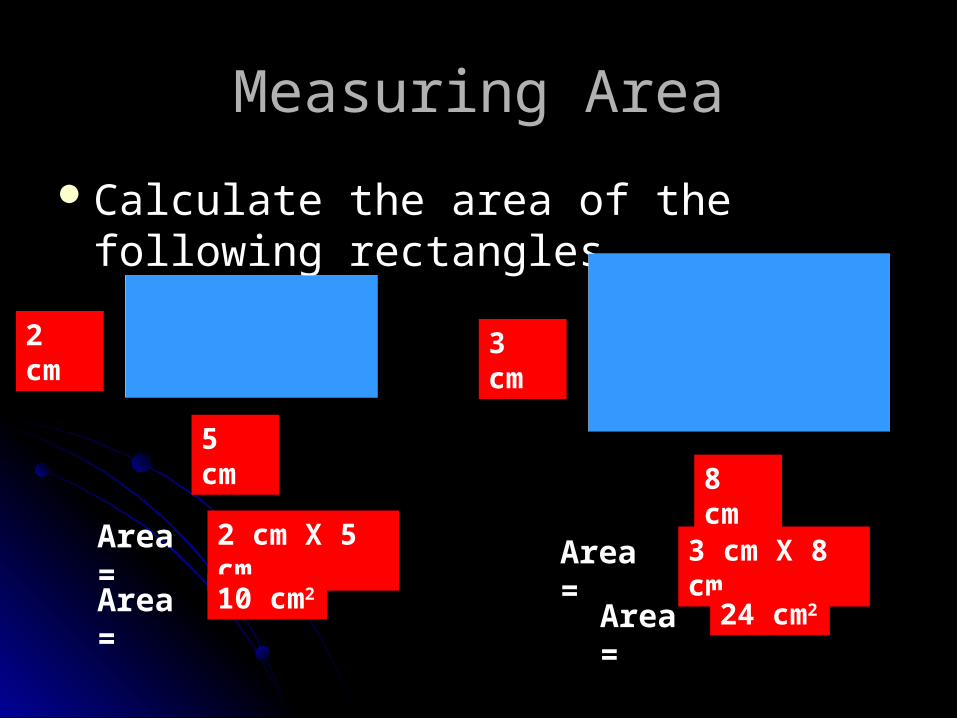
Calculate the area of the following rectanglesCalculate the area of the following rectangles
5 cm
Area =
Area =
cm
8 cm
Area =
Area =
3 cm X 8 cm2 cm X 5 cm
24 cm210 cm2
2 cm 3 cm

VolumeVolume
The amount of space a The amount of space a substance takes upsubstance takes up
Volume of a liquid is found Volume of a liquid is found using a graduated cylinderusing a graduated cylinder Unit is liters (L) or milliliters Unit is liters (L) or milliliters
(mL)(mL)
Frequently used SI units
Volume1 milliliter (mL) = 1 cubic centimeter (cc) or (cm3)1 liter (L) = 1000 milliliters (mL) or 1 dm3
Measuring VolumeMeasuring Volume
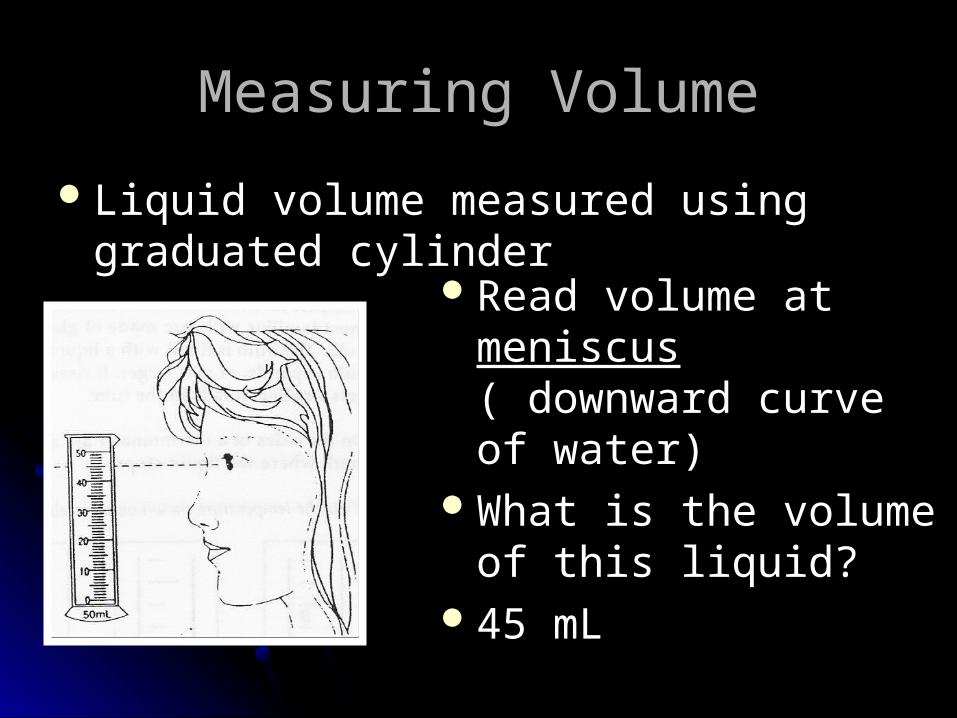
Liquid volume measured using graduated Liquid volume measured using graduated cylindercylinder
Read volume at Read volume at meniscusmeniscus ( downward ( downward curve of water)curve of water)
What is the volume of What is the volume of this liquid?this liquid?
45 mL45 mL
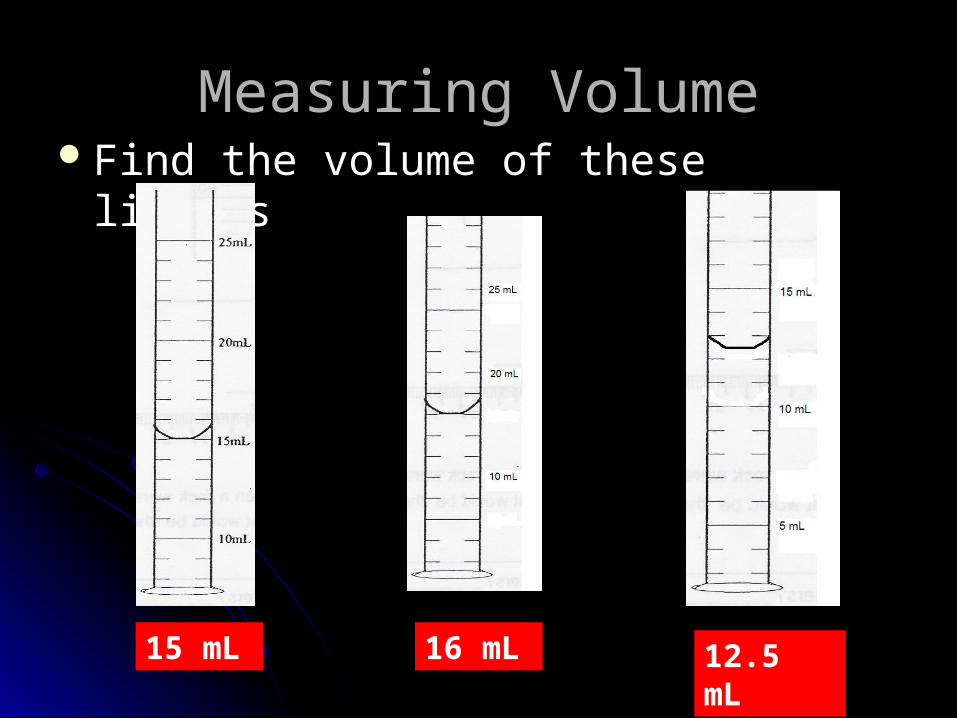
Measuring VolumeMeasuring VolumeFind the volume of these liquidsFind the volume of these liquids
16 mL15 mL 12.5 mL

VolumeVolume
Volume of a solid is found using the Volume of a solid is found using the volume equation volume equation length x width x heightlength x width x height In this equation, we are also multiplying the In this equation, we are also multiplying the
units together so units for the units together so units for the volume of a solid are…volume of a solid are…
m x m x m = mm x m x m = m33 ORORcm x cm x cm = cmcm x cm x cm = cm33
Also know that 1 mL = 1 cmAlso know that 1 mL = 1 cm33 = 1 cc (cubic = 1 cc (cubic centimeter)centimeter)

Measuring VolumeMeasuring Volume
Solid volume measured using volume Solid volume measured using volume equation (l x w x h)equation (l x w x h)
What is the volume of a cube that is 2 cm x 2 cm x 2 cm?
Volume = l1 x l2 x l3
= 2 cm x 2 cm x 2 cm
Volume = 8 cubic centimeters (8 cm3)

Measuring VolumeMeasuring Volume
Calculate the volume of the boxCalculate the volume of the box
5 mm2 mm
6 mm
Volume =
Volume =
Volume = 60 mm3
6 mm X 5 mm X 2 mm
l x w x h

Water DisplacementWater Displacement
Some solid samples, such as an Some solid samples, such as an irregularly shaped rock cannot have their irregularly shaped rock cannot have their volume measured easily by using the volume measured easily by using the volume equation (length x width x height)volume equation (length x width x height)
For these solids, scientists use a For these solids, scientists use a technique called technique called Water Displacement Water Displacement

Water DisplacementWater Displacement
Steps of Water DisplacementSteps of Water Displacement1. Add water to a graduated
cylinder and record its volume (ex: 7 ml)
2. Place the irregularly shaped solid into the graduated cylinder already containing water and record the new volume (ex: 9 ml)
Water DisplacementWater Displacement
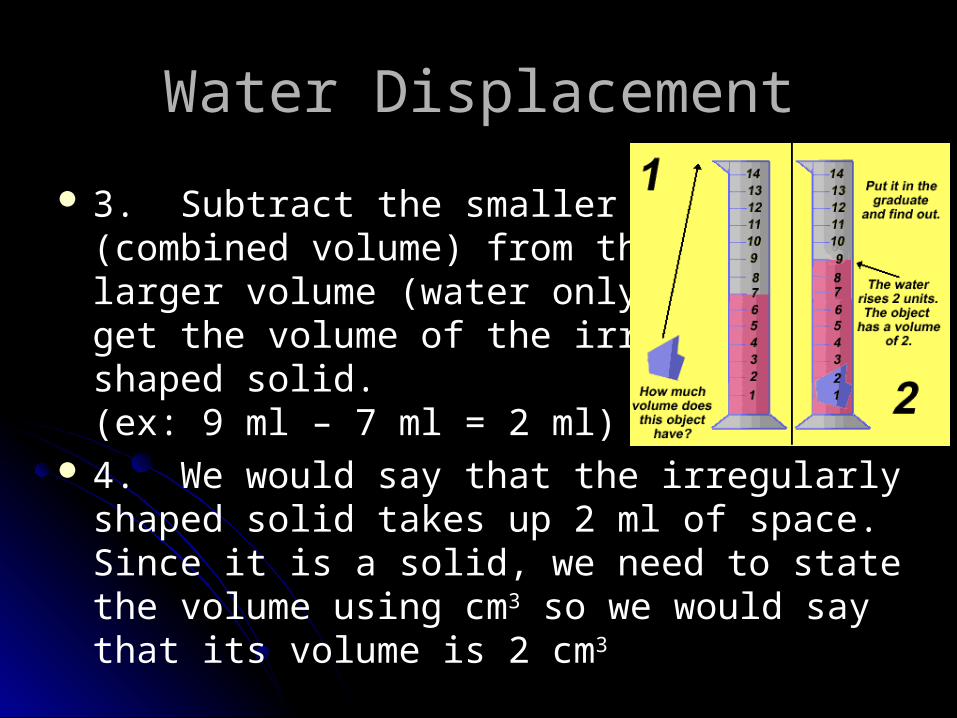
3. Subtract the smaller volume(combined volume) from the larger volume (water only) to get the volume of the irregularlyshaped solid. (ex: 9 ml – 7 ml = 2 ml)
4. We would say that the irregularly shaped solid takes up 2 ml of space. Since it is a solid, we need to state the volume using cm3 so we would say that its volume is 2 cm3
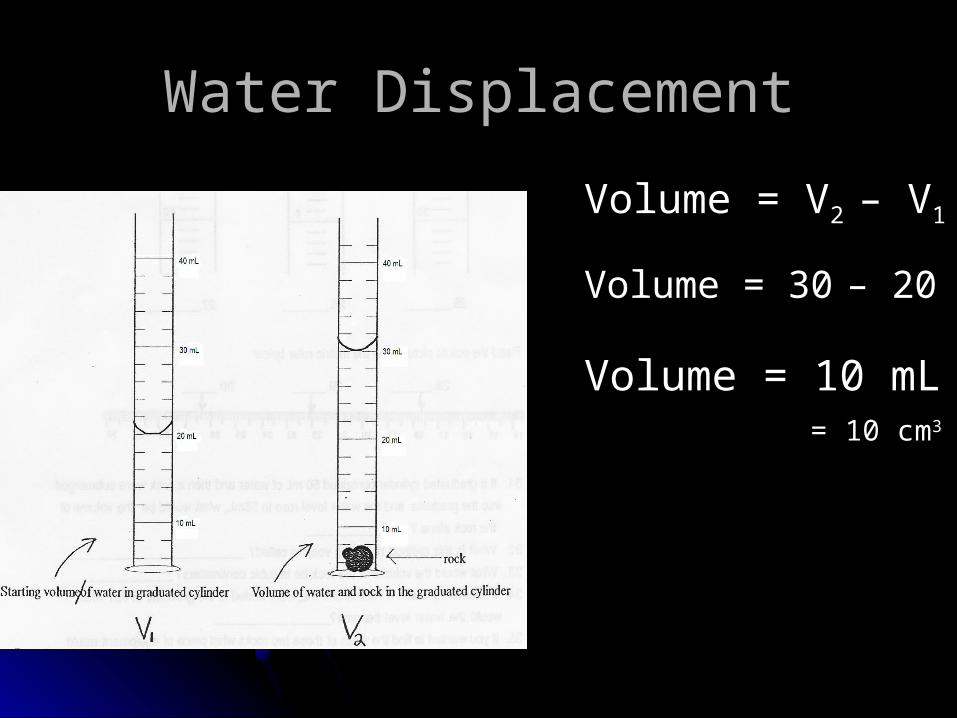
Volume = VVolume = V2 2 – V– V11
Volume = 30Volume = 30 – 20– 20
Volume = 10 mLVolume = 10 mL
Water DisplacementWater Displacement
= 10 cm= 10 cm33
TemperatureTemperature
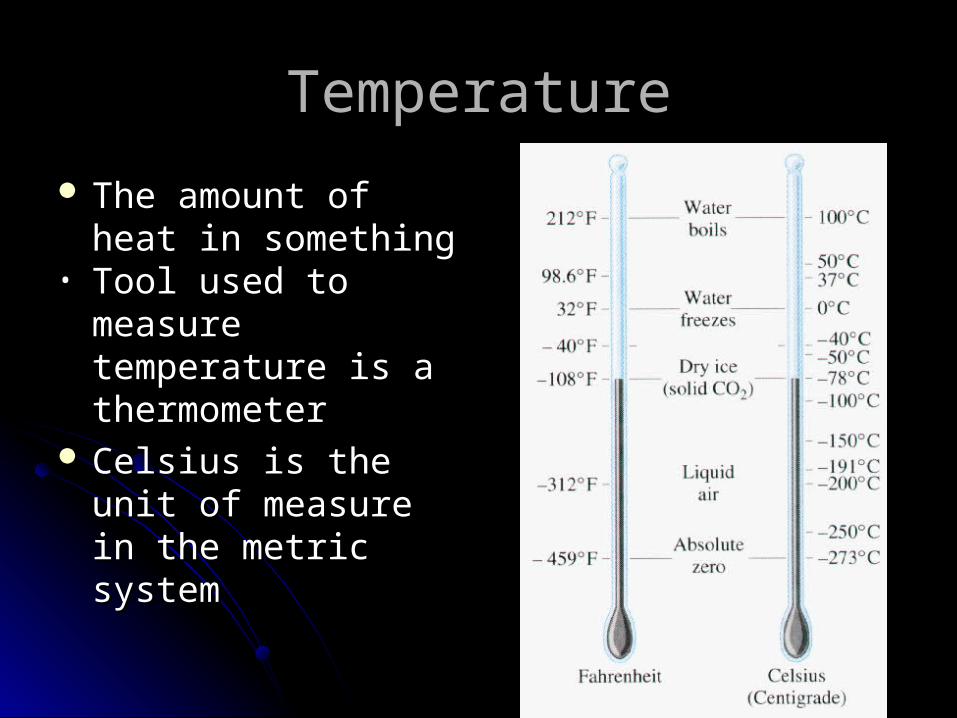
The amount of heat in The amount of heat in somethingsomething
• Tool used to measure Tool used to measure temperature is a temperature is a thermometerthermometer
Celsius is the unit of Celsius is the unit of measure in the metric measure in the metric systemsystem

TemperatureTemperature
SI unit for SI unit for temperature is the temperature is the Kelvin (K)Kelvin (K) Notice that there is no Notice that there is no
degree sign used!degree sign used! Kelvin scale is easier Kelvin scale is easier
for scientists to usefor scientists to use To calculate Kelvin To calculate Kelvin
you add 273 to the you add 273 to the Celsius temperatureCelsius temperature
Ex. 23 Ex. 23 ○○C = 23 + 273 = C = 23 + 273 = 296 K296 K

Reading a ThermometerReading a ThermometerWhat’s the temperature?What’s the temperature?
-14 ○C 24.5 ○C
-5
-10
-15
-5
-10
-15
-5
-10
-15
30
25
20
-5
-10
-15
-14.0 ○C
TimeTime
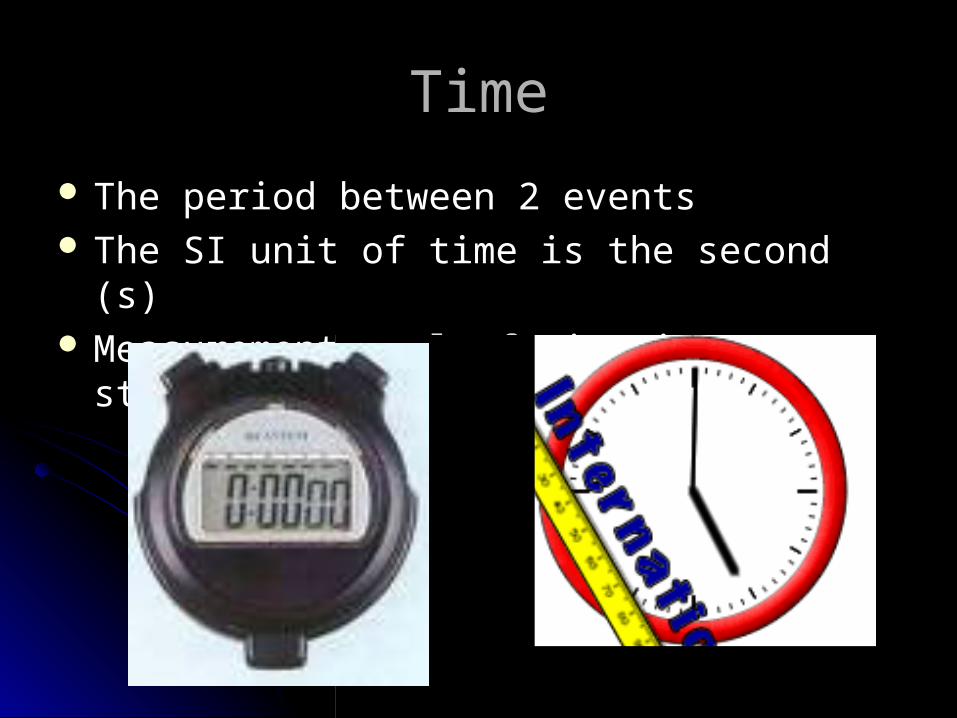
The period between 2 eventsThe period between 2 events The SI unit of time is the second (s)The SI unit of time is the second (s) Measurement tool of time is a stopwatchMeasurement tool of time is a stopwatch
Recording and Organizing Recording and Organizing Laboratory DataLaboratory Data
•There are many ways to record and organize data, including:•data tables, charts, and graphs.
•It is important to include the appropriate units when you record data.
•Remember that DATA are measurements or observations, not merely numbers.
•Data tables, graphs, and diagrams should have descriptive titles to ensure that another person can understand them without having been present during the investigation.
Many important scientific discoveries have been made accidentally in thecourse of an often unrelated laboratory activity. Scientists who keep verycareful and complete records sometimes notice unexpected trends in andrelationships among data long after the work is completed. The laboratory notebooks of working scientists are studded with diagrams and notes; every step of every procedure is carefully recorded.

Data Tables and ChartsData Tables and Charts
For example, if you collected data on plant growth that included boththe length of time it took for the plant to grow and the amount of growth,you could record your data in a table (as shown below).
Data tables are probably the most common means of recording data.Although prepared data tables are often provided in lab manuals, it isimportant that you be able to construct your own. The best way to dothis is to choose a title for your data table and them make a list of thetypes of data to be collected. This list will become the headings foryour data columns.
Time in DaysTime in Days Height of Plant (cm)Height of Plant (cm)
1 10
3 12
5 15
7 18
9 20
Plant Growth Data Example Data Table
These data are the basis for all yourlater interpretations and analyses. You canalways ask new questions about the data,but you cannot get new data without re-peating the experiment.

Ways to Record DataWays to Record Data
Data TablesData Tables::
Must have a Must have a titletitle
Must include Must include relevant datarelevant data
Must have labeled Must have labeled columnscolumns
Number of FliesNumber of Flies on Meat per Day on Meat per Day
DayDay Number Number of Fliesof Flies
11 1010
22 5050
33 160160
44 4040
55 00
66 00
GraphsGraphs
Pie (circle) graphsPie (circle) graphs Line graphsLine graphs Bar graphsBar graphs
After data are collected, you must After data are collected, you must determine how to display themdetermine how to display them
One way of showing your resultsOne way of showing your resultsis to use a graphis to use a graph
Three types of graphs are commonly usedThree types of graphs are commonly used
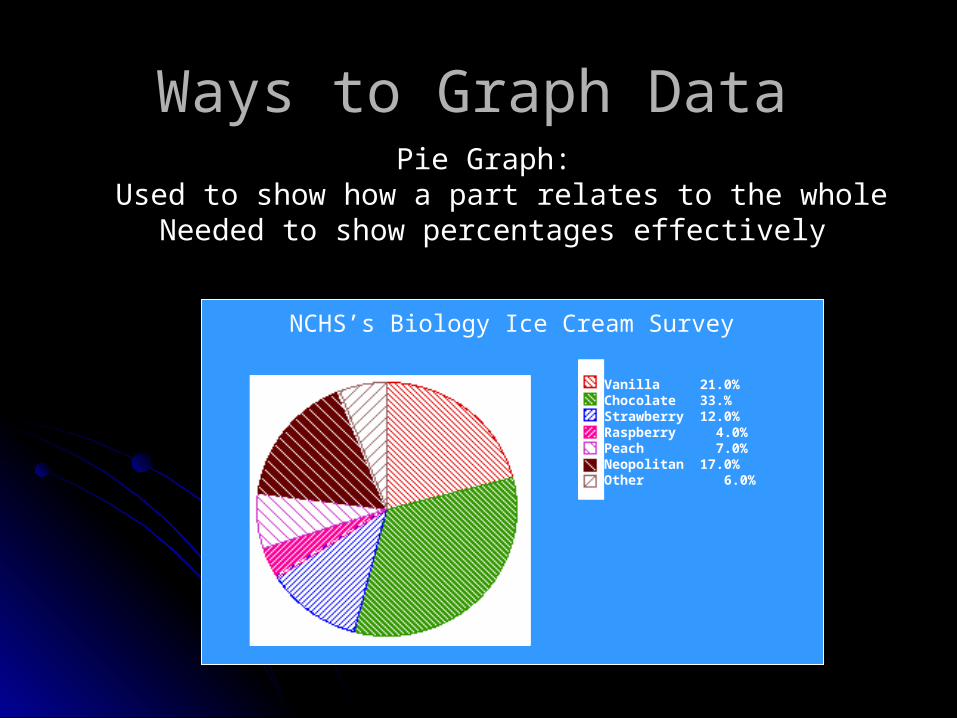
Pie Graph: Pie Graph: Used to show how a part relates to the wholeUsed to show how a part relates to the whole
Needed to show percentages effectivelyNeeded to show percentages effectively
Ways to Graph DataWays to Graph Data
NCHS’s Biology Ice Cream Survey
Vanilla 21.0%Chocolate 33.%Strawberry 12.0%Raspberry 4.0%Peach 7.0%Neopolitan 17.0%Other 6.0%

Ways to Graph DataWays to Graph Data
(Continued)(Continued)
Line graphLine graph: used to : used to show change over show change over timetime
Bar graphBar graph: used to : used to compare quantitiescompare quantitiesin different categoriesin different categories
Be sure to include:Be sure to include: TitleTitle Axis labelsAxis labels KeyKey

Making a Line Graph Making a Line Graph Start with your data table Draw and Label Axes
Independent Variable on the x-axis
Dependent Variable on the y-axis
Would help to know that this experiment
was done with paper towels
Experimental Data
IndependentIndependent
VariableVariable
Submersion time
(seconds)
DependentDependent
VariableVariable
Average height
liquid rose (mm)
1010
1515
2020
2525
3030
3535
4040
1111
1414
1414
1515
1616
1717
1919
Ave
rag
e h
eig
ht
liq
uid
ro
se (
mm
)Submersion time (sec)

Making a Line GraphMaking a Line Graph(Continued)(Continued)
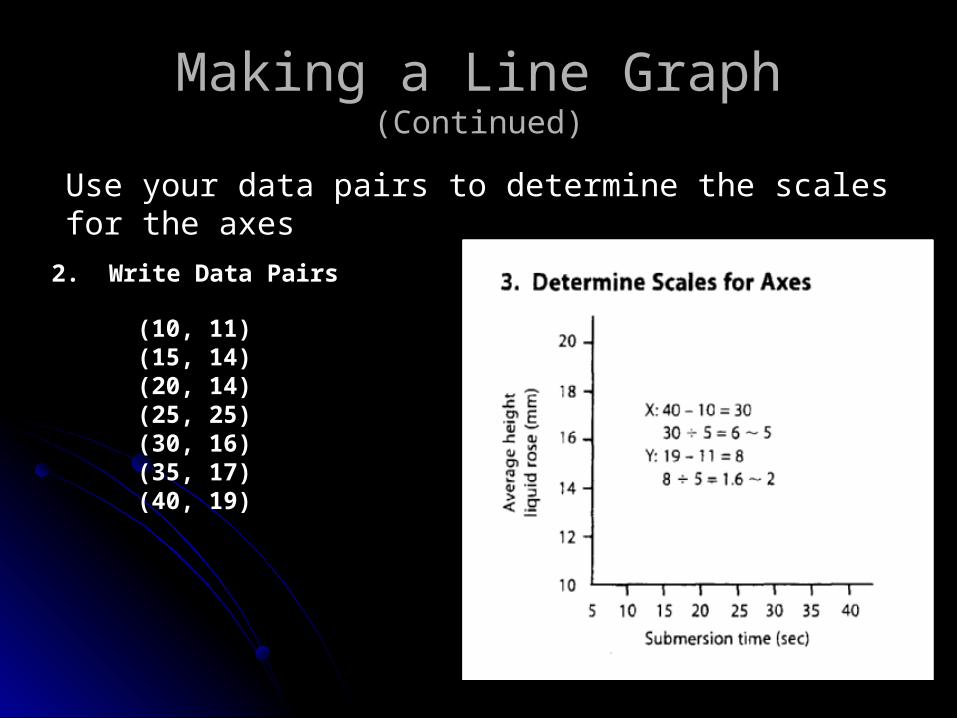
Using your data table, write data pairs
(10, 11)(15, 14)(20, 14)(25, 25)(30, 16)(35, 17)(40, 19)
Experimental Data
IndependentIndependent
VariableVariable
Submersion time
(seconds)
DependentDependent
VariableVariable
Average height
liquid rose (mm)
1010
1515
2020
2525
3030
3535
4040
1111
1414
1414
1515
1616
1717
1919
Making a Line GraphMaking a Line Graph(Continued)(Continued)
Use your data pairs to determine the scales for the axes
2. Write Data Pairs
(10, 11)(15, 14)(20, 14)(25, 25)(30, 16)(35, 17)(40, 19)

Start plotting your data pairs
Making a Line GraphMaking a Line Graph(Continued)(Continued)

Making a Line GraphMaking a Line Graph(Continued)(Continued)
After plotting data, draw a line “of best fit”

Making a Line GraphMaking a Line Graph(Continued)(Continued)
Complete the graph by summarizing its findings
“As the length of time the paper towelwas submerged increased, the heightthe liquid rose also increased.”
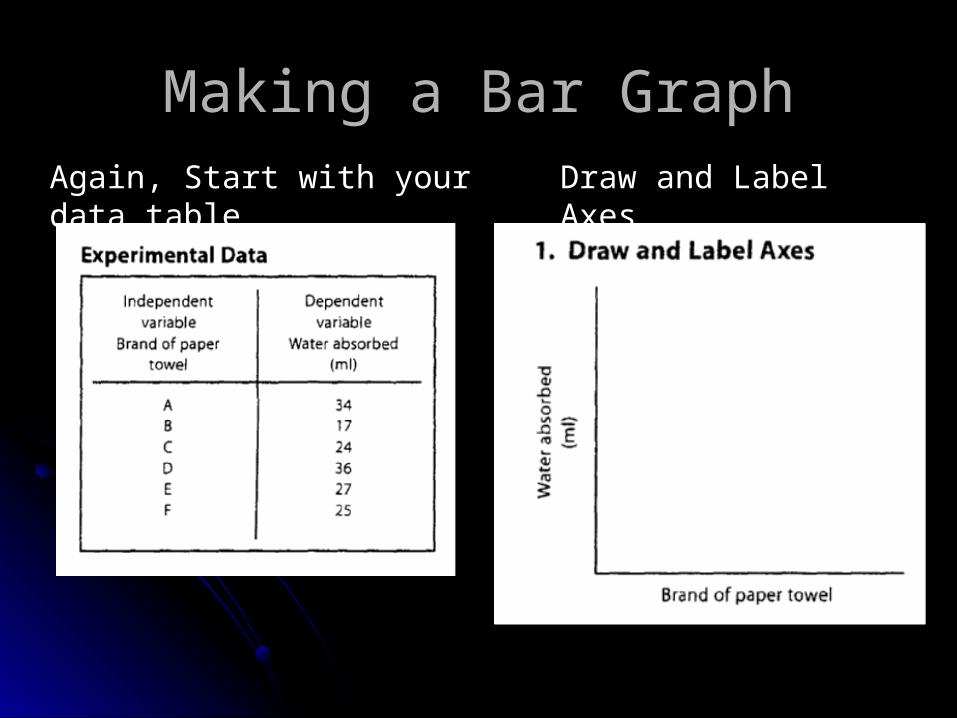
Making a Bar GraphMaking a Bar GraphAgain, Start with your data table Draw and Label Axes
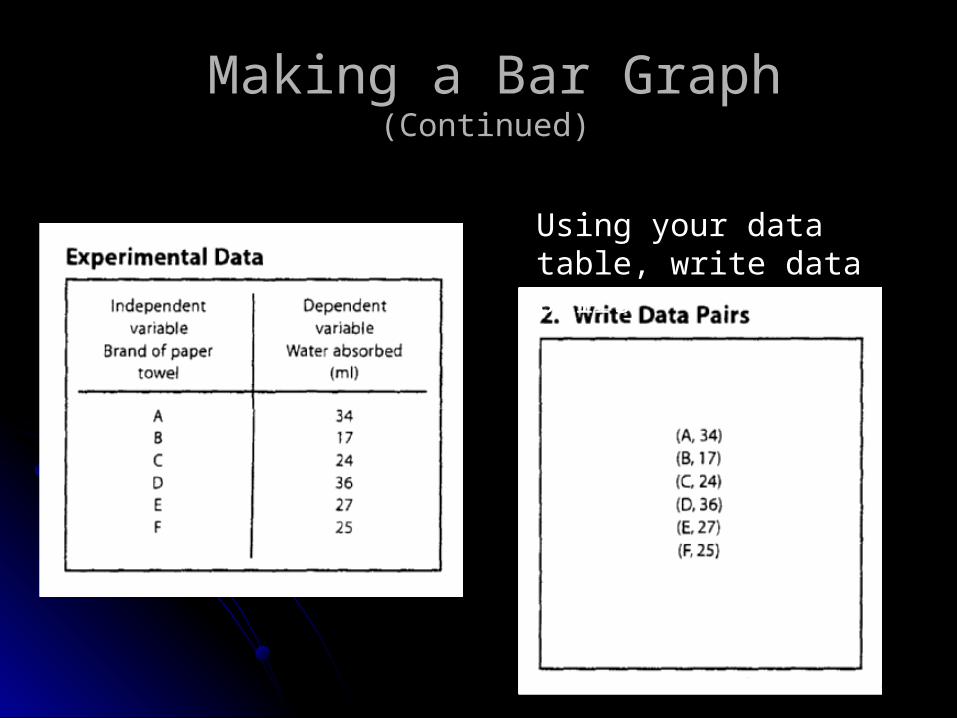
Using your data table, write data pairs
Making a Bar GraphMaking a Bar Graph(Continued) (Continued)

Use your data pairs to determine the scales for the axes
Making a Bar GraphMaking a Bar Graph(Continued) (Continued)

Making a Bar GraphMaking a Bar Graph(Continued) (Continued)
Start plotting your data pairs

After plotting data, fill in bars
Making a Bar GraphMaking a Bar Graph(Continued) (Continued)
Include a key if needed
36
32
28
24
20
16
A B C D E F
Brand of paper towel
Wat
er a
bso
rbed
(m
L)
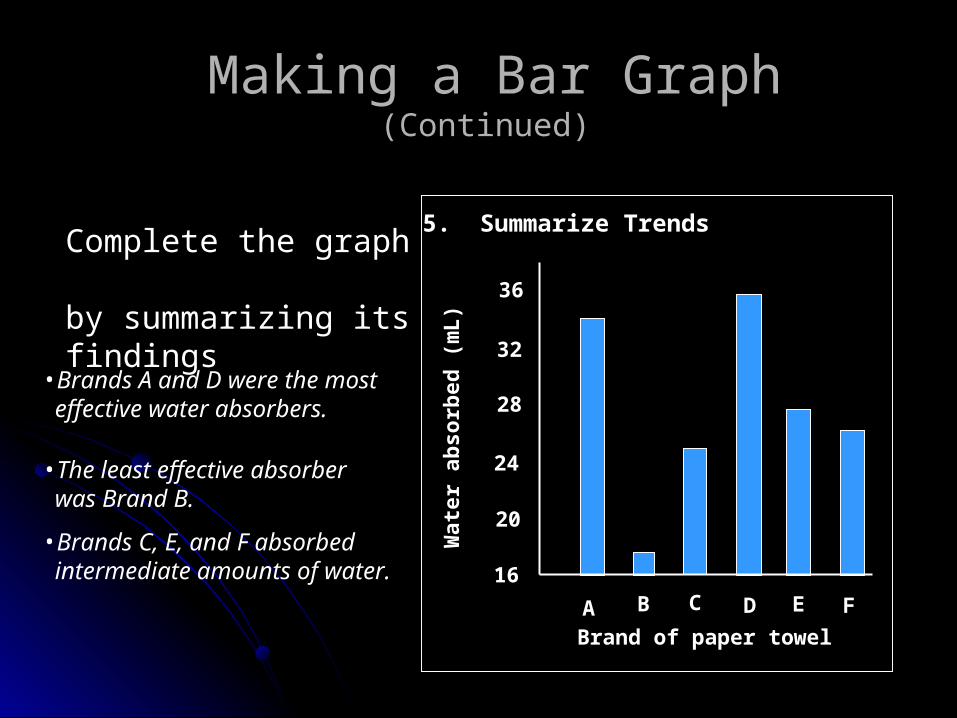
Complete the graph by summarizing its findings
Making a Bar GraphMaking a Bar Graph(Continued) (Continued)
•Brands A and D were the most effective water absorbers.
•The least effective absorber was Brand B.
•Brands C, E, and F absorbed intermediate amounts of water.
5. Summarize Trends
36
32
28
24
20
16
A B C D E F
Brand of paper towel
Wat
er a
bso
rbed
(m
L)

Graphing ReviewGraphing Review Purposes:Purposes:
Organize and analyze dataOrganize and analyze data Show patternsShow patterns Communicate informationCommunicate information Allow scientists to make predictionsAllow scientists to make predictions
Components:Components: Appropriate titleAppropriate title Equal units on each axis with good use of spacingEqual units on each axis with good use of spacing Labels on each axis including units Labels on each axis including units
(example, mm, sec., kg.)(example, mm, sec., kg.) Neatly created using a variety of colorNeatly created using a variety of color
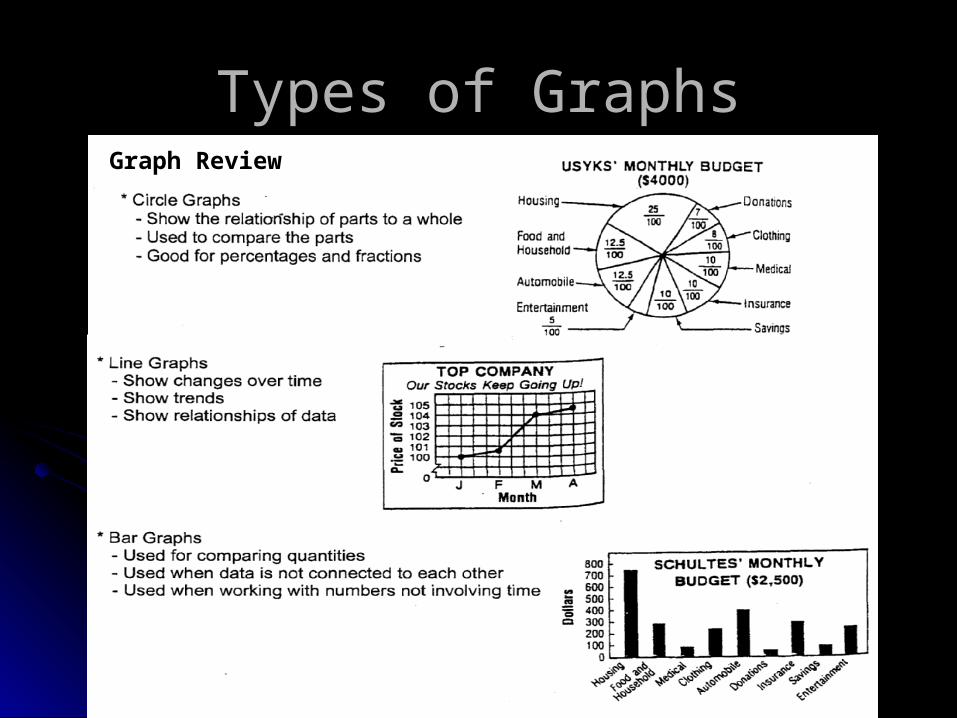
Types of GraphsTypes of GraphsGraph Review

Statistical Methods Statistical Methods & &
Analysis of ErrorsAnalysis of Errors

ERRORERROR
May be defined as a deviation from the May be defined as a deviation from the absolute value or from the true average absolute value or from the true average of a large number of results.of a large number of results.
TYPES OF ERRORSTYPES OF ERRORS
1.1. Determinate error - constantDeterminate error - constant
2.2. Indeterminate error – Indeterminate error – random or accidentalrandom or accidental

Determinate ErrorDeterminate Error Usually present in each measurement and affect Usually present in each measurement and affect
all observations in a series.all observations in a series. Example:Example:
Errors in calibrationErrors in calibration Operation in measuringOperation in measuring Impurities in the reagents or drugsImpurities in the reagents or drugs Biased personal errorsBiased personal errors Pouring or mixingPouring or mixing Weighing operationsWeighing operations Matching colorsMatching colors Making calculationsMaking calculations

Indeterminate ErrorIndeterminate Error
Occur by chanceOccur by chanceVary from one measurement to the nextVary from one measurement to the nextYield a random pattern around an averageYield a random pattern around an averageOccur also in the filling of capsulesOccur also in the filling of capsulesRandom fluctuations in temperature and Random fluctuations in temperature and
other factorsother factors
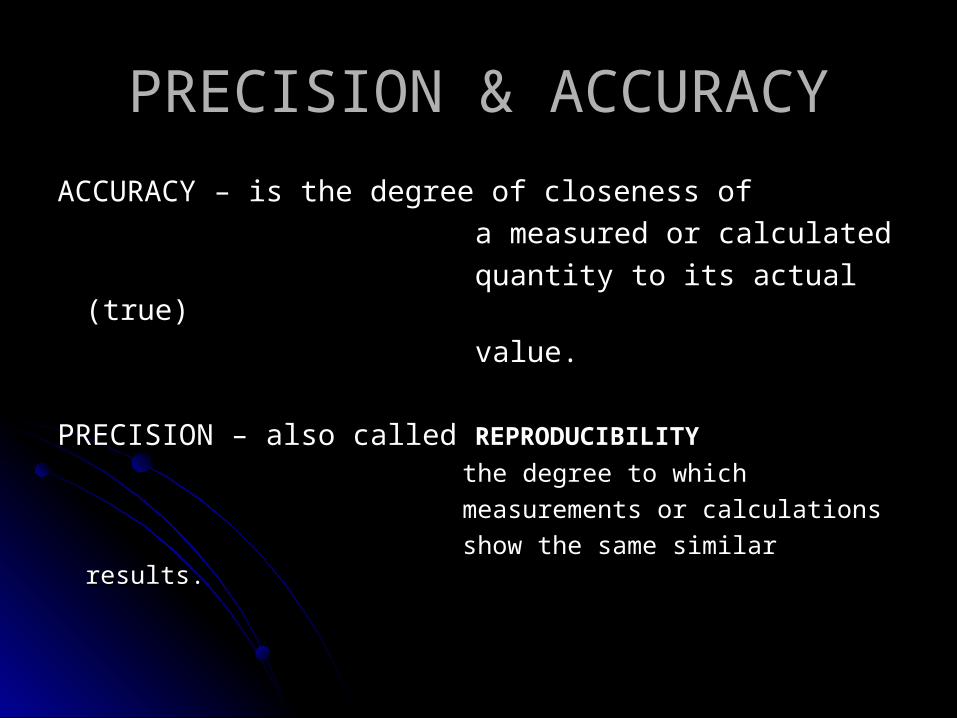
PRECISION & ACCURACYPRECISION & ACCURACY
ACCURACY – is the degree of closeness of ACCURACY – is the degree of closeness of
a measured or calculated a measured or calculated
quantity to its actual (true) quantity to its actual (true)
value.value.
PRECISION – also called PRECISION – also called REPRODUCIBILITYREPRODUCIBILITY
the degree to which the degree to which
measurements or calculations measurements or calculations
show the same similar results.show the same similar results.
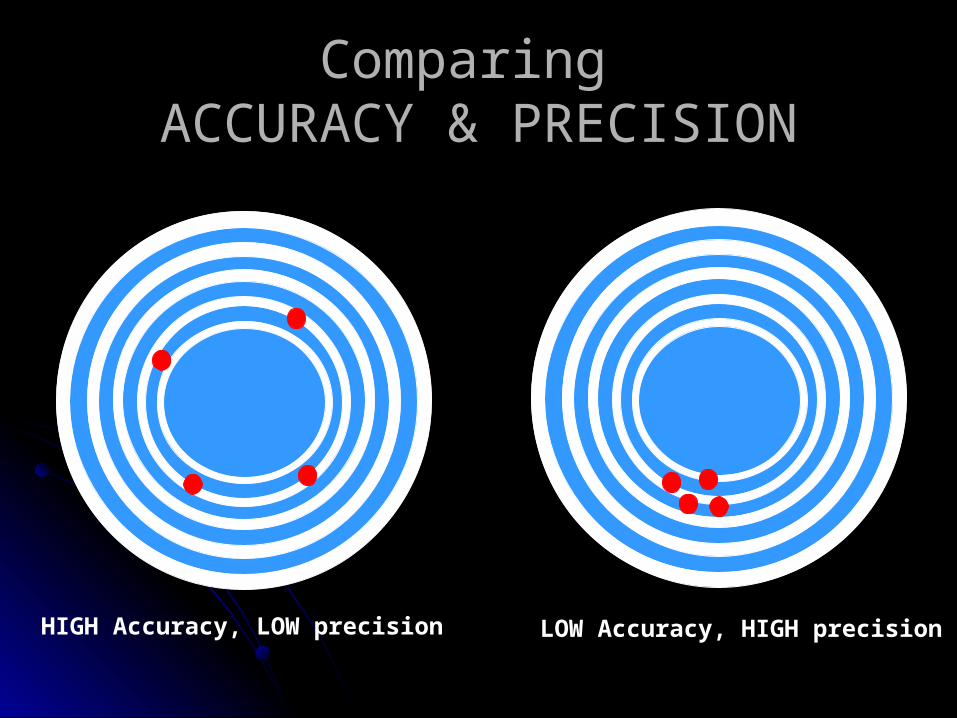
Comparing Comparing ACCURACY & PRECISIONACCURACY & PRECISION
HIGH Accuracy, LOW precision LOW Accuracy, HIGH precision

Prepare for an exam next meeting …
This presentation can be viewed or downloaded at:
http://roselynnaranjo.yolasite.com