data fusion in ubiquitous sports training: methodology and
TRANSCRIPT
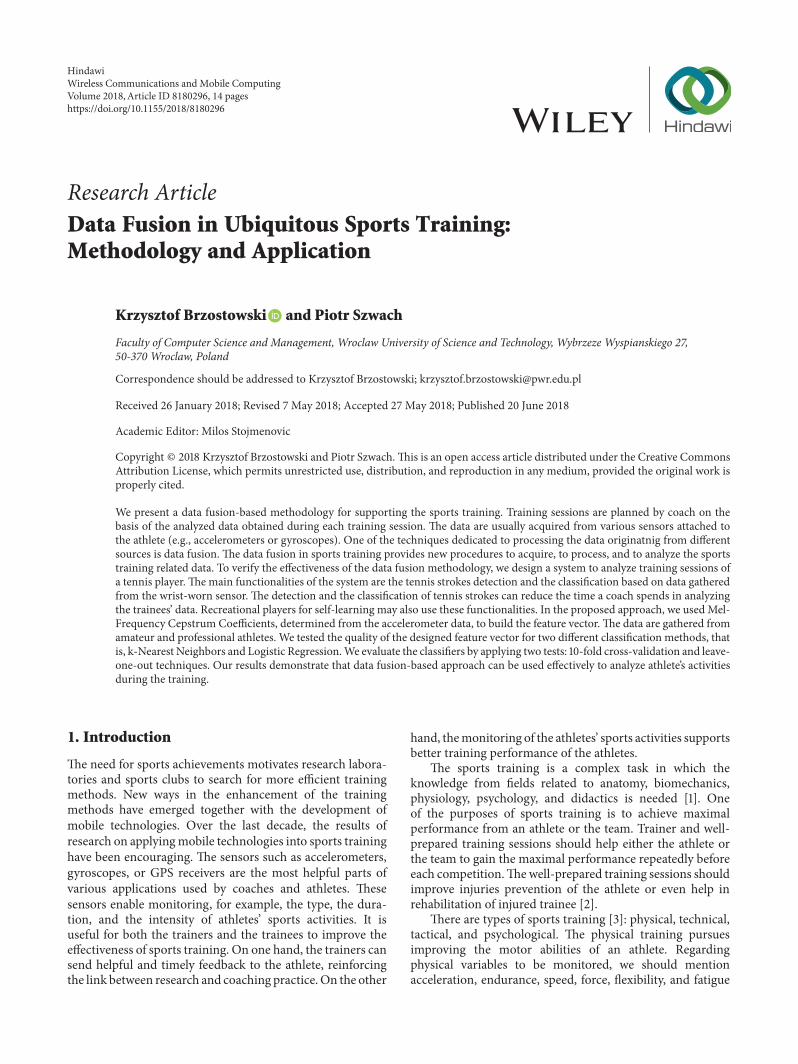
Research ArticleData Fusion in Ubiquitous Sports Training:Methodology and Application
Krzysztof Brzostowski and Piotr Szwach
Faculty of Computer Science and Management, Wroclaw University of Science and Technology, Wybrzeze Wyspianskiego 27,50-370 Wroclaw, Poland
Correspondence should be addressed to Krzysztof Brzostowski; [email protected]
Received 26 January 2018; Revised 7 May 2018; Accepted 27 May 2018; Published 20 June 2018
Academic Editor: Milos Stojmenovic
Copyright © 2018 Krzysztof Brzostowski and Piotr Szwach.This is an open access article distributed under the Creative CommonsAttribution License, which permits unrestricted use, distribution, and reproduction in any medium, provided the original work isproperly cited.
We present a data fusion-based methodology for supporting the sports training. Training sessions are planned by coach on thebasis of the analyzed data obtained during each training session. The data are usually acquired from various sensors attached tothe athlete (e.g., accelerometers or gyroscopes). One of the techniques dedicated to processing the data originatnig from differentsources is data fusion. The data fusion in sports training provides new procedures to acquire, to process, and to analyze the sportstraining related data. To verify the effectiveness of the data fusion methodology, we design a system to analyze training sessions ofa tennis player.Themain functionalities of the system are the tennis strokes detection and the classification based on data gatheredfrom the wrist-worn sensor. The detection and the classification of tennis strokes can reduce the time a coach spends in analyzingthe trainees’ data. Recreational players for self-learning may also use these functionalities. In the proposed approach, we used Mel-Frequency Cepstrum Coefficients, determined from the accelerometer data, to build the feature vector. The data are gathered fromamateur and professional athletes. We tested the quality of the designed feature vector for two different classification methods, thatis, k-Nearest Neighbors and Logistic Regression.We evaluate the classifiers by applying two tests: 10-fold cross-validation and leave-one-out techniques. Our results demonstrate that data fusion-based approach can be used effectively to analyze athlete’s activitiesduring the training.
1. Introduction
The need for sports achievements motivates research labora-tories and sports clubs to search for more efficient trainingmethods. New ways in the enhancement of the trainingmethods have emerged together with the development ofmobile technologies. Over the last decade, the results ofresearch on applyingmobile technologies into sports traininghave been encouraging. The sensors such as accelerometers,gyroscopes, or GPS receivers are the most helpful parts ofvarious applications used by coaches and athletes. Thesesensors enable monitoring, for example, the type, the dura-tion, and the intensity of athletes’ sports activities. It isuseful for both the trainers and the trainees to improve theeffectiveness of sports training. On one hand, the trainers cansend helpful and timely feedback to the athlete, reinforcingthe link between research and coaching practice.On the other
hand, themonitoring of the athletes’ sports activities supportsbetter training performance of the athletes.
The sports training is a complex task in which theknowledge from fields related to anatomy, biomechanics,physiology, psychology, and didactics is needed [1]. Oneof the purposes of sports training is to achieve maximalperformance from an athlete or the team. Trainer and well-prepared training sessions should help either the athlete orthe team to gain the maximal performance repeatedly beforeeach competition.Thewell-prepared training sessions shouldimprove injuries prevention of the athlete or even help inrehabilitation of injured trainee [2].
There are types of sports training [3]: physical, technical,tactical, and psychological. The physical training pursuesimproving the motor abilities of an athlete. Regardingphysical variables to be monitored, we should mentionacceleration, endurance, speed, force, flexibility, and fatigue
HindawiWireless Communications and Mobile ComputingVolume 2018, Article ID 8180296, 14 pageshttps://doi.org/10.1155/2018/8180296

2 Wireless Communications and Mobile Computing
index [1, 4]. The technical training aims at acquiring andmastering the sports skills. Among the technical variables,there are the proper execution of movements, repetition ofsequential movements, correct posture during movementexecution, and starting time [4, 5]. The tactical training isrelated to the studies of different strategies in the sportsdiscipline. The psychological training is oriented towardsimproving the athlete’s personality.
Typically, the sports training is composed of planning,monitoring, and analyzing. The planning of the trainingsessions takes into account the specific needs and conditionsof the athlete, that is, information on athlete’s sports per-formance, shape, mental preparation, skills, predispositions,abilities, and limitations. Obviously, planning the trainingsession is a complex task, since it needs to take into accountthe long-term objective and depends on various externalfactors, that is, temperature or nutrition.
The monitoring of sports training is the process of datacollection during the sports session. Recent advances inwearable technologies allow continuously monitoring theathlete discreetly andwithout obstructing the comfort duringtraining sessions. The modern wearable sensors can capturemotion-related parameters, useful for supporting athletes’sports activities. The standard devices for the athletes’motion-capture are the inertial sensors, that is, accelerome-ters and gyroscopes, as well as magnetometers [4, 6]. Thesesensors are gaining more and more popularity, and variousapplications are relying on these sensors in sports training[7–9]. The other example of sensors applied to support theathletes’ sports sessions is video cameras. Unfortunately, themobility of the systems composed of video cameras is limited.Moreover, the computational costs of the analysis of captureddata are very high.
Once the data are collected, the next phase of thesports training is the data analysis. The data analysis is thecrucial step in the sports training and must be performedefficiently.The reason is that, during each training session, themassive amount of data produced by various sensors couldbe gathered. The problem is the efficient processing of thevast volume of data acquired from different sources at thedifferent level of complexity. It is clear that the up-to-dateinformation on physiological (i.e., sports performance andshape) and technical (i.e., skills) preparation of the athlete hasa significant influence on the further training process and itsoutcomes. Thus, there is a need for developing the methodsto fuse such data.
Some authors [10] suggest that one of the techniquesdesigned to process a large volume of data originating fromdifferent sources is data fusion. The data fusion techniquecombines the data acquired from multiple sources (a) toimprove the accuracy and robustness of the outcomes, (b)to create meaningfully new information that cannot beobtained from the sources separately, and (c) to provide acomplete picture of the investigated object or process. Thedata fusion results, in the more complex analysis, help toimprove the decision-making process. We present how thetrainers and trainees may benefit from the fusion of thedata originating from different sources during training ses-sions.
This paper aims to demonstrate the data fusion methodsin the context of sports training. We present self-developedsystem for detection and classification of the tennis strokes(serve, backhand, and forehand) based on the accelerometer’sdata gathered from the wrist-worn sensor. The proposedapproach can reduce the time of data analysis and help thecoaches to quickly retrieve the critical elements of an athlete’straining session. It also provides insights into tennis playersfor improving their strokes technique and overall perform-ance. The proposed system can also be used by recreationalplayers for self-learning. Applying the wrist-worn sensoreliminates the need for expensive setup for the sensingdata.
The main contribution of the work is the algorithmfor tennis strokes detection and recognition based on Mel-Frequency Cepstrum Coefficients as the feature generator.We test the performance of two classifiers: k-Nearest Neigh-bors and Logistic Regression. To investigate the proposedapproach, we also collected 1794 samples of tennis strokesfrom 15 amateur players and 621 samples from 8 professionalplayers.
The paper is organized as follows. In the first part, wepresent an overview of data fusion techniques and algorithmsand the example applications in sports training. In the secondpart, to provide a broader view, we present and discussoriginal research result obtained from applying data fusion tosupport sports training of tennis player. In the end, the resultsare discussed, and the conclusions are given.
2. Related Works
Themonitoring of sports training can be considered as a partof the human activity recognition (HAR).There are twomainapproaches to solve the HAR problems, that is, by applyingexternal or wearable sensors [11, 12]. The external sensors-based methods can be used only in the predefined locations,whereas in thewearable sensor-based approaches, the devicesare attached to the users’ bodies.
The camera-based systems (e.g., BTS Bioengineering,OptiTrack, Vicon) are the typical example of the motion-capture systems composed of external sensors. Unfortunately,most of such systems are expensive, and they can be employedonly in a laboratory setting. The alternative to the camera-based tracking systems, that is, wearable sensor-based sys-tems, has become increasingly popular. The application ofwearable sensors in human motion analysis aids in overcom-ing the main drawback of camera-based tracking systems,that is, the lack of mobility.
The basic example of a system capable of processingmotion data is composed of the accelerometer or the gyro-scope. There are numerous commercial products supportingthe tracking of the physical activities of athletes. For example,Adidas and Nike provide the devices for running activities[13, 14]. The accelerometer can also be used in the technicaltraining of tennis player [9, 15–17]. Ahmadi at el. introducethe IMU sensor-based approach to the skill assessment andacquisition. The results show that it is possible to apply theaccelerometer data for assessing the skill level of the tennisplayer. However, the authors point out that this approach has

Wireless Communications and Mobile Computing 3
some limitations related to the measurement range and thesampling frequency of the accelerometer.
Another example of one-sensor systems is presentedin [7]. The authors propose an approach to recognize theswimming strokes and to count their number. In the study,two different sensor placements were tested: onewas attachedto the wrist and the second one to the upper back of thesubject. Data acquired from the accelerometer are fusedby QDA classifier (Quadratic Discriminant Analysis). It isreported that the classification accuracy of the approach is96.7% (breast-stroke), 96.1% (freestyle), 97.1% (back-stroke),and 89.8% (turn) for the data gathered from the upper back-worn sensor. The classification accuracy for the wrist-wornsensors is significantly lower.
Tracking the sports activities can be also based on two,three, or more sensors. There are some commercial devicesdedicated to supporting athletes’ training. For example, fortennis players, the wrist-worn wearable devices by Indiegogo[18] and Babolat [19] are offered. The first company offeredPivot, the wireless motion-capture system designed for tennisplayers. The system composed of triaxial accelerometers, tri-axial gyroscopes, and triaxial magnetometers can track foot-work, body position, elbow bend, and knee bend. On the con-trary, Babolat delivers a smart wristband to track training ofthe tennis player. It is mainly designed to track tennis strokes.
There are also some papers that study the applications ofdata fusion to support sports training [20–23]. For example,Connaghan et al. [21] consider the problem ofmonitoring thetechnical training of tennis players. In the proposed system,the data are acquired from single wearable IMU sensor (Iner-tial Measurement Unit) composed of the triaxial accelerom-eter, the triaxial gyroscope, and the triaxial magnetometer.The sensing device was attached to the player’s forearm. Inorder to fuse the measurement data, the authors used theNaive-Bayes classifier. The classifier was trained using datagathered from seven players. The classification accuracy ofdetection and classification depends on the source of data.For example, fusing data from the accelerometer and thegyroscope improves the overall accuracy of classificationup to 82.5%. On the contrary, the fusion of the data fromboth the accelerometer and the magnetometer enhances theperformance up to 86% and from the gyroscope and themagnetometer up to 88%. Applying data fusion for dataacquired from the accelerometer, the gyroscope, and themagnetometer improves the overall performance up to 90%.
In paper [24], the other example of a fusion-based ap-proach supporting sports training is considered. The authorsproposed an approach to golf swing classification relyingon measurement data from the triaxial accelerometer andthe triaxial gyroscope. The gathered data are fused by deepconvolutional neural network (deep CNN). The results arecomparedwith SupportVectorMachine (SVM) classifier.Thereported overall accuracy for deep CNN is 95.04% and it is86.79% from SVN.
As we presented, the measurements acquired fromaccelerometers, gyroscopes, and magnetometers are sourcesof essential data in the monitoring of athlete’s activities. Thefusion of these data with a video signal can improve theoverall performance of themotion tracking system.With this
new functionality, the trainer can provide corrections andguidance to the trainee. It is worth stressing that adding avideo camera to the tracking system limits the mobility ofthe system. For example, the work in [25] introduces the datafusion-based approach to combine the data acquired fromIMU sensor and a video camera. To test the performanceof the proposed algorithm, the authors used the system todetect and to classify the tennis strokes. The system wascomposed of video cameras arranged in the laboratory settingand IMU sensor attached to the player’s forearm.The featuresused to detect and to classify the tennis strokes are generatedfrom video images and IMU sensor. The authors tested twoclassifiers, that is, k-Nearest Neighbors (K-NN) and SupportVector Machine (SVM). The dataset used to train classifiersconsists only of the samples gathered from the professionalplayers.The results show that it is possible to obtain the betterdetection and classification performance for data originatingfrom multiple sources.
As it is presented in paper [26], inertial sensors can alsobe fused with other measurement units, for example, theforce sensor. The authors applied gathered data to estimaterider trunk pose with the use of Extended Kalman Filter.The performance of the proposed approach is demonstratedthrough indoor and outdoor riding experiments. In the study,five healthy and experienced bicycle riders (four males andone female) perform both the indoor and the outdoor tests.The results showed the outperformance of the proposed algo-rithm compared to methods estimating the rider trunk posewithout the force sensor. Moreover, the proposed algorithmgives the estimation accuracy comparable with other fusionmethods known in the literature.
3. Data Fusion
3.1. Motivation for Data Fusion. The data acquired throughwearable sensor-based systems for sports training usuallyoriginate from different sources. Thus, building a completeand coherent picture of the athlete based on the gathereddata is a challenging problem. Among existent approaches toprocessmultisourced data, we propose a framework based ondata fusion. Data fusion offers various methods, techniques,and architectures for building the picture of the object ofinterest [27].
The system relying on multiple sensors, in which mea-surements from each sensor are processed separately, suffersseveral limitations and issues [28, 29]:
(i) Sensor deprivation: lost ability to monitor the desiredfeatures
(ii) Limited spatial coverage: each sensor has a limited areaof operation
(iii) Imprecision: the precision of sensors’ measurements islimited
(iv) Uncertainty: it appears when the sensor cannot mea-sure all desired features
Data fusion methods in the multisensory systems intro-duce some advantages, such as reduction of uncertainty,improvement of themeasurement precision, enhancement of

4 Wireless Communications and Mobile Computing
Sensor 1
Signal-level fusion
Sensor 2 Sensor N...
Preprocessing
Fused state
Figure 1: Signal-level fusion (based on [31]).
the signal to noise ratio, and compensation for lacking the fea-tures. A significant advantage of fusion methods is their abil-ity to integrate the independent features and prior knowledge.It is essential when the noncommensurate data must be com-bined.The noncommensurate data originate from the hetero-geneous sensors [30]. For example, the data from the acceler-ometer and the video camera are noncommensurate data.
3.2. Methods for Data Fusion. Levels of abstraction are oneof the main concepts of data fusion [10] and they definethe stages at which the fusion can take place. In paper [10],the following three categories of levels of abstraction werespecified: the signal level, the feature level, and the decisionlevel.
3.2.1. Signal Fusion Algorithms. Fusion at the signal-levelfusion is usually used to combine raw signals acquired fromdifferent sensors. The signals at this level are commensurate,that is, acquired from sensors measuring directly the sameproperty. For example, the signals from the accelerometer andthe gyroscope are commensurate, since they are measuringdirectly the same property, that is, the kinematic parametersof moving object.
A typical issue at the first level of fusion is the stateestimation. The popular method to address this issue is theKalman Filter (KF). Kalman Filter is the statistical approachto fusing commensurate signals relying on recursively madepredictions and updates. One of the most common examplesof the Kalman Filter application is the fusion of signalsacquired from the accelerometer and the gyroscope to esti-mate the attitude of the object. The modifications of the KFare Extended Kalman Filter (EKF) and Unscented KalmanFilter (UKF). These extensions of Kalman Filter are usuallyapplied to the nonlinear problems. Another approach appliedat the first level of abstraction is particle filtering (PF). ThePF algorithm based on Sequential Monte Carlo techniquesis estimating the parameters of the conditional probabilitydensity function.
The fusion methods at this level allow getting furtherdescription of the object which is not possible with the useof the existing sensors. In Figure 1, we show themodel of datafusion at signal level.
3.2.2. Feature Fusion Algorithms. Fusion at the second levelis used when the sensors provide the noncommensuratedata. At this level, we start with determining the featurevector; then we perform the feature fusion.The feature vector
is the high-level representation of the object. To constructthe feature vector, we have to generate the features set andselect the most relevant from the original ones. The suitablefeatures are determined by applying feature selection orfeature extraction methods.
The generated features can be grouped as (a) timedomain, (b) frequency domain, and (c) time-frequencydomain. In the first group, we have the features characterizingthe signal (e.g., maximum or minimum of amplitude, zerocrossing rate, rise time, etc.), its statistics (e.g.,mean, standarddeviation, cross-correlation, peak-to-valley, energy, kurtosis,entropy, skew, etc.), and the fractal features.The second groupmainly consists of spectral features (e.g., spectral peaks, roll-off, centroid, flux, and energy), Fourier coefficients, powerspectral density, and the energy of the signal. For the lastgroup, we have wavelet representation (e.g., Gabor waveletfeatures), Wigner-Ville distribution-based analysis, and Mel-Frequency Cepstral Coefficients (MFCC) [33].
The number of generated features might be large (e.g., theFourier coefficients). Thus, it might be necessary to reduceit. We have two approaches to reach the proper amount offeatures: the feature selection or the feature extraction. Thefeature selection is applied to select the most appropriateelements from the original set, whereas the feature extractionmethods reduce the dimensionality of the initial featurevector. In the context of multisensory systems, the feature-level data fusion is vital due to the communication bandwidthand the energy limitation.
Afterwards, having prepared the feature vector, the nextstep is the feature fusion. In general, we can divide fea-ture fusion method into two categories: nonparametric andparametric. The classical nonparametric methods are k-NN, SVM, Logistic Regression (LR), and Artificial NeuralNetworks (ANN).
The main parametric algorithms are Gaussian MixtureModels (GMM) and k-Meansmethods. InGMM,weperformthe feature fusion based on the value of the likelihoodfunction. To train Gaussian Mixture Models, we usually usedExpectation Minimization method. The k-Means method isthe distance-based approach to unsupervised classification ofthe observations.
In Figure 2, we present the basic model of feature-levelfusion.
3.2.3. Decision Fusion Algorithms. The decision-level fusionis performed at the highest level of abstraction. It is theprocess of selecting one hypothesis from the set of hypothesesgenerated at the lower levels. Operations at this level havetwo main advantages: improving the decision accuracy andsaving the bandwidth for systemsworking in network settings[34]. To enhance the quality of decision, in some cases, itis possible to apply on unique mechanism for incorporatingdomain-specific knowledge and information [33].The typicaldecision-level fusion methods include Bayesian inference,fuzzy logic, and Dempster-Shafer theory.
We present the model of decision fusion in Figure 3.
3.3. General Architecture for Data Fusion-Based Systems. Inthe section, we introduce the general architecture of the data

Wireless Communications and Mobile Computing 5
Sensor 1 Sensor 2 Sensor N
Feature extractionand selection
...
Preprocessing
Feature-level fusion
Fused state
Figure 2: Feature-level fusion (based on [31]).
Feature-level fusion
...
Preprocessing
Fused state
...
Decision-level fusion
Dom
ain
spec
ific
know
ledg
eSensor 1 Sensor 2 Sensor N
Figure 3: Decision-level fusion (based on [31]).
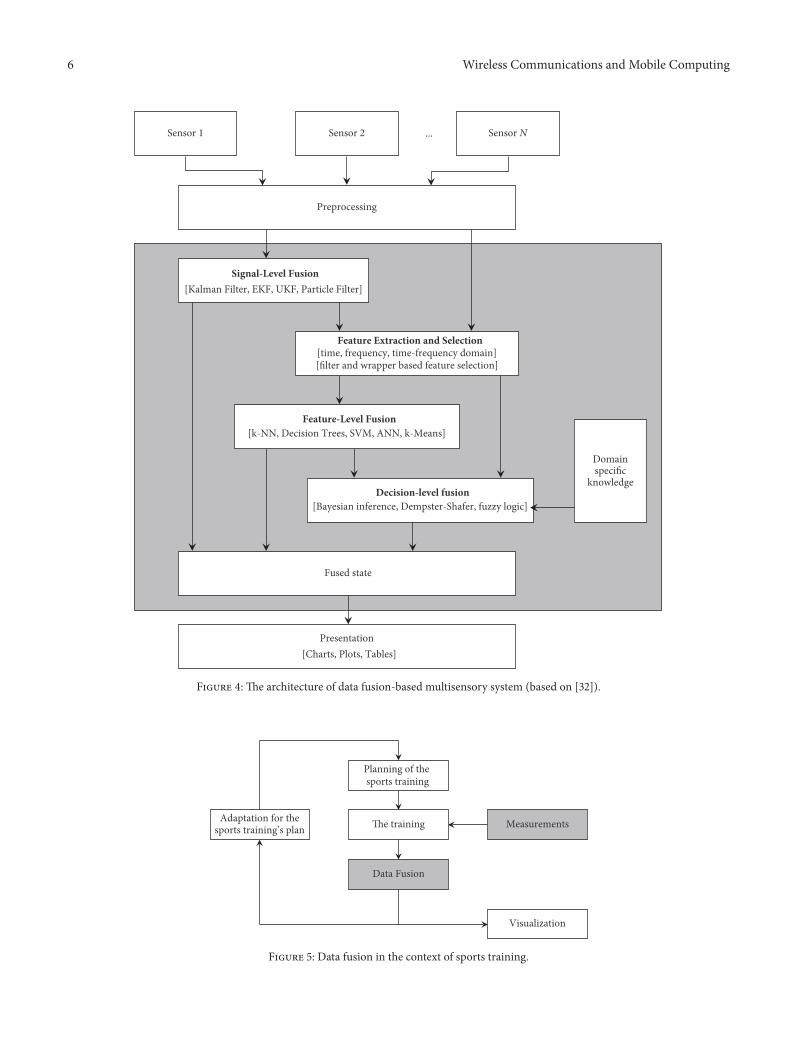
fusion-basedmultisensory system (Figure 4). In the proposedarchitecture, we can distinguish the following tiers:
(i) Data acquisition tier(ii) Data fusion tier(iii) Data presentation tier
The first tier is composed of the sensors (e.g., wearablesensors) attached to the human body or near the human body.Then, the sensor data are transferred (e.g., wirelessly) to thecomputational unit (e.g., smartphone, personal computer, orcloud).
The primary element of the proposed architecture is thesecond tier. All of the data fusion related computations takeplace herein. At this tier, the transferred data are processedat the different levels of abstraction using the previouslydiscussed methods. The applied data fusion-based approachallows designing systems well suited to the user’s needs.
The last tier is designed for data presentation, that is,visualizing (e.g., charts and plots) and reporting (e.g., tables)results. In general, the tier allows interaction between the userand the system.
The general architecture of data fusion-based system canbe applied in problems related to industry, environmentalmonitoring, medicine, or sports [35]. One of the well-knownproblems in industrial communities is the condition-basedmaintenance. In paper [36], the authors consider the problemof engine fault diagnosis. The approach is also applied inrobotics, for example, in navigation [37], localization and
mapping [38], and object recognition [39]. Data fusion canalso be used in the environmental monitoring. For example,in [40], the environmental data are fused to detect a volcanicearthquake. In [41], gathered data are used to monitor theweather conditions. Inmedicine, data fusion ismainly used inthe analysis of medical images for location and identificationof tumors, abnormalities, and disease. In paper [42], datafusion is used for the brain diagnosis, in [43], the data fusion-based algorithm is applied to the breast cancer diagnosis, andin [44], an approach to recognize the anatomical brain objectis proposed.
In Figure 5, we present the data fusion in the contextof the sports training. At the first stage, the sports trainingis planned by taking into account the current sports per-formance, shape, mental preparation, skills, predispositions,abilities, and limitations of the athlete. Then, the trainingsession is monitored, and some data are gathered. Thegathered data are analyzed at the third stage by applying datafusionmethods.The first level of data fusion is used to obtainthe athlete’s parameters that cannot be measured directly.One of the examples is the estimation of the trainee’s bodyorientation on the basis of the data from the accelerometerand the gyroscope [26]. Another example is the estimationof the walking speed of the athlete [45, 46]. The walkingspeed can be estimated by fusing data from the accelerometerand the gyroscope and by applying the numerical integration.The second-level data fusion can be used to support sportstraining in case of noncommensurate data. At this level, itis possible to detect and to classify specific sports disciplinemovements, for example, strokes for tennis or swimming orthe swing motion in golf. The last level of data fusion is theleast known in the sports training. However, in paper [47],the authors showed that applying the data fusion at the thirdlevel can improve the overall accuracy of the classification.
Based on the data fusion-based analysis ofmeasurements,the adaptation of the sports training is performed (Figure 5).The adaptation of the sports training can be completedautomatically or semiautomatically. In the second case, thecoach is supporting the adjustment of the sports training.It can be seen that the fusion-based training process has aniterative nature.
4. Materials and Methods
4.1. Data Collection and Experimental Setup. In this paper,we apply data fusion methods to monitor the sports training.The proposed approach is validated experimentally on datacollected during the sessions of tennis training.
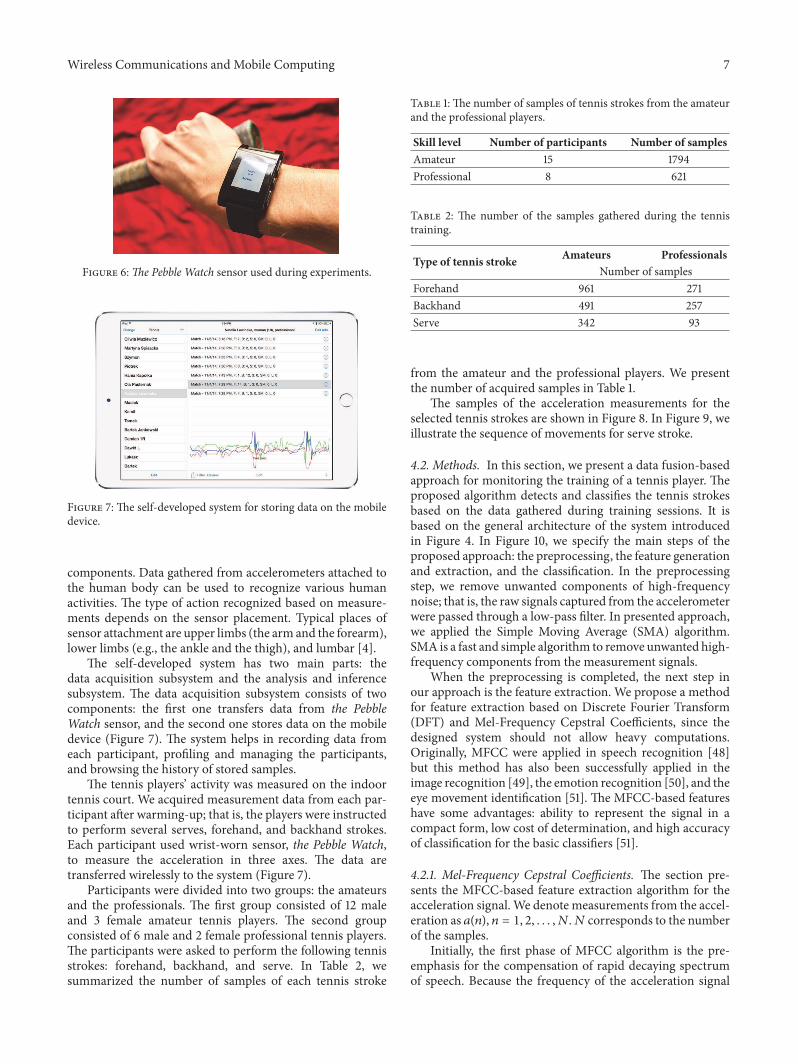
To test the proposed approach, we develop the system toacquire and to process the measurement data. The system isconnected with the wrist-worn Pebble Watch motion sensor(Figure 6). The Pebble Watch can measure the acceleration(from the three-axis accelerometer) and the strength of mag-netic field (from the three-axis magnetometer). The sensorcan measure the acceleration up to ±4 [G] with samplingfrequency of 10 Hz, 25 Hz, 50 Hz, and 100 Hz.
Accelerometers measure the change of velocity over timein a three-dimensional space. The measured accelerationsignals are composed of gravitational and body motion
6 Wireless Communications and Mobile Computing
Sensor 1 Sensor 2 Sensor N
Signal-Level Fusion[Kalman Filter, EKF, UKF, Particle Filter]
...
Preprocessing
Feature-Level Fusion[k-NN, Decision Trees, SVM, ANN, k-Means]
Decision-level fusion[Bayesian inference, Dempster-Shafer, fuzzy logic]
Domainspecific
knowledge
Fused state
Feature Extraction and Selection[time, frequency, time-frequency domain][filter and wrapper based feature selection]
Presentation[Charts, Plots, Tables]
Figure 4: The architecture of data fusion-based multisensory system (based on [32]).
Planning of thesports training
The training Measurements
Data Fusion
Visualization
Adaptation for thesports training’s plan
Figure 5: Data fusion in the context of sports training.
Wireless Communications and Mobile Computing 7
Figure 6:The Pebble Watch sensor used during experiments.
Figure 7: The self-developed system for storing data on the mobiledevice.
components. Data gathered from accelerometers attached tothe human body can be used to recognize various humanactivities. The type of action recognized based on measure-ments depends on the sensor placement. Typical places ofsensor attachment are upper limbs (the arm and the forearm),lower limbs (e.g., the ankle and the thigh), and lumbar [4].
The self-developed system has two main parts: thedata acquisition subsystem and the analysis and inferencesubsystem. The data acquisition subsystem consists of twocomponents: the first one transfers data from the PebbleWatch sensor, and the second one stores data on the mobiledevice (Figure 7). The system helps in recording data fromeach participant, profiling and managing the participants,and browsing the history of stored samples.
The tennis players’ activity was measured on the indoortennis court. We acquired measurement data from each par-ticipant after warming-up; that is, the players were instructedto perform several serves, forehand, and backhand strokes.Each participant used wrist-worn sensor, the Pebble Watch,to measure the acceleration in three axes. The data aretransferred wirelessly to the system (Figure 7).
Participants were divided into two groups: the amateursand the professionals. The first group consisted of 12 maleand 3 female amateur tennis players. The second groupconsisted of 6 male and 2 female professional tennis players.The participants were asked to perform the following tennisstrokes: forehand, backhand, and serve. In Table 2, wesummarized the number of samples of each tennis stroke
Table 1: The number of samples of tennis strokes from the amateurand the professional players.
Skill level Number of participants Number of samplesAmateur 15 1794Professional 8 621
Table 2: The number of the samples gathered during the tennistraining.
Type of tennis stroke Amateurs ProfessionalsNumber of samples
Forehand 961 271Backhand 491 257Serve 342 93
from the amateur and the professional players. We presentthe number of acquired samples in Table 1.
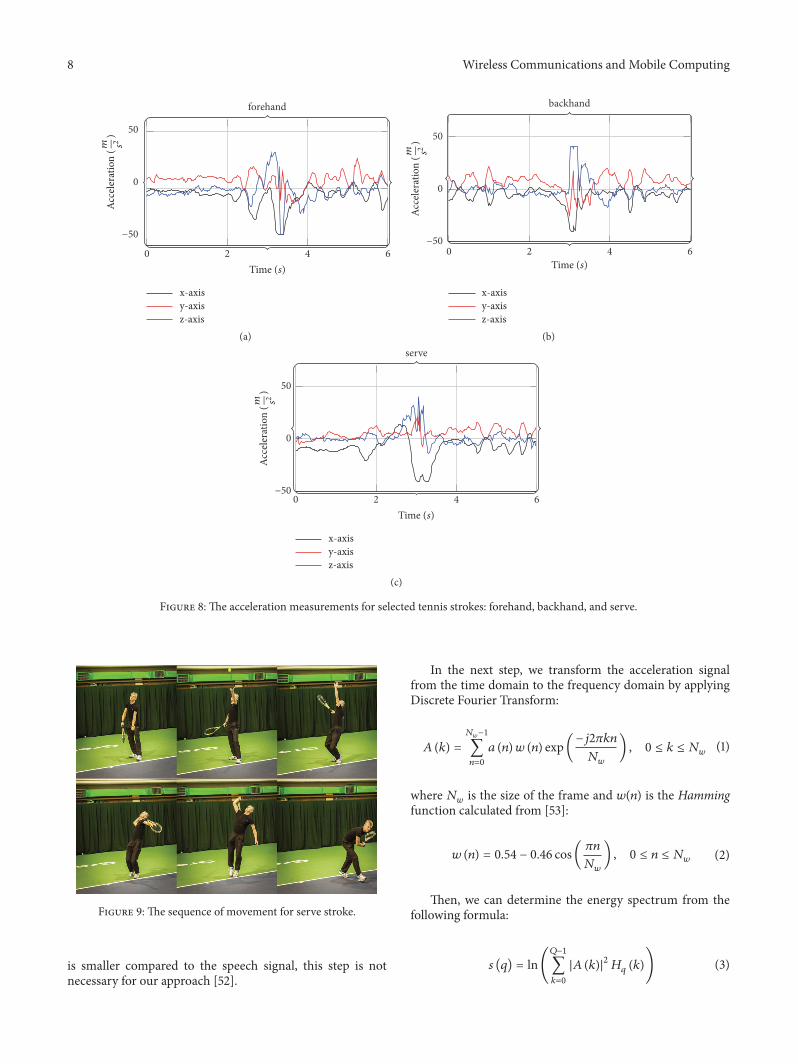
The samples of the acceleration measurements for theselected tennis strokes are shown in Figure 8. In Figure 9, weillustrate the sequence of movements for serve stroke.
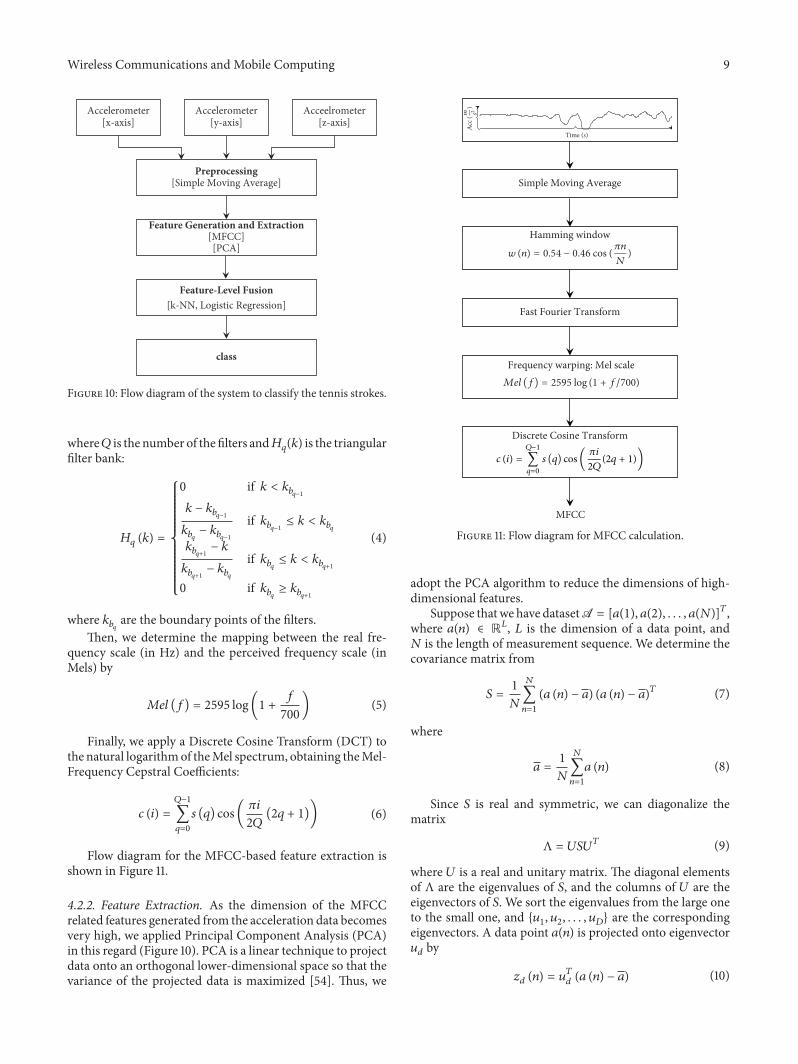
4.2. Methods. In this section, we present a data fusion-basedapproach for monitoring the training of a tennis player. Theproposed algorithm detects and classifies the tennis strokesbased on the data gathered during training sessions. It isbased on the general architecture of the system introducedin Figure 4. In Figure 10, we specify the main steps of theproposed approach: the preprocessing, the feature generationand extraction, and the classification. In the preprocessingstep, we remove unwanted components of high-frequencynoise; that is, the raw signals captured from the accelerometerwere passed through a low-pass filter. In presented approach,we applied the Simple Moving Average (SMA) algorithm.SMA is a fast and simple algorithm to remove unwanted high-frequency components from the measurement signals.
When the preprocessing is completed, the next step inour approach is the feature extraction. We propose a methodfor feature extraction based on Discrete Fourier Transform(DFT) and Mel-Frequency Cepstral Coefficients, since thedesigned system should not allow heavy computations.Originally, MFCC were applied in speech recognition [48]but this method has also been successfully applied in theimage recognition [49], the emotion recognition [50], and theeye movement identification [51]. The MFCC-based featureshave some advantages: ability to represent the signal in acompact form, low cost of determination, and high accuracyof classification for the basic classifiers [51].
4.2.1. Mel-Frequency Cepstral Coefficients. The section pre-sents the MFCC-based feature extraction algorithm for theacceleration signal. We denote measurements from the accel-eration as 𝑎(𝑛), 𝑛 = 1, 2, . . . , 𝑁.𝑁 corresponds to the numberof the samples.
Initially, the first phase of MFCC algorithm is the pre-emphasis for the compensation of rapid decaying spectrumof speech. Because the frequency of the acceleration signal
8 Wireless Communications and Mobile Computing
forehand
−50
0
50
Acce
lera
tion
(m s2)
x-axisy-axisz-axis
2 4 60Time (s)
(a)
−50
0
50
backhand
x-axisy-axisz-axis
Acce
lera
tion
(m s2)
0 2 4 6Time (s)
(b)serve
−50
0
50
Acce
lera
tion
(m s2)
x-axisy-axisz-axis
2 4 60Time (s)
(c)
Figure 8: The acceleration measurements for selected tennis strokes: forehand, backhand, and serve.
Figure 9: The sequence of movement for serve stroke.
is smaller compared to the speech signal, this step is notnecessary for our approach [52].
In the next step, we transform the acceleration signalfrom the time domain to the frequency domain by applyingDiscrete Fourier Transform:
𝐴 (𝑘) = 𝑁𝑤−1∑𝑛=0
𝑎 (𝑛) 𝑤 (𝑛) exp(−𝑗2𝜋𝑘𝑛𝑁𝑤 ) , 0 ≤ 𝑘 ≤ 𝑁𝑤 (1)
where 𝑁𝑤 is the size of the frame and 𝑤(𝑛) is the Hammingfunction calculated from [53]:
𝑤 (𝑛) = 0.54 − 0.46 cos( 𝜋𝑛𝑁𝑤) , 0 ≤ 𝑛 ≤ 𝑁𝑤 (2)
Then, we can determine the energy spectrum from thefollowing formula:
𝑠 (𝑞) = ln(𝑄−1∑𝑘=0
|𝐴 (𝑘)|2𝐻𝑞 (𝑘)) (3)
Wireless Communications and Mobile Computing 9
Accelerometer[x-axis]
Accelerometer[y-axis]
Acceelrometer[z-axis]
Preprocessing[Simple Moving Average]
class
Feature-Level Fusion[k-NN, Logistic Regression]
Feature Generation and Extraction[MFCC][PCA]
Figure 10: Flow diagram of the system to classify the tennis strokes.
where𝑄 is the number of the filters and𝐻𝑞(𝑘) is the triangularfilter bank:
𝐻𝑞 (𝑘) ={{{{{{{{{{{{{{{{{{{{{
0 if 𝑘 < 𝑘𝑏𝑞−1𝑘 − 𝑘𝑏𝑞−1𝑘𝑏𝑞 − 𝑘𝑏𝑞−1 if 𝑘𝑏𝑞−1 ≤ 𝑘 < 𝑘𝑏𝑞𝑘𝑏𝑞+1 − 𝑘
𝑘𝑏𝑞+1 − 𝑘𝑏𝑞 if 𝑘𝑏𝑞 ≤ 𝑘 < 𝑘𝑏𝑞+10 if 𝑘𝑏𝑞 ≥ 𝑘𝑏𝑞+1
(4)
where 𝑘𝑏𝑞 are the boundary points of the filters.Then, we determine the mapping between the real fre-
quency scale (in Hz) and the perceived frequency scale (inMels) by
𝑀𝑒𝑙 (𝑓) = 2595 log(1 + 𝑓700) (5)
Finally, we apply a Discrete Cosine Transform (DCT) tothe natural logarithmof theMel spectrum, obtaining theMel-Frequency Cepstral Coefficients:
𝑐 (𝑖) = 𝑄−1∑𝑞=0
𝑠 (𝑞) cos( 𝜋𝑖2𝑄 (2𝑞 + 1)) (6)
Flow diagram for the MFCC-based feature extraction isshown in Figure 11.
4.2.2. Feature Extraction. As the dimension of the MFCCrelated features generated from the acceleration data becomesvery high, we applied Principal Component Analysis (PCA)in this regard (Figure 10). PCA is a linear technique to projectdata onto an orthogonal lower-dimensional space so that thevariance of the projected data is maximized [54]. Thus, we
Simple Moving Average
Fast Fourier Transform
Discrete Cosine Transform
MFCC
Acc (
m s2)
Time (s)
Hamming window
w (n) = 0.54 − 0.46 =IM (n
N)
Frequency warping: Mel scaleMel (f) = 2595 FIA (1 + f/700)
c (i) =Q−1
∑q=0
s (q) =IM ( i
2Q(2q + 1))
Figure 11: Flow diagram for MFCC calculation.
adopt the PCA algorithm to reduce the dimensions of high-dimensional features.
Suppose thatwe have datasetA = [𝑎(1), 𝑎(2), . . . , 𝑎(𝑁)]𝑇,where 𝑎(𝑛) ∈ R𝐿, 𝐿 is the dimension of a data point, and𝑁 is the length of measurement sequence. We determine thecovariance matrix from
𝑆 = 1𝑁𝑁∑𝑛=1
(𝑎 (𝑛) − 𝑎) (𝑎 (𝑛) − 𝑎)𝑇 (7)
where
𝑎 = 1𝑁𝑁∑𝑛=1
𝑎 (𝑛) (8)
Since 𝑆 is real and symmetric, we can diagonalize thematrix
Λ = 𝑈𝑆𝑈𝑇 (9)
where 𝑈 is a real and unitary matrix. The diagonal elementsof Λ are the eigenvalues of 𝑆, and the columns of 𝑈 are theeigenvectors of 𝑆. We sort the eigenvalues from the large oneto the small one, and {𝑢1, 𝑢2, . . . , 𝑢𝐷} are the correspondingeigenvectors. A data point 𝑎(𝑛) is projected onto eigenvector𝑢𝑑 by
𝑧𝑑 (𝑛) = 𝑢𝑇𝑑 (𝑎 (𝑛) − 𝑎) (10)
10 Wireless Communications and Mobile Computing
The eigenvector 𝑢1 with the largest eigenvalue is calledthe principal component. The vector provides the best direc-tion of data projection. Similarly, the set of eigenvectors{𝑢1, 𝑢2, . . . , 𝑢𝐷} is used to transform the 𝐿-dimensional spaceto the𝐷-dimensional space.More details on the PCAmethodcan be found, for example, in [54].
4.2.3. Classification. In the presented approach, we appliedtwo different classifiers to fuse features, that is, k-NearestNeighbors and Logistic Regression algorithms. In our studies,we decided to compare k-NN with LR, since the first methoddoes not need a training process, while the second onerequires training. Also the chosen methods have relativelylow computational costs [54–57].
k-NN is a nonparametric distance-based supervised clas-sifier. This method is efficient and easy to implement. Theclassifier is based on the closest training examples in thefeature space [54] and has the form
𝑝𝑟 (𝑦 | 𝑎,D, 𝑅) = 1𝑅 ∑𝑖∈𝑁𝑅(𝑎,D)
I (𝑦𝑖) (11)
where D denotes training set of 𝑁 examples, 𝑅 correspondsto the number of the nearest points, 𝑁𝑅(𝑎,D) is the set ofindices of 𝑅 nearest points of 𝑎 in training set D, and I(𝑧) isthe indicator function.
I (𝑦) = {{{1 if 𝑦 is true
0 if 𝑦 is false(12)
LR is a generalization of the linear regression algorithm[58]. In this case, the linear combination of inputs is passedthrough a sigmoid function, and the Gaussian distributionis replaced by the Bernoulli distribution [58]. The generalformula for Logistic Regression is as follows:
𝑝𝑟 (𝑦 | 𝑎, ℎ) = 𝐵𝑒𝑟 (𝑦 | 𝑠𝑖𝑔𝑚 (ℎ𝑇𝑎)) (13)
where 𝐵𝑒𝑟(⋅) stands for Bernoulli distribution, ℎ denotes theweights, and 𝑠𝑖𝑔𝑚(⋅) is the sigmoid function.
We employ the training process for the sigmoid activationfunction. To this end, we optimize the following cost func-tion:
𝑄 (ℎ) = − 1𝑁𝑁∑𝑛=1
(𝑦 (𝑛) log 𝑠𝑖𝑔𝑚 (ℎ𝑇𝑎 (𝑛))+ (1 − 𝑦 (𝑛)) log (1 − 𝑠𝑖𝑔𝑚 (ℎ𝑇𝑎 (𝑛))))
(14)
where 𝑁 is the number of training examples, 𝑥(𝑛) is thetraining sample, and 𝑦(𝑛) is the corresponding correct label.We determine the parameters of LR by applying the GradientDescent optimization approach. More details on learningalgorithm for Logistic Regression can be found, for example,in [58].
5. Experimental Results and Discussion
The proposed algorithm is evaluated on data gathered duringthe tennis training sessions. The dataset contains the labeled
three-axis acceleration measurements captured for serve,backhand, and forehand strokes using the wrist-worn sensor,the Pebble Watch (Section 4.1).
In the performance analysis of the proposed approach,we applied both 10-fold cross-validation and leave-one-outmethods. The cross-validation-based evaluation techniquemeans that the data from each participant is used in trainingand testing stages.The leave-one-out technique aims to provethe performance of the algorithm for the new user. In ourexperiments, we applied one of the versions of this approach,that is,user-independent. In this case, data provided by the testuser is evaluated based on the training data acquired from theother participants.
To measure the performance of the proposed approach,we applied the accuracy metric. It is the standard metricto summarize the overall performance of the classifier. Theaccuracy metric is defined as follows.
𝐴𝑐𝑐𝑢𝑟𝑎𝑐𝑦 = correct predictionstotal predictions (15)
where correct predictions correspond to the number of correctpredictions and total predictions are the total number ofpredictions.
In this study, the features are generated by the MFCC-based features generator, while PCA was applied as themethod to reduce their number.We evaluate the performanceof the proposed fusion-based approach for two classifiers: k-NN and Logistic Regression.
In the next subsections, we study the effects of the featurevector size, the window size, and the MFCC-based featuresvector on the performance of the proposed approach.We alsoanalyze the performance of the proposed algorithm applyingthe cross-validation and leave-one-out techniques.
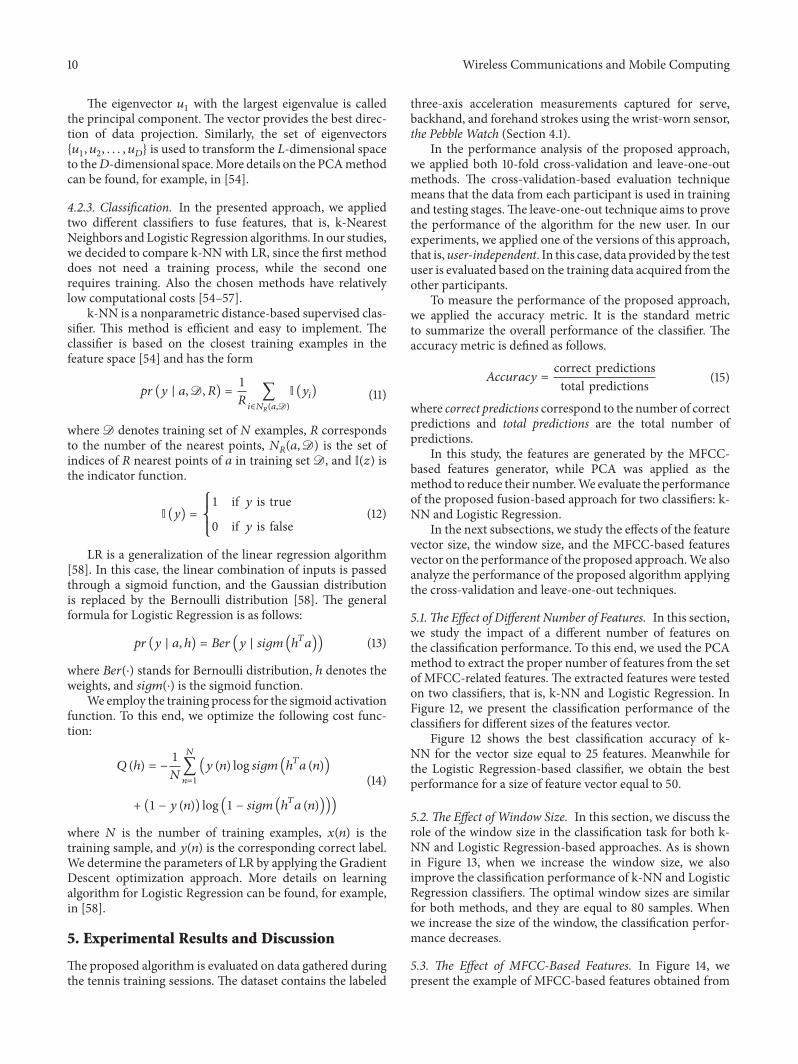
5.1.The Effect of Different Number of Features. In this section,we study the impact of a different number of features onthe classification performance. To this end, we used the PCAmethod to extract the proper number of features from the setof MFCC-related features. The extracted features were testedon two classifiers, that is, k-NN and Logistic Regression. InFigure 12, we present the classification performance of theclassifiers for different sizes of the features vector.
Figure 12 shows the best classification accuracy of k-NN for the vector size equal to 25 features. Meanwhile forthe Logistic Regression-based classifier, we obtain the bestperformance for a size of feature vector equal to 50.
5.2. The Effect of Window Size. In this section, we discuss therole of the window size in the classification task for both k-NN and Logistic Regression-based approaches. As is shownin Figure 13, when we increase the window size, we alsoimprove the classification performance of k-NN and LogisticRegression classifiers. The optimal window sizes are similarfor both methods, and they are equal to 80 samples. Whenwe increase the size of the window, the classification perfor-mance decreases.
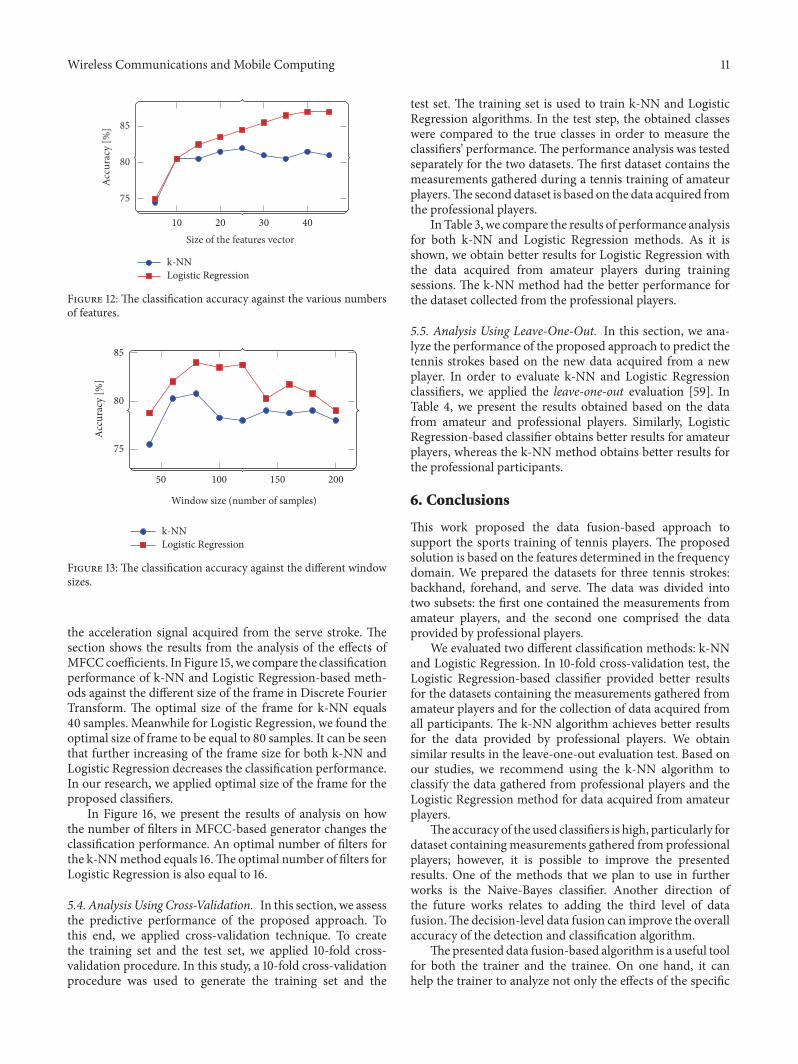
5.3. The Effect of MFCC-Based Features. In Figure 14, wepresent the example of MFCC-based features obtained from
Wireless Communications and Mobile Computing 11
75
80
85
Accu
racy
[%]
k-NNLogistic Regression
Size of the features vector40302010
Figure 12: The classification accuracy against the various numbersof features.
75
80
85
Accu
racy
[%]
k-NNLogistic Regression
Window size (number of samples)
150 20050 100
Figure 13: The classification accuracy against the different windowsizes.
the acceleration signal acquired from the serve stroke. Thesection shows the results from the analysis of the effects ofMFCCcoefficients. In Figure 15, we compare the classificationperformance of k-NN and Logistic Regression-based meth-ods against the different size of the frame in Discrete FourierTransform. The optimal size of the frame for k-NN equals40 samples. Meanwhile for Logistic Regression, we found theoptimal size of frame to be equal to 80 samples. It can be seenthat further increasing of the frame size for both k-NN andLogistic Regression decreases the classification performance.In our research, we applied optimal size of the frame for theproposed classifiers.
In Figure 16, we present the results of analysis on howthe number of filters in MFCC-based generator changes theclassification performance. An optimal number of filters forthe k-NNmethod equals 16.The optimal number of filters forLogistic Regression is also equal to 16.
5.4. Analysis Using Cross-Validation. In this section, we assessthe predictive performance of the proposed approach. Tothis end, we applied cross-validation technique. To createthe training set and the test set, we applied 10-fold cross-validation procedure. In this study, a 10-fold cross-validationprocedure was used to generate the training set and the
test set. The training set is used to train k-NN and LogisticRegression algorithms. In the test step, the obtained classeswere compared to the true classes in order to measure theclassifiers’ performance.The performance analysis was testedseparately for the two datasets. The first dataset contains themeasurements gathered during a tennis training of amateurplayers.The second dataset is based on the data acquired fromthe professional players.
In Table 3, we compare the results of performance analysisfor both k-NN and Logistic Regression methods. As it isshown, we obtain better results for Logistic Regression withthe data acquired from amateur players during trainingsessions. The k-NN method had the better performance forthe dataset collected from the professional players.
5.5. Analysis Using Leave-One-Out. In this section, we ana-lyze the performance of the proposed approach to predict thetennis strokes based on the new data acquired from a newplayer. In order to evaluate k-NN and Logistic Regressionclassifiers, we applied the leave-one-out evaluation [59]. InTable 4, we present the results obtained based on the datafrom amateur and professional players. Similarly, LogisticRegression-based classifier obtains better results for amateurplayers, whereas the k-NN method obtains better results forthe professional participants.
6. Conclusions
This work proposed the data fusion-based approach tosupport the sports training of tennis players. The proposedsolution is based on the features determined in the frequencydomain. We prepared the datasets for three tennis strokes:backhand, forehand, and serve. The data was divided intotwo subsets: the first one contained the measurements fromamateur players, and the second one comprised the dataprovided by professional players.
We evaluated two different classification methods: k-NNand Logistic Regression. In 10-fold cross-validation test, theLogistic Regression-based classifier provided better resultsfor the datasets containing the measurements gathered fromamateur players and for the collection of data acquired fromall participants. The k-NN algorithm achieves better resultsfor the data provided by professional players. We obtainsimilar results in the leave-one-out evaluation test. Based onour studies, we recommend using the k-NN algorithm toclassify the data gathered from professional players and theLogistic Regression method for data acquired from amateurplayers.
The accuracy of the used classifiers is high, particularly fordataset containingmeasurements gathered from professionalplayers; however, it is possible to improve the presentedresults. One of the methods that we plan to use in furtherworks is the Naive-Bayes classifier. Another direction ofthe future works relates to adding the third level of datafusion.The decision-level data fusion can improve the overallaccuracy of the detection and classification algorithm.
The presented data fusion-based algorithm is a useful toolfor both the trainer and the trainee. On one hand, it canhelp the trainer to analyze not only the effects of the specific

12 Wireless Communications and Mobile Computing
2 4 6 2 4 6 2 4 6
2 4 62 4 62 4 6
2 4 6 2 4 6 2 4 6
− 40− 20
02040
Time (s)
Acceleration in x-axis
2468
10
Time (s)
Chan
nel i
ndex
Log (mel) filter bank energies
2468
Time (s)
Cep
strum
inde
x
Mel frequency cepstrum
− 200
2040
Time (s)
Acceleration in y-axis
2468
10
Time (s)Ch
anne
l ind
ex
Log (mel) filter bank energies
2468
Time (s)
Cep
strum
inde
xMel frequency cepstrum
− 40− 20
02040
Time (s)
Acceleration in z-axis
2468
10
Time (s)
Chan
nel i
ndex
Log (mel) filter bank energies
2468
Time (s)
Cep
strum
inde
x
Mel frequency cepstrum
Acce
lera
tion
(m s2)
Acce
lera
tion
(m s2)
Acce
lera
tion
(m s2)
Figure 14: The MFCC coefficients of the acceleration measured for the serve stroke.
Table 3: The results of classification for k-NN and Logistic Regression algorithms in 10-fold cross-validation evaluation.
Classification method Amateurs Professionals Amateurs and professionalsAccuracy [%]
k-NN 79.65 ± 11.36 91.33 ± 10.56 82.22 ± 11.30Logistic Regression 85.55 ± 8.24 88.44 ± 11.12 87.99 ± 8.48
50 200150100
70
80
Size of the frame (number of samples)
Accu
racy
[%]
k-NNLogistic Regression
Figure 15: The classification accuracy against the different sizes offrame (parameter 𝑁𝑤) in DFT.
training session but also the trends in a sequence of trainingsessions. On the other hand, it can be used by the traineein self-training, for example, to count tennis strokes duringeach training session. In summary, the data fusion in sports
10 40302075
80
85
Number of filters
Accu
racy
[%]
k-NNLogistic Regression
Figure 16: The classification accuracy against the different numberof filters (parameter 𝑄).
training provides new procedures to process and to analyzethe sports training data.
In the future work, wewill addmore tennis strokes, whichcan be detected and classified by the proposed method. We

Wireless Communications and Mobile Computing 13
Table 4: The results of classification for k-NN and Logistic Regression algorithms in leave-one-out evaluation.
Classification method Amateurs Professionals Amateurs and professionalsAccuracy [%]
k-NN 81.96 ± 10.54 92.22 ± 12.22 82.16 ± 9.79Logistic Regression 85.12 ± 5.16 88.66 ± 12.37 87.16 ± 6.86
also plan new algorithms extending the systems’ functionali-ties that support the analysis of the tennis strokes.
Data Availability
The dataset used in the research can be downloaded fromhttps://www.ii.pwr.edu.pl/∼krzysztof.brzostowski/files/Tenisdataset.zip.
Conflicts of Interest
The authors declare that they have no conflicts of interest.
References
[1] J. Fister, K. Ljubic, P. N. Suganthan, M. z. Perc, and I. Fister,“Computational intelligence in sports: challenges and opportu-nities within a new research domain,” Applied Mathematics andComputation, vol. 262, pp. 178–186, 2015.
[2] D. F. Whelan, M. A. O’Reilly, T. E. Ward, E. Delahunt, and B.Caulfield, “Technology in rehabilitation: Evaluating the singleleg squat exercise with wearable inertial measurement units,”Methods of Information in Medicine, vol. 56, no. 2, pp. 88–94,2017.
[3] D. Zahradnik and P. Korvas, The Introduction into SportsTraining, Masaryk University, Brno, Czech Republic, 2012.
[4] J. J. A. Mendes, M. E. Vieira, M. B. Pires, and S. L. Stevan,“Sensor fusion and smart sensor in sports and biomedicalapplications,” Sensors, vol. 16, no. 10, 2016.
[5] F. R. Al-Osaimi, “A novel multi-purpose matching representa-tion of local 3D surfaces: a rotationally invariant, efficient, andhighly discriminative approach with an adjustable sensitivity,”IEEE Transactions on Image Processing, vol. 25, no. 2, pp. 658–672, 2016.
[6] A. Ahmadi, E. Mitchell, C. Richter et al., “Toward automaticactivity classification andmovement assessment during a sportstraining session,” IEEE Internet ofThings Journal, vol. 2, no. 1, pp.23–32, 2015.
[7] P. Siirtola, P. Laurinen, J. Roning, and H. Kinnunen, “Efficientaccelerometer-based swimming exercise tracking,” in Proceed-ings of the IEEE Symposium on Computational Intelligence andData Mining (CIDM ’11), pp. 156–161, 2011.
[8] R. Burchfield and S. Venkatesan, “A framework for golf trainingusing low-cost inertial sensors,” in Proceedings of the 2010International Conference on Body Sensor Networks, BSN 2010,pp. 267–272, sgp, June 2010.
[9] A. Ahmadi, D. Rowlands, andD. A. James, “Towards a wearabledevice for skill assessment and skill acquisition of a tennis playerduring the first serve,” Sports Engineering, vol. 2, no. 3-4, pp.129–136, 2010.
[10] D. L. Hall and J. Llinas, “An introduction to multisensor datafusion,” Proceedings of the IEEE, vol. 85, no. 1, pp. 6–23, 1997.
[11] O. D. Lara and M. A. Labrador, “A survey on human activityrecognition using wearable sensors,” IEEE CommunicationsSurveys & Tutorials, vol. 15, no. 3, pp. 1192–1209, 2013.
[12] M. Munoz-Organero and A. Lotfi, “Human movement recog-nition based on the stochastic characterisation of accelerationdata,” Sensors, vol. 16, no. 9, 2016.
[13] Adidas. Micoach, April 2018.[14] Nike. Nike+, April 2018.[15] Y. Iijima, K. Watanabe, K. Kobayashi, and Y. Kurihara, “Mea-
surement and analysis of tennis swing motion using 3D gyrosensor,” in Proceedings of the SICE Annual Conference, pp. 274–277, 2010.
[16] A. Ahmadi, D. D. Rowlands, and D. A. James, “Investigating thetranslational and rotational motion of the swing using acceler-ometers for athlete skill assessment,” in Proceedings of the 20065th IEEEConference on Sensors, pp. 980–983, kor,October 2006.
[17] A. Ahmadi, D. D. Rowlands, and D. A. James, “Developmentof inertial and novel marker-based techniques and analysis forupper arm rotational velocity measurements in tennis,” SportsEngineering, vol. 12, no. 4, pp. 179–188, 2010.
[18] Indiegogo. Pivot, April 2018.[19] Babolatplay. Babolat pop, April 2018.[20] M. Sharma, R. Srivastava, A. Anand, D. Prakash, and L.
Kaligounder, “Wearable motion sensor based phasic analysis oftennis serve for performance feedback,” in Proceedings of theIEEE International Conference on Acoustics, Speech, and SignalProcessing (ICASSP ’17), pp. 5945–5949, 2017.
[21] D. Connaghan, P. Kelly, N. E. O’Connor, M. Gaffney, M.Walsh, and C. O’Mathuna, “Multi-sensor classification of tennisstrokes,” in Proceedings of the IEEE Sensors, pp. 1437–1440, 2011.
[22] W. Pei, J. Wang, X. Xu, Z. Wu, and X. Du, “An embedded 6-axissensor based recognition for tennis stroke,” in Proceedings ofthe 2017 IEEE International Conference on Consumer Electronics(ICCE ’17), pp. 55–58, January 2017.
[23] M. Kos, J. Zenko, D. Vlaj, and I. Kramberger, “Tennis strokedetection and classification using miniature wearable IMUdevice,” in Proceedings of the 23rd International Conference onSystems, Signals and Image Processing, IWSSIP 2016, pp. 1–4,2016.
[24] L. Jiao, H. Wu, R. Bie, A. Umek, and A. Kos, “Multi-sensor GolfSwing Classification Using Deep CNN,” Procedia ComputerScience, vol. 129, pp. 59–65, 2018.
[25] C. O. Conaire, D. Connaghan, P. Kelly, N. E. O’Connor, M.Gaffney, and J. Buckley, “Combining inertial and visual sensingfor human action recognition in tennis,” in Proceedings of thefirst ACM international workshop on Analysis and retrieval oftracked events and motion in imagery streams, pp. 51–56, 2010.
[26] Y. Zhang, K. Chen, and J. Yi, “Rider trunk and bicycle pose esti-mation with fusion of force/inertial sensors,” IEEE Transactionson Biomedical Engineering, vol. 60, no. 9, pp. 2541–2551, 2013.
[27] B. Khaleghi, A. Khamis, and F. Karray, “Multisensor datafusion,” Algorithms and Architectural Design to Applications, 15pages, 2015.

14 Wireless Communications and Mobile Computing
[28] R. Gravina, P. Alinia, H. Ghasemzadeh, and G. Fortino, “Multi-sensor fusion in body sensor networks: State-of-the-art andresearch challenges,” Information Fusion, vol. 35, pp. 1339–1351,2017.
[29] W. Elmenreich, An Introduction to Sensor Fusion, ViennaUniversity of Technology, Austria, 2002.
[30] l. Wald, Data Fusion: Definitions And Architectures: Fusion ofImages of Different Spatial Resolutions, Presses des MINES,2002.
[31] J. Llinas, D. L Hall, and M. E Liggins, Handbook of MultisensorData Fusion: Theory and Practice, CRC Press, 2009.
[32] R. C. King, E. Villeneuve, R. J. White, R. S. Sherratt, W. Holder-baum, andW. S. Harwin, “Application of data fusion techniquesand technologies for wearable health monitoring,” MedicalEngineering & Physics, vol. 42, pp. 1–12, 2017.
[33] G. Z. Yang and M. Yacoub, Body Sensor Networks, Springer,2006.
[34] A. K. Chowdhury, D. Tjondronegoro, V. Chandran, and S. G.Trost, “Physical Activity Recognition Using Posterior-AdaptedClass-Based Fusion of Multiaccelerometer Data,” IEEE Journalof Biomedical andHealth Informatics, vol. 22, no. 3, pp. 678–685,2018.
[35] M. Liggins, D. Hall, and J. Llinas,Handbook ofMultisensor DataFusion: Theory And Practice, CRC press, 2017.
[36] O. Basir andX.H. Yuan, “Engine fault diagnosis based onmulti-sensor information fusion using Dempster-Shafer evidencetheory,” Information Fusion, vol. 8, no. 4, pp. 379–386, 2007.
[37] M. Kam, X. Zhu, and P. Kalata, “Sensor fusion for mobile robotnavigation,” Proceedings of the IEEE, vol. 85, no. 1, pp. 108–119,1997.
[38] J. Kelly and G. S. Sukhatme, “Visual-inertial sensor fusion:Localization, mapping and sensor-to-sensor Self-calibration,”International Journal of Robotics Research, vol. 30, no. 1, pp. 56–79, 2011.
[39] K. Bernardin, K. Ogawara, K. Ikeuchi, and R. Dillmann, “A sen-sor fusion approach for recognizing continuous human grasp-ing sequences using hiddenMarkovmodels,” IEEE Transactionson Robotics, vol. 21, no. 1, pp. 47–57, 2005.
[40] R. Tan, G. Xing, J. Chen,W. Song, and R. Huang, “Fusion-basedvolcanic earthquake detection and timing in wireless sensornetworks,” ACM Transactions on Sensor Networks, vol. 9, no. 2,pp. 1–25, 2013.
[41] L. Snidaro, R. Niu, P. K. Varshney, and G. L. Foresti, “Automaticcamera selection and fusion for outdoor surveillance underchanging weather conditions,” in Proceedings of the IEEE Con-ference on Advanced Video and Signal Based Surveillance (AVSS’03), pp. 364–369, 2003.
[42] G. K. Matsopoulos, S. Marshall, and J. N. H. Brunt, “Multires-olution morphological fusion of MR and CT images of thehuman brain,” IEE Proceedings Vision, Image and Signal Process-ing, vol. 141, no. 3, pp. 137–142, 1994.
[43] M. Raza, I. Gondal, D. Green, and R. L. Coppel, “Classifierfusion to predict breast cancer tumors based on microarraygene expression data,” inProceedings of the International Confer-ence on Knowledge-Based and Intelligent Information and Engi-neering Systems, pp. 866–874, Springe.
[44] H. Li, R. Deklerck, B. De Cuyper, E. Nyssen, J. Cornelis, andA. Hermanus, “Object Recognition in Brain CT-Scans: Know-ledge-Based Fusion of Data from Multiple Feature Extractors,”IEEE Transactions on Medical Imaging, vol. 14, no. 2, pp. 212–229, 1995.
[45] K. Brzostowski, “Novel approach to human walking speedenhancement based on drift estimation,” Biomedical SignalProcessing and Control, vol. 42, pp. 18–29, 2018.
[46] K. Brzostowski, “Toward the Unaided Estimation of HumanWalking Speed Based on Sparse Modeling,” IEEE Transactionson Instrumentation and Measurement, vol. 67, no. 6, pp. 1389–1398, 2018.
[47] W. Zhang and Z. Zhang, “Belief function based decision fusionfor decentralized target classification in wireless sensor net-works,” Sensors, vol. 15, no. 8, pp. 20524–20540, 2015.
[48] T. Fukada, K. Tokuda, T. Kobayashi, and S. Imai, “An adaptivealgorithm for mel-cepstral analysis of speech,” in Proceedingsof the 1992 International Conference on Acoustics, Speech, andSignal Processing (ICASSP ’92), vol. 1, pp. 137–140, 1992.
[49] M. M. M. Fahmy, “Palmprint recognition based on Mel fre-quency Cepstral coefficients feature extraction,” Ain ShamsEngineering Journal, vol. 1, no. 1, pp. 39–47, 2010.
[50] N. Sato and Y. Obuchi, “Emotion recognition using mel-fre-quency cepstral coefficients,” Information and Media Technolo-gies, vol. 2, no. 3, pp. 835–848, 2007.
[51] N. V. Cuong, V. Dinh, and L. S. T. Ho, “Mel-frequency cepstralcoefficients for eye movement identification,” in Proceedings ofthe IEEE 24th International Conference on Tools with ArtificialIntelligence (ICTAI ’12), vol. 1, pp. 253–260, 2012.
[52] R. San-Segundo, J. M.Montero, R. Barra-Chicote, F. Fernandez,and J. M. Pardo, “Feature extraction from smartphone inertialsignals for human activity segmentation,” Signal Processing, vol.120, pp. 359–372, 2016.
[53] L. D. Enochson and K. R. Otnes, “Programming and analysisfor digital time series data,” DTIC Document, 1968.
[54] R. O. Duda, P. E. Hart, and D. G. Stork, Pattern Classification,John Wiley & Sons, 2012.
[55] S. Dreiseitl and L. Ohno-Machado, “Logistic regression andartificial neural network classification models: a methodologyreview,” Journal of Biomedical Informatics, vol. 35, no. 5-6, pp.352–359, 2002.
[56] C. M. Bishop, Pattern Recognition and Machine Learning,Springer, New York, NY, USA, 2006.
[57] T.-S. Lim,W.-Y. Loh, and Y.-S. Shih, “Comparison of predictionaccuracy, complexity, and training time of thirty-three old andnew classification algorithms,”Machine Learning, vol. 40, no. 3,pp. 203–228, 2000.
[58] K. P Murphy, Machine Learning: A Probabilistic Perspective,MIT press, 2012.
[59] R. Kohavi, “A study of cross-validation and bootstrap for accu-racy estimation and model selection,” in Proceedings of the 14thInternational Joint Conference on Artificial Intelligence (IJCAI’95), vol. 14, pp. 1137–1145, Montreal, Canada, August 1995.

International Journal of
AerospaceEngineeringHindawiwww.hindawi.com Volume 2018
RoboticsJournal of
Hindawiwww.hindawi.com Volume 2018
Hindawiwww.hindawi.com Volume 2018
Active and Passive Electronic Components
VLSI Design
Hindawiwww.hindawi.com Volume 2018
Hindawiwww.hindawi.com Volume 2018
Shock and Vibration
Hindawiwww.hindawi.com Volume 2018
Civil EngineeringAdvances in
Acoustics and VibrationAdvances in
Hindawiwww.hindawi.com Volume 2018
Hindawiwww.hindawi.com Volume 2018
Electrical and Computer Engineering
Journal of
Advances inOptoElectronics
Hindawiwww.hindawi.com
Volume 2018
Hindawi Publishing Corporation http://www.hindawi.com Volume 2013Hindawiwww.hindawi.com
The Scientific World Journal
Volume 2018
Control Scienceand Engineering
Journal of
Hindawiwww.hindawi.com Volume 2018
Hindawiwww.hindawi.com
Journal ofEngineeringVolume 2018
SensorsJournal of
Hindawiwww.hindawi.com Volume 2018
International Journal of
RotatingMachinery
Hindawiwww.hindawi.com Volume 2018
Modelling &Simulationin EngineeringHindawiwww.hindawi.com Volume 2018
Hindawiwww.hindawi.com Volume 2018
Chemical EngineeringInternational Journal of Antennas and
Propagation
International Journal of
Hindawiwww.hindawi.com Volume 2018
Hindawiwww.hindawi.com Volume 2018
Navigation and Observation
International Journal of
Hindawi
www.hindawi.com Volume 2018
Advances in
Multimedia
Submit your manuscripts atwww.hindawi.com