data for monitoring integration: gaps, challenges … · we wish to thank brendan o’brien for...
TRANSCRIPT

Migrant Integration Strategy 2017-2020
March 2019
DATA FOR MONITORING INTEGRATION: GAPS, CHALLENGES AND OPPORTUNITIES Éamonn Fahey, Frances McGinnity and Emma Quinn

Funded by the Office for the Promotion of Migrant Integration in line with the Migrant Integration Strategy 2017-2020

DATA FOR MONITORING INTEGRATION: GAPS, CHALLENGES AND OPPORTUNITIES
Éamonn Fahey
Frances McGinnity
Emma Quinn
March 2019
Economic and Social Research Institute;
Office for the Promotion of Migrant Integration
Available to download from www.esri.ie
The Economic and Social Research Institute Whitaker Square, Sir John Rogerson’s Quay, Dublin 2
ISBN 978-0-7070-0483-9
DOI https://doi.org/10.26504/bkmnext373.pdf
This Open Access work is licensed under a Creative Commons Attribution 4.0 International License (https://creativecommons.org/licenses/by/4.0/), which permits unrestricted use, distribution, and reproduction in any medium, provided the original work is properly credited.


FOREWORD
Diversity has become an integral part of Irish life, with almost 12 per cent of people living here having a nationality other than Irish. We must be prepared to embrace this growing diversity and look for ways to increase the benefits that it can bring to Irish society.
Ireland’s National Migrant Integration Strategy is one way in which we are trying to remove barriers to fully realising the potential and opportunities that diversity can bring. The Strategy is underpinned by the vision that migrants are facilitated to play a full role in Irish society, that integration is a core principle of Irish life and that Irish society and institutions work together to promote integration.
The Strategy recognises the need for research and data to understand how mainstream services are meeting migrant needs. Reliable information and data is essential to being able to develop appropriate responses to challenges and barriers that are faced by those who are trying to build their lives in Ireland and become fully integrated into Irish society.
The Department of Justice and Equality has funded a research programme with the ESRI in order to ensure that this information is readily available. The first report from this research programme, published in November 2018, was the Monitoring Report on Integration 2018, which has already proved to be extremely useful in pinpointing key areas of concern that require further focus and engagement.
In addition to developing further evidence regarding integration outcomes, we need to develop a better understanding of the data that is already available. This second report of the research programme, the Data for Monitoring Integration report, was developed in response to this need. The report provides a critical overview of the information already available and where there are perhaps gaps that need to be addressed. The development of the report has been supported by a working group, established under the Migrant Integration Strategy. The group sought to identify and address the gaps in data relating to migrant integration that is available across government departments and agencies.
Our formulation of policy responses depends on reliable and comprehensive information. Understanding the strengths and limitations of this information and the gaps is another critical piece in the puzzle that is essential to enabling the development of a diverse and welcoming society in Ireland. I welcome this report.
David Stanton, TD Minister of State at the Department of Justice and Equality with special responsibility for Equality, Immigration and Integration.

THE AUTHORS
Éamonn Fahey is a Research Assistant at the ESRI. Frances McGinnity is an Associate Research Professor at the ESRI and Adjunct Professor at Trinity College Dublin (TCD). Emma Quinn is Head of the Irish National Contact Point of the European Migration Network (EMN), within the ESRI.
ACKNOWLEDGEMENTS
This report was completed as part of a programme of research on Equality and Integration funded by the Office for the Promotion of Migrant Integration (OPMI) within the Department of Justice and Equality (DJE). We would like to express our thanks to the members of the steering group for the programme – Úna Ní Dhubhghaill (Office for the Promotion of Migrant Integration), Gurchand Singh (Department of Justice and Equality), Bryan Fanning (University College Dublin) and Ann Marie McGauran (National Economic and Social Council). We thank our ESRI colleagues who also reviewed the draft report, an external reviewer and Emer Smyth, who acted as editor.
We would also like to extend our thanks to officials from the Reporting and Analysis Unit, Visa Unit, Family Reunification Unit, Registration Office and International Protection Office within the Irish Naturalisation and Immigration Service; the Reception and Integration Agency; the Central Statistics Office; the Department of Education and Skills; the Department of Employment Affairs and Social Protection; the Department of Business, Enterprise and Innovation; the Department of Health; and the Department of Housing, Planning and Local Government. We also acknowledge the assistance of Pobal; the Education Research Centre; the Garda Racial, Intercultural & Diversity Office; the Immigrant Council of Ireland; and ESRI colleagues who provided assistance. We wish to thank Brendan O’Brien for copyediting the report and Sarah Burns for managing its publication.
This report has been accepted for publication by the Institute, which does not itself take institutional policy positions. All ESRI Research Series reports are peer reviewed prior to publication. The author(s) are solely responsible for the content and the views expressed.


CONTENTS
Executive Summary .................................................................................................................................. i
Survey data .......................................................................................................................................... i
Administrative data on immigrants and immigration ....................................................................... iii
Administrative data on mainstreamed integration ........................................................................... iv
Chapter 1: Introduction .......................................................................................................................... 1
1.1 Scope ....................................................................................................................................... 1
1.2 Procedure ................................................................................................................................ 4
1.3 Outline of the report ............................................................................................................... 5
Chapter 2: Survey data for migrant integration ..................................................................................... 7
2.1 General population surveys ..................................................................................................... 7
2.1.1 Ongoing major surveys ................................................................................................... 7
2.1.2 Other surveys in Ireland ................................................................................................ 11
2.2 Migrant surveys ..................................................................................................................... 11
2.2.1 Survey of migrants’ experience of racism and discrimination in Ireland...................... 12
2.2.2 Causes and consequences of socio-cultural integration processes among new immigrants in Europe (SCIP) ......................................................................................................... 13
2.3 Strengths and opportunities of survey data .......................................................................... 14
2.4 Challenges and potential for improvement of survey data .................................................. 15
2.4.1 Small and unrepresentative samples of minorities ...................................................... 15
2.4.2 Measuring naturalised Irish citizens and the second generation ................................. 17
Chapter 2 Appendix – Main survey data relating to migrant integration in Ireland ........................ 19
Chapter 3: Administrative data – Irish Naturalisation and Immigration Service, Department of Justice and Equality .......................................................................................................................................... 21
3.1 Administrative data collected................................................................................................ 21
3.1.1 Residence permits issued .............................................................................................. 22
3.1.2 Protection-related data ................................................................................................. 22
3.1.3 Other INIS data .............................................................................................................. 23
3.2 Strengths and opportunities of Department of Justice and Equality administrative data ... 24
3.3 Challenges and potential for improvement: Department of Justice and Equality administrative data ........................................................................................................................... 25
3.3.1 Lack of a migrant register ............................................................................................. 25
3.3.2 Limitations of residence permit data ............................................................................ 26
3.3.3 Data on applications for and beneficiaries of international protection ....................... 27

3.3.5 Other ............................................................................................................................. 29
Chapter 3 Appendix – Administrative data relating to migrant integration (Department of Justice and Equality) ..................................................................................................................................... 30
Chapter 4: Administrative data – other departments .......................................................................... 33
4.1 Mainstreamed integration data collected ............................................................................. 33
4.1.1 Department of Education and Skills (DES) .................................................................... 33
4.1.2 Department of Health ................................................................................................... 35
4.1.3 Labour market data (DBEI and DEASP) ......................................................................... 37
4.1.4 GRIDO ............................................................................................................................ 39
4.1.5 Administrative data held by other government departments ..................................... 40
4.2 Strengths and opportunities of mainstreamed administrative data .......................................... 41
4.3 Challenges and potential for improvement of mainstreamed administrative data ................... 44
Chapter 4 Appendix – Administrative data relating to migrant integration ..................................... 47
Chapter 5: Data summary: strengths, gaps and challenges.................................................................. 51
5.1 Survey data sources ............................................................................................................... 51
5.2 Administrative data sources .................................................................................................. 53
5.2.1 Data held by the Department of Justice and Equality .................................................. 53
5.2.2 Administrative data held elsewhere ............................................................................. 54
5.3 Avenues for further research ................................................................................................ 56
References ............................................................................................................................................ 59
ABBREVIATIONS
AISIP Asylum and Immigration Strategic Integration Programme
CSO Central Statistics Office
DBEI Department of Business, Enterprise and Innovation
DEASP Department of Employment Affairs and Social Protection
DES Department of Education and Skills
DHPLG Department of Housing, Planning and Local Government
EEA European Economic Area
ELO Ethnic Liaison Officer
ERC Educational Research Centre
EROC Emergency Reception and Orientation Centre
EUMC European Union Monitoring Centre on Racism and Xenophobia
FET Further Education and Training
GNIB Garda National Immigration Bureau
GNIB-IS Garda National Immigration Bureau Information System
GRIDO Garda Racial, Intercultural & Diversity Office
HEA Higher Education Authority
HIPE Hospital In-Patient Enquiry
HIQA Health Information and Quality Authority
HPSC Health Protection Surveillance Centre
HSE Health Service Executive
INIS Irish Naturalisation and Immigration Service
IPAT International Protection Appeals Tribunal
IPO International Protection Office
IPUMS Integrated Public-Use Microdata Series
IRIS Integrated Reporting and Information System
IRPP Irish Refugee Protection Programme
JLD Jobseekers Longitudinal Dataset
LFS Labour Force Survey
NES National Employment Survey
NPRS National Perinatal Reporting System
OECD Organisation for Economic Co-operation and Development
OPMI Office for the Promotion of Migrant Integration
ORAC Office of the Refugee Applications Commissioner
PISA Programme for International Student Assessment
PLSS Programme Learner Support System
POD Primary Online Database
P-POD Post-Primary Online Database
PPS number Personal Public Service number
PULSE Police Using Leading Systems Effectively
QNHS Quarterly National Household Survey
RAU Reporting and Analysis Unit
RIA Reception and Integration Agency
RTB Rental Tenancies Board
SICAP Social Inclusion and Community Activation Programme
SILC Survey of Income and Living Conditions
SWTSCSA Social Work Team for Separated Children Seeking Asylum
Executive Summary | i
EXECUTIVE SUMMARY
This report maps the availability of quantitative data on immigrant integration in Ireland. It gives an overview of data collected by the Central Statistics Office in large repeated surveys; administrative data on immigration held by the Department of Justice and Equality; and data held across a range of government departments on ‘mainstreamed’ integration. The analysis does not cover every possible source, but identifies key opportunities, gaps and challenges for the future use and collection of data on integration outcomes.
SURVEY DATA
Unlike many European countries, Ireland does not have an official population register. That means that survey data are critical to estimating the size of the non-Irish population. They also remain the best type of data to measure socio-economic outcomes among immigrants, including in employment, education, housing, and poverty and income, and to compare outcomes with those of Irish nationals. Here we consider the Labour Force Survey (LFS), the Survey of Income and Living Conditions (SILC) and the Census, as well as two non-repeated surveys of migrants – the Survey of Migrants’ Experience of Racism and Discrimination in Ireland andthe Causes and Consequences of Socio-Cultural Integration Processes among NewImmigrants in Europe (SCIP).
The Labour Force Survey (LFS) gathers information on almost 50,000 individuals every quarter. Its primary focus is labour market outcomes, but it also captures a wealth of demographic data, including on age, sex, family status and educational attainment. Nationality and country of birth are also measured, meaning that the LFS is an excellent data source for monitoring migrant integration. Special modules of the LFS offer the potential to investigate particular topics, such as discrimination, with relatively large sample sizes.
Numbers are smaller in the SILC than in the LFS, meaning that capturing migrants, who make up a small proportion of the overall population, is challenging. Researchers and policymakers are limited in any ongoing assessment of migrant income and social inclusion, as national groups need to be combined. For instance, it is not possible to tell if certain national groups are experiencing poverty and deprivation at unusually high rates.
It is also important to consider how well ongoing surveys represent the migrant population, as neither the SILC nor the LFS was explicitly designed to measure migrant outcomes. This problem is particularly acute in the SILC, because nationality is not used in the construction of the survey’s weights.
i i | Data for Mon ito r in g Integrat ion: Gap s, Cha l lenges and Opportuni t ies
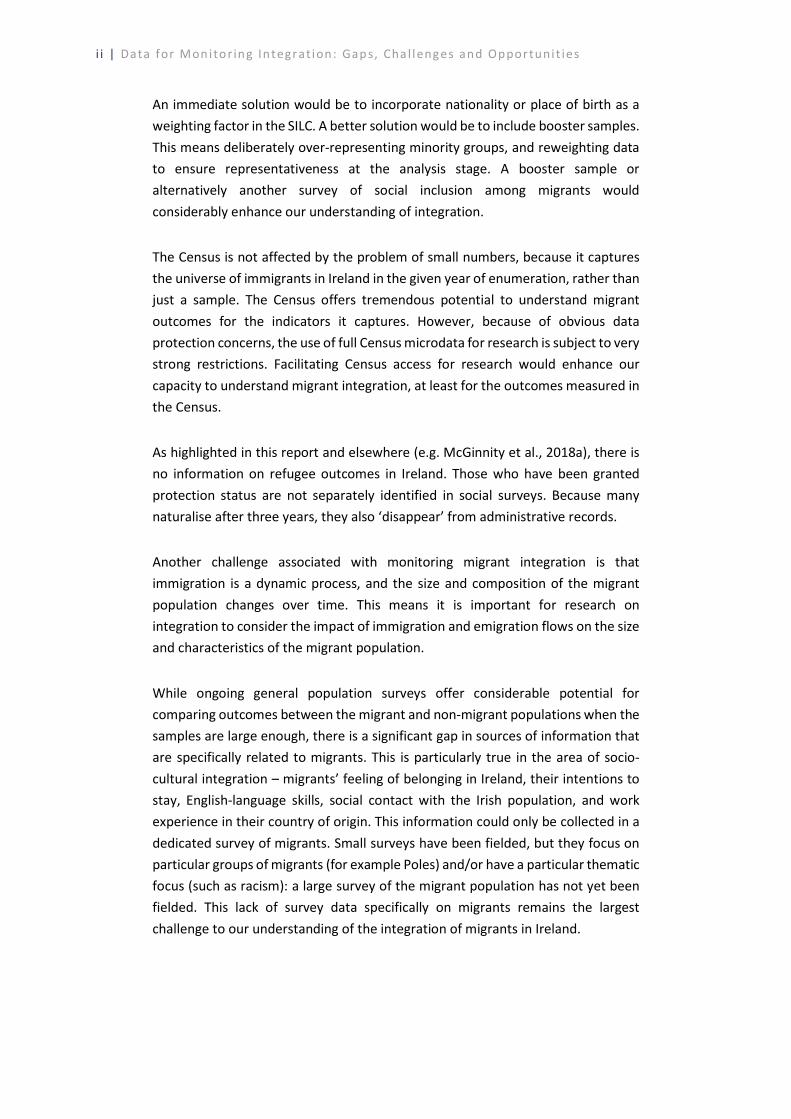
An immediate solution would be to incorporate nationality or place of birth as a weighting factor in the SILC. A better solution would be to include booster samples. This means deliberately over-representing minority groups, and reweighting data to ensure representativeness at the analysis stage. A booster sample or alternatively another survey of social inclusion among migrants would considerably enhance our understanding of integration.
The Census is not affected by the problem of small numbers, because it captures the universe of immigrants in Ireland in the given year of enumeration, rather than just a sample. The Census offers tremendous potential to understand migrant outcomes for the indicators it captures. However, because of obvious data protection concerns, the use of full Census microdata for research is subject to very strong restrictions. Facilitating Census access for research would enhance our capacity to understand migrant integration, at least for the outcomes measured in the Census.
As highlighted in this report and elsewhere (e.g. McGinnity et al., 2018a), there is no information on refugee outcomes in Ireland. Those who have been granted protection status are not separately identified in social surveys. Because many naturalise after three years, they also ‘disappear’ from administrative records.
Another challenge associated with monitoring migrant integration is that immigration is a dynamic process, and the size and composition of the migrant population changes over time. This means it is important for research on integration to consider the impact of immigration and emigration flows on the size and characteristics of the migrant population.
While ongoing general population surveys offer considerable potential for comparing outcomes between the migrant and non-migrant populations when the samples are large enough, there is a significant gap in sources of information that are specifically related to migrants. This is particularly true in the area of socio-cultural integration – migrants’ feeling of belonging in Ireland, their intentions to stay, English-language skills, social contact with the Irish population, and work experience in their country of origin. This information could only be collected in a dedicated survey of migrants. Small surveys have been fielded, but they focus on particular groups of migrants (for example Poles) and/or have a particular thematic focus (such as racism): a large survey of the migrant population has not yet been fielded. This lack of survey data specifically on migrants remains the largest challenge to our understanding of the integration of migrants in Ireland.

i i | Data for Mon itor in g Integrat ion: Gap s, Cha l lenges and Opportuni t ies
An immediate solution would be to incorporate nationality or place of birth as a weighting factor in the SILC. A better solution would be to include booster samples. This means deliberately over-representing minority groups, and reweighting data to ensure representativeness at the analysis stage. A booster sample or alternatively another survey of social inclusion among migrants would considerably enhance our understanding of integration.
The Census is not affected by the problem of small numbers, because it captures the universe of immigrants in Ireland in the given year of enumeration, rather than just a sample. The Census offers tremendous potential to understand migrant outcomes for the indicators it captures. However, because of obvious data protection concerns, the use of full Census microdata for research is subject to very strong restrictions. Facilitating Census access for research would enhance our capacity to understand migrant integration, at least for the outcomes measured in the Census.
As highlighted in this report and elsewhere (e.g. McGinnity et al., 2018a), there is no information on refugee outcomes in Ireland. Those who have been granted protection status are not separately identified in social surveys. Because many naturalise after three years, they also ‘disappear’ from administrative records.
Another challenge associated with monitoring migrant integration is that immigration is a dynamic process, and the size and composition of the migrant population changes over time. This means it is important for research on integration to consider the impact of immigration and emigration flows on the size and characteristics of the migrant population.
While ongoing general population surveys offer considerable potential for comparing outcomes between the migrant and non-migrant populations when the samples are large enough, there is a significant gap in sources of information that are specifically related to migrants. This is particularly true in the area of socio-cultural integration – migrants’ feeling of belonging in Ireland, their intentions to stay, English-language skills, social contact with the Irish population, and work experience in their country of origin. This information could only be collected in a dedicated survey of migrants. Small surveys have been fielded, but they focus on particular groups of migrants (for example Poles) and/or have a particular thematic focus (such as racism): a large survey of the migrant population has not yet been fielded. This lack of survey data specifically on migrants remains the largest challenge to our understanding of the integration of migrants in Ireland.
Executive Summary | iii
ADMINISTRATIVE DATA ON IMMIGRANTS AND IMMIGRATION
There is no population or migrant register in Ireland. In addition, only non-EEA (European Economic Area) migrants are required to register with the State. This means that most migrants – around three quarters – are not regularly counted. The Census provides very reliable figures on the migrant population, but only at five-year intervals. The Central Statistics Office (CSO) population and migration estimates provide updated figures on a more regular basis, but these often need to be revised in light of the Census results (see McGinnity et al., 2018a).
Administrative data on immigration are primarily processed by the Reporting and Analysis Unit (RAU) within the Irish Naturalisation and Immigration Service (INIS). Because the free movement of EEA nationals is guaranteed by European legal agreements, the work of INIS is largely restricted to non-EEA nationals. INIS is responsible for processing data related to residence permits, international protection, visas and naturalisation, among other things.
This report alerts policymakers and researchers to some significant concerns about the quality and reliability of administrative immigration data. Data on residence permits which are gathered by the Garda National Immigration Bureau throughout the year and passed on to INIS on an annual basis are highlighted as particularly prone to reliability issues. The variable reliability of the data and their passage between agencies has led to delays in reporting in the past, although progress has now been made. It is noted that there is scope for further improvement under ongoing infrastructural projects. The Department of Justice and Equality Data and Research Strategy 2018–20 and the RAU’s ‘Reshape’ projects are particularly promising developments in this regard. It is envisaged that a single data repository will be built within INIS which will be co-ordinated by the RAU.
More specifically, the report highlights four of the most significant data gaps in administrative immigration data. First, despite this being an urgent action in the Migrant Integration Strategy, no national-level residence permit data are collected on non-EEA migrants aged under 16. Second, no data are available on family reunification for economic migrants and limited information is available for beneficiaries of international protection. Third, the International Protection Office (IPO) is not obliged by law to publish statistics in annual reports. This represents a break from the practices of the IPO’s predecessor, the Office of the Refugee Applications Commissioner, which published detailed statistics on applications and grants in monthly online bulletins and annual reports. Fourth, no national-level data exist on the number of unaccompanied minors in the State, and this has been highlighted as a considerable deficit and challenge to the development of appropriate policy responses (Groarke and Arnold, 2018).

iv | Data for M onitor ing Integrat ion : Gap s, Cha l lenges and Opportuni t ies
ADMINISTRATIVE DATA ON MAINSTREAMED INTEGRATION
Mainstreaming is the cornerstone of Irish integration policy. This means that government departments are responsible for integrating immigrants into Irish society via standard modes of public service delivery. In other words, the Department of Health is responsible for the health of migrants, the Department of Education and Skills is responsible for their schooling, and so on.
The shortcomings of mainstreamed department data are perhaps not as clear-cut. This is in part because we acknowledge that the primary purpose of many data collection exercises is not to gather information on immigrants, but to ensure service delivery to the public regardless of their migration status. However, some gaps are highlighted and potential uses of existing data are suggested.
In education, the Primary Online Database (POD) and the Post-Primary Online Database (P-POD) are very rich sources of data on school children in Ireland, which include data on the pupils’ nationality, mother tongue, ethnicity and religion.1 Notwithstanding some concerns about the quality and completeness of the data on pupils’ characteristics, these data have considerable potential for illuminating the distribution of students across schools, for example. Very little is known about the academic achievement of immigrant students. In principle, data from the P-POD could be matched to data from the State Examination Commission on Junior and Leaving Certificate examination grades, but careful consideration would need to be given to both data protection regulations and concerns about the quality of the student information on the P-POD before this was attempted.
The policy area of social welfare arguably benefits from the most advanced data infrastructure of all. However, the full potential of this data has not yet been reached from the perspective of either policy or research. Future work should build on recent research using the Jobseekers Longitudinal Dataset (JLD) to analyse unemployment dynamics among African nationals on Jobseekers Benefit and Jobseekers Allowance (Cronin et al., 2019). This could include analysis of other migrant groups, receipt of other welfare payments, duration of receipt and transitions. A drawback of the JLD is that while it captures nationality, it does not gather data on country of birth, meaning that those who were born abroad but naturalised cannot be identified.
In health, adding a field to the Hospital In-Patient Enquiry (HIPE) database for the patient’s nationality, country of birth or ethnicity would dramatically improve our
1 Ethnicity and religion are optional items.
Executive Summary | v
understanding of the health status of the migrant population. In 2016, the HIPE database included detailed information on 1.7 million hospital discharges.
In policing, the report describes efforts by the Garda Racial, Intercultural & Diversity Office to collect information on hate crimes. The reliability of these data, which has been subject to criticism (Haynes and Schweppe, 2017), has improved with recent changes to data collection methods, but concerns about under-reporting remain. Garda data would benefit from collecting information on the nationality, country of birth and/or ethnicity of the victim and perpetrator of crimes, regardless of the motive involved.
Housing policy is particularly lacking in information on migrant integration. This is explained by the decentralised mode of service delivery in this policy area, where local authorities are responsible for the provision of social housing. However, a recent effort to collate data from all 31 local authorities on assessments of social housing needs resulted in valuable nation-wide data on the breakdown of households in need of housing by the nationality of the applicant. Another potentially fruitful exercise would be to collect data on the nationality of Housing Assistance Payment recipients, as this is one of the few housing policy areas administered centrally by the Department of Housing, Planning and Local Government.
Our knowledge of the growing second generation in Ireland, from both survey data and administrative data, remains partial. Measurement challenges are becoming ever more critical. When a definition of ‘migrant’ based on nationality is used, those who naturalise or are born in Ireland become indistinguishable from the Irish population. Children born in Ireland to migrant parents are typically not separately identified in surveys or administrative databases. Ethnicity is rarely measured in surveys, aside from the Growing Up in Ireland survey, the Quarterly National Household Survey (QNHS)/LFS Equality Modules and the Census. These measurement issues need to be addressed if adequate policy responses to migrant integration are to be developed.

Introduction | 1
CHAPTER 1
Introduction
In order to respond properly to the ongoing changes in Irish society and to plan for future change, it is important to monitor the integration of immigrants. However, monitoring integration outcomes is only as effective as the data on which it is based. Ireland does not have a long history of immigration, nor does it have a long tradition of monitoring immigrant outcomes, but as a significant proportion of the population living in Ireland is now of migrant origin, this is a useful juncture at which to assess the evidence needed to do so.
Successful monitoring of immigrant integration at national level requires high-quality, nationally representative data from both administrative and survey sources. Using administrative data for this purpose is a challenge, because a range of government departments and agencies have responsibility for the collection of relevant data. Many administrative datasets are not collected with research and monitoring in mind. Similarly, some ongoing surveys in Ireland were not designed to measure the outcomes of the migrant population. There are often too few migrants in the sample to make accurate claims about the migrant population in general. This problem is even more acute when looking at specific national or ethnic groups.
This project, carried out by the ESRI on behalf of the Office for the Promotion of Migrant Integration (OPMI), seeks to map the availability of quantitative data relevant to the study of migrant integration in Ireland. It is intended to inform the work of the Integration Data Working Group, formed under the Migrant Integration Strategy 2017–2020. The research identifies areas of strength, weakness and opportunity in existing data available to researchers and policymakers interested in migrant integration. It considers three broad sources of information: data gathered in surveys, administrative data held by the Department of Justice and Equality, and data on ‘mainstreamed’ integration – i.e. information held by other government departments that can link immigrants to integration outcomes, such as employment, education and health. We do not make specific recommendations for building on the strengths of the data or for eliminating their weaknesses. However, we do identify the main data gaps and point to how some of these could be addressed.
1.1 SCOPE
Before starting the research we had to clearly set out what would and would not be included in the report. The challenge of defining the scope varied depending on the nature of the data.

2 | Data for M onitor ing Integrat ion: Gap s, Cha l lenges and Opportuni t ies
For administrative data, the challenge was to define what counts as a ‘dataset’ for the purpose of migrant integration. We decided on a rather broad definition, which included any dataset that had both a variable for some kind of immigrant or ethnic minority group and a field for some kind of integration outcome. The minority group characteristics to be included were: nationality, country of birth, citizenship, mother tongue, English-language ability, ethnicity and religion. While we recognise that members of minority ethnic, religious and linguistic groups are not always migrants, there is evidence in the literature and from survey data to show that their overlap with nationality and country of birth is large enough to at least warrant consideration. However, we took this approach with discretion. For instance, a dataset with a religion variable which only identifies Catholics and non-Catholics would not be included, because these categories do not overlap with migrant status. However, if it had a value for Muslims, it would be included because 70 per cent of Muslims in Ireland are foreign born (McGinnity et al., 2018a). A focus was maintained on data collected by government departments involved in delivery of policy: the report excludes data held by local government and non-governmental institutions; for example, homeless charities, religious organisations and quasi-non-governmental organisations.
Deciding which integration outcomes to include was more difficult. In general, we took the Zaragoza Indicators as a starting point. These indicators, agreed at a European Ministerial Conference in Spain in 2010, are a standardised set of measures to be used to monitor integration across the European Union. Broadly speaking, they concern employment, education, social inclusion (including income, housing and health) and active citizenship. The last of these refers to residence status, rates of naturalisation and political participation (see McGinnity et al., 2018a). We were also interested in less easily measured aspects of integration, such as participation in social organisations, national identity and integration at the local level. However, we did not expect these factors to emerge strongly from the administrative data. Critically, to be included in the project the dataset must be able to link the group (e.g. migrants) to the outcome (e.g. poverty).
A final decision on the scope of the project was how to treat surveys run by government departments, which intersect the categories of survey and administrative data. An example is the Healthy Ireland Survey run by the Department of Health. Because these surveys generally deal with a single policy issue, we felt that they would fit more easily into the discussion of administrative data, which would be divided up by policy area.
For survey data, the analysis in this report draws on the analysis conducted as part of the Monitoring Report on Integration 2018 (McGinnity et al., 2018a). Key social surveys in Ireland are considered in detail – the Labour Force Survey, the Survey of Income and Living Conditions and the Census – and other Irish surveys are
Introduction | 3
mentioned briefly. A question was whether we should include international data such as information held by the Organisation for Economic Co-operation and Development (OECD), Eurobarometer or the European Social Survey, which may include samples of migrants or ethnic minorities. We decided against this, because although some of them include important information, it would have considerably expanded the scope of the report. This could be a possible topic for further investigation and is discussed in Chapter 5.
Clearly outside the scope of this report is qualitative work on migrant integration, for example Gilligan et al. (2010) and UNHCR (2014). The strength of this work is that it gives a sense of the lived experience of migrants in Ireland, and it has an important role to play in understanding the topic and the patterns revealed by quantitative data. The disadvantage, for the purposes of this report, is that it is not possible to generalise to national level. The focus of this report is on the data that are available and needed to help us gain an overall understanding of how migrants are faring in Ireland.
BOX 1.1 NOTE ON MEASURING MIGRANTS
A particularly relevant issue when considering migrant integration is how groups are defined. The European Commission includes only those born outside the EU (third-country nationals) as migrants. This is not the approach taken in the present report.
In many countries, migrants are defined as those born abroad. In Ireland, approximately 17 per cent of the resident population is foreign-born, and as of 2017 around three-quarters of these were born in the EU (McGinnity et al., 2018a). By far the largest group of foreign-born residents are from the UK, and just over 20 per cent of these residents were born in Northern Ireland (CSO, 2017b). Another measure is self-reported nationality. Non-Irish nationals comprise 12 per cent of the population resident in Ireland (McGinnity et al., 2018a).
A more durable measure of diversity is the share of the population that report their ethnic/cultural background as any category other than White-Irish or Traveller. In the 2016 Census, this figure was just under 15 per cent. Nine per cent of the population reported an ‘other White’ ethnicity. Although it is not a measure of immigration per se, given Ireland’s relatively short history of inward migration, the ethnic/cultural background variable is useful for giving an indication of the size of the population of second-generation immigrants – a group that is rapidly increasing in size. It is also crucial for identifying the main Irish-born ethnic minority

4 | Data for M onitor ing Integrat ion: Gap s, Cha l lenges and Opportuni t ies
group, the Irish Traveller population. Its main weakness is that it does not differentiate between the diverse groups that fall into the ‘other White’ category.
Currently, however, there are strong overlaps between all three measures in Ireland. For instance, over 70 per cent of foreign-born residents enumerated in the 2016 Census reported foreign (including dual Irish) nationality. Similarly, once people reporting Irish nationality are excluded, 81 per cent of people who report Black African ethnicity also report African nationality. The equivalent figure for Asians is 83 per cent.
These definitions, plus possible alternatives, are discussed throughout the report.
1.2 PROCEDURE
This project complements and draws on the activities of the Integration Data Group, an inter-agency working group convened to examine data gaps under the Migrant Integration Strategy (Department of Justice and Equality, 2017). The Integration Data Group initially comprised members from the OPMI, the CSO, the Irish Naturalisation and Immigration Service, the Department of Education and Skills, the Department of Health, the Department of Employment Affairs and Social Protection, and researchers from the ESRI. At the group’s first meeting in May 2018, a decision was made to extend it to include staff from the Department of Housing, Planning and Local Government, Tusla, Pobal, the Garda Racial, Intercultural & Diversity Office (GRIDO) and the Department of Children and Youth Affairs.
From that point, two broad approaches were taken to evaluate Irish data on integration: one for survey data and another for administrative data. The procedure for survey data was relatively simple. As researchers who use survey data to analyse migrant integration on a regular basis, we used internal expertise to identify gaps and positive features. However, we were less familiar with administrative data and so embarked on an information-gathering exercise. With the assistance of the working group, we drafted a template spreadsheet with ten main fields to be filled out for each administrative dataset. Each entry to the spreadsheet would tell us:
the organisation responsible for collecting the data;
the name of the dataset;
Introduction | 5
the definition of the group, e.g. nationality, country of birth, ethnicity;
the groups available, e.g. individual countries, Irish/non-Irish, EU/non-EU;
the integration outcome that is contained in the dataset, e.g. employment, educational attainment;
whether the data are published;
whether the data are available for analysis;
the unit (e.g. individuals, households, schools) and the number of cases;
the frequency with which the data are updated;
any major gaps or drawbacks that the organisation can identify;
any plans for future development of the dataset.
We then carried out desk research to attempt to populate this spreadsheet as much as possible using information gleaned from published reports (often government department/agency annual reports), department websites and the website data.gov.ie, which describes and publishes a number of public administrative datasets. It was expected that this would minimise the effort required from government statisticians.
Once these sources had been exhausted, we contacted relevant personnel that were identified by the Integration Data Group. We asked them to check the accuracy of the existing information and to fill out any missing cells. We were aware that our knowledge of data in some policy areas might be incomplete and that we might have missed some entire datasets. We therefore asked the contacts to add new entries to the spreadsheet where appropriate. With the exception of housing, for which no data could be found at the time, we had at least one draft entry per policy area. This meant that officials filling out the spreadsheet would have an example to follow. Some departments were more proactive than others, and the depth and quality of information reflects this. However, all relevant departments and agencies responded before the report was finalised.
1.3 OUTLINE OF THE REPORT
Chapter 2 discusses the survey data available to researchers interested in migrant integration. Chapter 3 moves on to administrative data held by the Department of Justice and Equality – in particular the Irish Naturalisation and Immigration Service – and the bodies under the auspices of the Department. Chapter 4 details administrative data on mainstreamed integration. It considers data relating to the Departments of Education and Skills, Health, Employment Affairs and Social

6 | Data for M onitor ing Integrat ion: Gap s, Cha l lenges and Opportuni t ies
Protection, and Business, Enterprise and Innovation as well as data administered by the GRIDO. Data held by other departments and agencies are evaluated together. All three chapters begin with a high-level discussion of the purpose of the data. We then identify any particular strengths and opportunities for further development of the data, before highlighting their limitations and the challenges facing researchers who seek to use them.
As noted previously, we do not make recommendations, but merely outline some possible courses of action which may then be considered in light of budgetary, administrative and data protection constraints.
Survey data for migrant integration | 7
CHAPTER 2
Survey data for migrant integration
Survey data are designed to be representative of the population in Ireland, including those of migrant or non-Irish origin.2 They provide a rich source of information on a wide range of social, cultural and economic indicators. Surveys vary considerably in their size, depending on the research questions and budget, and some do not have any question that can be used to identify migrants or non-Irish nationals. In many surveys that do identify migrants, the number of migrants is simply too small to be reliable, or at least to group the migrant population into meaningful categories. Typically, ongoing surveys were not designed specifically to survey migrants, and some may be more representative of the migrant population than others. Furthermore, the sampling frame may determine whether certain groups are excluded.3 Migration is by definition a dynamic process, so the composition of the migrant population in terms of age, education, gender and other characteristics may change over time as people enter and leave Ireland.
To limit the scope of this chapter, the focus is on surveys in Ireland, with one or two exceptions. For instance, we do not discuss the Programme for International Student Assessment (PISA), the European Social Survey (ESS), the European Values Survey (EVS) and similar comparative sources of information. There is potential for future research to evaluate data useful for migrant integration in these international sources separately.
2.1 GENERAL POPULATION SURVEYS
2.1.1 Ongoing major surveys
Ongoing (repeated) surveys of the population are the cornerstone of evidence- based policy in Ireland. Here we examine the strengths and weaknesses of three major data-collection efforts – the Census, the Labour Force Survey (LFS) and the Survey of Income and Living Conditions (SILC). Of course, the Census is unlike the other two, because it captures the universe of people resident in Ireland on the day of enumeration, rather than a sample.
2 A ‘survey’ is understood here as a quantitative study that interviews respondents on the basis of a fully structured and
harmonized questionnaire. These surveys are also designed to be representative of the overall population in Ireland. A survey does not include studies exclusively based on qualitative interviews that used a semi-structured interview outline/questionnaire.
3 For example, typically in household surveys, people living in institutions or the homeless are not covered (see Section 2.3).

8 | Data for M onitor ing Integrat ion: Gap s, Cha l lenges and Opportuni t ies
The Census The Census is the gold standard of socio-economic household data collection. Beginning in 1821, Censuses were carried out in Ireland once every decade until 1911 and every five years thereafter, with the exception of 1921, when the Irish War of Independence was under way. The Census collects data on nationality, country of birth, ethnic/cultural background, religion, self-assessed English-language ability and language spoken in the home.
There are two great advantages to the Census. One is that it provides a regular absolute population estimate on which weights can be based for other surveys (such as the LFS and the SILC). Another is that when it is used for analysis, the results can be interpreted directly, because there is no uncertainty resulting from sampling. There is also great potential in the Census to look at small population groups (for example, Travellers; see Watson et al., 2017a) or ethnic minorities. A disadvantage is that while many cross-tabulations are published on the CSO website, and these are a rich source of data (see McGinnity et al., 2018a), the full microdata are difficult to obtain.4 A 10 per cent sample is freely available from the Integrated Public-Use Microdata Series (IPUMS) held in the University of Minnesota. O’Connell (2018) recently showed this source’s potential by using the 10 per cent sample of the 2011 Census to study labour market outcomes among African nationals in Ireland. However, the sample is sometimes inadequate for studying very small population groups.
Each Census covers several themes. In 2016, the themes included population distribution and migration; housing and homelessness; health, disability and carers; and diversity. The full Census microdata have huge potential in the area of migrant integration. Analysis of the Census microdata could usefully inform research and policy in the area of migrant integration.
A relatively recent development in the Census is the Small Area Population Statistics (SAPS). Beginning in 1981, the CSO has published geo-coded Census data at various levels. However, in 2011, the detail in which these data are published was enhanced. The CSO now divides the country into over 18,600 small areas, each of which comprises approximately 100 households. The data are freely available to download on the CSO website, and can be explored with an online geographic information system (GIS) application. Haase and Pratschke (2004) have used these data to construct a ‘deprivation index’, which ranks the areas by social disadvantage.
4 Using the online tabulations, McGinnity et al. (2018a) present a socio-demographic profile of Muslims in Ireland.
However, no statistical models can be estimated using the online tabulations.
Survey data for migrant integration | 9
LFS The LFS, formerly known as the Quarterly National Household Survey, gathers information on over 25,000 households (approximately 50,000 individuals) every quarter. There is a longitudinal component to the LFS, where a subset of households are followed over time for up to four quarters. The main focus of the LFS is labour market outcomes, and the data are presented in a standardised fashion so that cross-national European comparisons can be easily made. However, it also captures a wealth of demographic data, including age, sex and family status. The LFS is also one of the best sources of information for tracking educational attainment of the whole adult population in Ireland. Importantly for our purposes, nationality and country of birth are also included as socio-demographic variables, meaning that the LFS is an invaluable source for monitoring migrant integration (Barrett and Kelly, 2008). The LFS does not currently collect data on ethnicity.
LFS data are presented to researchers with a ‘grossing factor’ variable which can be used to reweight the data to ensure that they are representative of the population as a whole. The weight is constructed with reference to the Census. The grossing factor, as the name suggests, can also be used to ‘gross up’ results to the population level. This allows researchers to easily estimate from the data how many people fall into certain groups across the country (e.g. how many people are employed).
The LFS regularly fields special modules on specific topics, typically in Quarter 3 or Quarter 4 of each year. Particularly relevant to the study of migrant integration is the Equality Module, which was carried out in 2004, 2010 and 2014 and is being fielded again in the first quarter of 2019. The Equality Module asks a subset of respondents in a given quarter about their experiences of discrimination.5 Respondents who indicate that they had experienced discrimination are then asked where the discrimination occurred, how frequently it occurred, and how serious its effects were. A great advantage of this dataset is that additional socio-demographic questions are asked, including on the respondent’s ethnic background and their religion. The large sample size is also an advantage, though it has steadily declined, from 24,610 in 2004 to 16,821 in 2010 and 14,868 in 2014, reflecting a reduction in the overall LFS sample. Self-reported data entail an element of subjectivity and some respondents may not be aware of discrimination, but the data provide useful evidence on the experience of different groups in areas of life such as housing and the labour market (McGinnity et al., 2017). Combining self-reports of discrimination with a detailed analysis of labour market outcomes gives a more comprehensive picture of the outcomes of ethnic/national groups (see McGinnity et al., 2018b). Other special modules are also potentially useful for
5 See McGinnity et al. (2017) for more details of the question wording and methodology.
10 | Data for Mon itor in g Integrat ion: Gap s, Cha l lenges and Opportuni t ies
research on migrant integration, for example on volunteering, financial stress, health or the experience of crime.6
SILC The SILC is an annual data-collection exercise which feeds information into the EU-Statistics on Income and Living Conditions. Like the LFS, SILC data can be weighted to make them representative of the population as a whole. The SILC contains data on a range of financial matters, including household income, receipt of social welfare and payment of income tax. This information, along with data on household composition, can be combined to generate a measure of ‘equivalised disposable income’. This refers to income after taxes and transfers which is adjusted for household size and composition. The procedure involves constructing an equivalisation scale, which is arrived at by designating a value of 1 to the first adult in the household, a value of 0.66 to every subsequent adult, and a value of 0.33 to every child (aged under 15). Household income is then divided by the sum of these values to calculate equivalised disposable income.
From this information, various measures of poverty and disadvantage can be created. The ESRI has led this effort in Ireland, publishing regular updates using three headline variables: the at-risk-of-poverty rate, material deprivation and consistent poverty (Watson et al., 2017b). The at-risk-of-poverty rate is a relative measure. It is the percentage of households with equivalised disposable income below 60 per cent of the median. The material deprivation measure, by contrast, is absolute. A deprived household is one that cannot afford at least two of 11 pre-defined items which are considered critical for social inclusion. These include a warm overcoat, home heating and an evening out once every two weeks. The measure of consistent poverty is a combination of the two. A household is deemed to be in consistent poverty if its equivalised disposable income is below 60 per cent of the median income and it is also missing at least one of the 11 items on the deprivation list.
Beyond the list of items asked about for the measure of deprivation, the SILC also collects information on other, non-financial measures of social inclusion. Respondents are asked several questions about their housing circumstances and their neighbourhood environment. They are asked both about their tenure type (private rented, local authority, own with mortgage or own outright) and about the quality of their living environment. Among other things, participants give information on leaks and damp rooms; insufficient light and heat; and noise, pollution and crime in their neighbourhood. The survey also probes respondents
6 For more details on special module topics, see www.cso.ie/en/qnhs/releasesandpublications/qnhs-specialmodules/
Survey data for migrant integration | 11
about their self-reported health status. However, those that report poor health are not asked what specific health problems affect them.
Like the LFS, the SILC contains information on the nationality and country of birth of respondents, but has no variable on ethnicity. However, the sample is considerably smaller than the LFS, especially when you consider that it is repeated annually rather than quarterly. For instance, in 2016 just over 5,000 households were sampled (13,000 individuals).
2.1.2 Other surveys in Ireland
Other surveys in Ireland can be used for research on migrant outcomes, assuming a large enough and representative sample of migrants or minorities. Examples of such surveys include the National Employment Surveys (NES) 2006 and 2009 for earnings of migrants (Barrett et al., 2012, 2016). The Growing Up in Ireland child cohort has been employed to assess the experiences of children in and outside school (Darmody et al., 2016). The Growing Up in Ireland infant cohort has been used to examine the experience of young children from a migrant background and their families (McGinnity et al., 2014; Röder et al., 2018). McGinnity et al. (2011) use the Changing Workplace Survey of Employees in 2009 to compare working conditions of Irish and non-Irish nationals; McGinnity et al. (2012) use the Irish Sports Monitor (2007–2009) to examine sports participation. The challenge with these surveys, particularly where the total number of respondents is small, is being able to distinguish different groups of migrants, rather than having just a migrant/non-migrant distinction, given we know that groups differ substantially across a range of outcomes. Here studies such as the Growing Up in Ireland data have the advantage that the sample size is very large.
2.2 MIGRANT SURVEYS
Surveying immigrants and ethnic minorities in Ireland is challenging as there is no immigrant, non-Irish or population register. This means that fieldwork is challenging and, relative to other European countries, very few surveys have been conducted.
There have been two dedicated surveys of migrants in Ireland. 7 The Survey of Racism and Discrimination against Non-EU Migrants in Ireland was conducted in
7 A ‘survey’ here is designed to be representative of the overall population of some or all migrant or minority groups in
Ireland. A survey does not include studies of migrants or ethnic minorities exclusively based on qualitative interviews.
12 | Data for Mon itor in g Integrat ion: Gap s, Cha l lenges and Opportuni t ies
2005, and a longitudinal survey of new Polish migrants was conducted in 2011 and again in 2012–2013.8 These are outlined below.
2.2.1 Survey of migrants’ experience of racism and discrimination in Ireland
The survey of Racism and Discrimination against Non-EU Migrants in Ireland was conducted in the summer of 2005 to assess the prevalence and degree of discrimination against recent migrants to Ireland (McGinnity et al., 2006). It was part of a wider European Union Monitoring Centre on Racism and Xenophobia (EUMC) project assessing discrimination in a number of EU countries, and followed a broadly similar methodology to these studies. The aim of the EUMC project was to get a comparable and accurate picture of racism and discrimination in different countries, given suspected underreporting of discrimination to national authorities.
The sampling frame was based on (1) an administrative list of work permit holders held by the (then) Department of Enterprise, Trade and Employment and (2) a list of asylum-seeker accommodation centres from the Reception and Integration Agency. Using a questionnaire developed in Sweden and adapted for the Irish case, the questions measured discrimination on the basis of national/ethnic origin as perceived by the respondent. The questionnaire was translated into five languages (Chinese, French, Polish, Romanian and Russian), and administered by post. As it was not clear which language the respondent would choose, six questionnaires were sent to each respondent by post.9 The achieved sample included 679 work permit holders and 430 asylum seekers. This represents a relatively low response rate, even for a one-shot postal survey – 24 per cent for work permit holders and 11 per cent for asylum seekers. However, reweighting was possible on the basis of the sampling frames, so results were based on a representative sample of these groups at the time.
Following a questionnaire template with some modifications for Ireland, many detailed questions were asked of respondents about their experience of discrimination, racism and harassment in a range of settings in Ireland (see McGinnity et al., 2006 for the questionnaire). Respondents who were working were also asked about working conditions and wages (see O’Connell and McGinnity, 2008 for analysis of this). All respondents were asked about self-
8 A smaller survey of Polish migrants, Polonia in Dublin, was also carried out as a precursor to the longitudinal survey of
new Polish migrants (see Mühlau et al., 2011 for further details). In 2010–2011 a group of researchers also carried out a once-off survey of 1500 migrants in Ireland to investigate patterns of financial remittance to their home countries (Batista and Narciso, 2018).
9 In the case of work permit holders, the names and addresses were added by the Department of Enterprise, Trade and Employment so the individual names would never be known by researchers. In the case of asylum seekers, managers of accommodation centres were asked to distribute the questionnaires in the centres.
Survey data for migrant integration | 13
perceived language ability, intentions to stay in Ireland, sense of belonging and socialisation patterns (with co-ethnics, Irish or other ethnic/national minority groups). Compared to the Equality Modules of the LFS (see above), this survey went into far more detail about the setting of discrimination, and the socio-demographic and labour market characteristics of the respondent, as well as other aspects of their experience in Ireland. The disadvantage is that there was no reference (White Irish) group to compare the findings to, as is the case with any survey of a specific population group. This survey is available on request.
2.2.2 Causes and consequences of socio-cultural integration processes among new immigrants in Europe (SCIP)
The major objective of the SCIP project, funded by the Norface Research Programme on Migration, was to describe the patterns and to explain the causes and consequences of early socio-cultural integration trajectories of newly arrived immigrants across different ethnic groups in four European countries: Germany, the Netherlands, Great Britain and Ireland (Diehl et al., 2015). This is a valuable source of information because it is a longitudinal (two-wave) survey of new immigrants in Ireland, meaning that integration processes can be tracked over time. Migrants were interviewed soon after their arrival and as many as possible were re-interviewed 18 months later (full questionnaire is available at www.scip-info.org). The project surveyed about 7,000 migrants in total, aged between 18 and 60, in four countries. New Polish migrants were interviewed in all countries. In some other countries the project surveyed non-Western groups such as Turks, Pakistanis and Moroccans, but no non-Western group was sampled in Ireland.
In Ireland Wave 1 fieldwork took place between October 2010 and December 2011. Due to the absence of a population or migrant register in Ireland, a combination of sampling methods was used. Fieldwork was particularly challenging because Polish migration to Ireland had collapsed in the year preceding the survey, so the target population (new immigrants) fell dramatically. Sampling methods included referral sampling and sampling through institutions and media, all respondent-driven. In addition, all Polish migrants who came to Dublin and were issued with social insurance (PPS) numbers were invited to participate in the survey. The achieved sample of Poles was 1,031 in Wave 1 and 613 in Wave 2, approximately 20 months later (around 200 of second-wave respondents had returned to Poland).10
The study focused on the most important aspects of newcomers’ socio-cultural integration, using a mutually agreed questionnaire administered in the native language of the respondent. The questionnaire included the following topics.
10 Returned migrants were given a shorter-form questionnaire. Around 400 respondents were re-interviewed in Ireland.

14 | Data for Mon itor in g Integrat ion: Gap s, Cha l lenges and Opportuni t ies
Language and integration policies: language skills und use, information on third
languages, and participation in language/integration classes.
Identity and exclusion: cultural consumption and practices (such as TV watching, reading newspapers from the host country or the country of origin); identification/belonging; feelings of acceptance and perceived discrimination; satisfaction with the migration decision and the current situation; perceived compatibility of cultures and acculturation attitudes; information on politics; and attitudes to democracy.
Religion: religion, worship attendance and praying behaviour, religious practices, the composition of the place of worship as well as information on the religion of the partner.
Social integration: bonding and bridging ethnic ties, social participation, core networks (strong ties) and the density of their social network. For instance, participants were asked if they were involved in sports clubs, political organisations or religious groups in the receiving country, and to what extent these groups are filled by people from their country of origin.
Structural integration: education, employment situation of the respondent and partner as well as information on remittances.11
This survey is publicly available from the data archive GESIS (www.gesis.org). Some key comparative findings are published in multiple articles in a journal special issue (see Diehl et al., 2016). McGinnity and Gijsberts (2017) also compare the experience of discrimination among Polish migrants in Ireland and the Netherlands.
2.3 STRENGTHS AND OPPORTUNITIES OF SURVEY DATA
A great strength of the repeated surveys in Ireland is that they contain multiple measures of migrant status. Both the LFS and the SILC have variables for both nationality and country of birth. The Census is particularly strong in this area, because it has five relevant indicators: nationality, country of birth, ethnicity, religion and language spoken.12 Furthermore, the 2021 Census pilot questionnaire has a question on the acquisition of Irish citizenship. It is important to use multiple definitions to track the size and composition of the immigrant population. Self-reported nationality is an important measure, but will not tell us anything about naturalised citizens unless we also have a country of birth variable. Furthermore, nationality and country of birth tell us nothing about second-generation immigration, but ethnicity can give us important clues in this regard. In Ireland, a country with a predominantly Catholic population, religious diversity can also tell us about second- and third-generation immigrants – a group that is quickly
11 For further details on sampling methods and methodology, see Gresser and Schacht (2015). 12 The Census also asks those who report speaking a language other than English or Irish in the home how well they speak
English.
Survey data for migrant integration | 15
increasing in size. Finally, Ireland has the added complication of a large population that is born in Northern Ireland but identifies as Irish, as well a large group that was born to Irish parents in the UK and has since moved to Ireland. Having multiple measures of diversity helps researchers to disentangle these immigration histories from each other. Other survey and administrative data sources would do well to base their questions on nationality, country of origin, ethnicity and/or citizenship on the Census. This would allow for comparability of findings across datasets.
A second strength of Irish survey data is that they capture relevant, internationally comparable indicators for migrant integration which were agreed by the European Union in Zaragoza in 2010. These indicators, which are regularly updated by the ESRI in the Monitoring Reports on Integration, include topics related to the labour market, to education and to social inclusion. Both EU-SILC and LFS data are also fielded in other European countries, so Irish indicators can be compared to those in other countries.
A third advantage of the survey data is that response rates to the SILC and LFS are very high. They stood at 58 per cent for SILC in 2016 and at 45 per cent for the LFS in the second quarter of 2018.
A fourth strength is the CSO’s geocoded output from the Census data, which allows researchers to investigate the spatial distribution of the immigrant population across the country. This research, which is currently under way in the ESRI, can answer two pertinent questions: is the non-Irish population, or certain groups within it, spatially segregated? And if so, what are the socio-economic characteristics of the neighbourhoods in which they reside?
Finally, researchers interested in migrant integration can benefit from the Census data published in the IPUMS at the University of Minnesota. The IPUMS holds a freely available 10 per cent sample from each Census from 1971 to 2011. Some variables, such as ethnicity and religion, are provided in aggregated form. For instance, the religion variable aggregates the categories of ‘Islam’, ‘Presbyterian’, ‘Orthodox’ and ‘Other’ into a single ‘Other’ category. However, crucially for the study of migrant integration, the variables for nationality and country of birth are not aggregated.
2.4 CHALLENGES AND POTENTIAL FOR IMPROVEMENT OF SURVEY DATA
2.4.1 Small and unrepresentative samples of minorities
Perhaps the greatest challenge for researchers using the SILC and the LFS to study migrant integration is that they are not expressly designed for that purpose. Their chief functions are to summarise income and living conditions and labour market
16 | Data for Mon itor in g Integrat ion: Gap s, Cha l lenges and Opportuni t ies
outcomes of the entire adult population respectively. While the CSO does break these figures down by some characteristics, primarily age and gender, it warns that the representativeness of the data may not hold when studying small immigrant groups.
One reason for this is that in some waves, some immigrant groups may be so small that it would be impossible to ensure representativeness. For example, the 2016 Census shows that there were 808 Somali nationals in Ireland. The SILC at the time only captured approximately 0.5 per cent of the population, meaning that approximately four Somalis would be interviewed. When we consider that non-Irish groups may be more mobile, and have poorer English language skills, they may also be under-represented in the sample. Some migrants may be mistrustful of State institutions and refuse to participate (McGinnity et al., 2006). Lower response rates among migrant populations have also been found internationally (Font and Méndez, 2013).
Estimating how the entire group is faring on the basis of such a small number of cases is simply not feasible. Another problem is that the weighting variables that are used to make SILC data representative of the total population do not include nationality or ethnicity (CSO, 2017a). Instead, they are based on age, sex, region of the country and household composition. This means that samples may not fully correct for the lower response rates among non-Irish nationals, so they remain under-represented. Adding nationality or place of birth as a weighting factor would go some way to addressing this issue.13 One common strategy is to merge small nationality groups together, using for example a ‘non-EU nationals’. The problem here is that many diverse groups, such as Nigerians, Australians, Indians and Brazilians, are grouped together, thus limiting the explanatory power of the analysis.
Another approach that mitigates, but does not solve, this problem is to pool the data. If data from two time periods are combined, the resulting migrant sample will of course be twice as large. However, in SILC at least, the data remain unrepresentative of the nationality grouping because of the weighting issue described above. Furthermore, pooling brings its own problems. When studying outcomes that have the potential to change rapidly from one time period to the next, such as incomes or employment rates during an economic boom or recession, it is not possible to monitor these changes if pooled data are used.
A better solution is to include booster samples. This means deliberately over-representing minority groups, and reweighting data to ensure representativeness
13 LFS weights include age, region, sex and nationality (five nationality groups including Ireland, UK, EU15, EU13 (the EU
excluding the EU15) and Rest of World). See www.cso.ie/en/methods/surveybackgroundnotes/labourforcesurvey/
Survey data for migrant integration | 17
at the analysis stage. Booster samples are common practice in other European countries. For instance, an immigrant and ethnic minority boost sample is included in the Understanding Society survey, the largest social survey in the UK.14 The German Socio-Economic Panel (SOEP), a wide-ranging representative longitudinal study of private households in Germany, has included a booster sample of non-German citizens since its inception in 1984.
Even with booster samples, however, some groups will never be surveyed. The SILC and the LFS are household surveys, meaning that people residing in institutions, including asylum-seeker accommodation centres, will not be captured. Intuitively we may expect these people in direct provision to have poorer integration outcomes than the rest of the non-Irish population because of restrictions in their ability to live in the community and to access education and employment.
Census microdata of course transcend all the problems of representativeness and small samples, but are currently difficult to obtain for research purposes. While there are a limited set of integration indicators on the Census data, using the microdata available for research would considerably enhance our knowledge of the outcomes of migrants and ethnic minority groups.
Perhaps even more serious is the problem that once people leave the international protection system, by being granted either asylum or leave to remain, they are completely lost from administrative data (see Chapter 3). Currently there are no indicators in existing large-scale, repeated surveys for time previously spent in the international protection system, including whether the respondent is a refugee. It is therefore impossible to detect what are known as ‘scarring’ effects, whereby time spent in the international protection system has adverse effects on integration outcomes later in the life course. This is particularly a concern with respect to employment, because time under protection can amount to a gap in a migrant’s CV if they are not gathering experience or spending time in education (see McGinnity et al., 2018a).
2.4.2 Measuring naturalised Irish citizens and the second generation
The fact that a significant group of immigrants are now Irish citizens may be a positive development in terms of their integration, but it presents a challenge from a monitoring perspective. By measuring integration on the basis of nationality, as in the Integration Monitors, researchers are likely to miss an increasing number of naturalised citizens. This is particularly relevant for migrants of non-EEA origin, given that an estimated 45 per cent of them may have been Irish citizens by end 2017. Any statistics on the basis of nationality will miss an important proportion of
14 www.understandingsociety.ac.uk/documentation/ethnicity-immigration

18 | Data for Mon itor in g Integrat ion: Gap s, Cha l lenges and Opportuni t ies
the population they are designed to measure, and those remaining in the non-Irish group may differ from those who have naturalised. One solution is to measure Irish citizens born abroad. While this is potentially instructive, around half of these were born in the UK and came to Ireland many years ago. Their profile is rather different to recent migrants who naturalised in the past five to ten years. In addition, this will not capture those of migrant origin born in Ireland who are Irish citizens – the second generation.
What are the alternatives? One possibility is to introduce measures such as ethnicity to capture both naturalised citizens and second-generation immigrants when measuring integration (Waters, 2014). Yet Burton et al. (2010) argue that ethnicity is a fluid, not a fixed concept. There is an element of identity in any ethnicity question and this identification can change over time. Those who have successfully integrated into their destination country may identify strongly with this country, and, for example, define themselves as ‘Irish’ for ethnic background. They will then be indistinguishable from those born in Ireland to ethnically Irish parents, though their experience may differ. Another alternative measure, currently being discussed at European level, is to include questions on standard social surveys (LFS, SILC) about the country of birth of the respondents’ parents.
Of course some indicators are specific to the migrant population and will never be collected on general population surveys. Migrants’ feeling of belonging in Ireland, intentions to stay, motives for migration, migration history, social contact with the Irish population and work experience in their country of origin could only be collected in a dedicated survey of migrants. Detailed data were collected as part of the SCIP survey, described above, and some indicators were included in the Survey of Racism and Discrimination among recent migrants. However, these surveys are limited to new Polish migrants and non-EU migrants respectively. Partly due to the challenges of fieldwork, which have also been found in other European countries (Font and Méndez, 2013), a large survey of the migrant population in Ireland has not yet been fielded. This remains perhaps the largest gap in our understanding of the socio-cultural integration of migrants in Ireland.
Survey data for migrant integration | 19
CHAPTER 2 APPENDIX – MAIN SURVEY DATA RELATING TO MIGRANT INTEGRATION IN IRELAND
Dataset Outcomes Groups Availability Ongoing population surveys
Census Various: principal economic status, education, housing, health, family circumstances, etc.
Nationality, country of birth, ethnic/cultural background, religion, self-assessed English language ability, language spoken in the home.
Cross-tabulations and detailed reports are published on CSO website. A 10 per cent sample is available from IPUMS. Microdata are sometimes available to officers of statistics under strict conditions and when no other suitable data are available.
LFS Labour market outcomes, educational attainment.
Nationality, country of birth. Summary statistics published online. Microdata available to officers of statistics under strict conditions.
SILC Income and deprivation; housing and neighbourhood conditions.
Nationality. Summary statistics published online. Microdata available to officers of statistics under strict conditions.
Migrant Surveys EUMC Survey of Racism and Discrimination against Non-EU Migrants (2005)
Experience of racism and discrimination; working conditions and wages; self-assessed language ability; sense of belonging; self-assessed English language ability; intentions to stay.
Non-EU migrants (work permit holders and asylum seekers). No equivalent data gathered on Irish nationals or EU migrants.
Available on request from the ESRI.
Causes and Consequences of Socio-cultural Integration Processes among New Immigrants in Europe (2010–2013)
Language, social identity, religion, social integration, education, employment, etc.
New Polish migrants. No equivalent data gathered on Irish nationals or other immigrant groups.
Available on request from www.gesis.org.
Notes: Other surveys in Ireland have been used for research on migrant outcomes, for example the NES 2006 and 2009; the Growing Up in Ireland infant and child cohorts; the Changing Workplace Survey of Employees in 2009. See Section 2.1.2 for further discussion.


Administrative data – Irish Naturalisation and Immigration Service | 21
CHAPTER 3
Administrative data – Irish Naturalisation and Immigration Service, Department of Justice and Equality
3.1 ADMINISTRATIVE DATA COLLECTED
The Irish Naturalisation and Immigration Service (INIS) administers the immigration, citizenship, and international protection functions of the Department of Justice and Equality. Administrative data collected and held by INIS relate to applications made mainly by non-EEA (European Economic Area) nationals under these functions; for example, applications for naturalisation, protection, family reunification, visas and business-related residence. The Reporting and Analysis Unit (RAU) sits within INIS. Its main role is to report statistics, on both a statutory and a voluntary basis, to bodies such as Eurostat, the European statistical agency, and FRONTEX, the European Border and Coast Guard Agency, as well as to provide internal management-reporting data.15 The RAU also provides statistical reports based on data from the relevant business units (for example, citizenship, family reunification, visas). These statistical reports serve as a factual basis for the units when they co-ordinate responses to Parliamentary Questions and press queries. They are also used for INIS publications. Currently several areas of INIS, which do not need to respond to external mandatory reporting demands, are not under the RAU remit, including visa processing, the Start-Up Entrepreneur Scheme (STEP), the Immigrant Investor Programme, and atypical permits.16
Most data in INIS are managed on Asylum and Immigration Strategic Integration Programme (AISIP), an SQL-type database of applications. Biographical information is stored on each applicant and applications are linked with a Person ID number. The RAU produces reports from AISIP using Crystal Reports. A wide range of fields is available for completion by the processing officer, but not all are populated. Visa applications are made via an online system (AVATS) from which data reports may also be produced.17
15 A co-ordinated response was received from the INIS Policy Division incorporating responses from the RAU, Visa
Division, International Protection Office and Family Reunification Unit. Assistance was also received via telephone from a representative of the Social Work Team for Separated Children Seeking Asylum within Tusla.
16 Interview with INIS, 3 July 2018. 17 There are some exceptions to this model, with some INIS data stored on a number of Lotus Notes databases. The RAU
produces reports from Lotus Notes using IntelliView, Microsoft Excel and SPSS. Source: Interview with INIS, 3 July 2018.
22 | Data for Mon itor in g Integrat ion: Gap s, Cha l lenges and Opportuni t ies
3.1.1 Residence permits issued
The RAU is responsible for producing statistics on residence permits using a snapshot from a database owned by the Garda National Immigration Bureau (GNIB). INIS has no access to, or control over the GNIB database.
All non-EEA nationals aged 16 and over must register their presence in the State after 90 days. On registration, a non-EEA national is allocated several documents which together comprise a ‘residence permit’. Depending on the reason for residence, one of several stamps is placed in the person’s passport.18 Each stamp carries different conditions, e.g. access to the labour market. Nine types of residence stamps exist but a diverse group of recipients may be issued the same stamp.19
In cases where it is straightforward to register a non-EEA national for a residence permit, or if their permit is being renewed, the registration may be carried out by GNIB or at Garda stations outside Dublin. If the registration involves another application of some description, for example to change immigration status, INIS is responsible. Residence permits may therefore also be issued by several operational areas within INIS.
Residence permit data are sent from the GNIB Information System (GNIB-IS) to the RAU as an end-of-year snapshot each January. The data arrive as a CSV file and are transferred into a Lotus Notes file. There are unique identifiers on both AISIP and GNIB-IS. In theory, the datasets can be linked, but this must be done manually using SPSS. The RAU carries out this exercise once a year to facilitate the Resper20 returns. Data relating to residence permits issued are then reported to Eurostat.21
3.1.2 Protection-related data
On the enactment of the International Protection Act, 2015, the Office of the Refugee Applications Commissioner (ORAC) was subsumed into the Department of Justice and renamed the International Protection Office (IPO). The IPO is responsible for processing applications for international protection under the Act, making recommendations on whether or not a person should be granted refugee status or subsidiary protection status. The IPO also considers whether applicants should be given permission to remain in Ireland under the Immigration Act, 2004.
18 Documents include a Certificate of Registration in the form of a GNIB Registration Card. 19 See www.inis.gov.ie/en/INIS/Pages/registration-stamps for stamp types and conditions attached. 20 The RAU uses a system of templates, variables, definitions and disaggregations for the residence permits data
collection, referred to as Resper data collection. 21 On residence permits issued by reason – first-time permits and all permits; duration of permits; and change of status.
Administrative data – Irish Naturalisation and Immigration Service | 23
The IPO produces monthly data updates containing information on application type (domestic/relocated) and some data on applicants’ nationality.22 Unlike its predecessor ORAC, the IPO is not required to produce annual reports and does not publish regular data on applications granted and refused on its website.
The Reception and Integration Agency (RIA) is responsible for managing the accommodation of applicants for international protection. The RIA holds data on the capacity and occupancy of accommodation centres, and publishes this information on its website on a monthly basis. Information on the nationality, gender, age and family status of residents is included. This is derived from AISIP.23
The Irish Refugee Protection Programme (IRPP) is a separate strand of the international protection system which was set up in 2015 as a direct response to the ‘migrant crisis’ in Southern Europe. The RIA is not responsible for housing people admitted to Ireland under the IRPP, and therefore does not include them in their data releases. Instead, data on this cohort are published sporadically on the website of the Office for the Promotion of Migrant Integration.24
Outside the Department of Justice and Equality, Tusla, the Child and Family Agency, holds and publishes data on the number of unaccompanied minors referred to the Social Work Team for Separated Children Seeking Asylum and placed in care.
3.1.3 Other INIS data
Processing data on applications, refusals and grants of other applications (including the Start-Up Entrepreneur Scheme (STEP), the Immigrant Investor Programme (IIP) and the Atypical Worker Permission) are collected by the relevant processing unit within INIS. Visa data are derived from an online application system (AVATS) and top-line figures are regularly included in the Annual Review (Department of Justice and Equality, 2018a). Data on applications for long-term residence are published in the Annual Review and data on persons holding long-term residence are reported to Eurostat.
Data on applications for citizenship by naturalisation, disaggregated by age and nationality, are also published in the INIS Annual Review along with certificates granted by nationality of holder (Department of Justice and Equality, 2018a). Data
22 See www.ipo.gov.ie. The International Protection Appeals Tribunal (IPAT) is a statutorily independent body responsible
for hearing the International Protection appeals. IPAT currently publishes information on appeals in its Annual Report only.
23 http://www.ria.gov.ie 24 http://www.integration.ie/en/isec/pages/irpp_statistics

24 | Data for Mon itor in g Integrat ion: Gap s, Cha l lenges and Opportuni t ies
on refusals and processing times are not regularly published, nor is a gender breakdown of certificates or applications published.
Supplementary data relating to INIS’s activities are regularly published in response to parliamentary questions, but such data are not suitable for regular integration monitoring.
3.2 STRENGTHS AND OPPORTUNITIES OF DEPARTMENT OF JUSTICE AND EQUALITY ADMINISTRATIVE DATA
The Department of Justice and Equality Data and Research Strategy 2018–2020 foresees the development of a Data Hub, which will enable the efficient and secure exchange of appropriate data and information within the Justice and Equality sector (Department of Justice and Equality, 2018b).
During the course of this research, the RAU reported that data quality across many of INIS’s IT systems is currently variable. The unit spends a significant amount of time cleaning existing data to ensure that it can stand over the accuracy of published statistics.25 The IT spend of the RAU increased in 2018. Part of this increase relates to the RAU Reshape project, which aims at better data availability and reliability as well as improved governance, automation and consolidation of sources. Going forward, the RAU plans to co-ordinate and oversee all INIS-produced data and to publish more data online to improve ease of access.26 INIS foresees the introduction of a new registration system, including online applications for all immigration permissions, which will sit alongside AISIP. Under this system, applicants will have to fill out certain fields before proceeding with the application. It is expected to improve data quality and to support the streamlining of the current stamp system (discussed below).27 Significantly, ownership of the registration data will be transferred from GNIB-IS to INIS. The estimated delivery time is at least two years.28
The Migrant Integration Strategy contains a range of data-related actions. Some have already led to greater data availability. Action 13 requires the annual publication of data on applications for long term residence and these are now published in the INIS Annual Review. Action 9 stipulates that data on applications for citizenship, disaggregated by age, gender and nationality be published annually. All statistics other than the gender breakdown are now being published (Department of Justice and Equality, 2018a). In addition, the annual review of
25 Written correspondence with INIS, 9 July 2018. 26 Interview with INIS, 3 July 2018. 27 Written correspondence with INIS, 22 June 2018. 28 Interview with INIS, 3 July 2018.
Administrative data – Irish Naturalisation and Immigration Service | 25
statistics produced by INIS has been expanded in recent years and now includes a range of data updated annually.
3.3 CHALLENGES AND POTENTIAL FOR IMPROVEMENT: DEPARTMENT OF JUSTICE AND EQUALITY ADMINISTRATIVE DATA
3.3.1 Lack of a migrant register
Unlike many other EU countries, Ireland does not have a population or migrant register that provides continuously updated data on individuals. The AISIP database contains individual person records, to which unlimited immigration-related application records are linked. The AISIP database does not automatically link to the GNIB-IS or other major datasets. Available data are therefore limited to applications and applicants and it is not possible to track an individual’s migration pathway.
An example of the information deficit arising from the absence of a migrant register relates to family reunification – an important aspect of integration. Until 2017, data on applications for family reunification were available for beneficiaries of international protection from ORAC, but the IPO has no responsibility for family reunification and these data are no longer available. Data on first residence permits issued for family reunification with a beneficiary of protection are reported to Eurostat, with a nationality breakdown. Economic migrants are not required to make a formal application for family reunification (under the Policy Document on Non-EEA Family Reunification) and data on family reunification have never been available for this group.29 The Children’s Rights Alliance highlighted the lack of data on family reunification as a significant issue in Ireland (Cosgrave and Thornton, 2015).
Certain groups admitted under the IRPP received Programme Refugee status on arrival. Again, because some of these groups are not required to make applications, they do not appear on AISIP and data can be inconsistent and reporting sporadic. Programme and resettled refugees also do not appear within IPO data, again because in many cases no application is required.30
Processing data are obviously limited by the parameters of the scheme under which applications are made. For example, victims of trafficking who are also applicants for international protection are not eligible to apply for a residence
29 Based on the relative size of the population that sponsors could potentially be drawn from, we can assume that the
group of family members of non-beneficiaries is larger than the group of family members of beneficiaries of international protection.
30 Persons who will be granted protection under the Irish Humanitarian Admissions Programme (IHAP) will have been the subject of applications on AISIP. Successful applicants will be granted Programme Refugee Status.
26 | Data for Mon itor in g Integrat ion: Gap s, Cha l lenges and Opportuni t ies
permit under the Administrative Immigration Arrangements for the Protection of Victims of Human Trafficking (Department of Justice and Equality, 2011) and therefore do not appear in the data. Visa data, although relatively high quality, do not capture non-visa required nationals.
Although helpful, a population register is not necessarily a guarantee of good integration monitoring. Most registers contain only limited information on migrants, for example only nationality or country of birth, but not both. Sufficiently rich datasets exist only when national data collection systems allow for extensive linkage of different registers, as is the case in the Nordic countries (Kraler et al, 2015).
3.3.2 Limitations of residence permit data
No residence permit data exist on non-EEA children aged under 16, despite the fact that the Employment Permits (Amendment) Act, 2014 removed the exemption for non-EEA nationals aged under 16 to register.31 The amendment was introduced with reference to the risk posed to children, including from traffickers, because no immigration record exists of their presence in the State. The need for a cohesive approach to the immigration status of children, who may be in Ireland for years before they come to the attention of the authorities, was also stressed. Research by the Immigrant Council of Ireland (2016) found inconsistencies in the treatment of non-EEA children in immigration matters and emphasised the need for an independent status, especially for children in care (Immigrant Council of Ireland, 2016).
Action 14 of the Migrant Integration Strategy undertakes to finalise arrangements to enable the registration of non-EEA migrants aged under 16 years ‘as a matter of urgency’ (Department of Justice and Equality, 2017). In August 2018 the INIS Registration Office advised that this project had been postponed due to the emergence of other priorities and that its introduction was to be reviewed later in 2018.32
Data on residence permits disaggregated by stamp are of limited usefulness due to the diversity of recipients with each stamp. (For example, volunteers, ministers of religion and family members of non-EEA nationals may all receive a stamp 3, while stamp 4 holders comprise refugees, the family members of Irish or EU nationals and critical skills permit holders, among others.) Residence permit data must be re-categorised into meaningful groups before being reported to Eurostat and the
31 By way of amendments to the Immigration Act, 2004. 32 Written correspondence with INIS, 27 August 2018.
Administrative data – Irish Naturalisation and Immigration Service | 27
complexity of the stamp systems means that mapping is not straightforward.33 The re-categorisation is not fed back to the processing sections or incorporated into the data in any way.
The complexity of this exercise has, in the past, led to delays in finalising data. For instance, residence permit data sent to Eurostat have been subject to delays, though INIS reports that increased resources have now addressed this issue.34 Work is under way to reform and consolidate the stamp and residence permit regime. INIS expects that these reforms, together with the changes to the registration system discussed above, will produce more accurate data for the categorisation of permission type.35
Eurostat publish residence permit data under the following categories: family formation and reunification; education and study; remunerated activities; refugee status; subsidiary protection; and other. In 2016 Eurostat data showed that out of 110,927 residence permits issued to non-EEA nationals in Ireland, 23 per cent were for ‘other reasons’. While this is a considerably larger proportion than in Member States such as Norway (1.3 per cent), Italy (5 per cent) and the UK (7 per cent), it is below the EU average of 34 per cent.36 The ‘other reasons’ category contains a diverse group of permits that do not fit into the main categories. These include permits issued to persons admitted under the Syrian Humanitarian Admission Programme; Irish citizens with dual citizenship; individuals who have permission to stay in Ireland without limits on the time they can remain here; and permits issued to persons granted permission to remain under section 3 of the Immigration Act, 1999.37
3.3.3 Data on applications for and beneficiaries of international protection
Detailed data on protection applications and decisions are reported to Eurostat and published on the Eurostat website. As noted above, the IPO publishes information on the processing of protection applications in the State in monthly reports. The monthly reports produced are more limited than those that were produced by ORAC up to the end of 2016. In particular, family reunification processing statistics are no longer included (although monthly reports can be produced on request). In addition, IPO is not required to produce an annual report
33 For example, residence permits issued to persons admitted under the Syrian Humanitarian Admission Programme
(SHAP) are classified under ‘other reasons’ in Eurostat returns, despite the fact that SHAP is a family reunification scheme.
34 Written correspondence with INIS, 30 November 2018. 35 Ibid. 36 Eurostat Data Explorer: Table migr_resvalid. 37 Written correspondence with INIS, 7 September 2018.

28 | Data for Mon itor in g Integrat ion: Gap s, Cha l lenges and Opportuni t ies
and data on applications granted and refused are not regularly published other than on the Eurostat website. Data on persons granted permission to remain are not published.
Regarding RIA monthly reports on the capacity and occupation of accommodation centres, a number of tables have not been produced in the 2018 monthly reports due to ‘reconciliation issues’.38
Emergency Reception and Orientation Centres (EROCs) were established to temporarily accommodate persons recently arrived via resettlement or relocation to Ireland, while their claims are being processed. EROC residents are not included in RIA data. Using the AISIP data, it is possible to find information on some EROC residents.39
As discussed above, there is currently no way of tracking the outcomes of beneficiaries of international protection after grant of status, in terms of employment, education, etc.
3.3.4 Migrant children including unaccompanied minors
As mentioned above, no residence permit data exist on non-EEA migrant children aged under 16 years. This is true whether the children are accompanied by family members or arrive unaccompanied.
Statistics in respect of applications for International Protection include all children (accompanied and unaccompanied). Accompanied children’s applications are processed, in the main, as part of the application of their parent(s); however, a recommendation/decision is made in respect of each child.40
No national-level data exist on the total number of unaccompanied minors in the State. While the IPO publishes data on asylum-seeking unaccompanied minors, there are no data on non-asylum-seeking unaccompanied minors. National data are limited to referrals to the Dublin-based Social Work Team for Separated Children Seeking Asylum (SWTSCSA). No data exist that can tell us what proportion of unaccompanied minors referred to this service are seeking asylum. Data on unaccompanied minors admitted as programme refugees are often inconsistent. Data are available on unaccompanied minors granted protection, but no data are collected on the number of unaccompanied minors granted an alternative
38 The following tables have not been included in 2018: Age profile of RIA residents; Accommodation status of RIA
residents; Top ten nationalities of RIA residents; Breakdown of families in RIA accommodation; Duration of stay by RIA residents.
39 Interview with INIS, 3 July 2018. 40 Written correspondence with INIS, 8 October 2018.
Administrative data – Irish Naturalisation and Immigration Service | 29
immigration status, including permission to remain under the International Protection Act, 2015 (see Groarke and Arnold, 2018). The collection of data on unaccompanied minors outside the protection system is a challenge across the majority of EU Member States (European Migration Network, 2018).
The lack of consistent and comprehensive data on unaccompanied minors in Ireland has been raised in several reports as a challenge to the development of appropriate policy responses (Groarke and Arnold, 2018; Kilkelly, 2007; Joyce and Quinn, 2009; Quinn et al., 2014). The SWTSCSA has stressed that efforts to improve national data collection on unaccompanied minors should take account of the individualised, child-centred nature of its clinical work with them.
3.3.5 Other
Data on the size of the irregularly resident population, or the extent of illegal employment of non-EU nationals in Ireland, are not currently available from an official or objective source.
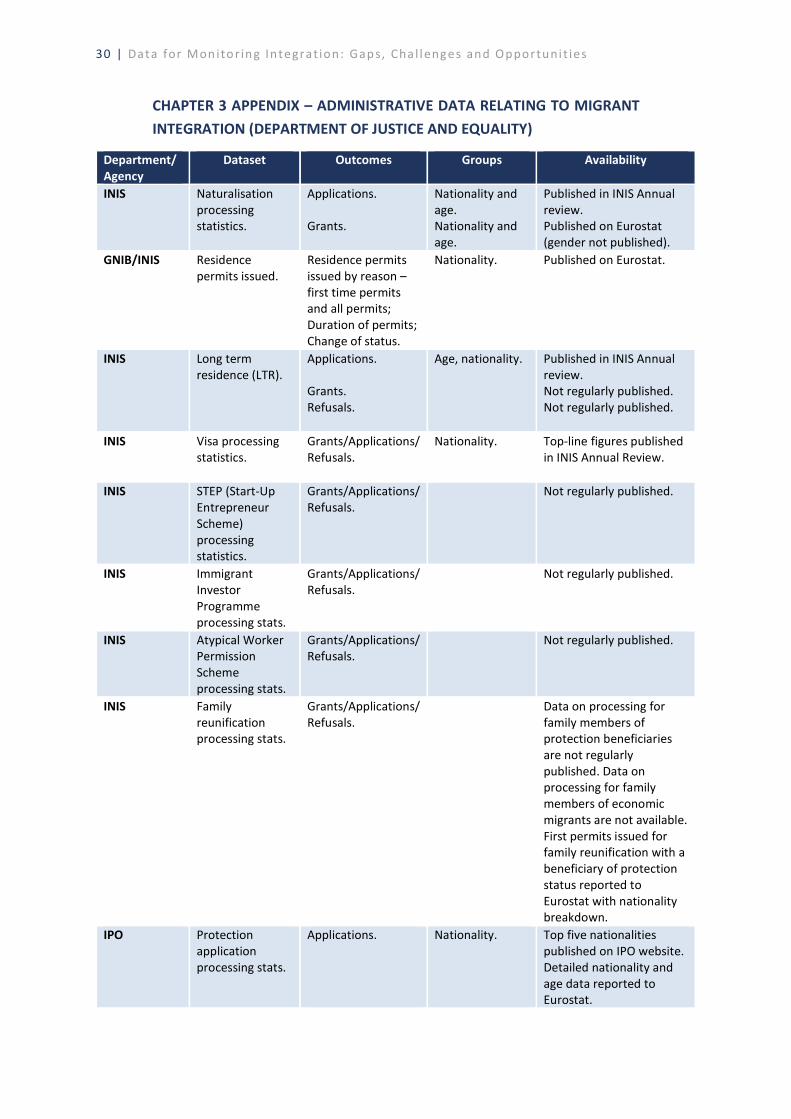
30 | Data for Mon itor in g Integrat ion: Gap s, Cha l lenges and Opportuni t ies
CHAPTER 3 APPENDIX – ADMINISTRATIVE DATA RELATING TO MIGRANT INTEGRATION (DEPARTMENT OF JUSTICE AND EQUALITY)
Department/ Agency
Dataset Outcomes Groups Availability
INIS Naturalisation processing statistics.
Applications. Grants.
Nationality and age. Nationality and age.
Published in INIS Annual review. Published on Eurostat (gender not published).
GNIB/INIS Residence permits issued.
Residence permits issued by reason – first time permits and all permits; Duration of permits; Change of status.
Nationality. Published on Eurostat.
INIS Long term residence (LTR).
Applications. Grants. Refusals.
Age, nationality.
Published in INIS Annual review. Not regularly published. Not regularly published.
INIS Visa processing statistics.
Grants/Applications/ Refusals.
Nationality. Top-line figures published in INIS Annual Review.
INIS STEP (Start-Up Entrepreneur Scheme) processing statistics.
Grants/Applications/ Refusals.
Not regularly published.
INIS Immigrant Investor Programme processing stats.
Grants/Applications/ Refusals.
Not regularly published.
INIS Atypical Worker Permission Scheme processing stats.
Grants/Applications/ Refusals.
Not regularly published.
INIS Family reunification processing stats.
Grants/Applications/ Refusals.
Data on processing for family members of protection beneficiaries are not regularly published. Data on processing for family members of economic migrants are not available. First permits issued for family reunification with a beneficiary of protection status reported to Eurostat with nationality breakdown.
IPO Protection application processing stats.
Applications.
Nationality.
Top five nationalities published on IPO website. Detailed nationality and age data reported to Eurostat.
Administrative data – Irish Naturalisation and Immigration Service | 31
Department/ Agency
Dataset Outcomes Groups Availability
Decisions.
Nationality and age.
Detailed nationality and age data reported to Eurostat.
RIA RIA residents.
Capacity and occupancy of accommodation centres. Information on the nationality, gender, age and family status of residents.
IRPP IRPP arrivals.
Arrivals per strand (relocated, resettled, Calais, Family Reunification Humanitarian Admission Programme). Housing outcomes per strand.
Nationality and broad age groups.
Limited monthly data published.


Administrative data – other departments | 33
CHAPTER 4
Administrative data – other departments
4.1 MAINSTREAMED INTEGRATION DATA COLLECTED
While the Department of Justice and Equality is responsible for integration policy in general and the Migrant Integration Strategy in particular, the Irish government has taken a ‘mainstreaming’ approach to integrating non-Irish nationals. Where possible, the needs of migrants are served through the ordinary service provision of individual government departments and agencies. In this chapter, we outline the main administrative datasets used by government departments and agencies outside of the Department of Justice and Equality. In particular, we set out datasets where some kind of identifier of group membership is available (e.g. country of birth, nationality, ethnicity or language ability), and where that indicator can be linked to an integration outcome of interest (e.g. school attendance, access to healthcare). We adopt a fairly broad definition of a group outcome, which is any measure of how an immigrant may be faring in Ireland.
The amount of relevant information held by government departments varies considerably. This is not surprising, because the extent to which government departments are responsible for these outcomes varies substantially. For instance, while the Department of Business, Enterprise and Innovation (DBEI) is responsible for the key area of work permits, the Department of Agriculture, Food and the Marine has little to do with issues relating to integration. We therefore consider individually two departments that are highly relevant for migrant integration – the Department of Health and the Department of Education and Skills. We group the DBEI and the Department of Employment Affairs and Social Protection (DEASP) together, because they are both responsible for labour market outcomes. Furthermore, responsibility for ‘employment affairs’ only moved from the former to the latter in June 2017. We also give special attention to An Garda Síochána and the data managed by the Garda Racial, Intercultural & Diversity Office (GRIDO) on hate crimes. While this issue affects a relatively small number of people per year, it is politically salient because the quality and reliability of these data have been called into question in recent years. We then group all other government functions together. This category includes a range of both government departments and agencies of the State. An overview of the data available across government can be found in the appendix to this chapter.
4.1.1 Department of Education and Skills (DES)
Perhaps the richest datasets in the DES in terms of migrant integration are the Primary Online Database (POD) and the Post-Primary Online Database (P-POD).

34 | Data for Mon itor in g Integrat ion: Gap s, Cha l lenges and Opportuni t ies
These databases are the main data hubs in which information on primary and secondary schools and their pupils are held. Each dataset is very large, with over half a million primary school pupils and 350,000 secondary school pupils included. Almost all schools in Ireland (3,246 primary schools and 715 post-primary schools) are currently captured in the data.
The POD and the P-POD have the capacity to gather data on nationality, mother tongue, ethnic/cultural background and religion. However, parents are not required to populate the fields for ethnic/cultural background and religion because these are deemed to be ‘sensitive personal data’ under European data protection legislation. There are also concerns that even on the compulsory items, the data may be somewhat unreliable.41 Schools may not always have accurate and complete information about the nationality or native language of their student body, and may not have effective ways of collecting such data. Notwithstanding this issue, there is potential for the POD and P-POD to provide policymakers and researchers with information on school enrolment among non-Irish children at a national and regional level. Given policy and research interest in the potential negative impact of segregation (Byrne et al., 2010), information on the concentration of migrant children in schools would be a useful indicator to have on an ongoing basis.
Another data source from the DES comes out of the National Assessments testing procedure. Every five to six years, the Educational Research Centre administers standardised reading and mathematics tests to a large sample of children in second class and sixth class. Along with the tests, the pupils, teachers and school principals are surveyed and data are collected on multiple variables, including country of birth and mother tongue. In the 2014 National Assessments, 9.7 per cent of second class students and 11.7 per cent of sixth class students in the sample were born outside of Ireland. Eight per cent of all students sampled in the study spoke a language other than English or Irish in the home. The next National Assessment is due to be carried out in 2020.
Turning to higher education, the Higher Education Authority (HEA) publishes annual data on enrolment in HEA institutions by ‘domiciliary of origin’.42 This allows us to quantify the flow of immigrants into higher education in Ireland and is particularly useful when compared to estimates of the overall population of each group (see appendix). Information supplied by the DES indicates that limits will soon be in place on the publication of these data due to data protection legislation.
41 Information supplied by DES, May 2018. 42 Note that domiciliary of origin is not the same as country of birth. If a student was born abroad but had been residing
in Ireland for three of the previous five years, their domiciliary of origin would be categorised as Ireland.
Administrative data – other departments | 35
The HEA also administers the Equal Access Survey, which is used extensively for funding purposes, both via the Student Assistance Fund and the HEA recurrent grant allocation model (HEA, 2018). The survey samples new entrants to HEA-funded educational institutions. In the 2016/17 academic year just over 42,000 students in universities and Institutes of Technology were surveyed. The survey includes an ethnic/cultural background question which is based on the question used in the Census. The findings of the survey can therefore be compared to the ethnic/cultural breakdown of the population aged 15–19 in the most recent Census to see if groups are over- or under-represented among students in HEA-funded institutions. Of course, the ethnic and cultural background of the population of third-level students will be influenced by international students entering Irish third-level institutions. International students could be distinguished from those from a migrant or ethnic minority background who grew up in Ireland using the HEA’s administrative data on domiciliary of origin.
In Further Education and Training (FET), the Programme Learner Support System (PLSS), a joint initiative between SOLAS (the Further Education and Training Authority) and the Education and Training Boards (ETBs), holds useful information related to learners. Information on nationality is collected in the system, and migrants’ progress through FET programmes can be tracked. The system also contains information on receipt of social welfare and employment outcomes upon termination of the courses.
Finally, Tusla gathers data for the School Completion Programme. This dataset includes a field for language ability, which has two categories – English-speaking and non-English-speaking.43 This dataset, if put to use, could allow for the early identification of people at risk of dropping out of education prematurely, and would allow interventions to be targeted at them. Tusla’s administrative data were supplied to ESRI researchers for a review of the School Completion Programme (Smyth et al., 2015).
4.1.2 Department of Health
The Department of Health and the agencies under its auspices, such as the Healthcare Pricing Office, collect administrative and survey data designed specifically to address policy needs. Furthermore, the Health Service Executive (HSE), which manages the operation of the health service, collects significant quantities of administrative data to allow for efficient running of the system. Much of the data collected by the HSE covers publicly financed and provided community-
43 Data from 2010–2012 are published online. See Tusla (2012).

36 | Data for Mon itor in g Integrat ion: Gap s, Cha l lenges and Opportuni t ies
based and social care. No information is gathered on the country of birth or nationality of the respondent.
The Healthy Ireland Survey is a national survey conducted on behalf of the Department of Health. This is an annual cross-sectional survey which measures a number of health-related behaviours and outcomes, including smoking, alcohol consumption, mental health and obesity. The survey, the fourth wave of which was fielded in 2018, gathers information on country of birth and ethnic group. In 2018, 20 country of birth options were provided, followed by an ‘other’ category. The options for ethnicity were similar to what is provided in the Census (see Chapter 2). The Healthy Ireland Survey therefore provides a high-quality, large (~7,500 people) and nationally representative source of information which can be used to measure and compare the prevalence of unhealthy behaviours and outcomes across national and ethnic groups. However, the sample size of the various ethnic groups would generally be too small to provide robust estimates. The Anonymised Microdata File (AMF) of the Healthy Ireland Survey is available from the Irish Social Science Data Archive in UCD, and the more detailed Research Microdata File (RMF) is available from the Department of Health.
Another source on health behaviour that captures data on migrants is the National Drug Treatment Reporting System. This epidemiological database, compiled by the Health Research Board, captures information on drug and alcohol use which is collected in drug treatment centres across the country. It details the substance used, whether the individual is homeless and whether they have injected. The database is pertinent to this project because data on nationality and ethnicity are also captured.
A third useful survey on health policy is the new National Patient Experience Survey. This survey, which was fielded for the first time in 2017 by the Health Information and Quality Authority (HIQA), gathers data on discharged hospital patients each May who spent at least 24 hours in an acute public hospital. In 2017, data on 13,700 discharges were collected. The survey was fielded again in May 2018 and it is planned that it will be repeated on an annual basis. According to the survey’s technical report, information was collected on the respondent’s ethnic or cultural background, and on a host of variables that together give a strong indication of the experience of the patient in the hospital. In particular, numerous questions were asked about the way in which the respondent was treated by hospital staff, and about the difficulties they had in accessing healthcare in the first instance, including whether or not they hold a medical or GP visit card and how long they had to wait to be admitted. Unfortunately, no data were gathered on the country of birth or nationality of the respondent. The number of non-white respondents is very small. However, this is not necessarily a weakness, as it may be a true reflection of the better health of those from a non-‘White-Irish’
Administrative data – other departments | 37
background, something that previous research has found to be the case (Nolan, 2012; McGinnity et al., 2018a).
The Healthcare Pricing Office administers a dataset known as the National Perinatal Reporting System (NPRS), and summary statistics are published annually. These data capture information on a range of health-related variables around childbirth, including birthweight of the infant, the age of the mother and the prevalence of stillbirth and diseases affecting the child. The nationality of the mother and, where available, of the father is also recorded in the database. This means that the NPRS can potentially be used to compare the health of Irish parents and their newborn infants to that of immigrants and their children.
Health data are collected on migrants in two other, very specific areas – HIV/AIDS and tuberculosis. Data on new incidences of these diseases by global region of birth and ethnic/cultural background are held by the Health Protection Surveillance Centre (HPSC). While HIV/AIDS cases are reported annually, no data on tuberculosis have been published since 2006.
Finally, the Health Research Board collects information on admissions, discharges and deaths relating to Irish psychiatric care units and hospitals. Information on the ethnic/nationality grouping of the patient is gathered in this dataset as well. A 2018 report by the HRB shows that 84 per cent of admissions were ‘White Irish’ in 2017 (Daly and Craig, 2018).
4.1.3 Labour market data (DBEI and DEASP)
Allowing access to the host country’s labour market is key to facilitating the integration of immigrant communities. In Ireland, this is not an issue for migrants from within the European Economic Area (EEA). However, people born outside of this group of countries who come to Ireland will generally have to apply for an employment permit. Employment permits are handled by DBEI, and headline figures are released regularly on its website. They are also published by the Skills & Labour Market Research Unit (SLMRU) in SOLAS, under the auspices of the National Skills Council. This dataset can tell us how widespread each permit type is among the non-EEA population. Since the introduction of the Employment Permits (Amendment) Act, 2014, there are nine permit types to facilitate access to different eligible occupations of employment in Ireland. As of 2017, when the most recent statistics were published, over 80 per cent of new permits granted were for either the Critical Skills Employment Permit (CSEP) or the General Employment Permit (GEP). These are designed to attract highly qualified foreign workers and to address skills shortages in the labour force, respectively.
Critically for the purpose of this report, the administrative data on employment

38 | Data for Mon itor in g Integrat ion: Gap s, Cha l lenges and Opportuni t ies
permits contain information on the details of employment, including sector, occupation, county of employment and salary. We can also determine information on the individual attaining the employment permit, including their level of education and, most importantly, their country of origin. These data provide us with an accurate and detailed appraisal of the labour market situation of non-EEA nationals in Ireland.
Perhaps just as important as the type of work that immigrants are engaged in is the extent to which they find themselves out of work. The main administrative source of information for this topic is the Jobseekers Longitudinal Dataset (JLD), held by DEASP. The JLD is among the most ambitious attempts in the entire civil service to adapt administrative data to research purposes.
The JLD is the administrative dataset for claims made for a range of social assistance and social insurance payments for the working-age population. It also includes information on PPS (social insurance) numbers and labour market activation programmes. In total, the JLD stores information on 13 million ‘episodes’. An episode can be a commencement of a claim, entry into employment or enrolment in education. All of these data can be linked to the socio-demographic information relating to the Department’s clients, including nationality. Recent research carried out within DEASP has used the JLD to measure the average duration of Jobseeker claims by African nationals (Cronin et al., 2019). This is indicative of the type of research that could potentially be carried out using this source. DEASP institutes a policy whereby JLD data are made available to researchers for a specific business need. This can take the form of contracted research, which occurs through a Request for Tender (RFT) process. Alternatively, a researcher with adequate credentials may be given access to the data to answer a question of interest to the Department.
Separate to the JLD, DEASP also publishes statistics on the allocation of PPS numbers by nationality. In 2017, it reported that just under 190,000 new PPS numbers were distributed. These figures, which are updated on a monthly basis, can be used as an alternative to survey data to track the size of the newly arrived non-Irish population, and given sub-groups within it. The Department can also tell if employment or welfare activity has ceased on a given PPS number. However, it cannot determine if this is due to the individual leaving the country.
DEASP also publishes statistical releases on every welfare payment by various breakdowns, including by nationality. Unlike the JLD, these data, which are published in annual statistical information reports, contain information on claims across the life cycle, rather than just in the working age population. Data on births and deaths, gathered by the General Registration Office (GRO), and information on
Administrative data – other departments | 39
virtually every DEASP payment are incorporated, including child benefit, unemployment payments, disability allowance and pensions.
Finally, the Health and Safety Authority, under the auspices of the DBEI, publishes summary results on fatal and non-fatal workplace injuries and illnesses by nationality. The nationality breakdown is published as an Irish/non-Irish dichotomy, but it gives a proxy measure of the working conditions of immigrant workers in Ireland.
4.1.4 GRIDO
The Garda Bureau of Community, Diversity and Integration, also known as the Garda Racial, Intercultural & Diversity Office (GRIDO), holds data on crimes with a discriminatory motive, which are commonly labelled ‘hate crimes’. When a member of the Gardaí attends an incident, he or she will document the details of the event on the Garda standardised computer system, PULSE (Police Using Leading Systems Effectively). If the victim says that they perceive the crime/incident to have occurred with a discriminatory motive, the officer must mark that on the system. Whether or not the victim is explicitly asked this is dependent on the judgement of the Garda. There are 11 discriminatory markers under which the claim can be lodged, which are loosely based on the grounds for discrimination set out in Irish equality legislation. Crucially for the purposes of this report, they include racism and sectarianism. There are also separate categories for Islamophobia, anti-Semitism and anti-Roma crimes.44
Although the PULSE system can identify the discriminatory marker – i.e. race or religion – it is generally not possible to identify groups within those categories, with the exception of Roma, Muslim and Jewish victims. For example, there is no category for crimes against ethnically Asian people or Orthodox Christians. However, there is a free-text box in the PULSE system where Gardaí can write details of the crime. If a victim perceived that the crime took place because of their membership of a specific group, being Asian for example, this may be detailed in the free-text box.
Recording of ‘hate crimes’ depends on the victim, the attending officer or another witness identifying that there was a ‘discriminatory motive’ to the crime. There are approximately 150 Ethnic Liaison Officers (ELOs) spread around the country who are specifically trained to assist officers in dealing with hate crimes. Hate crimes registered on the PULSE database are checked by GRIDO on a daily basis, and ELOs are contacted directly by GRIDO in cases where particularly serious incidents have occurred, or when GRIDO staff feel that the details of the incident need to be
44 Prior to 2007 there was a category for xenophobia, but this was discontinued because it was not being cited as a
motivation for crime.
40 | Data for Mon itor in g Integrat ion: Gap s, Cha l lenges and Opportuni t ies
verified. This goes some way to enhancing the reliability of the hate crime data. However, an ELO will only be contacted by GRIDO if the incident had originally been marked a hate crime. Some under-reporting may arise from officers not marking the crime correctly in PULSE, from victims being unaware that they can categorise the incident as ‘hate motivated’ or from victims choosing not to do so.
Upon further investigation of the incident, it may become clear that a crime which was reported as ‘hate motivated’ did not in fact have a discriminatory element to it. A typical example of this type of instance is a burglary or theft. It may transpire after the event that the perpetrator was unaware of the race of the victim when the crime was committed. In these instances, a Garda Sergeant or GRIDO may ask the victim if they can de-list the incident as a hate-motivated incident. Officers will only de-list an incident if they are granted permission to do so by the victim.
Historically, headline figures from the PULSE system, including hate crime data, have been published by the Central Statistics Office (CSO). However, because of broader issues of data quality and reliability in PULSE, the CSO has temporarily ceased this practice. Microdata on hate crimes have been made available to researchers under certain conditions. In 2017 a group of academics in the University of Limerick were given access to the data for the preparation of their report Lifecycle of a Hate Crime (Haynes and Schweppe, 2017). No data held by GRIDO on the proportion of hate crimes that are prosecuted are suitable for research, though this information is held for administrative purposes.
4.1.5 Administrative data held by other government departments
Some other pieces of relevant data are scattered across the executive branch in a piecemeal fashion. One important source of information is the issuance of Irish passports, which is controlled by the Department of Foreign Affairs and Trade. Annual figures are published on the number of passports issued by the country of birth of the applicant. It also appears that data are gathered on the number of applications made by country of birth. This means that the number of passport refusals by the origin of the applicant could be estimated; however, this is not published. Acquisition of an Irish passport can be viewed as an indicator of integration because it is indicative both of citizenship and of an intention to stay in Ireland for an extended period of time.
Elsewhere in government, a policy area with limited data on migrants is housing. The only nationwide dataset with information relevant to migrant integration held by the Department of Housing, Planning and Local Government (DHPLG) is the Summary of Social Housing Assessments (DHPLG, 2018). These data were recently gathered by the Department from 31 local authorities and used to create a profile of households that were deemed to be in need of social housing. Part of this profile
Administrative data – other departments | 41
included a breakdown of the nationality of the main applicant. Three broad categories are shown: Irish, non-Irish EEA and non-EEA. The last category is further divided into those who have leave to remain in the state, refugees and applicants with subsidiary protection status.
Though technically falling within the Department of Justice and Equality, we consider statistics held by the Irish prison service in this chapter rather than in Chapter 3, because they are qualitatively different to the data held by the Irish Naturalisation and Immigration Service, the Garda National Immigration Bureau, the Reception and Integration Agency, etc. Nonetheless, the prison service provides useful data on the non-Irish prison population, as it publishes annual summary statistics on the nationality of people committed to prisons in Ireland. Perhaps for reasons of privacy and statistical disclosure, these are only published at the regional level (North American, South American, EU, Other European, etc.). These data allow us to evaluate whether some groups are over-represented among prisoners in Ireland. A separate but related body, the Probation Service, mentions in its 2016 annual report (p. 33) that its ‘systems were again strengthened for capturing data on Ethnicity and Nationality, which in itself will inform our operational business and enhance service delivery’ (Probation Service, 2017). However, while the Probation Service continues to publish monthly statistics online, as yet no data on nationality or ethnicity are included in these releases.
Pobal, the Irish government’s agency for community development, holds relevant data in its Integrated Reporting and Information System (IRIS) database. This source tracks the provision of the Social Inclusion and Community Activation Programme (SICAP). It gives policymakers visibility of state employment and education supports, as well providing information on the outcomes of these supports, such as entry into employment or self-employment. The IRIS database includes information on approximately 50,000 beneficiaries of SICAP, including their nationality and their ethnic/cultural background. Like with the prison service, nationality is displayed at the regional level. As in many other datasets, detail on ethnicity is provided in a similar way to the Census. Here, however, SICAP participants can identify as part of the Roma ethnic group.
4.2 STRENGTHS AND OPPORTUNITIES OF MAINSTREAMED ADMINISTRATIVE DATA
In recent years, political polling and market research by private firms has substantially increased people’s exposure to surveys. This has led to falling response rates in surveys fielded by national statistical agencies across Western Europe, which are posing substantial problems to policymakers and social scientists alike (The Economist, 2018). Furthermore, migrant groups are often under-represented in surveys (see Chapter 2). Even where they are not under-

42 | Data for Mon itor in g Integrat ion: Gap s, Cha l lenges and Opportuni t ies
represented, small groups in the population often need to be combined when analysing social surveys. The great strength of administrative data is that they offer us an alternative approach. In fact, administrative data can remove the problems associated with sampling. In most cases, the data relate to the entire population rather than just a sample, meaning that the interpretation of statistical significance in modelling exercises is automatically resolved.
The analysis above has identified several areas where there are opportunities for further development of administrative data, as well as instances where existing data can be better put to use to inform policymaking. Perhaps the most exciting area of development lies with DEASP’s JLD. In part because of the recent development of the dataset, researchers have only scratched the surface of this source. In addition to studying the nationality of people on the live register, the JLD could be used to investigate family structures with data on lone parent payments and social welfare payment increases for qualified children and qualified adults (partners). It could also be used to study reasons for labour market inactivity across migrant groups if illness and disability payments were added to the dataset.
The practice of government departments commissioning surveys yields reliable and relevant information. The Healthy Ireland Survey and the Educational Research Centre (ERC) National Assessments are high-quality resources for researchers interested in public policy. A great advantage of these surveys is that they are iterated, which facilitates learning on the part of the teams that design them.45 Furthermore, any given wave of these surveys can be directed towards a topic of interest. One possibility for departments interested in migrant integration is to include booster samples of the non-Irish population in these surveys. The ERC is currently planning a booster sample of Delivering Equality of Opportunity in Schools (DEIS) schools for the 2020 National Assessments, which may incidentally increase the number of foreign-born children sampled.
A possible alternative to further development of the National Assessments would be to make greater use of the Annual Standardised Testing procedure. These tests assess reading and mathematics, and are administered to virtually every second, fourth and sixth class pupil in the country. The results are then aggregated to the school level and returned to the Department of Education. In theory at least, it would be possible for the Department of Education to request that the results be aggregated in different ways, for instance by the country of birth of the child. This would have two advantages. First it would provide a more regular picture of the performance of immigrants in school, because these tests are carried out annually. Second, because they test almost all children, interpreting the statistical
45 According to written correspondence with officials in the Department of Health, Healthy Ireland is expected to continue
for at least four more years.
Administrative data – other departments | 43
significance of differences in mean test results would no longer be a problem. However, requesting aggregation by another variable, such as country of birth, would amount to a significant change to the processes by which schools submit data to the department. Future data development could also consider linking the standardised test results to the POD.
There are also opportunities to use administrative data for geo-spatial analysis. New insights can be gleaned from geo-coded data, and can potentially offer an opportunity to map the provision of state services to migrants. Plans are currently in place to develop the Department of Education POD and P-POD for these purposes. This would allow researchers to draw links between area-level deprivation and the concentration of immigrant groups in schools. However, issues of data reliability will need to be resolved to make this effort materially useful for policymakers.
Some of the background research for this report availed of the website Data.gov. This is a useful resource, but it is ripe for enhancement. For instance, the data on passports alluded to above are currently available on data.gov.ie, but only as an xml file, meaning that they is not easily interpretable by researchers or interested members of the public. If data collection and storing efforts were standardised across agencies and departments in this hub, significant efficiencies could be made by promoting a joined-up, cross-departmental approach to data analysis and policymaking.
Because of under-reporting, the data on hate crimes held in PULSE have been subject to criticism by a number of organisations. Partly in an effort to address this issue, the PULSE system was reformatted in 2015 so that officers attending hate-motivated incidents had 11 rather than five discriminatory markers to choose from. The placing of these markers on the system was also modified to encourage Gardaí to fill it out more accurately. This resulted in a significant boost in the number of hate crimes recorded, but this means that trends over time from before and after the change cannot be interpreted.
Self-reported data on sensitive issues such as hate crime are likely to be affected by under-reporting anyway, regardless of how accurately information is inputted into the system. Thus we may not have an accurate estimate of the number of hate crimes happening in a given year, though we can monitor trends over time if we assume patterns of under-reporting by victims and Gardaí do not change. Indeed, figures suggest that there was little year-on-year change between 2015 and 2018.
44 | Data for Mon itor in g Integrat ion: Gap s, Cha l lenges and Opportuni t ies
4.3 CHALLENGES AND POTENTIAL FOR IMPROVEMENT OF
MAINSTREAMED ADMINISTRATIVE DATA
Here we identify some of the weaknesses in administrative data and suggest ways that they could be alleviated. Pursuing some of these suggestions may require substantial investment.
In the field of education, the State Examination Commission gathers only limited information on the socio-demographic characteristics of exam candidates at Junior Certificate and Leaving Certificate levels – not country of origin, nationality or ethnicity – meaning that migrant achievement in State examinations cannot be measured. This gap is particularly important given the influential role of upper secondary (Leaving Certificate) examination grades in ensuring access to higher education and good-quality employment (Darmody and Smyth, 2018). Given that both the P-POD and the database of the State Examinations Commission contain student PPS numbers, there might be potential in the future to link examination grades with pupil characteristics from P-POD. However, due consideration would need to be given to both data protection concerns and concerns about the quality of the student nationality, mother tongue, ethnicity and religion data on P-POD.
Previous ESRI health research has pointed out gaps in administrative health data. Although these are not explicitly related to migrant integration, they are still relevant for this report. Chief among them are a lack of data on the use of private health care and an absence of a unique patient identifier, which means that individual patients cannot be tracked over time as they interact with the health service (Wren et al., 2017).
A serious omission from the perspective of migrant integration is the Hospital In-Patient Enquiry database. This source is managed by the Healthcare Pricing Office and supplies the department with details of diagnoses and procedures carried out on in-patients in Irish hospitals. In 2016, 1.7 million hospital discharges were recorded, but to the best of our knowledge, no data are gathered on the patient’s nationality, country of birth or ethnicity. The same is true for the Public Health Information System, which compiles data on numerous health outcomes such as the incidence of cancer, the psychiatric health of the nation, fertility and mortality. These statistics are presented as data tables online, but it is not possible to link health outcomes to an individual’s migration status.
In GRIDO, challenges in data collection and reporting persist. Under-reporting of hate crimes remains an issue for two reasons. The first relates to Garda training. According to information supplied by GRIDO, the complex and ever-changing nature of hate crime means that, notwithstanding initial training at the Garda College, further modular learning at in-service level is required for all Gardaí to
Administrative data – other departments | 45
address hate crime effectively.46 The second issue is that some victims may simply elect not to categorise a hate-motivated incident as such.47
As mentioned above, this under-reporting should not affect the monitoring of trends over time, if we assume that the rate of under-reporting remains relatively constant. However, the improvement in PULSE introduced in 2015 means that trends before and after that point cannot be interpreted. The more general concern with the quality and reliability of all PULSE data has resulted in the CSO ceasing its quarterly publication of PULSE crime statistics. This is a pressing issue in the short term, as researchers have no source of information to monitor hate-crime trends over time.
A major gap identified by senior staff in GRIDO is that PULSE does not have a marker for the nationality of the perpetrator, nor of the victim. Adding fields to PULSE for the nationality, country of birth and/or ethnicity of the victim and the perpetrator, regardless of whether the crime is motivated by hate, would be welcome.
Information on migrant background or ethnicity is sparse in data held by the DHPLG. Part of the reason for this is that local authorities are in charge of the delivery of housing services across the country. That means that special data collection efforts, such as went into producing the Summary of Social Housing Assessments, are required to produce nationwide statistics. One exception to this fragmented mode of policy delivery is the Housing Assistance Payment (HAP), which is administered centrally by the DHPLG. This may be a promising area on which to focus future data-collection efforts in housing policy.
At the time of writing, data relating to housing policy are being enhanced through CSO projects to link data from the Rental Tenancies Board (RTB) to other sources, namely the 2016 Census and the Person Income Register, which is a dataset on incomes generated from tax and welfare files.48 Matching RTB data, which give us information on rents being paid in the private rented sector, to Census data would in theory allow us to ascertain housing costs for a large share of foreign nationals, non-Irish nationals and/or ethnic minorities in Ireland.
In a more general sense, some of the challenges facing survey data also hamper these administrative sources. One issue is that migrants may be under-represented among the population covered. In the National Assessments testing procedure run
46 However, GRIDO went on to say that it continues to provide ELOs with specialist training on negotiating the intricacies
of the various forms of hate crime, and proper reporting and investigative procedures, making them well positioned to impart such information to their colleagues at station level.
47 Information provided by GRIDO. 48 See www.cso.ie/en/aboutus/lgdp/csodatapolicies/csodataprotocol/csodataprotocolregister/
46 | Data for Mon itor in g Integrat ion: Gap s, Cha l lenges and Opportuni t ies
by the ERC, teachers can exempt students if they believe they would not be able for the testing. It is possible that this exemption disproportionately affects migrant students, and may introduce selection bias to causal inference that is made using the data. Another problem is that it is extremely difficult to track the naturalised population. This is a weakness in the JLD, which captures data on nationality but not country of birth, meaning that many foreign-born, naturalised claimants are simply coded as Irish. The drawback of this is that we lose information on the subset of immigrants who have become Irish citizens – a group that we may expect to integrate particularly well.
Finally, as in survey data, government departments and agencies are subject to data protection legislation. While these rules, in particular the recent General Data Protection Regulation (GDPR), were introduced to address a specific issue, they pose challenges for both researchers and policymakers. For researchers, limits are often put in place to restrict access to certain types of information, especially if it would disclose an individual’s identity. In some cases, such as with the JLD, data are issued for the purpose of research that seeks to answer a question of interest to the holders of the data. For policymakers, data protection legislation may constrain officials’ ability to transmit data across government departments, or even across units within departments. For example, data protection legislation was identified by GRIDO as a threat to its efforts to manage the policing of hate crimes.49
49 Information provided by GRIDO.
Administrative data – other departments | 47
CHAPTER 4 APPENDIX – ADMINISTRATIVE DATA RELATING TO MIGRANT INTEGRATION
Department/Agency Dataset Outcomes Groups Availability Education
Department of Education and Skills
Primary Online Database.
School enrolment. Nationality, mother tongue, ethnic/cultural background (optional).
Summary statistics published online.
Department of Education and Skills
Post-Primary Online Database.
School enrolment. Nationality, mother tongue, ethnic/cultural background (optional).
Summary statistics published online.
Educational Research Centre
National Assessments.
School performance.
Country of birth, language spoken in the home.
Detailed results published by ERC.
Higher Education Authority
Enrolments in HEA-funded institutions.
New entrants, enrolments and graduates by ITs, colleges and universities.
Domiciliary of origin. Summary statistics published online.
Higher Education Authority
Equal Access Survey.
New entry to HEA-funded institution.
Ethnic/cultural background.
Headline figures published.
SOLAS Programme Learner Support System.
Progress through FET programme, employment outcomes, receipt of social welfare.
Nationality, ethnic/cultural background (optional).
Available from April 2017.
Tusla School Completion Programme.
Identification and targeting of potential early school leavers.
Language ability. Published online (2010–12).
Health Department of Health Healthy Ireland
Survey. Several health-related characteristics and behaviours, e.g. smoking, mental health, obesity.
Country of birth, ethnic group.
Available through Irish Social Science Data Archive.
Health Research Board National Drug Treatment Reporting System.
Drug and alcohol use.
Nationality, ethnicity. Available to researchers under certain conditions.
Department of Health/HIQA
National Patient Experience Survey.
Patient satisfaction with healthcare service.
Ethnic/cultural background.
Headline figures published (but not broken down by ethnic/cultural background).
Healthcare Pricing Office
National Perinatal Reporting System.
Range of health-related variables – birthweight, stillbirth, diseases
Nationality of mother and father.
Summary statistics published online.

48 | Data for Mon itor in g Integrat ion: Gap s, Cha l lenges and Opportuni t ies
Department/Agency Dataset Outcomes Groups Availability
affecting infants, maternal antenatal care, and maternal age.
Health Protection Surveillance Centre
HIV and AIDS. Health variable: new cases of HIV.
Global region of birth, ethnic/cultural background.
Summary statistics published online.
Health Protection Surveillance Centre
Tuberculosis cases.
No. of cases of tuberculosis per 100,000 of population.
Global region of birth.
Some high-level statistics in the Guidelines on the Prevention and Control of Tuberculosis in Ireland, 2010 (HPSC).
Health Research Board Activities of Irish psychiatric units and hospitals.
Psychiatric care units: admissions, discharges and deaths.
Ethnic/cultural background.
Headline statistics published online.
Social Welfare and Employment Department of Business, Enterprise and Innovation
Employment permits.
New and renewed permits issued by type of permit; refused and withdrawn applications.
Nationality. Summary statistics published by DBEI and SOLAS.
Department of Employment Affairs and Social Protection
Jobseekers Longitudinal Dataset.
Social welfare claims, transitions to employment.
Nationality. Available for researchers supporting DEASP business need.
Department of Employment Affairs and Social Protection
Statistical Information on social welfare services.
PPS numbers allocated, recipients of social welfare groups.
Nationality. Published in annual statistical release.
Health and Safety Authority
Fatal and non-fatal injuries and illnesses.
Workplace injuries and illnesses.
Nationality. Data available to researchers on request. Headline figures published.
Garda Racial and Intercultural Diversity Office GRIDO PULSE. Hate crimes
perceived by victims/onlookers.
Race, religion. Available to researchers under certain conditions (e.g. UL study).
Other Department of Foreign Affairs
Passports Issued by country of birth.
Passport applications and passports issued.
Country of birth. Available online.
Administrative data – other departments | 49
Department/Agency Dataset Outcomes Groups Availability Department of Housing, Planning and Local Government
Summary of Social Housing Assessment.
Need for social housing.
Nationality (migration status in case of non-EEA citizens).
Available (DHPLG, 2018).
Irish Prison Service Committals by nationality groups.
Committals to prison.
Nationality. Summary statistics published online.
Pobal IRIS database. Employment, education supports offered to beneficiaries and outcomes such as employment and self-employment.
Nationality, ethnic/cultural background.
Summary statistics published; data potentially available for analysis on request.


Data summary: strengths, gaps and challenges | 51
CHAPTER 5
Data summary: strengths, gaps and challenges
The purpose of this report is to outline the main sources of data for monitoring migrant integration from both administrative and survey sources, and identify potential use, as well as some key gaps and challenges going forward. Survey and administrative data sources tend to have different strengths and weaknesses, so they have been discussed separately. Some of the most pressing challenges involve keeping comprehensive records on unaccompanied minors and non-EEA (European Economic Area) nationals under 16; monitoring the outcomes of those who have been granted protection status in Ireland; measuring second-generation migrants; and measuring socio-cultural integration.
5.1 SURVEY DATA SOURCES
Chapter 2 discussed the major ongoing population surveys that can be used to study migrant integration. The Labour Force Survey (LFS), with both country of birth and nationality indicators, is a very good source of information for tracking labour market outcomes for migrants and non-Irish nationals, as well as their educational qualifications (see McGinnity et al., 2018a). The sample is large, and weights adjust somewhat for non-response among non-Irish nationals. There is a limited amount of information beyond basic labour market and educational outcomes – for example, there is no detailed information on the wages of respondents.
Special modules of the LFS combine a focus on topics of interest with a large sample and have been used to explore issues such as ethnicity, nationality and the experience of discrimination in the Irish labour market (McGinnity et al., 2018b).
The Census also offers great potential given its size and scope, though rules governing access to the microdata limit its use as a resource for evidence-based policymaking. Research is currently being undertaken in the ESRI to update existing knowledge of spatial segregation among the non-Irish population using the Central Statistics Office’s (CSO) geocoded output from the Census. Because the unit of analysis in this source is a geographical area rather than an individual, it is not subject to the same rules of access as the microdata. A 10 per cent sample of the Census data held in the Integrated Public-Use Microdata Series (IPUMS) at the University of Minnesota is also freely available to download. However, at the time of writing the latest file available is the 2011 Census. The analysis of Census microdata would considerably enhance what we know about migrant and ethnic minority outcomes.

52 | Data for Mon itor in g Integrat ion: Gap s, Cha l lenges and Opportuni t ies
Information on poverty, deprivation and general social exclusion among migrants is harder to come by. This is partly due to the much smaller sample size of the Survey of Income and Living Conditions (SILC), which was not designed to survey migrants. The smaller sample, combined with a survey weight that does not account for nationality, means that some non-Irish groups need to be aggregated into large categories, such as ‘non-EU’. A booster sample or another survey of social inclusion among migrants would considerably enhance our understanding of integration.
Chapter 2 also discussed a number of additional surveys that identify migrants or non-Irish nationals which have been used by researchers to investigate outcomes. This list, however, is not exhaustive, and there may be other, smaller surveys that we are not aware of. We are, however, certain that there are some groups or outcomes on which we have no representative information.
As highlighted in this report and elsewhere (e.g. Barrett et al., 2017; McGinnity et al., 2018a), there is no information on refugee outcomes in Ireland. Those who have been granted protection status are not separately identified in social surveys. Because many naturalise after three years, they also disappear from administrative records.
Another challenge associated with measuring migrants and their integration outcomes relates to the fact that immigration is, by definition, a dynamic process. Some migrants with particularly poor outcomes may leave the State. Conversely, the most successful migrants may also be the most mobile and as a result they may be the ones who leave. Either of these processes will influence who stays in Ireland and whose outcomes we measure. Similarly, new cohorts of immigrants may differ from those already in the State in terms of their education, age, country of origin – and this may also have an impact on integration outcomes. This means it is important for research on integration to consider the impact of immigration and emigration flows on the size and characteristics of the migrant population living in Ireland.
Our knowledge of the growing second generation in Ireland from survey data remains patchy. Those who naturalise become indistinguishable from the Irish population; children born in Ireland to migrant parents are typically not separately identified in surveys. Ethnicity is rarely measured, aside from the Growing Up in Ireland survey, the Quarterly National Household Survey (QNHS)/LFS Equality Modules and the Census.
Ongoing general population surveys offer considerable scope for comparing outcomes between the migrant and non-migrant population when the samples are
Data summary: strengths, gaps and challenges | 53
large enough. However, this means there is a considerable gap in sources of information that are specifically related to migrants. This is particularly true in the area of socio-cultural integration; for example, migrants’ feeling of belonging in Ireland, their intentions to stay, English-language skills, social contact with the Irish population, and work experience in their country of origin. As pointed out in Chapter 2, this information could only be collected in a dedicated survey of migrants. Small surveys have been fielded, but they are limited to certain groups and outcomes. Partly because of resource constraints and also due to the challenges of fieldwork, a large survey of the migrant population in Ireland has not yet been fielded. This remains the largest gap in our understanding of the socio-cultural integration of migrants in Ireland.
5.2 ADMINISTRATIVE DATA SOURCES
There is no population or migrant register in Ireland and only non-EEA migrants are required to register with the State. 50 This means that there is no regularly updated count of the total migrant population in Ireland. Very reliable figures are available from the Census, but only at five-year intervals. The CSO population and migration estimates are used to update figures on a more regular basis, but these are subject to revision in light of the Census (see McGinnity et al., 2018a).
5.2.1 Data held by the Department of Justice and Equality
Non-EEA migrants are required to register with the Garda National Immigration Bureau (GNIB), so in principle detailed information about this group should be available, including their number and reasons for coming to Ireland. However, some significant concerns were raised in Chapter 3 about the quality and completeness of data held by the Irish Naturalisation and Immigration Service (INIS), though there is considerable potential for improvement and consolidation of data in the new Reporting and Analysis Unit (RAU) ‘Reshape’ project, and a new GNIB registration system is planned.
Data on applications for citizenship are published annually by age and nationality, but no such breakdown is available by gender. Information on applications for long-term residence is also regularly published.
While there are data on registered adult non-EEA migrants, recipients of the different types of residence permissions (stamps) are diverse, meaning that disaggregating by stamp is of limited use. Drawing meaningful categorisations from residence permissions data is labour-intensive. Reorganising residence permissions issued could lead to considerably more information regarding who is
50 The AISIP database contains an individual person record per person, to which unlimited application records may be
linked, as such available data are limited to applications and applicants.

54 | Data for Mon itor in g Integrat ion: Gap s, Cha l lenges and Opportuni t ies
living in the state and why. INIS indicated that this will be addressed with the introduction of the new GNIB-IS registration system, and with work currently under way to reorganise stamps and permissions.
Residence permit data are still not collected on non-EEA children, despite the revised Employment Permits Act having introduced an amendment to allow this, and the Migrant Integration Strategy listing the registration of non-EEA minors as a matter of urgency.
At present processing data on applications for family reunification, an important element of integration, are not available for economic migrants and are not regularly published for beneficiaries of international protection. This data gap has been highlighted by some as a significant issue for Ireland (Cosgrave and Thornton, 2015). Many European countries face challenges regarding statistics on family reunification. However, some, such as Belgium and Norway, collect detailed data on applicants, family members, reason for reunification, etc. (European Migration Network, 2017).
No national-level data exist on the number of unaccompanied minors in the State, and this has been highlighted as a considerable deficit and challenge to the development of appropriate policy responses (Groarke and Arnold, 2018). Data on non-asylum-seeking unaccompanied children are limited to the Dublin-based Social Work Team for Separated Children Seeking Asylum. Consistent and comprehensive data on unaccompanied minors are essential for monitoring the outcomes of this vulnerable group.
Regarding international protection, the Office of the Refugee Applications Commissioner (ORAC) used to publish regular monthly reports. The new International Protection Office, which has taken over from ORAC, is not required to publish annual reports detailing applications and decisions. It also has no role in family reunification for beneficiaries of international protection, resulting in less data being released into the public domain.
5.2.2 Administrative data held elsewhere
Chapter 4 considered some administrative data sources not specifically designed to measure the number or outcomes of migrants or non-Irish nationals, but to deliver services to the general population, including to immigrants.
Considerable scope for analysis was identified in the Jobseekers Longitudinal Dataset held by the Department of Employment Affairs and Social Protection (DEASP). Analysis has begun within the department on durations on the live register for different nationality groups. Research on other types of benefit receipt
Data summary: strengths, gaps and challenges | 55
could be conducted, including receipt of payments to lone parents or illness and disability payments. This data source can be used by external researchers if the research purpose meets the needs of the DEASP.
Critically for the purpose of this report, the administrative data on employment permits, for those who require them, contains information on the details of employment, including sector, occupation, county of employment and salary. We can also determine information on the individual attaining the employment permit, including their level of education and, most importantly, their country of origin. These data, held by the Department of Business, Enterprise and Innovation, provide us with an accurate and detailed appraisal of the labour market situation of non-EEA nationals in Ireland.
In the area of health, repeated surveys such as the Healthy Ireland Survey and the National Patient Experience Survey are high-quality data sources for researchers interested in health behaviours and patient experience. The National Perinatal Reporting System captures information on a range of health-related variables around childbirth, and the nationality of the mother and, where available, of the father are also recorded in the database. One serious omission from the perspective of migrant integration is the Hospital In-Patient Enquiry database. In 2016, 1.7 million hospital discharges were recorded, but no data are gathered on the patient’s nationality, country of birth or ethnicity.
In education, the Primary Online Database (POD) and the Post-Primary Online Database (P-POD) offer considerable potential for understanding the concentration of migrants in different schools. This is a sensitive issue, so anyone conducting such research would need take care to avoid ‘profiling’ or identifying individual schools with high proportions of minority populations. As discussed in Chapter 4, little is known about the academic achievement of immigrant students. Leaving Certificate results are processed by student Personal Public Service (PPS) number, so there might be potential to match these results to data on, for example, nationality and mother tongue from the P-POD. However, consideration would need to be given to both data protection issues and concerns about the quality and completeness of these data on the P-POD.
Regarding higher education, the Higher Education Authority (HEA) publishes annual data on enrolment in HEA institutions by ‘domiciliary of origin’.51 This allows us to quantify the flow of immigrants into higher education in Ireland and is particularly useful when compared to estimates of the overall population of each group. The HEA also gathers data on ethnic and cultural background in its Equal
51 Note that domiciliary of origin is not the same as country of birth. If a student was born abroad but had been residing
in Ireland for three of the previous five years, their domiciliary of origin would be categorised as Ireland.
56 | Data for Mon itor in g Integrat ion: Gap s, Cha l lenges and Opportuni t ies
Access Survey of third-level educational institutions. In Further Education and Training (FET), the Programme Learner Support System, a joint initiative between SOLAS and the Education and Training Boards, holds useful information related to learners. Information on nationality is collected in the system, and migrants’ progress through FET programmes can be tracked (see Chapter 4). The system also contains information on receipt of social welfare and employment outcomes upon termination of the courses. Finally, Tusla gathers data for the School Completion Programme. This dataset includes a field for language ability, which has two categories – English-speaking and non-English-speaking. The SCP data could facilitate the early identification of people at risk of dropping out of education prematurely, and would allow interventions to be targeted at them.
The Garda Racial, Intercultural & Diversity Office holds data on crimes with a discriminatory motive, which are commonly labelled ‘hate crimes’. Due to perceived under-reporting, the data on hate crimes held in PULSE (Police Using Leading Systems Effectively) have been subject to criticism by a number of organisations. Partly in an effort to address this issue, the PULSE system was reformatted in 2015. The changes resulted in a significant boost in the number of hate crimes recorded, though this means that trends over time from before and after the change cannot be interpreted.
There remain challenges in data collection and reporting of hate crimes for two reasons. The first relates to Garda training and recording of the crimes, which may be complex; the second is that some victims may simply choose not to categorise a hate-motivated incident as such. The more general concern with the quality and reliability of PULSE data has resulted in the CSO ceasing its quarterly publication of PULSE crime statistics. This is a pressing issue in the short term, as researchers have no source of information to monitor hate-crime trends over time. A major gap identified for the purposes of this report is that PULSE does not have a marker for the nationality or ethnicity of the perpetrator.
Finally, Chapter 4 highlighted how little we know about the housing circumstances of migrants. The only relevant dataset is the Summary of Social Housing Assessments, which was gathered from local authorities. Collecting and publishing data on receipt of the Housing Assistance Payment by nationality is suggested as an avenue for further development of data on migrant integration in this policy area.
5.3 AVENUES FOR FURTHER RESEARCH
This assessment of data gaps for migration in Ireland is the first of its kind. Its coverage is broad and it does not go into detail on any one topic. Therefore, a variety of avenues for further research could be explored.
Data summary: strengths, gaps and challenges | 57
First, this report has focused on the main social surveys in Ireland and on administrative data held by Irish government departments and agencies. Future research could evaluate other types of data on migrant integration. For instance, data administered by non-governmental agencies that assist the State in providing public services could be considered. These include homeless charities, religious organisations and quasi-non-governmental organisations. The Immigrant Council of Ireland (2018) recommends that data collection efforts by local authorities in the areas of social housing and homelessness, library membership and local enterprise could also be useful if they were expanded to capture ethnicity or nationality.
As mentioned in Chapter 1, a similar omission from this report is large comparative surveys. Useful information on migrants can be gleaned from the OECD’s Programme for International Student Assessment (PISA) and Programme for the International Assessment of Adult Competencies (PIAAC) educational datasets, which cover 15-year-old students and adults respectively. Data gathered by the European Foundation for the Improvement of Living and Working Conditions, such as the European Quality of Life Survey and the European Working Conditions Survey, also include valuable information on migrants. The European Agency for Fundamental Rights (FRA) conducts comparative surveys of the experience of discrimination in Europe (FRA, 2017). Finally, insights could be gained from international academic surveys on values and attitudes such as the European Social Survey, the European Values Study and the International Social Survey Programme, all of which cover Ireland. These data sources offer great potential for comparing indicators for migrants in Ireland to indicators for migrants in other European countries. Of course, for all of these surveys consideration would need to be given to how representative they are of the migrant population in Ireland. This is particularly salient given their typically small national sample sizes.
Cross-national comparison of the availability of data on migrant integration more generally was largely beyond the scope of this report. However, future studies could take this approach, particularly if they were to focus on a certain policy area. For instance, it would be useful to know if the relative shortage of data on migrants’ housing conditions is exceptional in Ireland or if similar shortages exist in other European countries. This kind of analysis could also inform Irish policymakers of ‘lessons learned’ in the collection of data on migrant integration in other jurisdictions, as different countries likely take different approaches to enhancing their data infrastructure. In considering the collection of a large-scale survey of migrants, it would be particularly useful to review the surveys of selected other countries, in terms of both sampling and questions fielded.
For any further research, or indeed any consideration of what we know from current data sources, either administrative data or surveys, the issue of

58 | Data for Mon itor in g Integrat ion: Gap s, Cha l lenges and Opportuni t ies
measurement is crucial. Nationality, place of birth, ethnicity and mother tongue all capture different groups, though there is substantial overlap between them (see Box 1.1). No one measure can cover all bases in terms of migrant integration, but measures and response categories should be consistent. Which measure is most appropriate may depend on the outcome. For example, citizenship/nationality is important for working rights (McGinnity et al., 2018b), language spoken at home is perhaps most salient for educational outcomes (McGinnity et al., 2018a), and ethnicity may be preferred for measuring the experience of discrimination (McGinnity et al., 2018b). A definition of migrants based solely on nationality has become increasingly problematic in recent years in Ireland, given the proportion of non-Irish who have naturalised and the growing second generation – those born in Ireland of migrant parents. What is clear is that the measurement challenge needs to be considered to monitor and measure the integration of immigrants and develop adequate policy responses.
References | 59
REFERENCES
Barrett, A. and E. Kelly (2008). ‘How reliable is the Quarterly National Household Survey for migration research?’, The Economic and Social Review, Vol. 39, No. 3, pp. 191–205.
Barrett, A., A. Bergin, E. Kelly, and S. McGuinness (2016). ‘Ireland’s recession and the immigrant–native earnings gap’, in M. Kahanec and K.F. Zimmermann (eds), Labor migration, EU enlargement, and the Great Recession (pp. 103–122), Berlin: Springer.
Barrett, A., F. McGinnity, and E. Quinn (2017). Monitoring report on integration 2016, Dublin: The Economic and Social Research Institute and the Department of Justice and Equality.
Barrett, A., S. McGuinness, and M. O’Brien (2012). ‘The immigrant earnings disadvantage across the earnings and skills distributions: the case of immigrants for the EU’s new member states’, British Journal of Industrial Relations, Vol. 50, No. 3, pp. 457–481.
Batista, C. and G. Narciso (2018). ‘Migrant remittances and information flows: evidence from a field experiment’, World Bank Economic Review, Vol. 32, No. 1, pp. 203–219.
Burton, J., A. Nandi, and L. Platt (2010). ‘Measuring ethnicity: challenges and opportunities for survey research’, Ethnic and Racial Studies, Vol. 33, No. 8, pp. 1332–1349.
Byrne, D., F. McGinnity, E. Smyth, and M. Darmody (2010) ‘Immigration and school composition in Ireland’, Irish Educational Studies, Vol. 29, No. 3, pp. 271–288.
Cosgrave, C. and L. Thornton (2015). ‘Immigration and asylum law’, in Making rights real for children: a children’s rights audit of Irish law, Dublin: Children’s Rights Alliance.
Cronin, H., P. Gately, and M. O’Grady (2019). Characteristics and outcomes of jobseekers of African nationality, Dublin: Department of Employment Affairs and Social Protection analysis under Action 42 of the Migrant Integration Strategy.
CSO (2017a) Survey on Income and Living Conditions, 2016 Results, Dublin: CSO Statistical Release.
CSO (2017b). Census 2016, Profile 7 – Migration and Diversity, Statbank Table E7050, available at: www.cso.ie/px/pxeirestat/Statire/SelectVarVal/Define.asp?maintable=E7050&PLanguage=0 (accessed 12 January 2019).
Daly, A. and S. Craig (2018). Activities of Irish psychiatric units and hospitals, 2017 main findings, HRB Statistics Series 38, Dublin: Health Research Board.
Darmody, M. and E. Smyth (2018). ‘Immigrant student achievement and educational policy in Ireland’, in L. Volante (ed.), The intersection of international achievement testing and educational policy, Berlin: Springer.
Darmody, M., F. McGinnity, and G. Kingston (2016). ‘The experiences of migrant children in Ireland’, in J. Williams et al. (eds), Cherishing all the children equally?, Dublin: Oaktree Press.

60 | Data for Mon itor in g Integrat ion: Gap s, Cha l lenges and Opportuni t ies
Department of Housing, Planning and Local Government (2018). Summary of social housing
assessments: key findings, Dublin: DHPLG, available at: www.housing.gov.ie/sites/default/files/publications/files/summary_of_social_housing_assessments_2018_-_key_findings.pdf
Department of Justice and Equality (2011). Administrative immigration arrangements for the protection of victims of human trafficking, Dublin: Department of Justice and Equality.
Department of Justice and Equality (2017). The Migrant Integration Strategy – a blueprint for the future, Dublin: Department of Justice and Equality, available at: www.justice.ie/en/JELR/Pages/Migrant_Integration_Strategy_-_A_Blueprint_for_the_Future
Department of Justice and Equality (2018a). Immigration in Ireland – annual review 2017, available at: www.inis.gov.ie/en/INIS/Pages/press-release-annual-review-2017?OpenDocument&start=31
Department of Justice and Equality (2018b). Data and Research Strategy 2018–2020, Dublin: Department of Justice and Equality, available at: http://justice.ie/
Diehl, C., M. Gijsberts, A. Güveli, M. Koenig, C. Kristen, M. Lubbers, F. McGinnity, P. Mühlau, and L. Platt (2015). Socio-cultural integration processes of new immigrants in Europe (SCIP) – data file for download. Cologne: GESIS Data Archive.
Diehl C., M. Lubbers, P. Mühlau, and L. Platt (2016). ‘Starting out: new migrants’ socio-cultural integration trajectories in four European destination’, Ethnicities, Vol. 16, No. 2, pp. 157–179.
Economist, The (2018). ‘Plunging response rates to household surveys worry policymakers’, 24 May, available at: www.economist.com/international/2018/05/24/plunging-response-rates-to-household-surveys-worry-policymakers
European Agency for Fundamental Rights (2017). EU-MIDIS II: Second European Union Minorities and Discrimination Survey – main results, Luxembourg: Publications Office of the European Union.
European Migration Network (2017). Family reunification of third-country nationals in the EU plus Norway, EMN Synthesis Report, Dublin: EMN.
European Migration Network (2018). Approaches to unaccompanied minors following status determination in the EU plus Norway, EMN Synthesis Report, Dublin: EMN.
Font, J. and M. Méndez (2013), Surveying ethnic minorities and immigrant populations: methodological challenges and research strategies, IMISCOE Research Series, Amsterdam: Amsterdam University Press.
Gilligan, R., P. Curry, J. McGrath, D. Murphy, M. Ní Raghallaigh, M. Rogers, J. Scholtz, and A. Quinn (2010). In the front line of integration: young people managing migration to Ireland, Dublin: Children’s Research Centre, Trinity College Dublin.
Gresser, A. and D. Schacht (2015). SCIP Survey: Causes and Consequences of Socio-Cultural Integration Processes among New Immigrants in Europe, methodological report, Konstanz: NORFACE, available at: https://www.uni-goettingen.de
References | 61
Groarke, S. and S. Arnold (2018). Approaches to unaccompanied minors following status determination, Dublin: European Migration Network/The Economic and Social Research Institute.
Haase, T. and J. Pratschke (2004). New measures of deprivation based on the Census of Population, 1991, 1996 and 2002, Dublin: Pobal.
Haynes, A. and J. Schweppe (2017). Lifecycle of a hate crime: country report for Ireland, Dublin: ICCL.
HPSC (2010). Guidelines on the prevention and control of tuberculosis in Ireland 2010, Dublin: Health Protection Surveillance Centre.
Immigrant Council of Ireland (2016). Child migration matters, Dublin: ICI.
Immigrant Council of Ireland (2018). Keeping it local: discussion document and proposed actions for local authorities on developing local migrant integration strategies, Dublin: ICI.
Joyce, C. and E. Quinn (2009). Policies on unaccompanied minors in Ireland, Dublin: The Economic and Social Research Institute.
Kilkelly, U. (2007). Barriers to the realisation of children’s rights in Ireland, Dublin: Ombudsman for Children’s Office.
Kraler, A., D. Reichel, and H. Entzinger (2015). ‘Migration statistics in Europe: a core component of governance and population research’, in P.W.A Scholten et al. (eds), Integrating immigrants in Europe, Berlin: Springer.
McGinnity, F., É. Fahey, E. Quinn, S. Arnold, B. Maître, and P. O’Connell (2018a). Monitoring report on integration 2018, Dublin: The Economic and Social Research Institute/Department of Justice and Equality.
McGinnity, F. and M. Gijsberts (2017). ‘The experience of discrimination among newly arrived Poles in Ireland and the Netherlands’, Ethnic and Racial Studies, Vol. 41, No. 5.
McGinnity, F., R. Grotti, S. Groarke, and S. Coughlan (2018b). Ethnicity and nationality in the Irish labour market, Dublin: The Economic and Social Research Institute/Irish Human Rights and Equality Commission.
McGinnity, F., R. Grotti, O. Kenny, and H. Russell (2017). Who experiences discrimination in Ireland? Evidence from the QNHS equality modules, Dublin: The Economic and Social Research Institute/The Irish Human Rights and Equality Commission.
McGinnity, F., P. O’Connell, E. Quinn, and J. Williams (2006). Migrants’ experience of racism and discrimination in Ireland, Dublin: The Economic and Social Research Institute.
McGinnity, F., E. Quinn, G. Kingston, and P.J. O’Connell (2012). Annual monitoring report on integration 2011, Dublin: The Economic and Social Research Institute/Integration Centre.
McGinnity, F., E. Quinn, G. Kingston, and P.J. O’Connell (2014). Annual monitoring report on integration 2013, Dublin: The Economic and Social Research Institute/Integration Centre.

62 | Data for Mon itor in g Integrat ion: Gap s, Cha l lenges and Opportuni t ies
McGinnity, F., E. Quinn, P.J. O’Connell, and N. Donnelly (2011). Annual monitoring report
on integration 2010, Dublin: The Economic and Social Research Institute/Integration Centre.
Mühlau, P., M. Kaliszewska, and A. Röder (2011). ‘Respondent-driven sampling of immigrant communities: methodological challenges and some experiences from “Polonia in Dublin”’, Sociological Association of Ireland Annual Conference, Cork, 7–9 May.
Nolan, A. (2012). ‘The “healthy immigrant” effect: initial evidence for Ireland’, Health Economics, Politics and Law, Vol. 7, pp. 343–362.
O’Connell, P.J. and F. McGinnity (2008). Immigrants at work: nationality and ethnicity in the Irish labour market, Dublin: Equality Authority/The Economic and Social Research Institute.
O’Connell, P.J. (2018). Why are so few Africans at work in Ireland? Immigration policy and labour market disadvantage, Geary WP2018/16, Dublin: UCD Geary Institute for Public Policy.
Probation Service (2017). Probation Service Annual Report, 2016, Dublin: The Probation Service, available at: http://www.probation.ie/en/PB/Pages/WP17000014
Quinn, E., C. Joyce, and E. Gusciute (2014). Policies and practices on unaccompanied minors in ireland, European Migration Network, Dublin: The Economic and Social Research Institute.
Röder, A., M. Ward, and C.A. Frese (2018). ‘From labour migrant to stay-at-home mother? Childcare and return to work among migrant mothers from the EU accession countries in Ireland’, Work, Employment and Society, Vol. 32, No. 5, pp. 850–867.
Smyth, E., J. Banks, A. Whelan, M. Darmody, and S. McCoy (2015). Review of the School Completion Programme, Research Series No. 44, Dublin: The Economic and Social Research Institute.
Tusla (2012). Young people identified to be at risk of early school leaving, Bulletin No. 4, available at: www.tusla.ie/services/educational-welfare-services/publications/scp-publications/
UNHCR (2014). Refugee integration, capacity and evaluation in Europe: Ireland Report, Dublin: UNHCR.
Waters, M.C. (2014). ‘Defining difference: the role of immigrant generation and race in American and British immigration studies’, Ethnic and Racial Studies, Vol. 37, pp. 10–26.
Watson, D., O. Kenny, F. McGinnity, and H. Russell (2017a). A social portrait of Travellers in Ireland, Research Series No. 56, Dublin: The Economic and Social Research Institute.
Watson, D., C.T. Whelan, B. Maître, and J. Williams (2017b). Non-monetary indicators and multiple dimensions: the ESRI approach to poverty measurement, Economic and Social Review, Vol. 48, No. 4, pp. 369–392.
References | 63
Wren, M.A., C. Keegan, B. Walsh, A. Bergin, J. Eighan, A. Brick, S. Connolly, D. Watson, and J. Banks (2017). Projections of demand for healthcare in Ireland, 2015–2030: first report from the Hippocrates Model, Research Series No. 67, Dublin: The Economic and Social Research Institute.


Whitaker Square,Sir John Rogerson’s Quay, Dublin 2Telephone +353 1 863 2000Email [email protected] www.esri.ieTwitter @ESRIDublinISBN 978-0-7070-0483-9
Migrant Integration Strategy 2017-2020