data for effective policy and decision · pdf filedata for effective policy and...
TRANSCRIPT

DATA FOR EFFECTIVE POLICY AND DECISION-MAKING IN INDIANA: ASSESSING ITS AVAILABILITY,
ACCESSIBILITY, AND ANALYSIS
Timothy D. Hogan, Ph. D. Professor of Economics Emeritus
Arizona State University
Prepared for the
Central Indiana Corporate Partnership
January 2005

TABLE OF CONTENTS
Page Executive Summary......................................................................................... 1 1. Introduction ................................................................................................. 4 2. The Current Data Environment ................................................................... 6 Where Do Policy Makers Go for Information? .................................... 6 How Well Is the Current Data Environment Meeting the Needs of Policy Makers? ................................................. 9 3. The Current Policy Analysis Environment .............................................. 12 State Government ............................................................................... 12 Non-Government ................................................................................ 14 4. Best Practices ............................................................................................ 19 Two Examples of Current Excellence ............................................... 19 Seven Dimensions of Best Practices ................................................ 20 5. Recommendations..................................................................................... 26 References .................................................................................................... 32 List of Key Informants ................................................................................... 37 Author ............................................................................................................. 39
DATA FOR EFFECTIVE POLICY AND DECISION-MAKING IN INDIANA: ASSESSING ITS AVAILABILITY, ACCESSIBILITY, AND ANALYSIS
EXECUTIVE SUMMARY
Indiana’s public policy makers and administrators, business executives, and non-profit leaders require convenient access to accurate, timely data and analysis concerning the state, its communities, its citizens, and its economy to carry out their responsibilities properly. Some Indiana leaders feel that information they need is not available or is difficult to find or use. As a result, they have problems determining if public initiatives are effective, comparing Indiana’s progress against other states, and clarifying strategic gaps that the state should address. This study evaluates the current status of data collection, analysis, and dissemination in Indiana. As part of the analysis, more than 80 policy makers, representatives of major data producers, and data users from across Indiana were interviewed to identify the data they need, solicit their opinions on the completeness, accuracy, and usability of existing data, determine the data or analyses they need that are not readily available, and gather their suggestions for improving the current situation. The study also included a survey of the best practices among other states to benchmark Indiana’s performance and to find innovative approaches in the areas of data collection, interpretation, analysis, and dissemination. Assessment of the Current Environment Some policy makers say they are able to obtain the data they need and are reasonably satisfied with the current situation. Many others are very dissatisfied with the current data environment. Their dissatisfaction is caused by a long list of problems. Most of these issues result from two fundamental conditions throughout state and local government: lack of sufficient resources allocated to data-related activities and limited implementation of information technology. These problems were identified by individuals from outside and inside state government. When policy makers say that they cannot get the data they need, they often really mean that they cannot get data in a form that is useable for their purposes. In many instances, policy makers want to receive an interpretation or analysis of the data rather than to examine the data themselves. While there are many places where interpretations of some kinds of data for Indiana can be found, policy makers looking for timely non-partisan interpretation of a particular type of data are lucky if their search is successful. The same story holds true for policy analysis. In most cases, policy makers in Indiana have to rely upon special studies prepared by universities or private consultants and often commissioned by private organizations or foundations.
1

This approach has resulted in the current environment in which up-to-date, in-depth, non-partisan analyses are not available for many of the public policy issues facing policy makers in Indiana. In summary, the current data environment does not adequately meet the needs of Indiana policy makers. The shortcomings of the current situation can be stated succinctly:
(1) Many types of data are difficult to obtain or are unavailable. (2) Timely, objective interpretation is not available for many types of data. (3) Objective data-based analyses are not available for many public policy
issues. Recommended Actions In order to move from the current antiquated system to an environment in which the information necessary for policy makers and managers to make informed decisions is being produced and is easily accessible, the Governor and the Legislature should work together and with others to establish a State Data Initiative that would: (a) develop an overall vision for data collection, analysis, and dissemination in the state of Indiana; (b) develop a plan for implementing the Initiative; (c) confirm and prioritize the data needs of the state; (d) improve the quality, quantity, and usability of data being produced by and for state government and other stakeholders; (e) provide for the interpretation and analysis of that data; and (f) facilitate the dissemination of the data and analysis. The Governor and Legislature should seek the involvement of the state’s universities, business and non-profit sectors, and the public to help shape and implement the Initiative. Such an initiative would be composed of three primary phases: (1) the planning phase; (2) the implementation phase (parts of which could begin while other aspects are still in development) that will require relatively modest investments by the public sector with perhaps some private sector contributions as well; and (3) a continuing phase that would require regular budgets for the data/research units of state agencies and other data producers to support expanded and improved data collection, analysis, and dissemination activities. This State Data Initiative should include implementation of nine more specific recommendations:
(1) Designate or establish an organization to implement and manage the State Data Initiative.
(2) Increase awareness of and access to existing data. (3) Improve the usability of existing data. (4) Develop new data to answer the needs of policy makers.
2

(5) Encourage the standardization of regional definitions. (6) Increase the production of data for regions and local areas. (7) Establish a system to produce objective interpretations and analyses of
data. (8) Establish a system to produce thorough, nonpartisan analyses of
important policy issues. (9) Consider the establishment of a comprehensive indicator system for the
state of Indiana as part of a state strategic planning process.
3

DATA FOR EFFECTIVE POLICY AND DECISION-MAKING IN INDIANA: ASSESSING ITS AVAILABILITY, ACCESSIBILITY, AND ANALYSIS
1. INTRODUCTION
To carry out their responsibilities properly, Indiana’s public policy makers and administrators, business executives, and non-profit leaders require convenient access to accurate, timely data and analysis concerning the state, its communities, its citizens, and its economy. Such data and analysis should serve to inform discussion about policy alternatives, to monitor progress toward strategic goals, and to help in managing businesses, social services, and public activities. Some Indiana leaders feel that information they need is lacking or difficult to find or use. As a result, they may have problems determining if public initiatives are effective, comparing Indiana’s progress against other states, and clarifying strategic gaps that the state should address. This study was commissioned by the Central Indiana Corporate Partnership and the CICP Foundation to inventory and evaluate the current status of data collection, analysis, and dissemination in Indiana. The analysis focuses on publicly available data from national or state-level sources for the state of Indiana, its regions, and its local governmental subdivisions. As part of the analysis, more than 80 policy makers, representatives of major data producers, and data users from across Indiana were interviewed to:
(1) identify the types of data they need and the sources they use to obtain the data;
(2) solicit their comments on the completeness, accuracy, and usability of existing data and data sources;
(3) determine the kinds of data or analysis they need that are not readily available;
(4) gather their suggestions for improving the current data environment. The study also included a survey of the best practices among other states to address needs of data availability, interpretation, and analysis. The search for best practices used three approaches:
(1) An evaluation of each of the 50 state websites with respect to availability, accessibility, comprehensiveness, and ease of use of the types of data needed by policy makers.
(2) A search for states receiving awards or top rankings in evaluations by professional organizations, such as the Center for Digital Government.
4

(3) Interviews of knowledgeable informants, including staffs of the National Conference of State Legislatures and the Center for Excellence of the National Governors Association.
Following this introduction, Section 2 summarizes an evaluation of Indiana’s current data environment. Much of the discussion is based on responses from knowledgeable informants supplemented by personal observation. Section 3 provides an evaluation of the degree to which good analytical interpretation of data and data-based analysis of public policy issues are available. It also discusses where policy makers go for interpretation and analysis. Section 4 summarizes the results of the best practices investigation. Section 5 offers recommendations to improve data collection, management, and dissemination in Indiana.
5

2. THE CURRENT DATA ENVIRONMENT In this age of personal computers and the Internet, policy makers have the ability to acquire information on a myriad of subjects more easily than ever before. Even so, the particular data or analysis they need to inform their decisions still may not be available or may be more difficult to obtain than it should be. Policy makers (and all others searching for data) in Indiana are very lucky to have the award-winning STATS Indiana, the web-based information center provided by the Indiana Business Research Center, a division of Indiana University’s Kelley School of Business. For the relatively broad range of topics included in the website, it provides immediate access to data or provides a link to the best source(s) for the desired information. STATS Indiana is not the only web-based information center housing many of the types of Indiana information of interest to policy makers. For those interested in Indianapolis area data, SAVI, a large integrated information system under development at the Polis Center at Indiana University-Purdue University at Indianapolis (IUPUI), includes information from 40 data providers relating to the eleven counties in the Indianapolis Metropolitan Statistical Area. There also are similar information centers, on a smaller scale, containing information for particular regions of the state, such as the Allen County Profile (a joint undertaking of the Community Partnership, Inc., the City of Fort Wayne, and the Community Research Institute at Indiana University-Purdue University Fort Wayne [IPFW]). While the ability to access such web-based information sources makes obtaining data more convenient, it does not mean that every kind of information is now easy to get. In particular, individuals looking for very specific or very detailed data find the situation much less satisfactory. More complicated data needs often still require the generation of custom reports or data files from raw data stored in inaccessible databases. Or even worse, the only way to obtain the data may be by going through archived paper forms or reports or by actually conducting a survey. And when policy makers do not have the time and/or resources to obtain hard data, they turn to ad hoc sources – newspaper articles, experts’ opinions, interest groups, or lobbyists. Where Do Policy Makers Go for Information? Obviously, policy makers in Indiana face a wide range of issues and so potentially need information about a great many topics, but this discussion will focus on eight major types of data:
6

Workforce Data For data relating to workforce issues, the primary sources of data are the Indiana Department of Workforce Development (DWD, the state agency responsible for producing employment, unemployment, wage, and other labor market information for Indiana as part of the national data program funded by the U.S. Bureau of Labor Statistics (BLS)) and STATS Indiana. Some analysts also go to the BLS website to access Indiana data. For data relating specifically to Indianapolis, the Indianapolis Private Industry Council compiles some occupational data not available from the two primary sources. And some policy makers from outside Central Indiana mentioned sources within their regions, including the Bureau of Business Research at Ball State University and the Community Research Institute at IPFW. For detailed workforce data relating to specific sectors not available from the sources mentioned previously, policy makers must turn to studies based on information collected by special surveys, such as the Indiana Health Industry Forum’s Indiana Health Industry Workforce Study, or to special tabulations of the Indiana ES202 file (a DWD dataset containing employment and wage data from individual firms). Data gaps identified by policy makers are information about the skills and training of the workforce, more detailed data on the supply and demand for workers in specific industries and/or occupations, and more detailed workforce projections. Other Economic Data For other types of economic information, the primary sources are either STATS Indiana or the federal agencies that compile much of the data, such as the U.S. Census Bureau and the U.S. Bureau of Economic Analysis. Again, those from outside the Central Indiana region often go to the research centers at IPFW and Ball State for some of their data needs. More information relating to the small business sector and entrepreneurial activity in the state was mentioned by policy makers as critical data needs. Demographic Data The primary sources for demographic information are STATS Indiana and the U. S. Census Bureau website. Those interested only in data for the Indianapolis metropolitan area can access detailed demographic data through SAVI.
7

Government Data For data relating to state finances, the primary sources are the State Budget Agency and the Department of Revenue. For financial information relating to local governments, the primary source is the Department of Local Government Finance, and for school districts, it is the Department of Education. Obtaining other than summary data usually involves making a request for the information to the agencies. For other types of information relating to the government sector, policy makers rely on information from the individual state agencies and from non-governmental organizations, such as the Association of Indiana Counties, the Indiana Association of Cities and Towns, and data from the U. S. Census Bureau (Census of Governments). Criticism of both the quality and quantity of information available relating to the government sector was widespread among policy makers. The lack of performance and cost measures for all levels of government, information about the local impacts of government policies, and difficulties with obtaining data for local governments were mentioned most often. Education Data The primary source of information relating to K–12 education in Indiana is the state’s Department of Education through its IDEAnet web portal and off-line databases. For higher education data, those in higher education generally go to national sources, such as the National Center for Educational Statistics, the National Association of Independent Colleges and Universities, and the Association of American Universities. Others use the national sources but also get information from the state’s Commission on Higher Education and the Indiana Association of Independent Colleges. Gaps in education data cited by policy makers are information relating to adult and career education and more detailed enrollment and graduation data. Health Data The primary local sources for data relating to health and health care are the Department of Health, the Indiana Hospital and Health Association, and the Indiana Health Industry Forum. In most cases, it is necessary to make a request for the information, since these sources provide only minimal data on their websites. These in-state sources are supplemented by information provided by national sources, such as the National Center for Health Statistics and the Center for Disease Control.
8

Data Relating to Social Well-Being There is no single source of state-wide information relating to the different dimensions of social well-being. The annual Kids Count report and its related database, both products of the Indiana Youth Institute, provide data relating to many social measures, not all specific to children. Policy makers interested in data relating to the Indianapolis metropolitan area can access a wide range of social data through the SAVI database. Many policy makers needing only summary information often find it more convenient to access Indiana data from national sources using the Internet. For more detailed data relating to a particular social issue, the typical approach is to go to the appropriate state agency – the Family and Social Services Administration for social service data, the Department of Environmental Management for data relating to the environment, etc. In most cases, this involves making a request for the information, since most agencies provide only minimal data on their websites. Data relating to social well-being was another area in which policy makers had numerous complaints relating to both quality and availability. Probably most critical is the need for more and better information of all types for areas outside of the metropolitan Indianapolis area. Agriculture Data
The primary source is the Indiana Agricultural Statistics Service, a joint venture between Purdue University and the United States Department of Agriculture's National Agricultural Statistics Service.
How Well Is the Current Data Environment Meeting the Needs of Policy Makers? Some policy makers are able to obtain the data they need and are reasonably satisfied with the current situation. Most of these people would not be characterized as “heavy data users.” These individuals usually access the information through STATS Indiana or directly through an individual state agency’s or a non-governmental organization’s website. For more detailed information, these users generally are able to obtain the information they need through a specific request to the appropriate state agency or other organization. Many other people are very dissatisfied with the current data environment. Their dissatisfaction is caused by a long list of problems. Some, but not all of these issues stem from two fundamental conditions that currently exist throughout state and local government: lack of sufficient resources (staff, hardware, and software) allocated to data-related activities and limited implementation of information technology. These problems were identified by individuals from outside and inside government (both the executive and legislative branches). As a result:
9

(1) Many areas of government are not able to provide data relating to their
own operations or to programs or activities for which they are responsible. (2) The current situation is characterized by separate data systems within
each agency or even individual units or programs within an agency rather than integrated databases;
(3) Most of the data that have been collected or produced are not made readily available even in aggregated form;
(4) Reports and/or data files that are produced are difficult to use for policy analysis;
(5) Most of the agency websites contain limited data and do not incorporate information technology that allows efficient access to the data.
The problems with the current data environment in Indiana can be split into two basic issues: “the data I need are not available” and “getting the information I need is a lot harder than it should be.” “The Data Are Not Available” In many cases, data desired by policy makers are not available. This occurs for a variety of reasons including:
(1) The analyst needs data tabulated in a non-standard way, and the existing data records do not contain the information needed to produce the desired tabulations. One example is detailed enrollment and graduation data from Indiana’s colleges and universities. Policy makers would like information concerning the supply of specific types of knowledge workers in the life science, advanced manufacturing, and information technology clusters. Current statistics are classified by traditional academic disciplines and are not usable for this purpose.
(2) Local jurisdictions use different data formats and/or software, making it difficult to combine the data into a consistent statewide data set. One example is property tax assessment data. The property tax assessment process occurs at the local level using different data processing and record keeping systems, and no centralized database of this data for the entire state has been available.
(3) While the information exists, it is not compiled into a centralized data set. For example, the Department of Education collects financial and other data at the school corporation level, but not for individual schools because there is no requirement for school-level data to be reported.
(4) In some cases, the only way to collect the information would be through a survey of individual households, business firms, or other types of organizations, and the resources needed to undertake such efforts are not available. One example is better workforce data. Policy makers say that they need detailed information on skills and training profiles of workers,
10

but current state funding for DWD labor market information programs does not provide for surveys needed to collect such data.
(5) Specifically with respect to regional data, many respondents were dissatisfied with the current situation for two reasons:
a) Several different and inconsistent regional classification schemes are now in use. This means that data produced using one scheme cannot be used with or compared with data based on a different regional definition.
b) In their view, the current regional definitions are incorrect. This criticism has several variants, including the obvious — the regions should either include other counties or not include some counties that are included, but policy makers also argue that the correct definitions for some regions should include parts of other states.
“Harder To Get Than It Should Be”
(1) Difficulties in finding and accessing data — In many cases, finding data may be involved and time-consuming. Although many indexes of Indiana data sources are available (for example on STATS Indiana and on the State Library website), they often provide relatively general references or links, so that the search process generally must continue further at the suggested source.
(2) Data not available in a format convenient for analysis — Data are typically provided in the form of a report or in tabular form (either in printed form or on a website). Computer analysis of data from reports or tables requires a data entry step that is often expensive, time-consuming, and prone to error. If the data were available in databases or as downloadable files, it would allow an analyst to obtain the data directly in a format that can be used by statistical or data analysis software.
(3) Data are collected for administrative or regulatory purposes, and neither the data nor the standard reports produced from the data are useful for policy analysis.
(4) Confidentiality issues — Some kinds of data are not made available for policy analysis due to confidentiality restrictions. In some cases, there is an absolute restriction, such as data relating to individual taxpayers or individual firms. In other instances, regulations prohibit the release of some summary data because it might be possible to deduce information about an individual household or firm.
(5) Difficulty encountered by analysts trying to construct a dataset that integrates two or more kinds of data — When the desired data can be accessed through a federal agency website, such as the U. S. Census Bureau’s site, it can be relatively easy to produce a data file that contains the desired data. But in most cases, the process requires considerably more effort. The much more likely case requires going to separate sources for each of the different types of data and then having to do more work to combine the separate components into a single dataset.
11

3. THE CURRENT POLICY ANALYSIS ENVIRONMENT In many instances, policy makers want an interpretation of the data or a fact-based analysis of a policy issue rather than to examine the data themselves. In fact, when many policy makers say that they cannot get the data they need, they often really mean that they cannot get data in a form that is useable for their purposes — they need someone who is skilled in manipulating and interpreting data to prepare a summary or an analytical report to make the data useful to them. While it is possible to find useful interpretations of some types of Indiana data and analytical reports dealing with some policy issues of interest to policy makers in Indiana, the current situation is far from satisfactory. Timely, non-partisan interpretation or analysis is not readily available for most types of data. State Government Executive Branch (Note: This discussion is based on the situation as it existed in the Kernan administration in 2004.) There is no dedicated research or policy analysis unit within the Governor’s Office. As part of the Governor’s Office staff, there are eight policy directors with responsibilities for different policy areas. To gather data or analysis relating to a particular policy issue, the policy directors get the information they need wherever they can — state agencies, research centers or experts at the state’s universities, or a wide variety of other sources depending on the particular circumstances. These outside sources include both national, such as the National Governors’ Association, and local, such as the Indiana State Teachers Association or even knowledgeable individuals. Nor is there a central agency within the executive branch with an overall policy analysis or planning responsibility. Research and data responsibilities reside within the individual state agencies. The agencies’ capabilities vary widely, but in general they have limited capacity and produce little in the way of data interpretation or policy analysis. Some agencies produce publicly-available publications that contain some data, but few go further to include analysis of the data. For example, the Department of Education produces a biennial Digest of Public School Finance in Indiana, and the Department of Health publishes various newsletters and annual reports relating to individual program areas. Some agencies produce reports for the General Assembly, but again these typically do not include much interpretation or analysis. If the information cannot be obtained from a website or printed documents, it is necessary to make a specific request to an agency for information. This process can often take considerable time and effort.
12

Legislative Branch The Legislative Services Agency (LSA), the non-partisan research arm of the Legislature, has two divisions: the Office of Bill Drafting and Research, which has a staff of lawyers who do legal research; and the Office of Fiscal and Management Analysis, with a staff of approximately 15 analysts who do fiscal and policy analysis. When the legislature is in session, the Fiscal and Management division is kept very busy producing Fiscal Notes (brief documents summarizing each bill and discussing its probable fiscal effects on state government) and is able to provide only a limited amount of research assistance to legislators. During off-session periods, the LSA is able to provide more research assistance. The only annual publication of the LSA is the Indiana Handbook of Taxes, Revenues, and Appropriations. Aside from the fiscal notes, they do not issue publicly available reports summarizing policy analyses. Since the state eliminated its sunset review process, the LSA now only has one dedicated staff person to do program evaluations at the request of the Legislative Council. In the past year, one report on an evaluation of the Family and Social Services Administration was prepared. The four legislative caucuses also have very small staffs that include fiscal and policy analysts. They provide short-term research support, primarily for the leadership and for the Ways and Means and Finance Committees. Individual committees and commissions established by the General Assembly may issue reports. The Legislative Council also establishes study committees to investigate and make recommendations concerning the topics assigned to them. During the 2004 session, these commissions and committees produced 55 reports. Many of these reports are brief and only summarize the activities of the group, but some — such as the series of reports recently issued by the Government Efficiency Commission — include detailed financial and other analyses of several state agencies. State agencies also submit reports to the General Assembly. The General Assembly’s website currently lists 77 reports. Most do not provide analysis or interpretation, except for a few, such as the Family and Social Services Administration’s Indiana Child Health Insurance Program Annual Evaluation Report (prepared by an outside consultant). Thus, the situation is one in which neither branch of state government has enough staff or other resources assigned to the research/analysis function, and little publicly available policy analysis is produced within state government. Long-term Policy Analysis Further, there is really no one in state government responsible for in-depth policy analysis dealing with the big issues that are vital to the future of the Indiana — either in terms of:
13
(1) monitoring the progress of the state with respect to fundamental public goals — e. g. economic prosperity, quality education, safe communities, a sustainable environment — on an on-going basis; or (2) conducting in-depth analyses of specific policy issues.
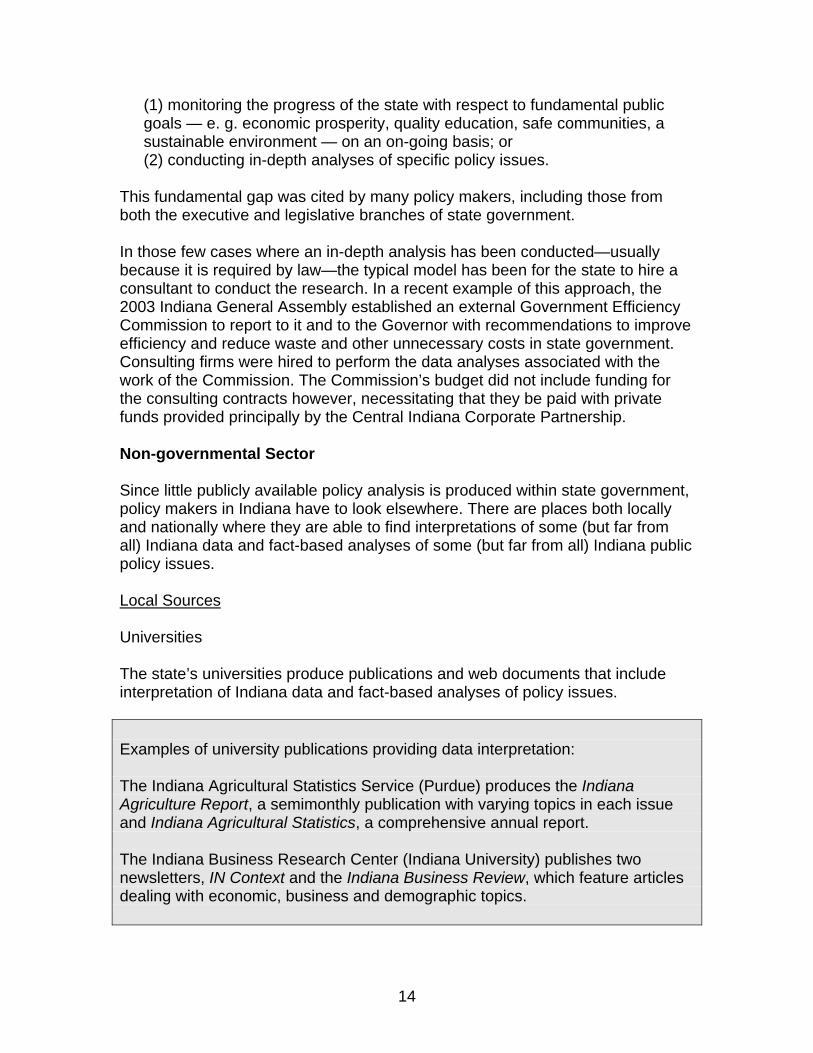
This fundamental gap was cited by many policy makers, including those from both the executive and legislative branches of state government. In those few cases where an in-depth analysis has been conducted—usually because it is required by law—the typical model has been for the state to hire a consultant to conduct the research. In a recent example of this approach, the 2003 Indiana General Assembly established an external Government Efficiency Commission to report to it and to the Governor with recommendations to improve efficiency and reduce waste and other unnecessary costs in state government. Consulting firms were hired to perform the data analyses associated with the work of the Commission. The Commission’s budget did not include funding for the consulting contracts however, necessitating that they be paid with private funds provided principally by the Central Indiana Corporate Partnership. Non-governmental Sector Since little publicly available policy analysis is produced within state government, policy makers in Indiana have to look elsewhere. There are places both locally and nationally where they are able to find interpretations of some (but far from all) Indiana data and fact-based analyses of some (but far from all) Indiana public policy issues. Local Sources Universities The state’s universities produce publications and web documents that include interpretation of Indiana data and fact-based analyses of policy issues. Examples of university publications providing data interpretation: The Indiana Agricultural Statistics Service (Purdue) produces the Indiana Agriculture Report, a semimonthly publication with varying topics in each issue and Indiana Agricultural Statistics, a comprehensive annual report. The Indiana Business Research Center (Indiana University) publishes two newsletters, IN Context and the Indiana Business Review, which feature articles dealing with economic, business and demographic topics.
14

The Business Research Center at Ball State University produces the Indiana Business Bulletin, also providing interpretation and analysis of economic and business data. These and other university-based research units also engage in program evaluation and policy analysis on at least some of the policy issues of interest to policy makers in Indiana. Examples of analytical publications produced by Indiana’s universities: The Center for Families (Purdue) publishes research reports on family-related topics, including analyses of public policy actions in Indiana, such as The Effect of Changes in Tax Policy on Indiana Families and An Evaluation of the Indiana Child Care Financing Initiative. The Center for Philanthropy (IUPUI) produces research reports analyzing the non-profit sector, such as The Indiana Non-Profit Sector and Indiana Gives, a study of the giving and volunteer behavior of Indiana citizens. The Center for Rural Development (Purdue) has published research reports on public policy issues such as Is Riverboat Gambling an Effective Economic Development Strategy for Indiana Communities? and The Indiana Fair Market Value Study. The Center for Urban Policy and the Environment (IUPUI) has a research agenda covering many areas of interest to Indiana policy makers, including ongoing research projects on such topics as Central Indiana’s future, regional investment and economic development, land use, intergovernmental relations, and public goods and services. The Center produces a continuing stream of publications that report on the findings of their work, such as Uneven Urban Landscapes: Built Investments in Indiana’s Metropolitan Regions, 1990-2001; Public Choices and Property Values: Evidence from Greenways in Indianapolis; and Indiana Household Survey 2003: An Overview. The Community Research Institute (IPFW) focuses on policy issues relating to its own region and has published its analyses in reports such as Government 101 — the Structure of Local Government in Allen County and the 2004 Diversity Study — Background Report. Focusing on the lack of regional information and analysis, both Purdue and Indiana Universities are developing new initiatives to assist the state’s regions and local areas. Purdue is developing a new regional studies center that will assemble and analyze information with its primary focus on supporting both the
15
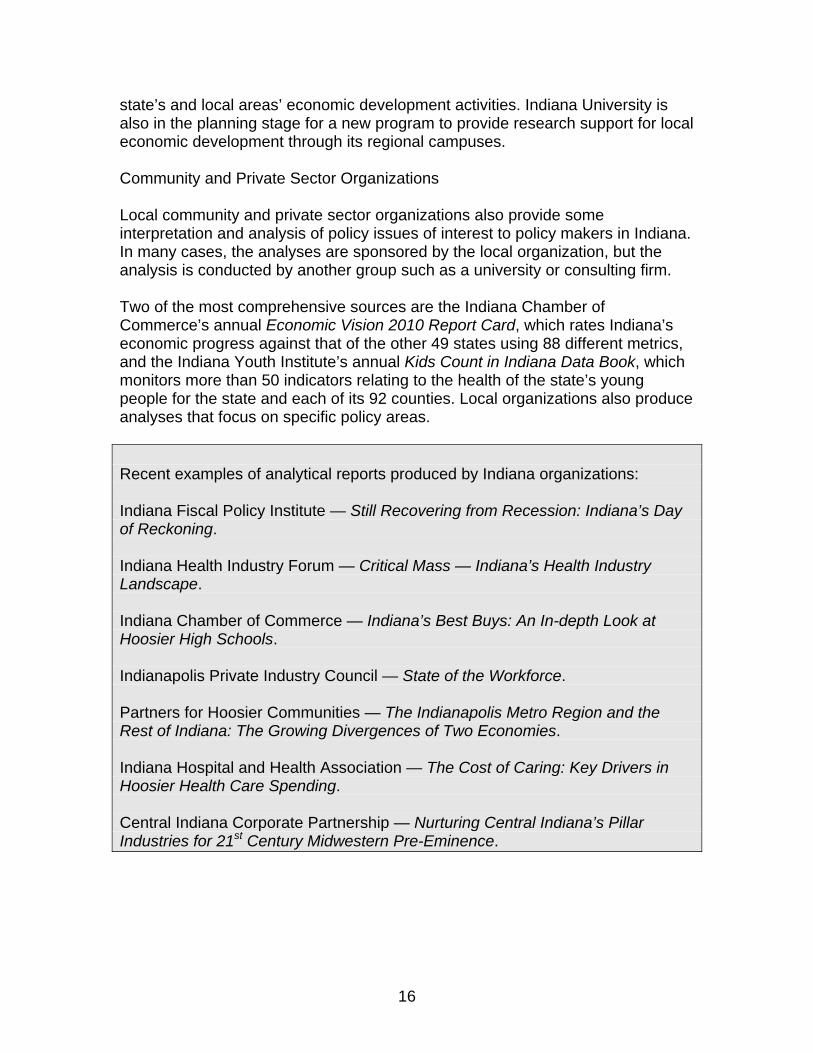
state’s and local areas’ economic development activities. Indiana University is also in the planning stage for a new program to provide research support for local economic development through its regional campuses. Community and Private Sector Organizations Local community and private sector organizations also provide some interpretation and analysis of policy issues of interest to policy makers in Indiana. In many cases, the analyses are sponsored by the local organization, but the analysis is conducted by another group such as a university or consulting firm. Two of the most comprehensive sources are the Indiana Chamber of Commerce’s annual Economic Vision 2010 Report Card, which rates Indiana’s economic progress against that of the other 49 states using 88 different metrics, and the Indiana Youth Institute’s annual Kids Count in Indiana Data Book, which monitors more than 50 indicators relating to the health of the state’s young people for the state and each of its 92 counties. Local organizations also produce analyses that focus on specific policy areas. Recent examples of analytical reports produced by Indiana organizations: Indiana Fiscal Policy Institute — Still Recovering from Recession: Indiana’s Day of Reckoning. Indiana Health Industry Forum — Critical Mass — Indiana’s Health Industry Landscape. Indiana Chamber of Commerce — Indiana’s Best Buys: An In-depth Look at Hoosier High Schools. Indianapolis Private Industry Council — State of the Workforce. Partners for Hoosier Communities — The Indianapolis Metro Region and the Rest of Indiana: The Growing Divergences of Two Economies. Indiana Hospital and Health Association — The Cost of Caring: Key Drivers in Hoosier Health Care Spending. Central Indiana Corporate Partnership — Nurturing Central Indiana’s Pillar Industries for 21st Century Midwestern Pre-Eminence.
16

National Sources Numerous non-local sources provide interpretation and fact-based analyses of data relating to Indiana, often as part of a national study. Federal agencies usually provide interpretations and analyses of the data that they produce. Examples of federal data interpretation and analytical publications: Census Bureau — Income, Poverty, and Health Insurance Coverage in the United States: 2003. Bureau of Economic Analysis — BEA Regional Facts for Indiana. Environmental Protection Agency — Clear Skies in Indiana [results of modeling the effects of the 2003 Clear Skies Act]. Department of Agriculture — Agriculture Income and Financial Outlook. Many national non-governmental organizations also produce fact-based analyses of data relating to Indiana. In many cases the analyses involve area-to-area comparisons with other states or metro areas. Examples of analytical publications from national organizations: Milken Institute — State Technology and Science Index: Enduring Lessons for the Intangible Economy. Morgan Quitno Press — Education State Rankings. Population Reference Bureau — Latinos and the Changing Face of America. Tax Foundation — State Business Tax Climate Index. While there are many places in which interpretations of some kinds of data for Indiana can be found, policy makers looking for timely non-partisan interpretation of a particular type of data will be lucky if their search is successful. This is particularly true if they are seeking regional or local area data. The same story holds true for policy analysis. In most cases, policy makers in Indiana have to rely upon special studies prepared by universities or private consultants and often commissioned by private organizations or foundations. This approach has produced valuable public policy research, such as the Human
17

Capital Retention Project in the late 1990s, a collaboration among the Indiana Higher Education Commission, the Indiana Chamber of Commerce, and the Indiana Fiscal Policy Institute funded by the Lilly Endowment. But it also has resulted in the current environment in which few up-to-date, in-depth, non-partisan analyses exist for many of the public policy issues of interest to policy makers in Indiana.
18

4. BEST PRACTICES One of the most efficient ways to develop effective strategies for improving the current situation is to look at the approaches used by others. This chapter summarizes the findings of an investigation of best practices in other states. Not surprisingly, the search did not find one state that is doing the best job in all aspects of providing data and policy analysis. Instead it found examples of states that are doing excellent jobs in one or more parts of the overall process. Thus, the following discussion takes a piece-by-piece approach to defining excellence. Three different approaches were used to identify best practices:
(1) An evaluation of each of the 50 state websites with respect to availability, accessibility, comprehensiveness, and ease of use of the types of data needed by policy makers.
(2) A search for states receiving awards or top rankings in evaluations by professional organizations, such as the Center for Digital Government.
(3) Interviews of knowledgeable informants, including staff of the National Conference of State Legislatures and the Center for Excellence of the National Governors Association.
Two Examples of Current Excellence A search for best practices should not only look outward but should also identify the parts of the current system that are working well. Building on success or adapting innovative approaches already in use to improve other segments is another effective strategy. The state’s official web portal, accessIndiana, was ranked second by the Center for Digital Government in its 2004 Best of the Web awards. This recognition is well deserved, as accessIndiana has been effectively designed to provide easy access to government services and information for individuals and businesses. Adding the same kind of convenient access for those looking for data and policy analysis is an obvious way to improve the current situation. Similarly, STATS Indiana, the web-based information center provided by Indiana University’s Indiana Business Research Center, was chosen in 2004 as the best website by the Association for University Business and Economic Research, the national organization of university business research centers. STATS Indiana provides a single, easy-to-use source for many different data series. Expansion of the existing data center to include both additional types of data and more detailed data could be a cost-effective approach to improving access. These two cases are not the only areas of excellence in the state. They have been highlighted because of recognition received during the past year. They are
19

offered as examples of how the data environment could be enhanced by building on parts of the current system that are working well. Seven Dimensions of Best Practices The following discussion highlights the best practices of other states in terms of seven specific dimensions: (1) Accessibility The key is web access. The ability to have data available almost instantaneously in electronic form over the Internet is vastly superior to any other medium. A single web-based source providing access to the entire menu of data in one place is the best solution for making it easy to access information. The search did not reveal any state that had developed a total “one-stop data shop,” but several do have convenient, centralized sources directly attached to their state portal that include a broad range of data. There are two alternative approaches to a single source model: a single comprehensive state database (North Carolina’s LINC [Log Into North Carolina] is an example of this approach) or a single centralized hub with links to multiple sources (e.g. Minnesota’s MinnStats). (2) Comprehensiveness Providing all of the information that policy makers need has two aspects: (a) providing data that covers the broad range of different policy topics, and (b) providing the detailed information that analysts often need to conduct an in-depth study of an issue. While not totally inclusive, North Carolina’s LINC is a good example of a large integrated database. It contains more than 1,300 data items from state and federal agencies, with historical data and projections (covering the 1960s to 2030), and includes state, county, municipality, township, and census track level data. Another approach to providing convenient access to a comprehensive range of state data is California’s: its entire state statistical abstract is available on-line in the form of downloadable tables (in Microsoft Excel format). The search for best practices also discovered many types of data or databases in other states that are not currently available for Indiana. In the education area, for example, the Florida Department of Education has developed the Florida K-20 Education Data Warehouse (EDW). This integrated database is a single repository of data concerning students, educational facilities, curriculum, and instructional staff in the state’s K-20 public education system. Another notable example is Ohio’s Higher Education Information System. HEI is
20

a comprehensive data warehouse containing information on enrollments, students, financial aid, faculty, facilities, finances, academic programs and capital planning for all public and private, 2- and 4-year colleges and universities within the state. In the area of health, several states have developed data warehouses. For example, Utah has developed its Indicator-Based Information System (IBIS-PH), a health database that combines hospital discharge records, emergency department encounters, population estimates, vital records, and data from Health Department Surveys and the Utah Cancer Registry. Another example of data of great value to policy makers in Massachusetts is a database with detailed information about the health insurance status of the state’s residents. Several states have databases with detailed local public finance data. For example, Minnesota has an interactive financial database providing access to detailed data on county and city revenues, expenditures, and debt. Other examples in the area of government finance include annual reports produced by Ohio’s legislative service agency on state spending by county and estimates of the local impacts of bills passed. Examples in the area of workforce training and adult education include the Florida Department of Education’s extensive data collection efforts relating to workforce and technical education, including data from the K-20 Education Data Warehouse described above. The Pennsylvania Department of Education also collects and reports detailed statistics relating to career and technical education. In the areas of government performance measures and performance-based budgeting, Florida’s Office of Program Policy Analysis and Government Accountability oversees the process of developing performance measures to evaluate their use and to conduct program reviews. The agency has done a very good job, and as a result the state now has one of the most comprehensive sets of measures to be found anywhere in the country. (3) Usability
The most usable form for data depends on its intended use. For example, if an analyst or a policy maker wants to look at data to make visual comparisons of a set of figures for one industry versus another, then the most usable form is probably a simple table or graph. But for computer analysis, data in the form of a computer database that is accessible over the Internet — either an interactive database that allows the user to choose exactly the data he or she wants or a database that can be downloaded are much more usable than data in tabular or report form. Several good examples of web-based databases have already been mentioned: the North Carolina LINC database and Minnesota’s local government finance
21

database among them. Others include the New Jersey Health Assessment Database and the Vermont School Report — an example of a website that provides access to downloadable files. (4) Management States where the data and policy analysis functions are the responsibilities of a policy analysis/planning unit in the executive branch appear to be doing the best job of providing the data, interpretation, and analysis needed by policy makers. The state of Washington’s Office of Financial Management (OFM) is a good example from a state that is about the same size as Indiana in terms of population. OFM’s data and policy analysis activities are primarily the responsibilities of its Budget division (staff of 35) and its forecasting division (staff of 22), with support from a separate information technology staff. The Office produces population, economic, and fiscal estimates and projections; monitors changes in the state’s economy and labor force; and conducts research on a wide variety of issues affecting the state budget and public policy. It produces a large number of reports and other publications. The OFM website provides convenient, centralized access to all of its data and analyses as well as direct access to a wide range of data and analyses produced by other state agencies. The Division of Demographic and Economic Analysis (DEA) within the Utah Governor’s Office of Planning and Budget is another good example in a state smaller than Indiana in terms of number of residents (2.3 million). DEA has a professional staff of seven, one support staff, and computer assistance from a separate information technology unit. The Division is responsible for managing, analyzing, and disseminating economic, demographic, and fiscal data for the state. In addition to its role of managing the Office’s web-based databases, DEA prepares the annual Economic Report of the Governor, produces the state’s demographic and economic projections, conducts other types of public policy analyses, and coordinates the state’s State Data Center and Business and Industry Center Programs. (5) Availability of Interpretation and Analysis A lack of timely, objective interpretation and analysis of state and local data is a problem almost everywhere. The situation is probably best in states such as Washington and Utah that have active policy analysis units in the executive branch. Other states have legislative service agencies that produce significant amounts of ongoing interpretation and analysis and make it readily available to policy makers. In general, these legislative units provide neither the quality nor range of information that is available from the best of the executive branch data/policy analysis units.
22

Wisconsin is a Midwestern state about the same size in terms of population as Indiana but with a full-time legislature. Its legislative service units are recognized as among the best in the nation. Wisconsin has a total of seven legislative service agencies, of which three do data/policy analysis. These three units together have 58 professional staff and 34 support staff, and also receive support from a central information technology unit. Focusing on states of approximately the same size and with part-time legislatures, Colorado was identified as having a legislative service agency active in the area of data interpretation and policy analysis. The Colorado Legislative Council has a total staff of 55, including 15 policy analysts, nine fiscal analysts, and five economists. In addition to the typical duties of a legislative service agency — staffing committees, preparing fiscal notes, answering inquiries from the legislators, other public officials, and the public, etc. — the Legislative Council produces quarterly economic and revenue forecasts, a monthly economic newsletter, and five regular reports. During the past year, it also prepared 10 research reports.
(6) Production of Non-partisan, Fact-based Policy Research
One of the critical needs identified by policy makers in Indiana is in-depth research on long-term public policy issues. Around the nation, there are several different models of public policy research organizations that provide in-depth research on policy issues important to their states. Legislative Research Units In some cases, the state legislative research units engage in in-depth research on public policy issues in addition to short-term analyses. For example, the California Legislative Analyst’s Office regularly produces reports looking at public policy issues such as the future of the state’s retirement systems.
State-Funded Public Policy Centers Both Washington and Kentucky have public policy centers established by the state legislature and funded almost exclusively by state appropriations. Looking at the Washington organization as a good example of this approach, the Washington State Institute for Public Policy was created by the Washington Legislature in 1983. It is governed by a Board of Directors that represents the legislature, the governor, and the universities. The Institute conducts non-partisan research on important state issues at the request of the legislature. The research is conducted by the Institute’s own policy analysts, supplemented by specialists from universities and consultants. All of its funding comes from legislative appropriations. The Institute’s base budget is approximately $300,000 per year, with additional supplemental funding on a project-by-project basis. Its
23

overall annual budget has ranged from $400,000 to $700,000 in recent years. The Institute has a professional staff of eleven. Fiscal and administrative services for the Institute are provided by Evergreen State College. University-Based Public Policy Centers A large number of universities across the nation have public policy research centers, which vary tremendously in size, organizational structure, and many other aspects. Affiliation with a university, particularly a prestigious research institution, can have several advantages, including links to faculty experts from across the university, easy access to graduate and undergraduate research assistants, and the ability to pay more competitive salaries than state government to attract and retain talented staff. University centers also are usually regarded as more buffered from political pressures than a government agency. (However, public university administrations may be sensitive to their relations with the state government that funds them.) Potential conflicts of interest also could occur with respect to issues related to higher education. An Indiana example of such a center doing high-quality public policy research resides at IUPUI, the Center for Urban Policy and the Environment (CUPE). With a professional staff of 15 and a total annual budget of approximately $3.5 million, CUPE has an impressive track record of research in many areas of public policy, focusing on the state of Indiana and the central Indiana area.
Independent Public Policy Centers
Another model is the independent state public policy center. There are many different types of state-level policy centers. Some focus on specific policy areas; others examine issues from a particular ideological framework — most often a free-market or limited-government orientation. Focusing on independent non-ideological centers doing research on a broad range of state policy issues, a good example is the North Carolina Center for Public Policy Research.
The North Carolina Center was established in 1977. Its objectives are to evaluate state programs and policies; to educate the public on how state government works; to conduct research on public policy issues of statewide importance; and to raise issues for public debate. The Center conducts three to four studies per year selected by a Board of Directors of 25 self-electing members. All of its projects are done by Center staff. The Center has an annual budget of $660,000. About 20 percent comes as general operating support from one foundation, another 25 percent from foundation grants for specific projects, and most of the remainder from individual and corporate contributions.
The Center publishes a citizen's guide to the legislature and biennial rankings of legislators' effectiveness. It also publishes North Carolina Insight magazine, with articles based on its research, such as a pro and con debate on school vouchers
24

and school choice. The Center also issues research reports, such as a recent study of how the 16 public universities evaluate and reward teaching performance. Future studies are planned on year-round schools, state economic development policy, and trends in funding for the arts in North Carolina.
(7) Comprehensive Indicator Systems
A growing number of states and individual communities have developed comprehensive indicator systems that include key economic, environmental, social, and cultural indicators. A comprehensive indicator system can help identify major challenges and opportunities, inform public discussion and decision making, and assess whether programs are succeeding. Jurisdictions have established the systems to help people and organizations assess whether their state or community is making progress or how it compares to others. The indicator systems are usually updated on a regular basis, and the results are typically disseminated to the public in the form of a report or on a web site.
The Indiana Chamber of Commerce’s Economic Vision 2010 Report Card is what is known as a topical indicator system. A topical indicator system focuses on a specific issue or related sets of issues. The Report Card focuses on economic development, although it includes a relatively broad range of information. While not billed as a comprehensive indicator system, the States in Profile feature of the STATS Indiana website provides comparative information for 3,118 variables for all 50 states, including rankings for each indicator and comparisons with the U.S. USA Counties in Profile, also part of STATS Indiana, provides similar capabilities for 1,764 variables for all 3,141 U.S. counties. Neither Profile system provides any interpretation of the data.
Two of the best known state-level comprehensive indicator systems are the Minnesota Milestones and the Oregon Benchmarks. Development of the Minnesota Milestones began in 1971 when the State Planning Department conducted a statewide survey to determine what residents wanted the state to be like in 30 years. The results were used to develop a shared vision of the state’s residents in terms of a set of 19 goals. For each goal, a package of indicators was selected to measure the state’s progress toward the goal. The most recent version (2002) tracks a total of 70 individual indicators to monitor the state’s progress toward the 19 goals. The Oregon Progress Board, an independent state agency, was created by the Oregon Legislature in 1989 as part of the state’s strategic planning process. The Progress Board is responsible for monitoring the state’s 20-year strategic vision. The Board tracks progress through 90 indicators known as the Oregon Benchmarks. The Benchmarks are a broad array of social, economic, and environmental health indicators. Every other year since 1991, the Board has issued an Oregon Benchmarks report examining the state’s progress in achieving the Benchmarks.
25

5. RECOMMENDATIONS The current data environment does not adequately meet the needs of Indiana policy makers. The shortcomings of the current situation can be stated succinctly:
(1) Many types of data are difficult to obtain or are unavailable. (2) Timely, objective interpretation is not available for many types of data. (3) Objective data-based analyses are not available for many public policy
issues. This chapter presents recommended actions to improve the state’s ability to collect, access, and analyze relevant data to inform policy and management efforts in Indiana. (1) Establish a State Data Initiative In order to move from the current antiquated system to an environment in which the information necessary for policy makers and managers to make informed decisions is being produced and is easily accessible, the Governor and the Legislature should work together and with others to establish a State Data Initiative that would: (a) develop an overall vision for data collection, analysis, and dissemination in the state of Indiana; (b) develop a plan for implementing the Initiative; (c) confirm and prioritize the data needs of the state; (d) improve the quality, quantity, and usability of data being produced by and for state government and other stakeholders; (e) provide for the interpretation and analysis of that data; and (f) facilitate the dissemination of the data and analysis. The Governor and Legislature should seek the involvement of the state’s universities, business and non-profit sectors, and the public to help shape and implement the Initiative. Such an initiative would be composed of three primary phases: (1) the planning phase; (2) the implementation phase (parts of which could begin while other aspects are still in development) that will require relatively modest investments by the public sector with perhaps some private sector contributions as well; and (3) a continuing phase that would require regular budgets for the data/research units of state agencies and other data producers to support expanded and improved data collection, analysis, and dissemination activities. (2) Designate or establish an organization to implement and manage the
State Data Initiative This organization would have the overall responsibility for implementing and managing the Initiative. Its levels of activity would be greater during the planning and implementation phases, but there would be a continuing oversight and coordination role for the organization. An appropriate model for this organization
26

might be one similar to the existing Information Technology Oversight Commission. Since the Initiative will affect and benefit policy makers, analysts, and managers throughout the state in both the public and private sectors, a policy of including appropriate individuals from outside state government as part of the organization to manage the Initiative should be seriously considered. [For the remainder of the discussion, this organization will be referred to as “the SDI Commission” to simplify the discussion.] (3) Increase awareness of and access to existing data
(a) Establish as state policy that, to the extent practical, all Indiana public data
should be accessible through the Internet. While this would be impossible to implement totally, it is important that the state establish a strong commitment to maximize the web-accessibility of public information. This policy should also be encouraged among local government and non-government data producers.
(b) Designate or develop a clearinghouse/resource center for Indiana data and
data analyses. As part of its responsibilities, this unit would actively search out all sources of data and analyses and publicize their existence. To improve awareness, the clearinghouse should incorporate this information into a comprehensive directory or guide to Indiana data that would include not only directory information but also discussion of the characteristics/limitations of the data, how to use the information, etc. Awareness could further be enhanced if the clearinghouse were also given the responsibility for providing training activities for policy makers and other data users incorporating the kinds of information included in the data guide. To improve access, this clearinghouse should establish and maintain a single portal to provide access to all Indiana data on the Web. A link to this portal should be prominently displayed on accessIndiana and other appropriate websites. This single portal would not have to be associated with the development of a single centralized database. It could be constructed with direct links to data and databases on other sites.
While this clearinghouse would be under the overall direction of the Commission as part of the Initiative, it would not necessarily have to be located within state government. Probably the most cost-effective approach to implement this recommendation would be to expand STATS Indiana to become the information clearinghouse/state data portal. The Indiana Business Research Center, which developed and operates STATS Indiana, serves as the state’s official liaison with the U.S. Census Bureau, is a partner in the federal State Data Center Program, and has been funded for several years by the state’s Department of Commerce to manage and provide data and analysis for and on behalf of the state. Other possible organizational models would be to locate the clearinghouse operation within the executive branch — possibly associated with information
27

technology or as part of a policy analysis unit. While the best practices investigation found that this model produces good results in some states, a downside is the potential for disruption and lack of continuity with changes in political administrations. Other possible alternatives would be the establishment of the clearinghouse as a quasi-public organization or as a private non-profit organization with a contract from the state to provide clearinghouse services (perhaps supplemented by private sector funds). (4) Improve the usability of existing data
(a) Encourage data producers to provide data in as much detail as possible
rather than supplying only summary data. The most user-friendly approach would be to provide both summary and detailed data.
(b) Encourage data producers to move from printed reports or data tables or PDF versions of reports/data tables on their websites to providing data in the form of downloadable datasets or databases.
(c) Encourage data producers to develop more research-oriented data. For
example, this would include consolidation of data from multiple time periods and/or multiple geographic areas into a single consolidated database to facilitate analysis.
A number of activities are underway to develop such research-oriented databases, for example, the SAVI database under development for the Indianapolis metropolitan area and enhancements to STATS Indiana to provide additional analytical capabilities. Although it would be a complex and expensive undertaking, the development of a large statewide integrated database would provide a powerful tool for analyzing public policy issues in Indiana and should be one of the projects given serious consideration as part of the State Data Initiative.
(5) Develop new data to answer the needs of policy makers
The State Data Initiative should include careful consideration of ways to satisfy the needs of policy makers for types of data that are not currently available in Indiana. In some cases, the gaps identified by policy makers are due to confidentiality issues. Other kinds of data that policy makers said that they want for Indiana also do not exist in other states due to a lack of appropriate methodology or the prohibitive cost of collecting the data. But some kinds of data not available in Indiana are available in other states, and methodologies used elsewhere could be adapted for Indiana.
28

Two specific examples include: The State Auditor in Minnesota currently provides public access to a statewide database containing revenue, expenditure, and debt data for every county and municipality in the state. No similar database currently exists for Indiana, but it would be possible for the Department of Local Government Finance to develop a similar database given additional funding and changes in reporting requirements for local governments. States’ workforce development agencies have access to a commercially produced dataset through a cooperative agreement with the U.S. Bureau of Labor Statistics. Several states use this database to provide directory-type information about individual firms in their state on their websites. Indiana has not implemented this feature on the Department of Workforce Development’s website. Implementation of new data programs will require additional resources and may also necessitate legislative or administrative changes. One of the most important responsibilities of the SDI Commission would be to establish a process to identify data needs, evaluate the feasibility of producing the new data, and determine priorities for any new data programs. (6) Encourage the standardization of the regional definitions used by different agencies so that the regional information that they produce would be comparable
Another appropriate task for the SDI Commission would be to establish a statewide task force to tackle the problems of multiple regional definitions and incomparable regional data. This was cited as a major issue by policy makers — particularly for those from outside the Indianapolis area and those interested in regional issues. Unfortunately, it may be a very difficult process to develop a standard set of regional definitions due to the many different interests that must be taken into account. (7) Increase the production of data and other information for regions and local areas
The lack of many kinds of data and other information for regions and local areas was one of the problems mentioned most often by Indiana policy makers. Those with a statewide focus cited the need for statewide datasets and analyses of the regional and/or local effects of state policies. Others from around Indiana called both for more and better information relating to their own community or region — not just data but also studies of specific local issues.
29
Indiana University’s and Purdue’s new regional initiatives described previously will be positive steps toward answering the need for more regional information. Policy makers should consider ways to further expand public service activities of the state’s colleges and universities that provide data and analysis to local areas. As part of the State Data Initiative, state agencies should develop user-friendly databases that present their data on a regional and local area basis.
(8) Establish a system to produce objective interpretations and analyses of data
Making objective interpretation and analysis of Indiana data more available should also be an integral part of the State Data Initiative. To inform their decisions, policy makers often need interpretation or analysis of data rather than the data themselves, because they do not have the time and/or expertise to do their own data analysis. There are several possible approaches to address these needs, including (a) establishment of a dedicated research policy analysis unit in the executive branch, (b) expanding or creating research/policy analysis units in the individual state agencies, (c) expansion of the Legislative Service Agency or creation of a new legislative research unit, (d) providing more funding to one or more university-based or private sector research organizations to provide these services. The best practices exercise indicated that no state is really meeting an absolute standard of excellence in this area; the best examples seem to be in states with a dedicated executive branch policy analysis unit. Several policy makers suggested that the Governor’s Office needs to be the catalyst for improving the state’s data environment. Establishment of a policy analysis unit within the executive branch would provide a lead agency within state government for such efforts. The data/research units within individual state agencies need to be expanded to produce more and better data. As this occurs, they would be an obvious choice to prepare interpretations of their own agency’s statistics. Lack of objectivity would be a potential problem, particularly for analyses of data related to agency performance. This would be less of an issue for a non-partisan legislative research unit or for university-based or private sector research units. But rather than choose a single approach, it would probably be more realistic to rely on a mix of approaches, as is the case in Indiana now, but with a much stronger commitment to provide interpretation and analysis of the data relating to Indiana. The Commission would need to be involved developing the strategies and in setting the priorities to accomplish this objective.
30

(9) Establish a system to produce thorough, nonpartisan analyses of important policy issues There was widespread conviction among policy makers that more in-depth fact-based analysis of important policy issues is critically needed for the long-term health of the state. The recommended approach to filling this gap is the establishment of an ongoing state public policy research program. The program could be initiated as part of the State Data Initiative and monitored by the SDI Commission. While major funding for the program should come from the state, it might be wise to construct the program as some type of public-private partnership that would include private sector involvement and support. Such a collaborative approach would reduce potential concerns about objectivity and long-term sustainability that might exist if state officials had complete control over program funding. The program should be governed by a board of advisors with both government and outside representation. The board would select the issues to be studied and guide the operations of the program. The program would issue a request for proposals for each project, choose an analyst to conduct the analysis through a competitive process, and pay for the project with program funds. This model would draw upon the existing research experience of the state’s universities and non-governmental organizations, such as the Indiana Fiscal Policy Institute, and would not require setting up a brand new public policy research unit. (10) Consider the establishment of a comprehensive indicator system for the state of Indiana as part of a state strategic planning process
An indicator system would help to focus the attention of both policy makers and the public on key policy issues and encourage debate about appropriate goals for the state and the actions needed to achieve desired goals. Such an indicator system is really only one part of a strategic planning process and should only be developed within the context of a state strategic planning initiative.
31

REFERENCES Battelle Memorial Institute (2000), Nurturing Central Indiana’s Pillar Industries for 21st Century Midwestern Pre-Eminence, Cleveland, OH. David Broomhall (1994), Is Riverboat Gambling an Effective Economic Development Strategy for Indiana Communities? Center for Rural Development, Purdue University, West Lafayette, IN. Business Research Center, Indiana Business Bulletin, Miller School of Business, Ball State University, web-based newsletter – URL: http://www.bsu.edu/web/bbr/IBB/index.htm California Legislative Analyst’s Office, Alternative Retirement Benefit Programs, Web document – URL: http://www.lao.ca.gov/analysis_2004/general_govt/gen_02_cc_retire_anl04.htm Center for Philanthropy (2004), Indiana Gives 2004, IUPUI, Indianapolis, IN. Community Partnerships, Inc., Allen County Profile, website – URL: www.allencountyprofile.org Community Research Institute (2004), 2004 Diversity Study — Background Report, IPFW, Fort Wayne, IN. Larry DeBoer, David Good, Craig Johnson, and Joyce Man (1996), Report on the Indiana Fair Market Value Study, Center for Rural Development, Purdue University, West Lafayette, IN. Ross DeVol and Rob Koepp, with Junghoon Ki (2004), State Technology and Science Index: Enduring Lessons for the Intangible Economy, Milken Institute, Santa Monica, CA. Carmen DeNavas-Walt, Bernadette D. Proctor, and Robert J. Mills (2004), Income, Poverty, and Health Insurance Coverage in the United States: 2003, Current Population Reports, P60-226, U.S. Census Bureau, Washington, DC. Andrew Downs and John Stafford (2004), Government 101 — the Structure of Local Government in Allen County, The Community Research Institute, IPFW, Fort Wayne, IN. Florida Department of Education, K–20 Education Data Warehouse, website – URL: http://edwapp.doe.state.fl.us/doe/
32

Florida Office of Program Policy Analysis and Government Accountability, Florida Monitor, website – URL: http://www.oppaga.state.fl.us Kirsten A. Gronbjerg and Linda Allen (2004), The Indiana Non-Profit Sector, Center for Philanthropy and School of Public and Environmental Affairs, Indiana University, Bloomington, IN. Scott A. Hodge, J. Scott Moody, and Wendy P. Warcholik (2004), State Business Tax Climate Index, Tax Foundation, Washington, DC. Indiana Agricultural Statistics Service, Indiana Agriculture Report, Purdue University, web document – URL: http://www.nass.usda.gov/in/agreport/agreport.htm Indiana Agricultural Statistics Service (2004), Indiana Agricultural Statistics 2003–2004, Purdue University, web document – URL: http://www.nass.usda.gov/in/annbul/0304/2003_04.htm Indiana Business Research Center, IN Context, Kelley School of Business, Indiana University, Bloomington, IN. Indiana Business Research Center, Indiana Business Review, Kelley School of Business, Indiana University, Bloomington, IN. Indiana Business Research Center, STATS Indiana, Kelley School of Business, Indiana University, website – URL: http://www.stats.indiana.edu Indiana Chamber of Commerce (2003), Indiana’s Best Buys: An In-depth Look at Hoosier High Schools, Indianapolis, IN. Indiana Chamber of Commerce (2004), 2004/2005 Economic Vision Report Card, Indianapolis, IN. Indiana Department of Education (2003), Digest of Public School Finance in Indiana: 2003-2005 Biennium, Indianapolis, IN. Indiana Family and Social Services Administration (2004), Indiana Child Health Insurance Program Annual Evaluation Report, Indianapolis, IN. Indiana Fiscal Policy Institute (1998), Human Capital Retention Project Report 1: The Evolution of Indiana’s Labor Force: 1968-1997: A Comparative Analysis, Indianapolis, IN. Indiana Fiscal Policy Institute (1999), Human Capital Retention Project Report 2: Graduate Migration from Indiana’s Postsecondary Institutions, Indianapolis, IN.
33

Indiana Fiscal Policy Institute (2000), Human Capital Retention Project Report 3: The Indiana Workforce: An Employer's Perspective, Indianapolis, IN. Indiana Fiscal Policy Institute (2000), Human Capital Retention Project Report 4: Survey of Current Practices in Postsecondary Graduate Retention, Indianapolis, IN. Indiana Fiscal Policy Institute (2004), Still Recovering from Recession: Indiana’s Day of Reckoning, Fiscal Policy Report No. 22, November 2004, Indianapolis, IN. Indiana Health Industry Forum (2002), Critical Mass — Indiana’s Health Industry Landscape, Indianapolis, IN. Indiana Legislative Service Agency (2003), Indiana Handbook of Taxes, Revenues, and Appropriations Fiscal Year 2004, Indianapolis, IN. Indianapolis Private Industry Council (2004), State of the Workforce: IPIC and the Capital Region, Indianapolis, IN. Indiana Youth Institute (2004), Kids Count in Indiana Data Book, Indianapolis, IN. Craig Lindsey, Seth Payton, Joyce Man, and John Ottensmann (2003), Public Choices and Property Values: Evidence from Greenways in Indianapolis, Center for Urban Policy and the Environment, IUPUI, Indianapolis, IN. Massachusetts Division of Health Care Finance and Policy (2004), Health Insurance Status of Massachusetts Residents, web document – URL: http://www.mass.gov/portal/index.jsp?pageID=eohhs2terminal&L=4&L0=Home&L1=Researcher&L2=MassHealth+and+Insurance&L3=Health+Insurance+Surveys&sid=Eeohhs2&b=terminalcontent&f=dhcfp_researcher_resident_survey&csid=Eeohhs2
Minnesota Department of Administration/State and Community Services (2002), Minnesota Milestones 2002, website – URL: http://www.mnplan.state.mn/mm/2002.html
Minnesota Economic Resource Group, MinnStats, website – URL: http://www.minnstats.state.mn.us/index.html Minnesota Office of State Auditor, Queriable Database, website – URL: http://www.auditor.state.mn.us/default.aspx?page=dbsearch Morgan Quitno Press (2004), Education State Ranking 2004–2005, Lawrence, KS.
34

New Jersey Center for Health Statistics, New Jersey Health Assessment Database, website – URL: http://njshad.doh.state.nj.us/welcome.html
North Carolina Center for Public Policy Research, North Carolina Insight magazine – URL: http://www.nccppr.org
North Carolina Office of State Budget and Management, Log Into North Carolina (LINC) database, website – URL:http://linc.state.nc.us/ Samuel Nunn (2003), Uneven Urban Landscapes: Built Investments in Indiana’s Metropolitan Regions, 1990–2001, Center for Urban Policy and the Environment, IUPUI, Indianapolis, IN. Ohio Board of Regents, Higher Education Information System, website – URL: http://www.regents.state.oh.us/hei/ Ohio Legislative Service Commission (2004), 2003 Local Impact Statement Report, web document – URL: http://www.lbo.state.oh.us/fiscal/publications/annual/lis/2003/default.cfm Ohio Legislative Service Commission (2004), State Subsidies and Capital Spending by County FY2002 – FY2003, web document – URL: http://www.lbo.state.oh.us/fiscal/publications/annual/statespending/2003/SpendingByCounty2003.pdf
The Oregon Progress Board, Oregon Benchmarks, website – URL: http://egov.oregon.gov/DAS/OPB/obm.shtml
Pennsylvania Department of Education, Career and Technical Education Statistics, website – URL: http://www.pde.state.pa.us/k12statistics/cwp/view.asp?a=3&Q=74973. Polis Center, Social Assets and Vulnerabilities Indicators for Central Indiana (SAVI), IUPUI, website – URL: http://149.166.110.232/polis/savi/default1.asp Douglas R. Powell, Fiona Innes, and Amanda Wilcox-Herzog (1999), An Evaluation of the Indiana Child Care Financing Initiative, Center for Families, Purdue University, West Lafayette, IN. PriceWaterhouseCoopers (2004), The Cost of Caring: Key Drivers in Hoosier Health Care Spending, Indiana Hospital and Health Association, February 2004, web document – URL: http://www.inhha.org/images/PwC%20Cost%20of%20Caring%20Final%20Report.pdf
35

Rogelio Saenz (2004), Latinos and the Changing Face of America, Population Reference Bureau, Washington, DC. Rachel Thelin (2004), Indiana Household Survey 2003: An Overview, Center for Urban Policy and the Environment, IUPUI, Indianapolis, IN. Michelle M. Tomarelli, Shelley M. MacDermid, and Rebecca S. Lynne (2003), The Effect of Changes in Tax Policy on Indiana Families, The Center for Families, Purdue University, West Lafayette, IN. U. S. Bureau of Economic Analysis, BEA Regional Facts for Indiana, web document – URL: http://www.bea.doc.gov/bea/regional/bearfacts/stateaction.cfm?fips=18000&yearin=2003 U. S. Department of Agriculture, Economic Research Service (2004), Agricultural Income and Financial Outlook, web document – URL: http://www.ers.usda.gov/publications/so/view.asp?f=economics/ais-bb U. S. Environmental Protection Agency (2003), Clear Skies in Indiana, web document – URL: http://www.epa.gov/air/clearskies/state/in.html Utah Department of Health, IBIS-PH: Utah’s Public Health Data Resource, website – URL: http://ibis.health.utah.gov/view?xml=home/home.xml&xslt=home.xslt Utah Governor’s Office of Planning and Budget (2004), Economic Report of the Governor, Salt Lake City, UT. Vermont Department of Education, Vermont School Report, website – URL: http://crs.uvm.edu/schlrpt/ Charles Warren (2003), The Indianapolis Metro Region and the Rest of Indiana: The Growing Divergences of Two Economies, Partners for Hoosier Communities, Indianapolis, IN, March 2003, web document – URL: http://ladders4success.org/research/divergence.pdf
36

LIST OF KEY INFORMANTS INTERVIEWED FOR THE STUDY Tom Ahlers Director, Research and Development Indianapolis Private Industry Council Pat Barkey Director, Economic and Policy Studies Ball State University Laurie Beamish Director, Information Technology Department of Environmental
Management
Amy Bilyeu Chief of Staff Lt. Governor's Office Jim Birge Deputy Chief of Staff Office of the Governor David J. Bodenhamer Director The Polis Center Brian Bosworth President FutureWorks, Belmont, MA David Bottorfs Executive Director Association of Indiana Counties Kevin Brinegar President Indiana Chamber of Commerce Roberta Brooker Associate Director, Public Services Indiana State Library Mark Brown Research Director Indiana Fiscal Policy Institute Sara Cobb Vice President, Education Lilly Endowment Inc. Cindy Collier Director of Policy and Planning Family and Social Services
Administration
Thomas D. Conley Administrator Indiana Department of Revenue Jerry N. Conover Director Indiana Business Research Center, IU Robert Cross Director, Research and Planning United Way of Central Indiana Carol D'Amico Chancellor IVY Tech Alan D. Degner Commissioner Indiana Workforce Development Jim Eifert President Rose-Hulman Ventures Bobby Fong President Butler University David C. Ford State Senator Indiana Senate Sarah R.Geis Information Specialist Indiana Grantmakers Alliance Hans G. Giesecke President Independent Colleges of Indiana Ronald Gifford Partner Baker & Daniels Larry Gigerich Managing Director Ginovus Matt Greller Executive Director Indiana Assoc. of Cities & Towns Craig Hartzer Executive Director Public Employees' Retirement Fund Leslie Davis Hiner Republican Chief of Staff Indiana House of Representatives Mac Holladay CEO Market Street Services, Atlanta, GA Jerry Israel President University of Indianapolis Martin Jischke President Purdue University David Johnson Partner Baker and Daniels Steven R. Johnson President and CEO Indiana Fiscal Policy Institute Stan Jones Commissioner Commission for Higher Education Joanne Joyce President Indianapolis Private Industry Council Kirk Kemmish President Northeast Indiana Corporate Council Luke Kenley State Senator Indiana Senate Melina M. Kennedy Director of Economic Development City of Indianapolis Patrick Kiely President and CEO Indiana Manufacturers Assoc. David Knapp Executive Director Evansville Regional Business Comm Roger Koelpin System Consultant Information Technology Oversight
Commission
John L. Krauss Director Center for Urban Policy Martha Lamkin President and CEO Lumina Foundation Wade Lange President and CEO Indiana Health Industry Forum Jon Laramore Chief Counsel Indiana Governor's Office Scott T. Massey President and CEO Indiana Humanities Council Tom McKenna Deputy Chief of Staff Office of the Governor Kenneth L. Miller Commissioner Department of Revenue Tim Monger Executive Director Indiana Department of Commerce
37

Cynthia Monier Director, Business Research Center Indiana Chamber of Commerce Mary Moore Vice President for Research University of Indianapolis John S. Myrland President Greater Indianapolis Chamber of
Commerce
Samuel Nunn Senior Scholar and Research Director Center for Urban Policy and the Environment, IUPUI
Jackie Nytes President Indiana Econ. Development Corp. John Ottensmann Associate Director Center for Urban Policy and the
Environment, IUPUI
Dennis Paramore Director: Research Indiana Department of Commerce Walt Plosilla Vice President Battelle Memorial Institute, Cleveland,
OH
Diane Powers Director, Office of Fiscal and Management Analysis
Legislative Services Agency
David Reynolds Deputy Director State Budget Agency Graham Richards Mayor City of Fort Wayne N. Clay Robbins President Lilly Endowment Inc. Carol O. Rogers Associate Director Indiana Business Research Center Patrick M. Rooney Director of Research Center of Philanthropy, IUPUI Susan Rozzi Senior Manager, Research Indy Partnership Philip Sachtleben Executive Director Legislative Services Agency Greg Schenkel President and CEO Indy Partnership Marilyn F. Schultz State Budget Director State Budget Agency Anne K. Shane Vice President BioCrossroads David N. Shane President and COO LDI, Ltd. William J. Sheldrake President Policy Analytics LLC Carol G. Simonetti President and CEO Indiana Grantmakers Alliance Vi Simpson State Senator Indiana Senate David Smith Vice President Technology Futures Kevin Snider Executive Assistant to the President
for Institutional Effectiveness Indiana State University
Jeff Spalding Senior Fiscal Analyst Indiana House of Representatives John Stafford Director Community Research Institute, IPFW Bill Stanczykiewicz President and CEO Indiana Youth Institute Bill Stephan Vice President, University Relations Indiana University Terry Streuh Vice President for Government
Relations Purdue University
E. G. White Director of Organizational Management
Lilly Endowment Inc.
Heather Willis Deputy Secretary of State Office of the Secretary of State
38

TIMOTHY D. HOGAN
Timothy D. Hogan is Professor Emeritus of Economics and Research Associate in the L. William Seidman Research Institute in the W. P. Carey School of Business at Arizona State University. He received A.B. and M.A. degrees in Economics from the University of California and his Ph.D. degree in Economics from Virginia Polytechnic Institute and State University. He joined the faculty at Arizona State University in 1970 and retired in July 2004. Dr. Hogan served as Director of the Seidman Institute from 1995 to 2004 and Director of the Center for Business Research from 1987 to 2004. The L. William Seidman Research Institute coordinates all research activities in the W. P. Carey School of Business, including both sponsored research and its seven research centers. The Center for Business Research is one of these affiliated centers and is the primary public service and applied research unit within the W. P. Carey School of Business specializing in research relating to the state of Arizona. Dr. Hogan was elected to Phi Beta Kappa at the University of California Berkeley and also served as President of the Arizona State University Chapter of Phi Beta Kappa. He was a Brookings Institution Fellow at the Social Security Administration in 1975-76 and a Visiting Scholar with the Graduate Group in Demography at the University of California Berkeley in 1986. Dr. Hogan’s research focuses on applied economic and demographic analysis. He has served as principal investigator/project director/co-investigator on numerous funded research projects for a wide variety of sponsors, including the National Science Foundation, the U.S. Department of Housing and Urban Development, the U.S. Forest Service, the U.S. Justice Department, the U.S. Department of Transportation, the Arizona-Sonora Commission, the Arizona Governor’s Office, the Arizona Legislature, the Arizona Department of Commerce, the Arizona Department of Economic Security, the Arizona Department of Corrections, the Arizona Department of Health, the Arizona Office of Tourism, Maricopa County, the Maricopa Association of Governments, the Greater Phoenix Economic Council, the City of Phoenix, the City of Scottsdale, Tempe Elementary School District, Intel, Boeing, Raytheon, Motorola, Allied Signal, Ft. Howard Paper, Salt River Project, Valley National Bank, United Way, Phoenix Newspapers Inc. and the Arizona Hospital Association. He has also published numerous professional articles and monographs, with recent academic research focused on regional economic development, seasonal migration, and the economics of aging. Dr. Hogan is past President of the Association for University Business and Economic Research (AUBER), the national association of university business and economic research centers. In October 2004, he was the first recipient of the Thayne Robson Award, established by AUBER to honor a member of the
39

organization for outstanding service to the organization and to his or her university and state. Dr. Hogan serves as a member of the Financial Advisory Committee of the Arizona Joint Legislative Budget Committee and is a member and past President of the Arizona Economic Roundtable. He is a member of numerous professional organizations, including the National Association for Business Economics, the American Economics Association, the Regional Science Association, the Western Economic Association, and the Population Association of America.
40