data flow diagram (risath)
TRANSCRIPT

Starting DFD
Heading
Data Flow Diagram
Lecturer Present By
Subject
SADSystem Analyst Design
Presentation
College

I AM RISATH
Currently I’m Study at HND in
Computing.

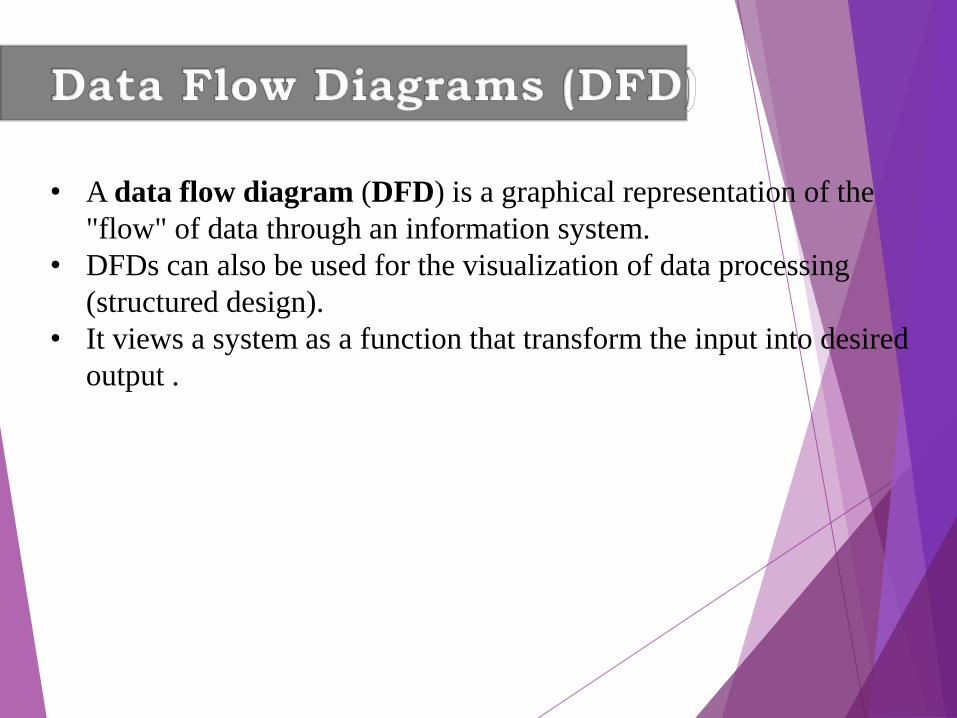
• A data flow diagram (DFD) is a graphical representation of the
"flow" of data through an information system.
• DFDs can also be used for the visualization of data processing
(structured design).
• It views a system as a function that transform the input into desired
output .
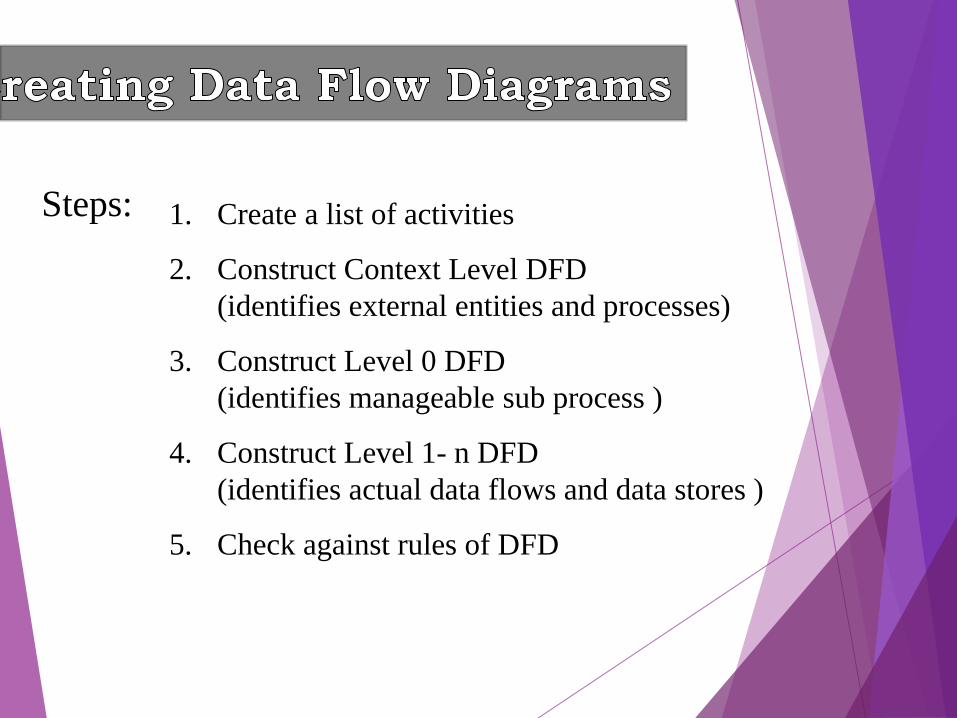
Steps: 1. Create a list of activities
2. Construct Context Level DFD
(identifies external entities and processes)
3. Construct Level 0 DFD
(identifies manageable sub process )
4. Construct Level 1- n DFD
(identifies actual data flows and data stores )
5. Check against rules of DFD

DFD Symbols
Creating Data Flow Diagrams
With Explain Example
Process
Data Store
Data Flow
External
Entities

Creating Data Flow Diagrams
Steps:
1. Create a list of activities
2. Construct Context Level DFD
(identifies sources and sink)
3. Construct Level 0 DFD
(identifies manageable sub processes )
4. Construct Level 1- n DFD
(identifies actual data flows and data stores )
Example
The operations of a
simple lemonade stand
will be used to
demonstrate the creation
of dataflow diagrams.
Creating Data Flow Diagrams
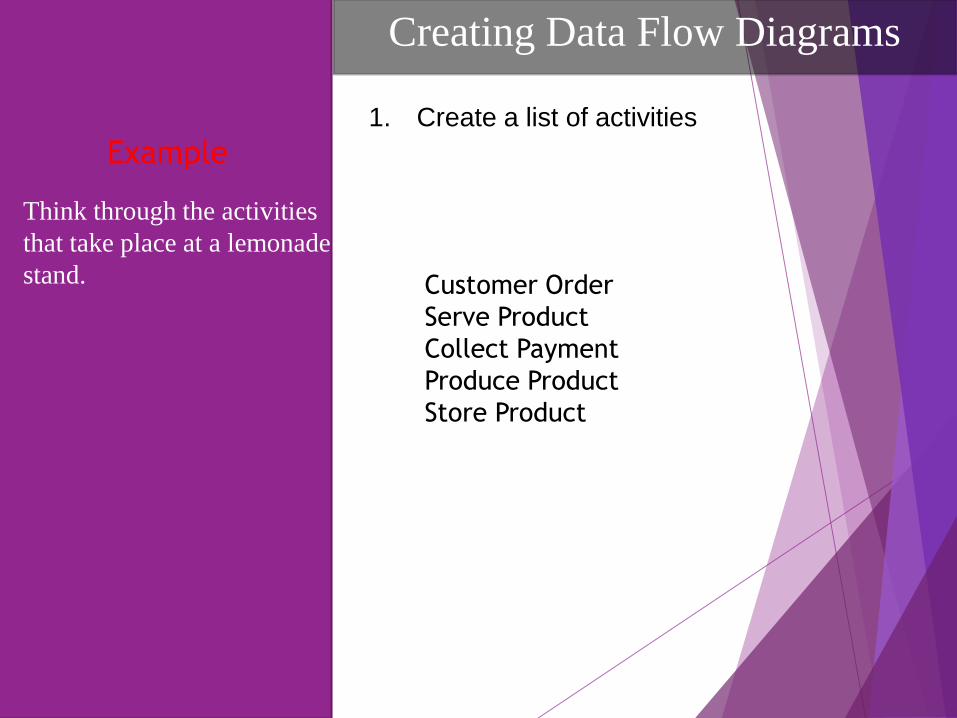
Example1. Create a list of activities
Think through the activities
that take place at a lemonade
stand. Customer Order
Serve Product
Collect Payment
Produce Product
Store Product
Creating Data Flow Diagrams
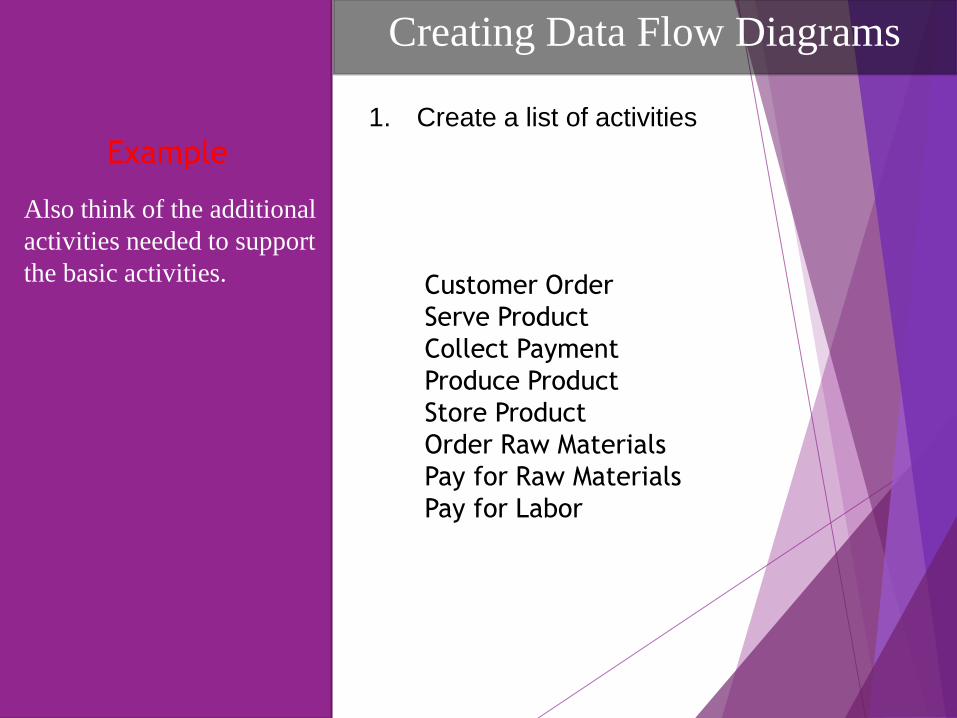
Example
Also think of the additional
activities needed to support
the basic activities. Customer Order
Serve Product
Collect Payment
Produce Product
Store Product
Order Raw Materials
Pay for Raw Materials
Pay for Labor
1. Create a list of activities
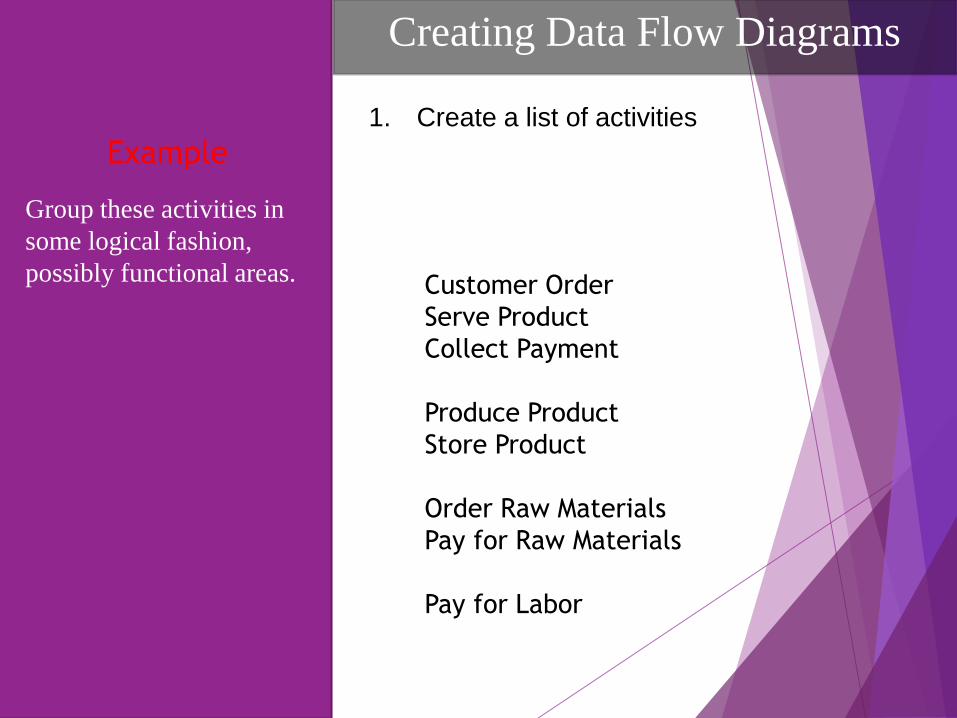
Group these activities in
some logical fashion,
possibly functional areas. Customer Order
Serve Product
Collect Payment
Produce Product
Store Product
Order Raw Materials
Pay for Raw Materials
Pay for Labor
1. Create a list of activities
Creating Data Flow Diagrams
Example

0.0
Lemonade
System
EMPLOYEECUSTOMER
Pay
Payment
Order
Context Level DFDCreate a context level
diagram identifying the
sources and sinks (users).
Customer Order
Serve Product
Collect Payment
Produce Product
Store Product
Order Raw Materials
Pay for Raw Materials
Pay for Labor
VENDOR
PaymentPurchase Order
Production Schedule
Received GoodsTime Worked
Sales Forecast
2. Construct Context Level DFD
(identifies sources and sink)
Product Served
Creating Data Flow Diagrams
Example
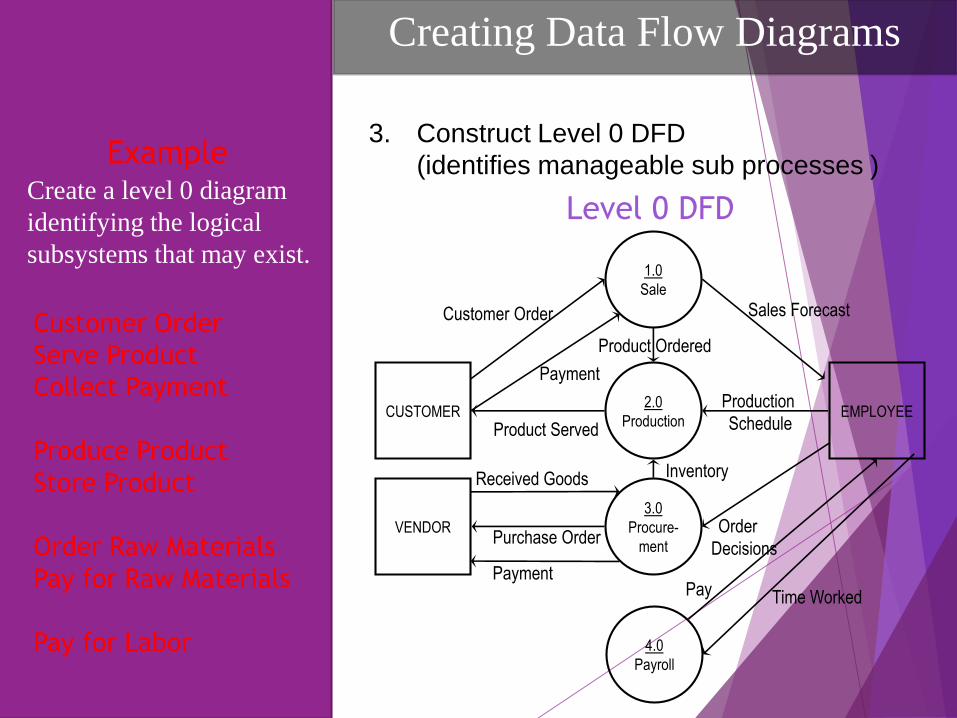
Level 0 DFDCreate a level 0 diagram
identifying the logical
subsystems that may exist.
Customer Order
Serve Product
Collect Payment
Produce Product
Store Product
Order Raw Materials
Pay for Raw Materials
Pay for Labor
3. Construct Level 0 DFD
(identifies manageable sub processes )
2.0
ProductionEMPLOYEE
Production
Schedule
1.0
Sale
3.0
Procure-
ment
Sales Forecast
Product Ordered
CUSTOMER
Pay
Payment
Customer Order
VENDOR
Payment
Purchase OrderOrder
Decisions
Received Goods
Time Worked
Inventory
Product Served
4.0
Payroll
Creating Data Flow Diagrams
Example

Level 1 DFDCreate a level 1
decomposing the processes
in level 0 and identifying
data stores.
4. Construct Level 1- n DFD
(identifies actual data flows and data stores )
1.3
Produce
Sales
ForecastSales ForecastPayment
Customer Order
Serve Product
Collect Payment
Produce Product
Store Product
Order Raw Materials
Pay for Raw Materials
Pay for Labor
1.1
Record
Order
Customer Order
ORDER
1.2
Receive
Payment
PAYMENT
Severed Order
Request for Forecast
CUSTOMER
Creating Data Flow Diagrams
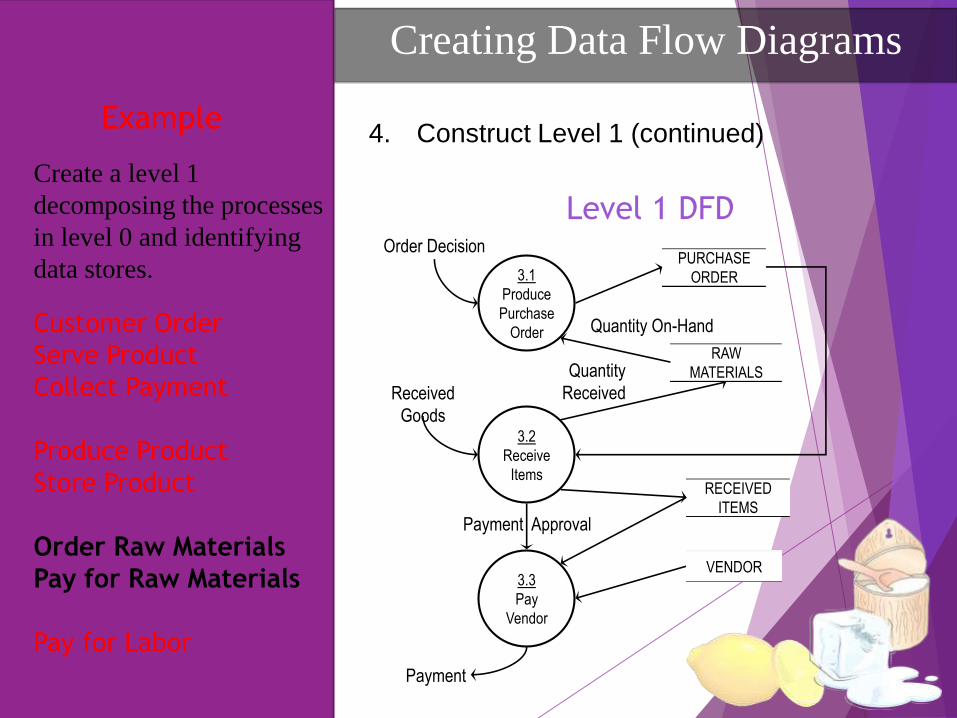
Example

Level 1 DFDCreate a level 1
decomposing the processes
in level 0 and identifying
data stores.
4. Construct Level 1 (continued)
Customer Order
Serve Product
Collect Payment
Produce Product
Store Product
Order Raw Materials
Pay for Raw Materials
Pay for Labor
2.1
Serve
Product
Product Order
ORDER
2.2
Produce
Product
INVENTORTY
Quantity Severed
Production
Schedule
RAW
MATERIALS
2.3
Store
Product
Quantity Produced &
Location Stored
Quantity Used
Production Data
Creating Data Flow Diagrams
Example
Level 1 DFDCreate a level 1
decomposing the processes
in level 0 and identifying
data stores.
4. Construct Level 1 (continued)
Customer Order
Serve Product
Collect Payment
Produce Product
Store Product
Order Raw Materials
Pay for Raw Materials
Pay for Labor
3.1
Produce
Purchase
Order
Order DecisionPURCHASE
ORDER
3.2
Receive
Items
Received
Goods
RAW
MATERIALS
3.3
Pay
Vendor
Quantity
Received
Quantity On-Hand
RECEIVED
ITEMS
VENDOR
Payment Approval
Payment
Creating Data Flow Diagrams
Example

Level 1 DFDCreate a level 1
decomposing the processes
in level 0 and identifying
data stores.
4. Construct Level 1 (continued)
Time Worked
Customer Order
Serve Product
Collect Payment
Produce Product
Store Product
Order Raw Materials
Pay for Raw Materials
Pay for Labor
4.1
Record
Time
Worked
TIME CARDS
4.2
Calculate
Payroll
Payroll Request
EMPLOYEE
4.3
Pay
Employe
e
Employee ID
PAYROLL
PAYMENTS
Payment Approval
Payment
Unpaid time cards
Creating Data Flow Diagrams
Example
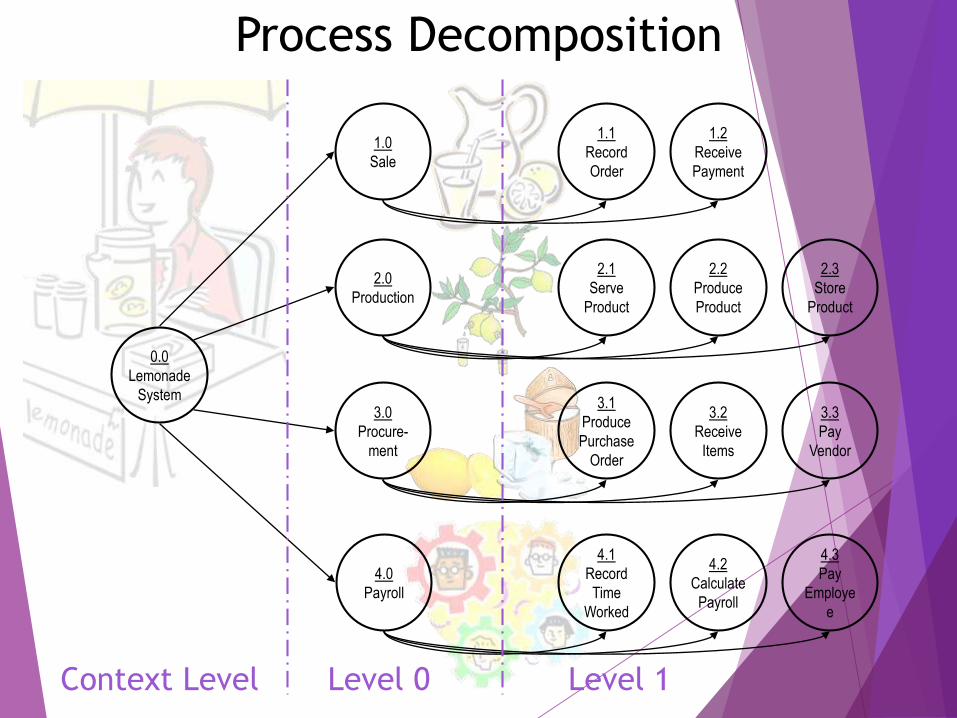
Process Decomposition
4.1
Record
Time
Worked
4.2
Calculate
Payroll
4.3
Pay
Employe
e
3.1
Produce
Purchase
Order
3.2
Receive
Items
3.3
Pay
Vendor
2.1
Serve
Product
2.2
Produce
Product
2.3
Store
Product
1.1
Record
Order
1.2
Receive
Payment
2.0
Production
1.0
Sale
3.0
Procure-
ment
4.0
Payroll
0.0
Lemonade
System
Level 0 Level 1Context Level

Tank you The Start