data-driven discovery of 3d and 2d thermoelectric materials
TRANSCRIPT

1
Data-driven Discovery of 3D and 2D Thermoelectric Materials
Kamal Choudhary, Kevin F. Garrity and Francesca Tavazza
Materials Science and Engineering Division, National Institute of Standards and Technology, Gaithersburg, Maryland 20899, USA.
ABSTRACT
In this work, we first perform a systematic search for high-efficiency three-dimensional (3D) and
two-dimensional (2D) thermoelectric materials by combining semiclassical transport techniques
with density functional theory (DFT) calculations and then train machine-learning models on the
thermoelectric data. Out of 36000 three-dimensional and 900 two-dimensional materials currently
in the publicly available JARVIS-DFT database, we identify 2932 3D and 148 2D promising
thermoelectric materials using a multi-steps screening procedure, where specific thresholds are
chosen for key quantities like bandgaps, Seebeck coefficients and power factors. We compute the
Seebeck coefficients for all the materials currently in the database and validate our calculations by
comparing our results, for a subset of materials, to experimental and existing computational
datasets. We also investigate the effect of chemical, structural, crystallographic and dimensionality
trends on thermoelectric performance. We predict several classes of efficient 3D and 2D materials
such as Ba(MgX)2 (X=P,As,Bi), X2YZ6 (X=K,Rb, Y=Pd,Pt, Z=Cl,Br), K2PtX2(X=S,Se), NbCu3X4
(X=S,Se,Te), Sr2XYO6 (X=Ta, Zn, Y=Ga, Mo), TaCu3X4 (X=S, Se,Te), and XYN (X=Ti, Zr,
Y=Cl, Br). Finally, as high-throughput DFT is computationally expensive, we train machine
learning models using gradient boosting decision trees (GBDT) and classical force-field inspired
descriptors (CFID) for n-and p-type Seebeck coefficients and power factors, to quickly pre-screen
materials for guiding the next set of DFT calculations. The dataset and tools are made publicly
available at the websites: https://www.ctcms.nist.gov/~knc6/JVASP.html ,
https://www.ctcms.nist.gov/jarvisml/ and https://jarvis.nist.gov/ .
Corresponding author: Kamal Choudhary (E-mail: [email protected])
2
I INTRODUCTION
Thermoelectrics1-4 are materials that can convert a temperature gradient into electric voltage, or
vice-versa. Themoelectrics can be used to regenerate electricity from waste heat5, refrigeration6
and several other space-technology applications7,8. The search for efficient thermoelectric
materials is an area of intense research due the potential of converting waste heat into electrical
power, and therefore improving energy efficiency and reducing fossil fuel usage. The figure of
merit for thermoelectric materials is the dimensionless quantity zT:
𝑧𝑇 =𝑆2𝜎
𝑘𝑒+𝑘𝑙𝑇 (1)
where S, 𝜎, ke, kl, and T are the Seebeck coefficient, electrical conductivity, electronic part of
thermal conductivity, lattice thermal conductivity, and temperature, respectively. The numerator,
𝑆2𝜎, is referred to as the power-factor. To achieve a high zT, a material should have a high-power
factor and low thermal conductivity. Experimental synthesis and characterization are ultimately
the critical steps to prove the usefulness of a thermoelectric material; however, experiments are
costly and time-consuming, and the list of potential thermoelectrics is very large. Computational
methods based on first principles density functional theory (DFT) can be very useful in the initial
screening process, as well as in interpreting experimental results. DFT9-12 has successfully
predicted the Seebeck coefficients and power factors for various classes of bulk materials. There
has also been a series of high-throughput computational searches for bulk/three dimensional (3D)
thermoelectrics. Chen et al.9 and Ricci et al.13 compute thermoelectric properties of more than
48000 materials and show a reasonably strong comparison between the maximum Seebeck-
coefficient determined from DFT and experiment for a subset. Garrity14,15 use high-throughput
first-principles calculations to screen transition metal oxides, nitrides, and sulfides for candidate

3
materials with high power factors and low thermal conductivity. Gorai et al.16 develop
TEDesignLab as a thermoelectrics-focused virtual laboratory that contains calculated
thermoelectric properties using several thermoelectric metrics15. Carrete et al. use high-throughput
method to identify materials with low-thermal conductivity17. He et al.18 search for several
transition metal oxides with high thermoelectric performance. In addition to the computational
databases, there are several developments of experimental databases also such as UCSB‐MRL
thermoelectric database19 . Similar to the 3D materials, there has been a huge upsurge in research
on monolayer/two-dimensional (2D) materials due to their promising high Seebeck coefficients
and low thermal conductivities20-24. Despite the above research, a systematic, combined database
that allows for the comparison of bulk and monolayer thermoelectric properties is still lacking. In
addition, such a systematic database of thermoelectric properties is necessary to develop machine
learning models for predicting the thermoelectric properties of new materials, which would
circumvent the high computational cost of additional DFT calculations and potentially guide
materials discovery. There have been a few recent reports on the applications of machine learning
for thermoelectric properties25-27, but the field is still developing.
In this work, first, we present a high-throughput DFT database of bulk and monolayer
thermoelectric properties. In this high-throughput work, we focus on finding high power factor
materials, which is a necessary and less computationally expensive step in identifying
thermoelectrics. We do not attempt to predict zT values in this work. All of the data and tools are
provided at the JARVIS-DFT website, which is a part of the materials genome initiative (MGI) at
the National Institute of Standards and Technology (NIST). The JARVIS-DFT database contains
about 36000 bulk and 900 low-dimensional materials with their DFT-computed structural,
exfoliability28, elastic29, optoelectronic30 solar-cell efficiency31, and topologically non-trivial32

4
properties. Using this database, we highlight a few novel 3D-bulk materials and 2D-monolayer
materials that we predict have good thermoelectric properties. We also investigate correlations of
thermoelectric properties with chemistry and structure of materials. Finally, we develop highly
accurate machine learning models for quickly identifying efficient thermoelectric materials.
II METHODS
The DFT calculations are carried out using Vienna Ab-initio simulation package (VASP)33,34
software using the JARVIS-DFT workflow given on our github page
(https://github.com/usnistgov/jarvis ). Please note commercial software is identified to specify
procedures. Such identification does not imply recommendation by NIST. We use OptB88vdW
functional35, which gives accurate lattice parameters for both vdW and non-vdW (3D-bulk)
solids28. There have been several tests of vdW functionals28,63 and OptB88vdW predicts important
physical quantities such as lattice constants, bulk modulus and atomization energies as well as or
better than other available vdW functionals. We employ spin-polarized calculations, starting with
a ferromagnetic spin-ordering, during the geometric optimization of each material. In this work, a
material is termed as low-dimensional if it contains vdW-bonding in one (2D-bulk), two (1D-
bulk), and three (0D-bulk) crystallographic directions. Details of the low-dimensional material
database can be found in Ref.28,29. A monolayer/2D-material is simulated with broken periodicity
in z-direction with a vacuum padding of at least 18 Å. The transport properties were calculated
using the Boltzmann transport equation (BTE) implemented in the BoltzTrap code37. The BTE is
used to investigate the non-equilibrium behavior of electrons and holes by statistically averaging
all possible quantum states given by the equation below:
𝑑𝑓(𝒌,𝑇,𝑡)
𝑑𝑡= (
𝜕𝑓(𝒌,𝑇,𝑡)
𝜕𝑡)
𝑠−
𝑑𝒌
𝑑𝑡𝛻𝑘𝑓(𝒌, 𝑇, 𝑡) − 𝑣(𝒌)𝛻𝑟𝑓(𝒌, 𝑇, 𝑡). (2)

5
f is the electron distribution, which is a function of state k, temperature T and time t, and v(k) are
the electron group velocities. The three terms on the right-hand side of Eq. 2 refer, respectively, to
the temporal rate of change of f due to all scattering processes, the rate of change of f due to external
forces, and the diffusion from the carrier density gradient. If the external forces consist only of a
low electric field, E, and no magnetic field, B, such that 𝑑𝑘
𝑑𝑡=
𝑒𝐸
ℎ then the low-filed BTE is given
by:
𝑑𝑓(𝒌,𝑇,𝑡)
𝑑𝑡+ 𝑣(𝒌)𝛻𝑟𝑓(𝒌, 𝑇) +
𝑒𝐸
ℎ𝛻𝑘𝑓(𝒌, 𝑇) = (
𝜕𝑓(𝒌,𝑇,𝑡)
𝜕𝑡)
𝑠. (3)
Now, f can be described as a first-order (linear) perturbation from the (equilibrium) Fermi-Dirac
distribution, f0, due to scattering
(𝜕𝑓(𝒌,𝑇,𝑡)
𝜕𝑡)
𝑠= −
𝑓(𝑘)−𝑓0(𝑘)
𝜏 (4)
where
𝑓0[ℰ(𝑘)] =1
𝑒[ℰ(𝑘)−ℰ𝐹]/𝑘𝐵𝑇+1 (5)
where the dependence of ℰ on k is given by the electronic band structure, and the various
scattering terms and time dependence are lumped into the electronic relaxation time, 𝜏. The
computation of the relaxation time is very computationally expensive, especially in a high-
throughput context38. The BoltzTrap code uses constant relaxation time approximation (CRTA)
and the rigid band-approximation (RBA). In CRTA, the relaxation time cancels out for Seebeck
coefficients, but for electrical conductivity, we choose a value of 10-14 s as the relaxation time39.
The relaxation time can depend on both intrinsic factors like electron-phonon coupling and
extrinsic factors like the presence of defects. The RBA assumes that the shape of density of states
does not change by doping or increasing the operation temperature. This methodology has been

6
used earlier for both bulk20-24 and monolayer40 materials. We converge the k-points and plane wave
cut-off in DFT-calculations for all the materials in our database using energy convergence criteria41
of 0.001 eV. These k-points and cut-offs values are generally higher than the usual 1000/atom k-
points selected in previous high-throughput database studies. Note that for some metallic and low-
bandgap materials it is difficult to converge the BoltzTrap calculations, hence their transport values
are not reported. Calculation of thermal conductivity is very computationally expensive because
they require the calculation of anharmonic force constants. So, we limit such calculations to only
one example material. The force constants are fit with the method described in Garrity14, 15 and
BTE is solved using ShengBTE42.
The machine-learning models are trained using classical force-field inspired descriptors (CFID)
descriptors43 and supervise machine learning techniques using decision-trees (DT), random-forest
(RF), k-nearest neighbor (KNN), multilayer perceptron (MLP), gradient boosting techniques in
the scikit-learn package44 also GBDT implemented in XGBoost45 and LightGBM46 packages. The
CFID gives a unique representation of a material using structural (such as radial, angle and dihedral
distributions), chemical, and charge descriptors. Using the DFT thermoelectric data, we train
classification machine learning models to identify whether a material has Seebeck-coefficient less
than -100 μV/K for n-type and more than 100 μV/K for p-type, n and p-power factor more than
1000 μW/(mK)2 at 600 K and 1020/cm3 doping. The CFID43 has been recently used to develop
several high-accuracy ML models for material properties such as formation energies, bandgaps,
refractive index, bulk and shear modulus and exfoliation energies k-points, cut-offs41, and solar-
cell efficiencies31.

7
III RESULTS AND DISCUSSION
We use BoltzTrap to calculate the electronic transport properties for all the 36000 bulk and 900
monolayer materials in our database, calculating the Seebeck coefficients (S), electrical-
conductivities (𝜎), power factors, and electronic part of thermal conductivities, all as a function of
temperature and doping. The resultant data is used for screening potential thermoelectric materials,
analyzing trends and machine learning training processes. A flow-chart describing our
computational search is shown in Fig. 1.
Fig. 1 Flow chart associated with the data-driven thermoelectric materials design.
IIIA EXPERIMENTAL AND THEORETICAL BENCHMARKING
To benchmark our computational methodology, we compare our Seebeck coefficients for a subset
of 14 materials to experimental data, and we find a mean absolute deviation (MAD) of 54.7 μV/K

8
(r2=0.94). The details of this comparison are shown in the supplementary information (Fig. S1a
and Table. S1). Next, we compare our Seebeck coefficients (JV) to DFT results from another
computational database, the Materials-Project (MP)13, to ascertain how sensitive our results are to
specific choices of DFT parameters (exchange-correlation functional, k-points density and energy
cutoff). We look at 9434 compounds from the MP and JV databases, comparing the n-type Seebeck
coefficient at 600K and 1020/cm3 doping. We obtained a MAD of 18.8 μV/K (r2=0.87), signifying
that DFT data for Seebeck coefficients are closer to each other than to the experimental results.
We attribute the differences between the MP and JV datasets to the fact that MP uses the GGA-
PBE47 functional as well as fixed k-points and cutoffs for their DFT calculations, while JV uses
the OptB88vdW functional and an automatic convergence procedure for k-points and cutoffs,
which we expect to provide improved results especially for vdW-bonded materials. More
details/data on the DFT comparisons are also provided in the supplementary information (Fig.
S1b).
IIIB SCREENING AND ANALYSIS OF BULK THERMOELECTRICS
After computing the Seebeck coefficients for all the materials in the database, we concentrate on
developing a screening method that identifies high-efficiency thermoelectric materials. The
thermoelectric performance of a material depends on several quantities, most notably, temperature,
doping type, and doping concentration. We chose to concentrate on temperatures of 600 K and
1020 /cm3 doping, which represent a typical thermoelectric operating temperature and a doping
level that is achievable for many semiconductors. However, we note that dopability of a
semiconductor depends on several critical factors such as native defect energetics, which are too
computationally expensive to predict from first principles in a systematic manner. Many
experimentally relevant thermoelectrics are doped at similar concentration as shown in the

9
supplementary information (Table. S1). As good thermoelectric materials are generally
semiconducting or insulating, we first screen for materials with bandgap>0.05 and BoltzTrap data,
which narrows the search set from 36000 down to 8764 materials. We present an overview of the
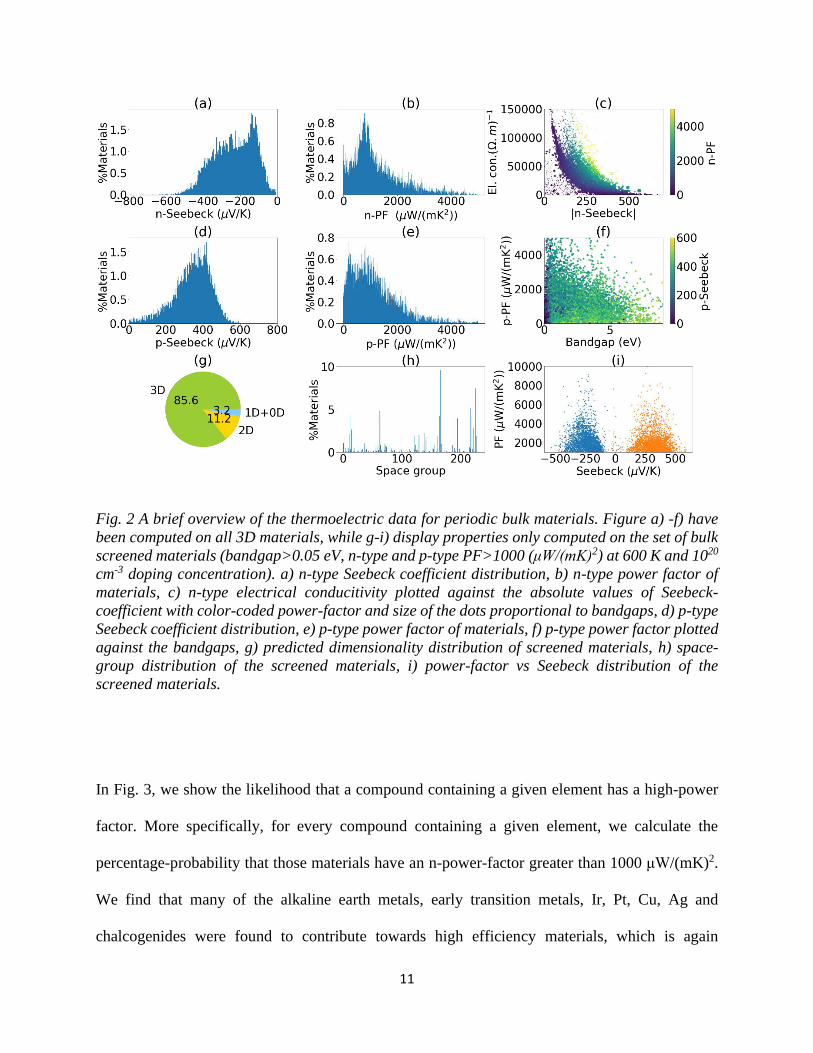
database in Fig. 2. The n and p-type Seebeck coefficients are generally negative and positive
values, respectively, with a maximum absolute value of 600 μV/K, as shown in Fig. 2a and 2d. In
Fig. 2b and 2e, we show the distribution of power factors for n-type and p-type materials.
Experimentally known high-efficiency thermoelectric have power factors of more than 1000
μW/(mK)2. Although a high Seebeck-coefficient is necessary for a high power factor, there is
typically a significant tradeoff between S and 𝜎, necessitating a more careful analysis14. This
tradeoff can be seen in Fig. 2c, which shows a scatter plot of S versus 𝜎 for n-type thermoelectrics.
The sizes of dots are proportional to the bandgaps and color-coded based on their power factor
values. A similar inverse-relationship applies to p-type materials as well. In Fig 2f, we look at the
relationship between power factors and band gaps, finding that high power factors occur more
often in low band gap materials. A similar relationship holds for the n-type materials as well.
For the next step in the screening procedure, we select only materials with n-type and p-type power
factor at 600 K and 1020/cm3 larger than 1000 μW/(mK)2, which gives us 4330 and 4403
candidates, respectively. We find 2932 materials with both n-and p-type PF >1000 μW/(mK)2. For
this case, we analyzed the set of selected materials in terms of various chemical and physical
attributes. To begin with, we classified their dimensionality, which is determined by lattice-
constant and data-mining approaches28. As shown in Fig. 2g, we find that 14.4 % of the high
efficiency thermoelectrics are low-dimensional, i.e. vdW-bonded, while the rest have three-
dimensional bonding. Next, we find that these materials tend to be highly symmetric, as cubic and
trigonal symmetry materials are over-represented (as shown in Fig. 2h). As discussed earlier, we

10
find a range of Seebeck coefficients among our set of high-power factor materials, due to the
tradeoff between S and 𝜎, as shown in Fig. 2i. Finally, we note that our screening process
rediscovered several well-known thermoelectrics, such as Bi2Te3, SnSe, GeTe, Mg2Si, PtSe2,
PbSe, PbTe and PtSe2, as well as many potential new thermoelectrics. Some examples of families
of thermoelectrics uncovered in our screening include Ba(MgX)2 (X=P,As,Bi), X2YZ6 (X=K,Rb,
Y=Pd,Pt, Z=Cl,Br), K2PtX2(X=S,Se), NbCu3X4(X=S,Se,Te), Sr2XYO6(X=Ta, Zn, Y=Ga, Mo),
TaCu3X4(X=S, Se,Te). Some of these materials are 0D-bulk i.e. with vdW interactions along all
three axes, as in AsI3 (JVASP-3636), or along just two axes (1D-bulk materials such as BiSeI
(JVASP-5200), TeBr2 (JVASP-33839), SeI2 (JVASP-33798)), or, as in most cases, along one axis
only (2D-bulk materials such as BN (JVASP-17), YSnF5 (JVASP-8344), HfS2 (JVASP-210),
MnBr2 (JVASP-2041), GeTe (JVASP-1157), TiO2 (JVASP-30586), NiO2 (JVASP-8645), GaP
(JVASP-28372), SbAsO4 (JVASP-10177)). Many other newly identified materials for
thermoelectrics applications are 3D-bulk materials, i.e. no vdW-bonding, such as LiMgN (JVASP-
22546), CaO2 (JVASP-22677 ), Li2CuSb (JVASP-7820), SrZrO3 (JVASP-8037), K2PtSe2
(JVASP-2838), Al2ZnS4 (JVASP-9688), ZnO2 (JVASP-10252), Sr2TaGaO6 (JVASP-10974),
TiSnO3 (JVASP-35817), ZrSiPt (JVASP-40824), YAlO3 (JVASP-50410), AlAs (JVASP-8183),
RbAuC2 (JVASP-7652). A full list is provided in the supplementary information. We will provide
information on the stability of each compound using a convex-hull approach on the website soon.
The JVASP-# denotes the JARVIS-IDs of the materials the details of which can be found at
corresponding https://www.ctcms.nist.gov/~knc6/jsmol/JVASP-#.html. For example, the details
of JVASP-8037 is available at https://www.ctcms.nist.gov/~knc6/jsmol/JVASP-8037.html.
11
Fig. 2 A brief overview of the thermoelectric data for periodic bulk materials. Figure a) -f) have
been computed on all 3D materials, while g-i) display properties only computed on the set of bulk
screened materials (bandgap>0.05 eV, n-type and p-type PF>1000 (μW/(mK)2) at 600 K and 1020
cm-3 doping concentration). a) n-type Seebeck coefficient distribution, b) n-type power factor of
materials, c) n-type electrical conducitivity plotted against the absolute values of Seebeck-
coefficient with color-coded power-factor and size of the dots proportional to bandgaps, d) p-type
Seebeck coefficient distribution, e) p-type power factor of materials, f) p-type power factor plotted
against the bandgaps, g) predicted dimensionality distribution of screened materials, h) space-
group distribution of the screened materials, i) power-factor vs Seebeck distribution of the
screened materials.
In Fig. 3, we show the likelihood that a compound containing a given element has a high-power
factor. More specifically, for every compound containing a given element, we calculate the
percentage-probability that those materials have an n-power-factor greater than 1000 μW/(mK)2.
We find that many of the alkaline earth metals, early transition metals, Ir, Pt, Cu, Ag and
chalcogenides were found to contribute towards high efficiency materials, which is again

12
consistent with previously known thermoelectric materials1-4 such as Bi2Te3, SnSe, GeTe, Mg2Si,
PtSe2. For example, 298 out of 587 Se-containing compounds in our database have power-factors
greater than 1000 μW/(mK)2 so, the percentage is 50.77%. Such periodic table trends can help
guide new materials searches or doping strategies that may result in improved thermoelectrics. As
there are no clear trends between high-PF materials and common chemical characteristics, such as
the electronegativity, that would be obvious on a periodic table, there is a need for more
sophisticated statistical machine learning techniques, which we carry out in a following section.
Fig. 3 Periodic table trends of high-power factor materials. The elements in a material were
assigned 1 or 0 if the material has high or low n-type power-factor (>1000 (μW/(mK)2)). Then the
probability of finding the element in a high power-factor material was calculated.

13
IIIC SCREENING AND ANALYSIS OF MONOLAYER THERMOELECTRICS
The screening process described and analyzed up to this point was applied exclusively to bulk
materials. Next, we apply a similar procedure to monolayer 2D materials. The vdW-bonded
materials (2D-bulk) can be exfoliated to produce 2D-monolayers, which have shown promise in
thermoelectric applications20-24. The exfoliability of a 2D-bulk material is depends on its
exfoliation energy, as described in detail in Ref.28. In order to find exfoliable high-efficiency 2D
monolayers, we select materials in our database which meet the following criteria: a) exfoliation
energy < 200 meV/atom, b) bandgap>0.05 and c) monolayer-n-type Seebeck-coefficient <-100
µV/K. In order to compare the thermoelectric properties of monolayer and bulk structures, it is
necessary to express the doping and conductivity quantities in a way that does not depend on the
arbitrary vacuum thickness of a monolayer simulation cell. To achieve this, we rescaled the volume
of the monolayers using the thickness of a 2D-layer. Using this screening procedure, we identified
148 promising 2D monolayers among 900 materials. As seen in Fig. 4a, comparing 2D and 3D
Seebeck coefficients, we see that monolayers tend to have smaller absolute Seebeck coefficients
than their bulk counterparts. This shows that interlayer coupling is important to thermoelectric
behavior, and that 2D thermoelectric properties can’t be exactly obtained from their bulk
counterpart. Nevertheless, the Spearmen’s correlation between the bulk and monolayer Seebeck
coefficients is 0.711 while the Pearson’s correlation is 0.721, as shown in Table 1 and S2,
suggesting noteworthy correlation. We also investigated the correlation between 3D and
monolayer density of states (DOS) at the Fermi level, for 600 K and 1020/cm3 doping, as well as
the correlation for the effective mass. Both results are given in Table 1 and S2. We find a strong
correlation between bulk and monolayer effective masses (0.80), and an even stronger correlation
(0.90) between bulk and monolayer DOS at the Fermi level, suggesting that the Seebeck-

14
coefficient is more difficult to predict. A lower Spearman’s correlation of 0.43 was reported for
bulk systems Seebeck-coefficient and DOS by Garrity et al. 14 for transition metal oxides, sulfides
and nitrides. Kumar et al. 21 also showed similar correlations for monolayer and bulk WSe2, using
DFT calculations.
Table.1 Spearman correlation of monolayer (Mono) and bulk density of states (DOS)
(states/unitcell) at Fermi level, the effective mass of electrons (me) and Seebeck coefficients
(µV/K).
Spearman
correlation
Mono-
DOS
Bulk-
DOS
Bulk-
Seebeck
Mono-
Seebeck
Bulk-me Mono-
me
Mono-DOS - 0.897 0.592 0.553 -0.474 -0.432
Bulk-DOS 0.897 - 0.604 0.566 -0.493 -0.412
Bulk-Seebeck 0.592 0.604 - 0.711 -0.859 -0.723
Mono-Seebeck 0.533 0.566 0.711 - -0.596 -0.668
Bulk-me -0.474 -0.493 -0.859 -0.596 - 0.801
Mono-me -0.432 -0.412 -0.723 -0.668 0.801 -
Some of the high-efficiency 2D-monolayer materials that we find are: AuBr (JVASP-27756), SnSe
(JVASP-5929), SnS (JVASP-19989), PtSe2 (JVASP-744), ZrS3 (JVASP-792), GaSe (JVASP-
687), WSe2 (JVASP-652). The full database is available online. We note a special class of vdW-
bonded materials, XYZ (X=Ti,Zr, Y=N, Z=Cl,Br,I) (such as JVASP-6268, JVASP-6181, JVASP-
6184), which show consistently high thermoelectric behavior, and which would be a promising
target for future investigation. While many of these compounds have not yet been experimentally
verified as 2D materials28, they are almost all related to experimentally known 3D layered

15
structures from the ICSD, and have exfoliation energies consistent with the small number of
experimentally studied 2D materials. We hope that works like this one will in part encourage the
study of a wider range of 2D materials.
As a first step in this direction, we carried out thermal conductivity calculations for a representative
example, ZrBrN (JVASP-12027), in its 3D form, which resulted in a remarkable low lattice
thermal conductivity of 0.3 W / m K at 300K. The unit cell and phonon dispersion curve of ZrBrN
are shown in Fig. 4b and 4c. We see that while the structure is dynamically stable (all positive
frequency modes), there are low-frequency phonon modes which extend across the Brillioun zone,
which are responsible for the strongly anharmonic behavior in this system. Such detailed analysis
for candidate thermoelectric materials will be considered in the future.
Fig. 4 a) 3D vs 2D Seebeck coefficients, b) crystal structure of ZrBrN (JVASP-12027), Zr in grey,
N in blue, Br in red c) Phonon bandstructure for ZrBrN.
16
IIID MACHINE LEARNING ANALYSIS
Finally, to accelerate the DFT screening process, we train supervised classification machine
learning models43 for n and p-type Seebeck coefficients and power-factors. In this scheme, we
simply classify whether materials have a property value greater or lesser than certain thresholds.
The accuracies of the classification models are evaluated based on the area under curve (AUC) of
the receiver operating characteristics (ROC) curves. The ROC curve illustrates the model’s ability
to differentiate between high and low-performance materials, classifying a material to be high-
performance if its Seebeck coefficient is less than -100 μV/K for n-type, or more than 100 μV/K
for p-type, and if its n- and p-power factor is more than 1000 μW/(mK)2 at 600 K and 1020/cm3
doping. The ROC curve plots the prediction rate for high-performance materials, correctly versus
incorrectly predicted. A value of 0.5 implies random guessing, while a value of 1.0 implies a
perfect model. We first train classification models with default parameters using decision tress
(DT), random forest (RF), k-nearest neighbors (KNN), multi-layer perceptron (MLP), and gradient
boosting models implemented in scikit-learn package and also GBDT implemented in XGBoost
(XGB) and LightGBM (LGB) packages. As a standard practice, we use train-test split (90%:10%),
five-fold cross-validation, and examining AUC for ROC curves on the 10% held set (as shown in
Table 2). Evidently, the LGB model already performs very well with the default parameters only.

17
Table 2 Initial Comparison of ML Classification Techniques Using DT, RF, KNN, MLP, GBDT
implemented in scikit-Learn Package (SK-GB), GBDT in XGBoost (XGB), and GBDT in
LightGBM (LGB).
ROC-AUC n-Seeb p-Seeb n-PF p-PF
DT 0.80 0.83 0.64 0.65
RF 0.92 0.94 0.75 0.76
KNN 0.91 0.92 0.74 0.74
MLP 0.73 0.95 0.74 0.76
SK-GB 0.92 0.94 0.75 0.76
XGB 0.92 0.95 0.75 0.76
LGB 0.94 0.96 0.75 0.80
We further tune LGB hyperparameters such as the number of estimators, the number of leaves,
and the learning rate using a five-fold cross-validation grid search. Using the best model of grid
search, we predict the ROC of the 10% held set (shown in Figure 5). We achieve high accuracy
for most of the models, with the model for p-type Seebeck being the best one as it corresponds to
the highest value of 0.96 as shown in Fig. 5b. We obtain at least 0.8 AUC for most of the ML
models, signifying high prediction accuracies.

18
Fig. 5 Classification receiver operation characteristic curves (ROC) for high Seebeck-coefficient
and high power-factor materials. The dotted line shows the random guessing line with an AUC
0.5.
In addition to the thresholds specified above for classifying high/low performance materials (100
μV/K for |S|, 1000 μW/(mK)2 for PF), we also train models with more stringent thresholds as
shown in Table. 3. We find similar ROC AUC for several different thresholds, allowing for more
or less sensitive models to be chosen. We can apply these models to arbitrary materials to quickly
pre-screen efficient thermoelectric materials, which would become the subject of the next set of
DFT calculations. We followed a similar procedure to identify semiconducting 2D materials in our
previous work43 and successfully discovered several 2D materials. Clearly, the screening process
can be much accelerated using machine learning models as a first step. All these models are

19
provided on the JARVIS-ML website (https://www.ctcms.nist.gov/jarvisml/) for predicting
thermoelectric performance of new compounds.
Table 3 Comparison of ROC AUC with varying thresholds used to classify high/low performance
materials.
Threshold Model ROC AUC
-100 µV/K p-Seeb 0.96
-200 µV/K p-Seeb 0.96
-300 µV/K p-Seeb 0.95
1000 μW/(mK)2 p-PF 0.82
2000 μW/(mK)2 p-PF 0.83
3000 μW/(mK)2 p-PF 0.84
Furthermore, the GBDT algorithm allows us to get the feature importance information for each of
the 1557 descriptors. We group the features in respective classes43 such as chemical descriptors
(Chem), radial distribution function (RDF), nearest neighbor (NN), angular distribution upto first
(ADF-1st) and second neighbor (ADF-2nd), dihedral distribution function upto first neighbor
(DDF), charge descriptor (Chg), cell-size related descriptors (Cell) as shown in Fig. 6. We find
that chemical, radial distribution, angle-distribution up to first neighbors, and dihedral angle
distribution are almost equally important for achieving a high accuracy model. This is in contrast
with the formation energy model43 in our previous work, where we found that chemistry was the
most dominant feature. This might explain why there is no clear trend visible in the periodic table
discussed above (see Fig. 3). Out of all the 1557 descriptors, some of the most important
descriptors for all the models are: cell-size related descriptors-density and logarithm of volume of

20
the cell, radial distribution peak at 7.5 Å, 9.4 Å and 9.5 Å, first-neighbor based angular distribution
peak at 178 degree, mean of product of polarizability and atomic mass, ratio of atomic radii and
molar volume and refractive index of individual constituent elements43.
Fig. 6 Feature importance distribution plot for the classification models.
21
IV CONCLUSIONS
In summary, we use semiclassical transport methods based on density functional theory
calculations to evaluate the thermoelectric properties of both bulk (3D) and monolayer (2D)
materials. In addition to identifying interesting candidate materials, we also show chemical,
crystallographic, compositional and dimensionality trends for the whole dataset. We screen 2D
materials and evaluate trends between the thermoelectric performance of bulk and monolayer
geometries. We identify several compositional classes with high thermoelectric performance. We
predict ultra-low lattice thermal conductivity in the ZrBrN class of materials. Although the
constant-relaxation time approximation is a crude approximation, it allows the generation of large-
scale database for initial screening of thermoelectric materials. Finally, we train machine learning
models to accelerate the future screening processes. We believe that our data and tools for
evaluating and predicting thermoelectric performance will greatly enhance the discovery and
characterization of thermoelectric materials.
V SUPPLEMENTARY MATERIAL
See the supplementary material for the comparison of theoretical and experimental data as well as
the dataset generated in the present work.
REFERENCES
1 Snyder, G. J. & Toberer, E. S. in Materials For Sustainable Energy: A Collection of Peer-Reviewed Research and Review Articles from Nature Publishing Group 101-110 (World Scientific, 2011).
2 Chen, G., Dresselhaus, M., Dresselhaus, G., Fleurial, J.-P. & Caillat, T. Recent developments in thermoelectric materials. International Materials Reviews 48, 45-66 (2003).
3 Wang, H., Pei, Y., LaLonde, A. D. & Snyder, G. J. in Thermoelectric Nanomaterials 3-32 (Springer, 2013).
4 Zebarjadi, M., Esfarjani, K., Dresselhaus, M., Ren, Z. & Chen, G. Perspectives on thermoelectrics: from fundamentals to device applications. Energy & Environmental Science 5, 5147-5162 (2012).
5 Bell, L. E. Cooling, heating, generating power, and recovering waste heat with thermoelectric systems. Science 321, 1457-1461 (2008).
6 Goldsmid, H. Thermoelectric refrigeration. (Springer, 2013).

22
7 Yang, J. & Caillat, T. Thermoelectric materials for space and automotive power generation. MRS Bulletin 31, 224-229 (2006).
8 Riffat, S. B. & Ma, Thermoelectrics: a review of present and potential applications. Applied thermal engineering 23, 913-935 (2003).
9 Chen, W. et al. Understanding thermoelectric properties from high-throughput calculations: trends, insights, and comparisons with experiment. Journal of Materials Chemistry C 4, 4414-4426 (2016).
10 Zhu, H. et al. Computational and experimental investigation of TmAgTe 2 and XYZ 2 compounds, a new group of thermoelectric materials identified by first-principles high-throughput screening. Journal of Materials Chemistry C 3, 10554-10565 (2015).
11 Tan, G. et al. High thermoelectric performance of p-type SnTe via a synergistic band engineering and nanostructuring approach. Journal of the American Chemical Society 136, 7006-7017 (2014).
12 Wang, S., Wang, Z., Setyawan, W., Mingo, N. & Curtarolo, S. Assessing the thermoelectric properties of sintered compounds via high-throughput ab-initio calculations. Physical Review X 1, 021012 (2011).
13 Ricci, F. et al. An ab initio electronic transport database for inorganic materials. Scientific data 4, 170085 (2017).
14 Garrity, K. F. First-principles search for n-type oxide, nitride, and sulfide thermoelectrics. Phys Rev B 94, 045122 (2016).
15 Gorai, P. et al. TE Design Lab: A virtual laboratory for thermoelectric material design. Comp. Mat. Sci. 112, 368-376 (2016).
16 Gorai, P., Stevanović, V. & Toberer, E. S. Computationally guided discovery of thermoelectric materials. Nature Reviews Materials 2, 17053 (2017).
17 Carrete, J., Li, W., Mingo, N., Wang, S. & Curtarolo, S. Finding unprecedentedly low-thermal-conductivity half-Heusler semiconductors via high-throughput materials modeling. Phys. Rev. X 4, 011019 (2014).
18 He, J. et al. Bi2PdO4: a promising thermoelectric oxide with high power factor and low lattice thermal conductivity. Chem. Mater. 29, 2529-2534 (2017).
19 Gaultois, M. W. et al. Data-driven review of thermoelectric materials: performance and resource considerations. Chem. Mater. 25, 2911-2920 (2013).
20 Huang, W., Da, H. & Liang, G. Thermoelectric performance of mx2 (m= mo, w; x= s, se) monolayers. Journal of Applied Physics 113, 104304 (2013).
21 Kumar, S. & Schwingenschlogl, U. Thermoelectric response of bulk and monolayer MoSe2 and WSe2. Chemistry of Materials 27, 1278-1284 (2015).
22 Ding, G., Gao, G., Huang, Z., Zhang, W. & Yao, K. Thermoelectric properties of monolayer MSe2 (M= Zr, Hf): low lattice thermal conductivity and a promising figure of merit. Nanotechnology 27, 375703 (2016).
23 Qin, D. et al. Monolayer PdSe 2: A promising two-dimensional thermoelectric material. Scientific reports 8, 2764 (2018).
24 Dresselhaus, M. S. et al. New directions for low‐dimensional thermoelectric materials. Advanced materials 19, 1043-1053 (2007).
25 Furmanchuk, A. o. et al. Prediction of seebeck coefficient for compounds without restriction to fixed stoichiometry: A machine learning approach. J comp. Chem. 39, 191-202 (2018).
26 Wang, T., Zhang, C., Snoussi, H. & Zhang, G. Machine Learning Approaches for Thermoelectric Materials Research. Adv. Func. Mater. (2019).
27 Gaultois, M. W. et al. Perspective: Web-based machine learning models for real-time screening of thermoelectric materials properties. APL Mater. 4, 053213 (2016).

23
28 Choudhary, K., Kalish, I., Beams, R. & Tavazza, F. High-throughput Identification and Characterization of Two-dimensional Materials using Density functional theory. Scientific Reports 7, 5179 (2017).
29 Choudhary, K., Cheon, G., Reed, E. & Tavazza, F. Elastic properties of bulk and low-dimensional materials using van der Waals density functional. Physical Review B 98, 014107 (2018).
30 Choudhary, K. et al. Computational screening of high-performance optoelectronic materials using OptB88vdW and TB-mBJ formalisms. Scientific data 5, 180082 (2018).
31 Choudhary, K. et al. Accelerated Discovery of Efficient Solar-cell Materials using Quantum and Machine-learning Methods. Chem. Mater. 31, 15, 5900 (2019).
32 Choudhary, K., Garrity, K. F. & Tavazza, F. High-throughput Discovery of topologically Non-trivial Materials using spin-orbit spillage. Scientific Reports 9, 8534 (2019).
33 Kresse, G. & Furthmüller, J. Efficient iterative schemes for ab initio total-energy calculations using a plane-wave basis set.Phys. Rev. B 54, 11169 (1996).
34 Kresse, G. & Furthmüller, J. Efficiency of ab-initio total energy calculations for metals and semiconductors using a plane-wave basis set. Comp. Mat. Sci. 6, 15-50 (1996).
35 Klimeš, J., Bowler, D. R. & Michaelides, A. Chemical accuracy for the van der Waals density functional. J. Phys. Cond. Mat. 22, 022201 (2009).
36 Faghaninia, A., Ager III, J. W. & Lo, C. S. Ab initio electronic transport model with explicit solution to the linearized Boltzmann transport equation. Phys. Rev. B 91, 235123 (2015).
37 Madsen, G. K. & Singh, D. J. BoltzTraP. A code for calculating band-structure dependent quantities. Computer Physics Communications 175, 67-71 (2006).
38 Samsonidze, G. & Kozinsky, B. Accelerated Screening of Thermoelectric Materials by First‐Principles Computations of Electron–Phonon Scattering.Adv. En. Mater. 8, 1800246 (2018).
39 Pizzi, G., Volja, D., Kozinsky, B., Fornari, M. & Marzari, N. BoltzWann: A code for the evaluation of thermoelectric and electronic transport properties with a maximally-localized Wannier functions basis. Comp. Phys. Comm. 185, 422-429 (2014).
40 Jain, A. et al. Commentary: The Materials Project: A materials genome approach to accelerating materials innovation. APL Mater. 1, 011002 (2013).
41 Choudhary, K. & Tavazza, F. Convergence and machine learning predictions of Monkhorst-Pack k-points and plane-wave cut-off in high-throughput DFT calculations. Comp. Mat. Sci. 161, 300-308 (2019).
42 Li, W., Carrete, J., Katcho, N. A. & Mingo, N. ShengBTE: A solver of the Boltzmann transport equation for phonons. Comp. Phys. Comm. 185, 1747-1758 (2014).
43 Choudhary, K., DeCost, B. & Tavazza, F. Machine learning with force-field-inspired descriptors for materials: Fast screening and mapping energy landscape. Physical Review Materials 2, 083801, doi:10.1103/PhysRevMaterials.2.083801 (2018).
44 Pedregosa, F. et al. Scikit-learn: Machine learning in Python. J. Machine learning 12, 2825-2830 (2011).
45 Chen, T. & Guestrin, C. in Proceedings of the 22nd acm sigkdd international conference on knowledge discovery and data mining. 785-794 (ACM).
46 Ke, G. et al. in Advances in Neural Information Processing Systems. 3146-3154. 47 Perdew, J. P., Burke, K. & Ernzerhof, M. Generalized gradient approximation made simple.Phys.
Rev. Lett. 77, 3865 (1996). 48 Zhang, Y. et al. Surfactant-free synthesis of Bi2Te3− Te micro− nano heterostructure with
enhanced thermoelectric figure of merit. ACS Nano 5, 3158-3165 (2011). 49 Janíček, P. et al. Thermoelectric properties of Tl‐doped Bi2Se3 single crystals. Crys. Res. and Tech.
44, 505-510 (2009).
24
50 Liu, R. et al. Ternary compound CuInTe 2: a promising thermoelectric material with diamond-like structure. Chem Comm. 48, 3818-3820 (2012).
51 Plirdpring, T. et al. Chalcopyrite CuGaTe2: A High‐Efficiency Bulk Thermoelectric Material. Adv. Mater. 24, 3622-3626 (2012).
52 Kurosaki, K., Goto, K., Muta, H. & Yamanaka, S. J. Enhancement of thermoelectric figure of merit of AgTlTe by tuning the carrier concentration. J. App. Phys. 102, 023707 (2007).
53 Kawano, K., Kurosaki, K., Sekimoto, T., Muta, H. & Yamanaka, S. Effect of Sn doping on the thermoelectric properties of ErNiSb-based p-type half-Heusler compound. App. Phys. Lett. 91, 062115 (2007).
54 Matsushita, H., Maeda, T., Katsui, A. & Takizawa, T. J. Thermal analysis and synthesis from the melts of Cu-based quaternary compounds Cu–III–IV–VI4 and Cu2–II–IV–VI4 (II= Zn, Cd; III= Ga, In; IV= Ge, Sn; VI= Se). J. Crys. Growth 208, 416-422 (2000).
55 Ono, Y., Inayama, S., Adachi, H. & Kajitani, T. J. Thermoelectric properties of doped half-Heuslers NbCoSn1-xSbx and Nb0. 99Ti0. 01CoSn1-xSbx. Japanese J. App. Phys. 45, 8740 (2006).
56 Kawaharada, Y., Kurosaki, K., Yamanaka, S. Thermophysical properties of Fe2VAl. J. Alloys & Comp. 352, 48-51 (2003).
57 Sekimoto, T., Kurosaki, K., Muta, H. & Yamasaka, S. in ICT 2005. 24th International Conference on Thermoelectrics, 2005. 347-350 (IEEE).
58 Zhao, L.-D. et al. Ultralow thermal conductivity and high thermoelectric figure of merit in SnSe crystals. Nature 508, 373 (2014).
59 Tan, G. et al. High thermoelectric performance of p-type SnTe via a synergistic band engineering and nanostructuring approach. J. Am. Chem. Soc 136, 7006-7017 (2014).
60 Ballikaya, S., Chi, H., Salvador, J. R. & Uher, C. J. Thermoelectric properties of Ag-doped Cu 2 Se and Cu 2 Te. J. Mater. Chem. A 1, 12478-12484 (2013).
61 Kim, S., Wiendlocha, B., Jin, H., Tobola, J. & Heremans, J. P. . Electronic structure and thermoelectric properties of p-type Ag-doped Mg2Sn and Mg2Sn1-xSix (x= 0.05, 0.1). J. App. Phys. 116, 153706 (2014).
63 J. Klimeš, D. R. Bowler, and A. Michaelides, Physical Review B 83, 195131 (2011)