data data data! how to use free data tools to create workforce development strategies
TRANSCRIPT

#NYATEPFALL15
Data, Data, Data!
Presented by Rob Camoin and Ian Flatt
How to use free data tools to create workforce development
strategies

#NYATEPFALL15
Workforce AnalysisPresentation Goals: • Present variety of quality data sources• Identify ways they can be used to support your work
Purpose of Workforce Analysis:• Develop-data driven strategies• Strategically deploy resources to most high need industries and individuals
#NYATEPFALL15
Questions•Do you use economic/workforce data?•If yes, for what purpose? (advising clients, developing strategies, etc.?)•How could workforce and economic data support your work?

#NYATEPFALL15
Workforce AnalysisUses: • Identify growth industries• Identify growth occupations• Direct clients to training for in-demand occupations with strong wages• Identify populations with barriers to employment• Track progress to strategic goals

#NYATEPFALL15
Basic Guidelines• Compare data to benchmarks – state, US, or other similar communities or regions• Track most recent data, trends over time, and projections• Verify data with employers and ED partners• Review regularly and make appropriate updates• Keep an eye on current events and trends – could change what the data is telling you

#NYATEPFALL15
DefinitionsNorth American Industry Classification System (NAICS) Codes• Standard used by Federal statistical agencies in classifying business
Standard Occupational Classification (SOC) Codes• System is used by Federal statistical agencies to classify workers into occupational categories • All workers are classified into one of 840 detailed occupations according to their occupational definition

#NYATEPFALL15
Workforce Analysis Data Checklist
Largest industriesFastest growing industriesIndustry wagesTop occupations
WagesEducation requirements
Unemployment ratesLabor force participation
AgeIncomeEducation“Disconnected Youth”VeteransIndividuals with disabilities
Commuting patterns

#NYATEPFALL15
Industry Data

#NYATEPFALL15
US Cluster Mapping Project• Product of Harvard Business School and US Economic Development Administration• Provides in-depth information about industry clusters• Data about changes in employment, unemployment rates, labor force participation, and wages• Can create custom regions (e.g. multi-county WF regions)
http://www.clustermapping.us/

#NYATEPFALL15
US Cluster MappingStrengths: • Easily download data• Can create custom regions• Variety of data• Divides clusters between “Traded” and “Local”
Limitations:• Not always clear what NAICS codes the clusters refer to (check the definitions if not sure)

#NYATEPFALL15
Map a wide range of variablesAt the county,
state, economic area, or MSA
levelsSelect date
range
Create custom regions

#NYATEPFALL15
Charts summarizes employment and
demographic data
More detailed charts measuring
the economic health of the
region
Detailed information
about employment in
industry clusters

#NYATEPFALL15
Learn about key employment,
wage, and economic data
And more…

#NYATEPFALL15
Detailed Information about Industry
Clusters

#NYATEPFALL15
Average wages in each cluster

#NYATEPFALL15
Detailed Information about Sub Clusters

#NYATEPFALL15
US Cluster Mapping Project•Using data available from US Clusters Mapping, we can easily identify:• The largest industries

#NYATEPFALL15
US Cluster Mapping Project•Using data available from US Clusters Mapping, we can easily identify:• The largest industries• Industries that added the most jobs

#NYATEPFALL15
US Cluster Mapping Project•Using data available from US Clusters Mapping, we can easily identify:• The largest industries• Industries that added the most jobs• Fastest growing industries

#NYATEPFALL15
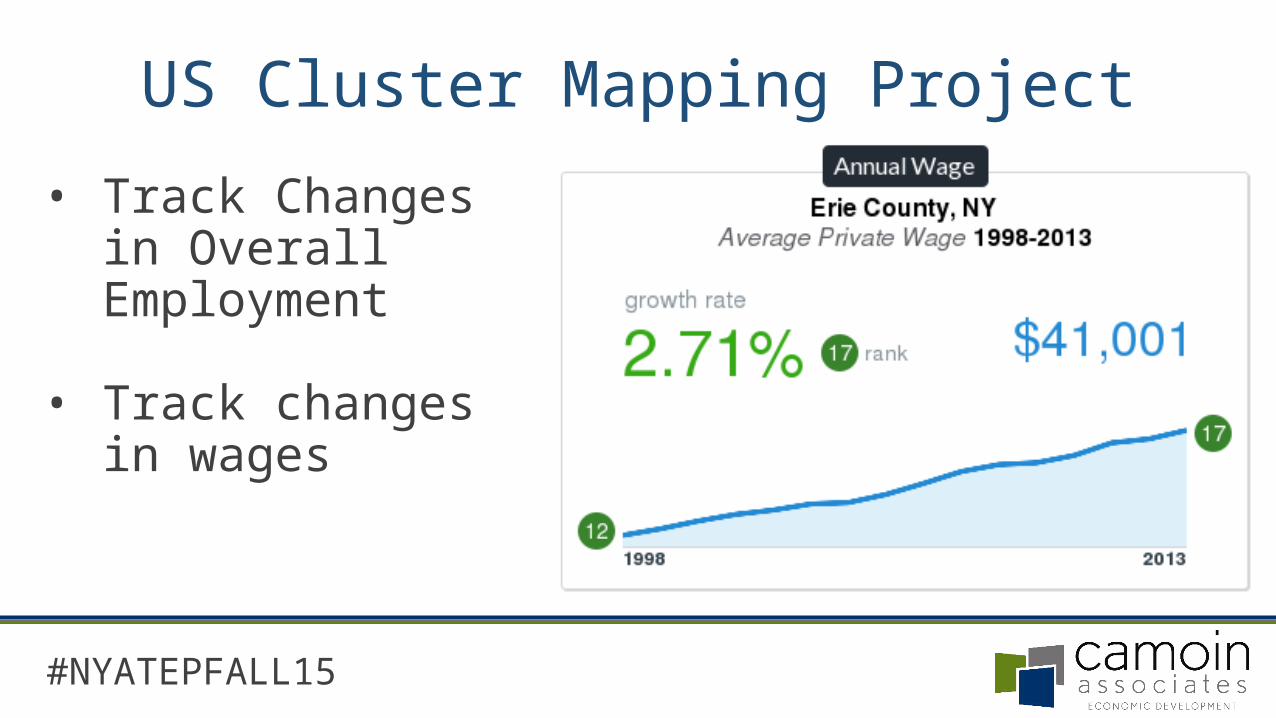
• Track Changes in Overall Employment
US Cluster Mapping Project
#NYATEPFALL15
US Cluster Mapping Project• Track Changes in
Overall Employment
• Track changes in wages

#NYATEPFALL15
US Cluster Mapping:Other Available Information
• Shift Share Analysis (industry competitiveness)• Location Quotient (industry specialization)• Compare region to other geographies• Identify communities with similar employment trends – can be good for future benchmarks• Demographic information• Definitions of clusters (i.e. the NAICS codes included) provided

#NYATEPFALL15
Workforce Analysis Data Checklist
Largest industriesFastest growing industriesIndustry wagesTop occupations
WagesEducation requirements
Unemployment ratesLabor force participation
AgeIncomeEducation“Disconnected Youth”VeteransIndividuals with disabilities
Commuting patterns

#NYATEPFALL15
Industry & Occupation Data

#NYATEPFALL15
NYS Department of Labor• http://labor.ny.gov/stats/index.shtm • Offers projected changes in employment for: • Occupations• Industries
• Provides data related to wages, etc. • Provides labor force and unemployment data by county, LWIA, and region

#NYATEPFALL15
Employment and wages by occupation – available for regions
only Employment and wages
by industry (past and current) – available at
county, LWIA, MSA, and regional levels
Projections available statewide and for
regions

#NYATEPFALL15
Industry DataStrengths:• Current and historic data • Provided for state, regions, LWIA, and counties• Average wages assessed

#NYATEPFALL15
Industry DataLimitations:• Data provide at 3 level NAICS code – not specific• Industry employment projections provided for state and regions ONLY

#NYATEPFALL15

#NYATEPFALL15
Occupation Data• Shows detailed occupations• Breaks out employment demand between new and replacement demand• Detailed wage information• Skill requirements and typical education requirements• Categorizes occupations by future employment prospects based on growth rates and number of openings• Available for state and regions ONLY

#NYATEPFALL15

#NYATEPFALL15

#NYATEPFALL15
Labor force size, unemployment rates and numbers available by state, region, LWIA, MSA, and
county

#NYATEPFALL15
Labor force peaked in 2010
at 179,400
Currently around 166,100 – a decrease of 13,000
from peak

#NYATEPFALL15
Workforce Analysis Data Checklist
Largest industriesFastest growing industriesIndustry wagesTop occupations
WagesEducation requirements
Unemployment ratesLabor force participation
AgeIncomeEducation“Disconnected Youth”VeteransIndividuals with disabilities
Commuting patterns

#NYATEPFALL15
Demographic Data

#NYATEPFALL15
American Community Survey• Socioeconomic and demographic data – past and current• Age• Education• Income• Veteran status• Number of individuals with disabilities
http://factfinder.census.gov/faces/nav/jsf/pages/index.xhtml

#NYATEPFALL15
Search for community name

#NYATEPFALL15
Easily find data on: age, sex,
income, education,
housing costs, languages
spoken, and veterans

#NYATEPFALL15
Can’t find the information
you’re looking for? Try
“Advanced Search”
Browse topics you are
interested in

#NYATEPFALL15
Veteran Employment• Nearly 9% unemployment rate• Nearly 7% live in poverty
Labor Force Participation 75.3%Unemployment Rate 8.7%Poverty Rate 6.9%
Veterans - ACS 2009-2013 Survey

#NYATEPFALL15
Individuals with a Disability• In the US, individuals with disabilities account for about 11% of unemployed and over 25% of people not in the labor force• Only account for 5% of employed individuals
% of People with Disabilities
% of Total Population
Employed 33% 5%Unemployed 8% 11%Not in Labor Force 59% 26%
People with Disabilities

#NYATEPFALL15
Workforce Analysis Data Checklist
Largest industriesFastest growing industriesIndustry wagesTop occupations
WagesEducation requirements
Unemployment ratesLabor force participation
AgeIncomeEducation“Disconnected Youth”VeteransIndividuals with disabilities
Commuting patterns

#NYATEPFALL15
Other Demographic
Data

#NYATEPFALL15
Opportunity Index• Ranks communities based on income, education, health indicators, availability of doctors, and a variety of other factors
http://opportunityindex.org/ Strengths:• Available by county and state• Easily see how county compares• Regularly updated• Easy to view snapshot or data dashboard

#NYATEPFALL15
Opportunity Index• Ranks communities based on income, education, health indicators, availability of doctors, and a variety of other factors
Limitations:• Difficult to download (approve requests to download data on a case-by-case basis)• Cannot make custom regions

#NYATEPFALL15
Counties with high scores are in dark
blue

#NYATEPFALL15
Select to map a variety of variables

#NYATEPFALL15
• “Report Card” Style Format
• Breakdown and comparison to state and US
•Detailed economic, education, and demographic data

#NYATEPFALL15
• See how data has changed over time
• Detailed education and demographic info
• One of the only sources for “disconnected” or “idle youth”

#NYATEPFALL15
The unemployment rate in this county has decreased since 2011, however the median income has remained
stagnant and the poverty rate has
increased
The % of households spending more than 30% of income on housing costs has increased – could indicate a growing need for workforce
housing
See how data has changed
over time

#NYATEPFALL15
Workforce Analysis Data Checklist
Largest industriesFastest growing industriesIndustry wagesTop occupations
WagesEducation requirements
Unemployment ratesLabor force participation
AgeIncomeEducation“Disconnected Youth”VeteransIndividuals with disabilities
Commuting patterns

#NYATEPFALL15
Commuting Data

#NYATEPFALL15
On The Map• Provides information about commuting patterns• Reveals the kinds of jobs workers commute to or from an area for• Answer questions:• Do employers need to recruit from outside of the area for fill jobs? • Do workers need to leave your area to find suitable jobs?
http://onthemap.ces.census.gov/

#NYATEPFALL15
On The Map• Is your area a labor importer or exporter? • Saratoga exports about 24,000 more workers than it imports• About 36,000 workers live and work in Saratoga County

#NYATEPFALL15
On The Map•Most Saratoga residents commute to Albany for work• After Albany, about 11% are employed in the City of Saratoga Springs

#NYATEPFALL15
On The Map•Most Saratoga residents are employed in Saratoga Springs• Residents of Schenectady, Troy, and Glens Falls commute to Saratoga for work

#NYATEPFALL15
Workforce Analysis Data Checklist
Largest industriesFastest growing industriesIndustry wagesTop occupations
WagesEducation requirements
Unemployment ratesLabor force participation
AgeIncomeEducation“Disconnected Youth”VeteransIndividuals with disabilities
Commuting patterns

#NYATEPFALL15
Other Resources• Cornell Cooperative Extension: Demographic information and county profiles• Detailed Migration Data: University of Wisconsin• U.S. HUD: free data on all things housing•MIT Living Wage Calculator: find out what the living wage is in your community• EMSI: proprietary source for economic and workforce data (not free)

#NYATEPFALL15
Thank you!• Give Rob or Ian your business card to receive the PowerPoint by email!
• You can also find it on our blog
Questions?