data collection for the sloan digital sky survey - a network-flow
TRANSCRIPT
Chapter 34 Data Collection for the Sloan Digital Sky Survey - A Network-Flow Heuristic
Robert Lupton* F. Miller Maleyt Neal Young*
Abstract
This note describes a combinatorial optimization prob- lem arising in the Sloan Digital Sky Survey and an ef- fective heuristic for the problem that has been imple- mented and will be used in the Survey. The heuristic is based on network flow theory.
1 The Sloan Digital Sky Survey The Sloan Digital Sky Survey [is] a joint project of the Astrophysical Research Con- sortium... The go+ of the project, which is scheduled to begin m 1997 and take five years, is to make a much better map of the universe than is currently available. The volume of the universe to be surveyed will be 100 times larger than the volume of previous surveys. The number of galaxies with known distances is ex ected to increase by a factor of 100 to 1 OOf 000 galaxies and the number of quasars t; i&ease to 100,000. The Sloan Foundation... has contributed $8 million to the $18 million capital costs of the project... In order to do the survey, ARC is designing and building a special purpose 2.5 meter (loo- inch) telescope at its Apache Point Observa- tory... [The Sky Survey will proceed in two phases. In the first phase, a two-dimensional ma of the sky will be made. For the secon % phase, the] million brightest stars and the one hundred thousand brightest quasars will be selected for spectroscopic analysis from the two-dimensional map.. . [29]
To gather the spectroscopic data in the second phase, the telescope will be pointed repeatedly at
‘Astrophysics Department, Princeton University, Princeton, NJ 08540. E-mail : rhlQastro .princeton. edu.
tMathematics Department, Princeton University, Princeton, NJ 08540. Email : fmaley@haverf ord. edu.
t Computer Science Department, Dartmouth College, Hanover, NH 03755. Parts of this research were done while at: AT&T Bell Laboratories, Murray Hill, NJ 07974; the School of ORIE, Cornell University, Ithaca NY 14853 (on &a Tardos’ NSF PYI grant DDM-9157199); and the Dept’s of Astrophysics and Computer Science, Princeton University, Princeton, NJ 08540. E-mail : leal.YoungQdartmouth.edu.
the sky to take a series of “snapshots”. Each snap- shot will capture data for up to 660 galaxies (and quasars) in the circular portion of the sky visible through the telescope. For each captured galaxy, light from that galaxy will enter the telescope and travel through an optical fiber to a spectral ana- lyzer. The optical fibers (one for each galaxy) will be held in place by a “plug plate” drilled to hold the up to 660 fibers, each aligned to accept the light of its respective galaxy [7].
1.1 A Capacitated Covering Problem. A main factor determining the cost of the survey will be the number of snapshots to be taken. This paper concerns the following problem: given the desired galaxies, determine a minimum-size set of snapshots that captures them. Formally:
Given a collection of points on the unit sphere, a radius T, and a capacity c, find a small set of discs of radius T (located on the sphere) such that each given point can be assigned to a disc containing it, with no disc being assigned more than c points.
The sphere corresponds to the view-sphere centered at the telescope. The “galaxies” are the images of the actual galaxies projected on the view-sphere. Each disc represents one snapshot to be taken through the telescope; the galaxies assigned to that disc correspond to those for which data will be collected in that snapshot. The capacity c is the maximum number of galaxies for which spectral data can be gathered in a single snapshot (due to limitations in packing the optical fibers).
The problem is NP-hard [23]. However, the instances we need to solve exhibit some structure. In this paper we describe an effective heuristic algorithm for the problem that will be used in the Survey and we report some computational results.
296

DATA COLLECTION FOR THE SLOAN DIGITAL SKY SURVEY-A NETWORK-FLOW HEURISTIC 297
The basic algorithm starts with a near-uniform covering [ 151 and iteratively improves by solving a Lagrangian-relaxation of the problem that reduces to a minimum-cost flow problem, which it solves using Andrew Goldberg’s scaling min-cost flow solver [ 131.
2 Related Work
The NP-completeness of the variant when the points lie in the plane was proven by Megiddo and Supowit [23]. The proof adapts easily to our problem. The NP-completeness of the planar problem when the discs are required to be centered on the given points was proven by Marchetti- Spaccamela [21]. When the covering regions are rings, instead of discs, Maass [20] showed the problem NP-complete even if the points all lie on a single line.
Papadimitriou [27] (improving results by Fisher and Hochbaum [9]), considered the related p- medians problem in the plane, which is that of covering the given points with p discs (of arbitrary radii, but centered at p of the given points) so as to minimize the sum of the disc radii. He showed the problem NP-complete and presented average- case analyses of two heuristics, assuming the points are randomly distributed in the unit square. One of the heuristics is a uniform (“honeycomb”) cov- ering of the points by discs, which he shows gives a near-optimal solution with high probability for P =nn’forsomefixedO<c< 1.
The problem can be modelled as a capacitated set-covering problem. The well-known greedy algo- rithm of Johnson {17] and Lov&sz [IS], as modified for the capacitated case by Bar-Ilan, Kortsarz, and Peleg [3], would yield a In n-approximate solution, where n is the number of galaxies. This algorithm is not good enough in practice. In this particular set-cover problem the set system has bounded VC- dimension; in this case an improved approximation algorithm is known for the uncapacitated case [5], but’this algorithm is also unlikely to achieve a suf- ficiently good approximation [4].
Numerous generalizations of our problem have been considered under various names, including “(un)capacitated facility (or plant) location,” “p- centers”, and “minimax facility location”. These
problems have been studied under various metrics and in general graphs. In general, polynomial-time exact algorithms are known only when the number of covering regions (in our case, discs) is small (e.g., [2, L]) or when the underlying metric space (or network) is tree-like (e.g., [22, 12, 24, 14, 16, 81). Generally, these algorithms are for uncapacitated problems.
There are many works on these problems in Operations Research. Relevant books include [19, 26, 11, lo]. G enerally, this research has con- centrated on adapting integer-programming tech- niques to fairly general formulations of the prob- lem. For example, recent works on the Capacited Facility Location Problem (a generalization of our problem to arbitrary networks) include [6, 311. However, these techniques are not efficient enough for problems with hundreds of thousands of points. Quoting from the conclusion of “Approximate So- lutions to Large Scale Capacitated Facility Loca- tion Problems” (1990) [30]:
The problem of locating facilities has in- spired a rich body of literature which spans well over two decades. Numerous algorithms have been devised and succes- fully applied to problems with as many as 200 customers and 100 facilities. The computational experience on larger prob- lems, however, has been virtually non- existent... In the work leading to this pa- per, the objective was to develop a heuris- tic algorithm that can be used to generate effective solutions for large scale facility locations problems. The computational results obtained so far seem to indicate that this requirement can be met for prob- lems with as many as 1000 customers and 100 facilities.
3 The Heuristic
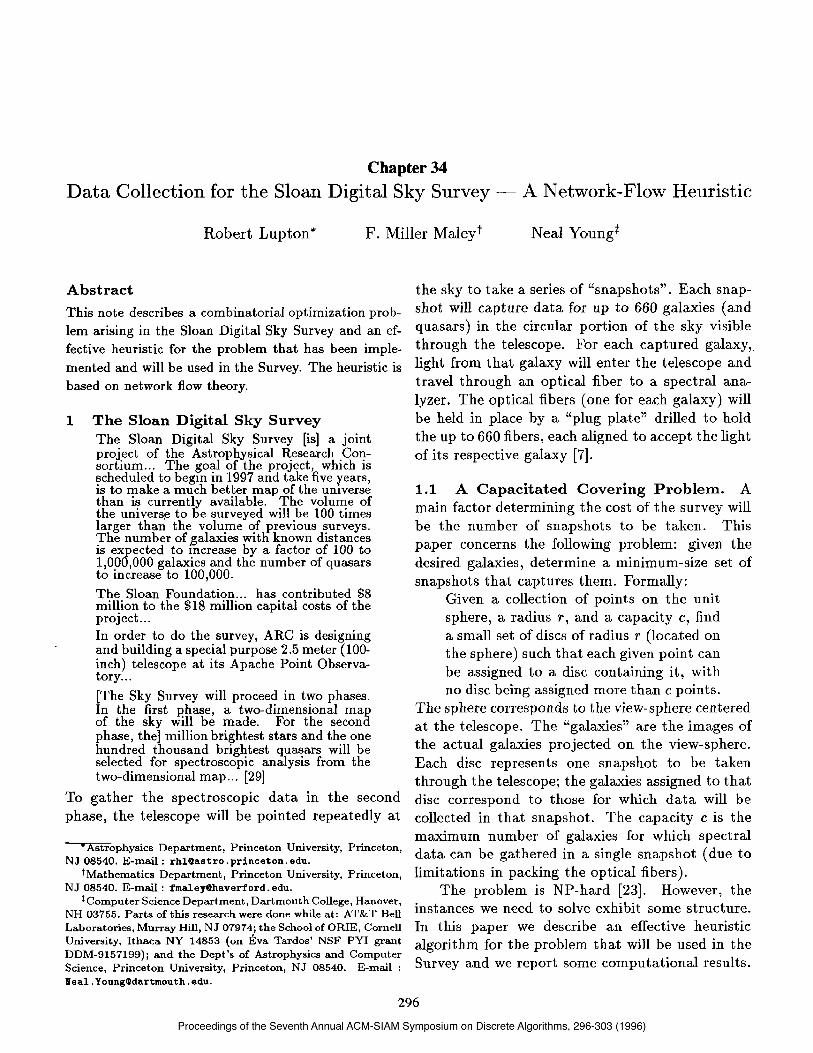
The instances arising in the Sky Survey exhibit par- ticular structure. (See the sample instance in Fig- ure 1.) Within any given region, the points are dis- tributed densely throughout the region, somewhat uniformly but with clustering tendencies and vari- ation in density. The density of the points means that virtually the entire region must be covered by
LUFTON ET AL.
Figure 1: Sample Instance Figure 2: First Relaxed Assignment
discs. The variation in density means that more discs must be concentrated within densely popu- lated regions. As a reference point, consider the sparsest possible covering of the area by discs (re- sembling a “honeycomb”). This covering provides roughly the right to&E capacity and does well in sparse areas, but in dense areas does not provide sufficient capacity. Any good solution will have to maintain a honeycomb-like structure in sparse areas while bunching discs more densely in dense areas.
The algorithm starts with a honeycomb-like covering of the region by discs with a density of discs slightly more than minimum, giving some “play”. Although the covering has as much total capacity as there are points, it is not likely to assign all points to discs because of the areas that are denser with points. The algorithm perturbs the covering to improve the coverage - moving discs towards dense areas while maintaining a regular structure in sparse areas.
For a given set of discs (with known locations), the problem of finding the maximum number of galaxies that can be assigned reduces to generalized maximum bipartite matching [28], which in turn reduces to the maximum flow problem. A clever reduction produces a flow problem of size propor- tional to the number of discs. Thus, for a given set of discs, one can efficiently find an assignment of galaxies to discs maximizing the number of galaxies
assigned subject to the capacity constraints. If the best possible assignment leaves many
points unassigned (and many discs below capacity), how can discs be moved to improve the coverage? Consider the following relaxation of the problem:
Given a set of discs, a set of galaxies, and a capacity c, find a minimum-penalty as- signment of the galaxies to discs such that no disc is assigned more than c galaxies.
Here a galaxy can be assigned to a disc not containing it: the penalty for assigning a galaxy to a disc is negligible if the galaxy is in the disc; otherwise it grows with the distance between them. The penalty of the assignment is the sum of the individual penalties.
The relaxed problem can be efficiently solved for arbitrary penalties by reducing it to the assign- ment problem or to minimum-cost maximum flow. A solution to the relaxed problem will assign all galaxies to discs, but a given disc may be assigned galaxies outside of it.
To improve a given set of discs, the algorithm solves the relaxed problem and then, for each disc, moves the disc individually to minimize the net penalty incurred by assigning its galaxies to it.
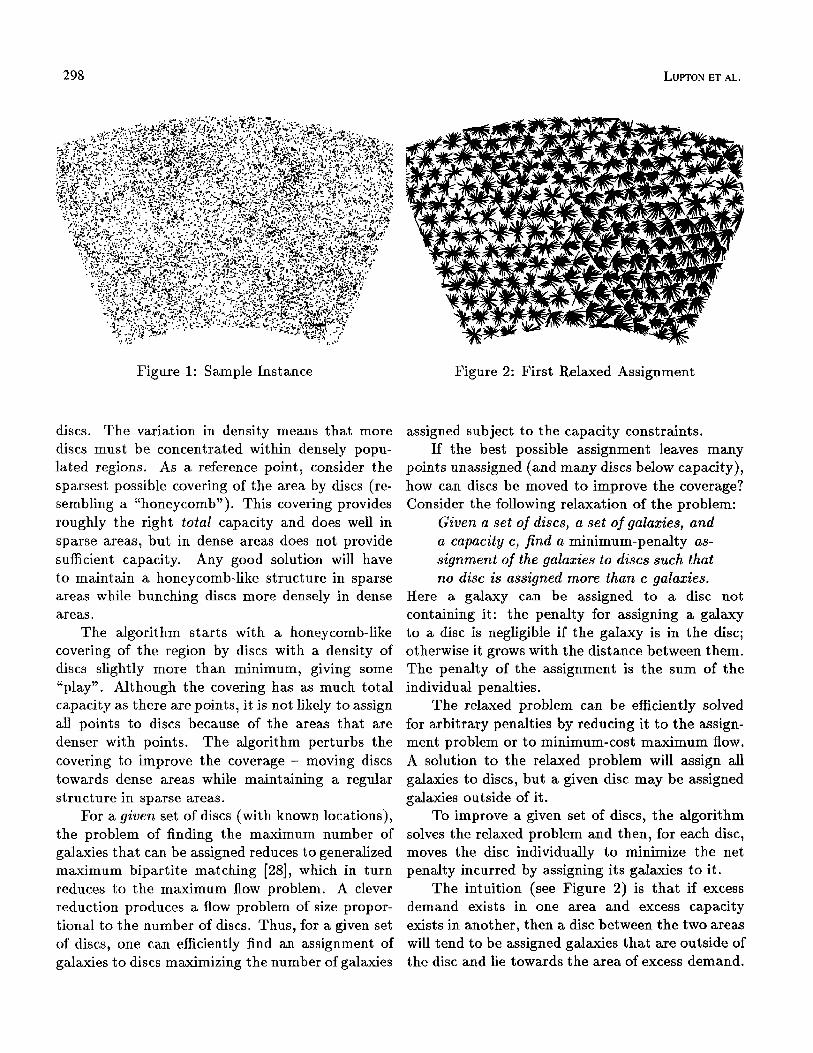
The intuition (see Figure 2) is that if excess demand exists in one area and excess capacity exists in another, then a disc between the two areas will tend to be assigned galaxies that are outside of the disc and lie towards the area of excess demand.
DATA COLLECIION FOR THE SLOAN DIGITAL SKY SURVEY-A NETWORK-FLOW HEURISTIC 299
Figure 3: Initial, Intermediate, and Final Cover- ings
When the disc is moved, it will be moved towards the area of excess demand.
Having moved the discs, the algorithm discards the assignment and starts over with the discs in the new locations. Note that each step reduces the penalty associated with the underlying assignment, so that the solution is gauranteed to converge. At this point, the algorithm finds a legal (not relaxed) assignment of galaxies to discs maximizing the number of assigned galaxies. By doing a binary search on the density of the starting cover, the algorithm finds the smallest set of discs that converges to a cover that allows sufficiently many galaxies to be assigned.
3.1 Example. The sample instance in Figure I contains 12642 points - a random %lO of the points in a subregion of the sky previously scanned. The size of this subregion is about %lO of that of
the region that will be mapped by the Survey. The initial cover of 218 discs of (appropriately scaled) capacity 60 (total capacity 13080) was sufficient to capture %Sl of the points. After 16 iterations, the perturbed cover captures %97.8 of the points. Figure 3 shows the initial near-uniform cover, a composite of the successive covers, and the final cover.
3.2 Implementation Issues. We expected the bottleneck in the algorithm to be the solution of the minimum-cost flow problem at each iteration. To minimize this time, the algorithms reduces the size of the min-cost flow problem as follows. First, it only considers assigning each galaxy to a few of its closest discs. Second, it rounds the costs to reduce the number of distinct costs and then, instead of having demand vertices for individual galaxies, it builds demand vertices for equivalance classes of galaxies, where two galaxies are equivalent if they have the same assignable discs with the same rounded penalties.
Once it solves the relaxed problem in a given it- eration, it moves each disc using a simple gradient- descent method.
For the initial near-uniform covers, we used Hardin, Sloane, and Smith’s sphere covers [15]. We implemented the algorithm in C++ using LEDA [25] and Andrew Goldberg’s scaling min-cost flow solver [13].
4 Computational Results We tested the running time and the quality of the solutions found by the algorithm on some sample instances. In this Section we describe the results.
The Survey will map roughly %25 of the sky - the region having right ascension zero through 360 degrees and declination 30 degrees through 90 degrees. Roughly one million galaxies will be mapped. Because the two phases of the Survey will be pipelined (the second will be started before the first is done), the second phase will be.done in pieces.
We tested the algorithm on data from a region of the sky that had been scanned for a different purpose. The region has right ascension -45 degrees to 74 degrees and declination -62 degrees
h’TON ET AL.
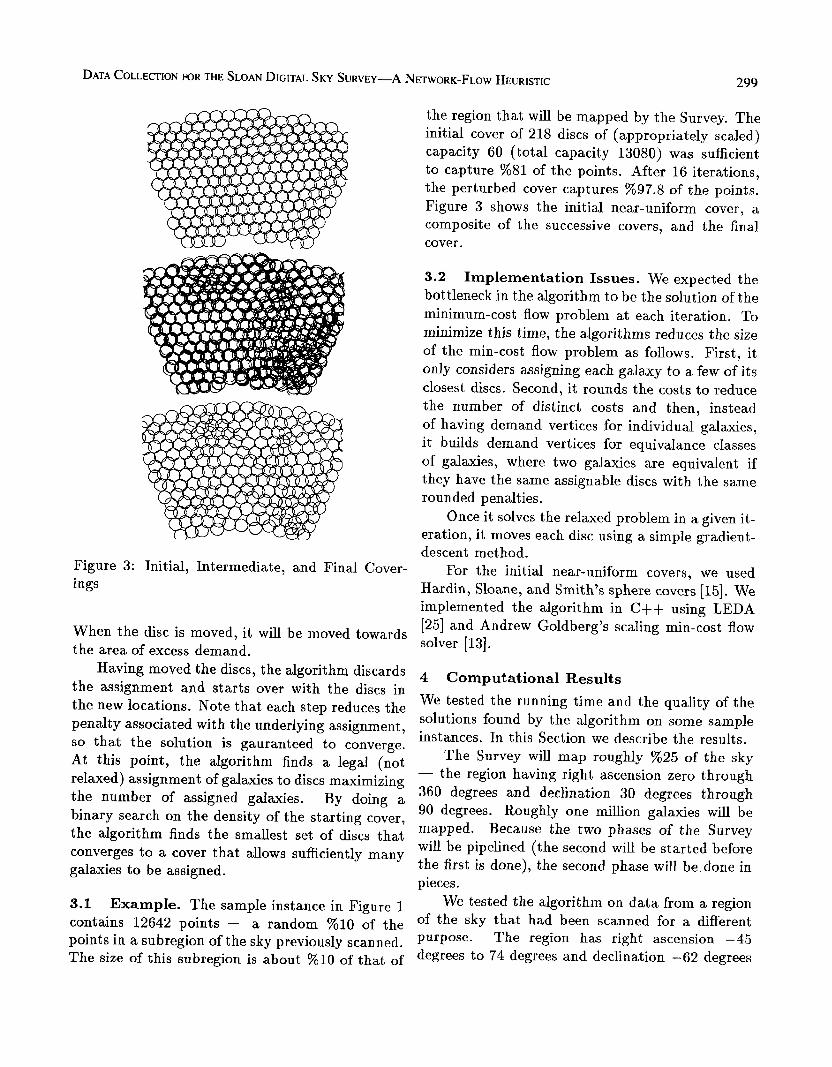
Figure 4: Number of discs needed to achieve a %98 coverage using algorithm or using a near-uniform covering, normalized by capacity lower bound.
to -24 degrees, giving it an area of roughly %7.8 of the entire sky. It contains about 300,000 galaxies.
We ran the algorithm on various subregions of this region. The whole region was one such sub- region, this region was divided in half “vertically” and “horizontally” to obtain four more subregions, each of those subregions was similarly split. For each of these 21 subregion we randomly sampled %5,%10, %20, %35, and %60 of the galaxies in the subregion to obtain 105 “thinned” subregions. For each thinned subregion, we used the algorithm (doing a binary search to find the sparsest good starting cover) to find a cover that (with disc ca- pacity scaled corresponding to the thinning of the subregion) would allow %98 of the galaxies to be assigned. For comparison, we also computed the sparsest near-uniform cover that would allow %98 of the galaxies to be assigned.
For reasons discussed below, we didn’t run the algorithm to completion on the two subregions with the most galaxies (the whole region sampled at %35 and %60).
4.1 Quality of solutions. Figure 4 shows the quality of solutions returned by the algorithm on the subregions. The figure plots the number of discs the algorithm needed to assign %98 of the galaxies in each region, divided by the number of discs needed just to provide capacity to hold %98 of
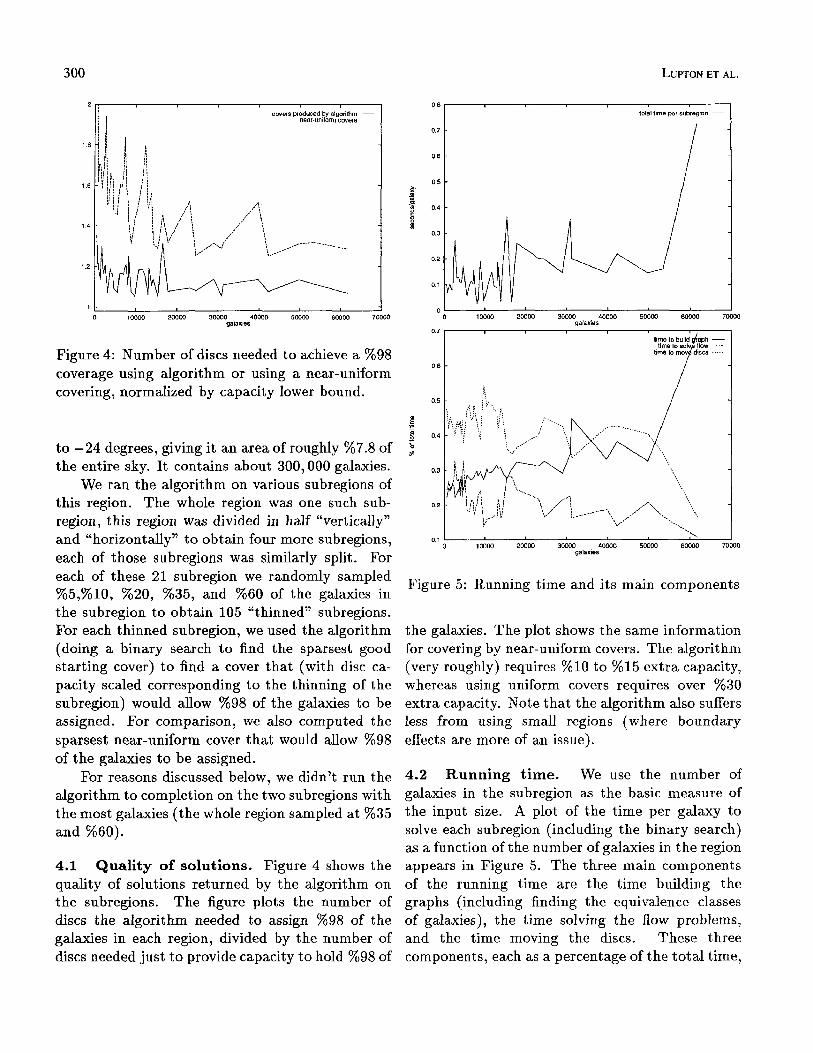
Figure 5: Running time and its main components
the galaxies. The plot shows the same information for covering by near-uniform covers. The algorithm (very roughly) requires %lO to %15 extra capacity, whereas using uniform covers requires over %30 extra capacity. Note that the algorithm also suffers less from using small regions (where boundary effects are more of an issue).
4.2 Running time. We use the number of galaxies in the subregion as the basic measure of the input size. A plot of the time per galaxy to solve each subregion (including the binary search) as a function of the number of galaxies in the region appears in Figure 5. The three main components of the running time are the time building the graphs (including finding the equivalence classes of galaxies), the time solving the flow problems, and the time moving the discs. These three components, each as a percentage of the total time,
DATA COLLECTION FOR THE SLOAN DIGITAL SKY SURVEY-A NETWORK-FLOW HEURISTIC 301
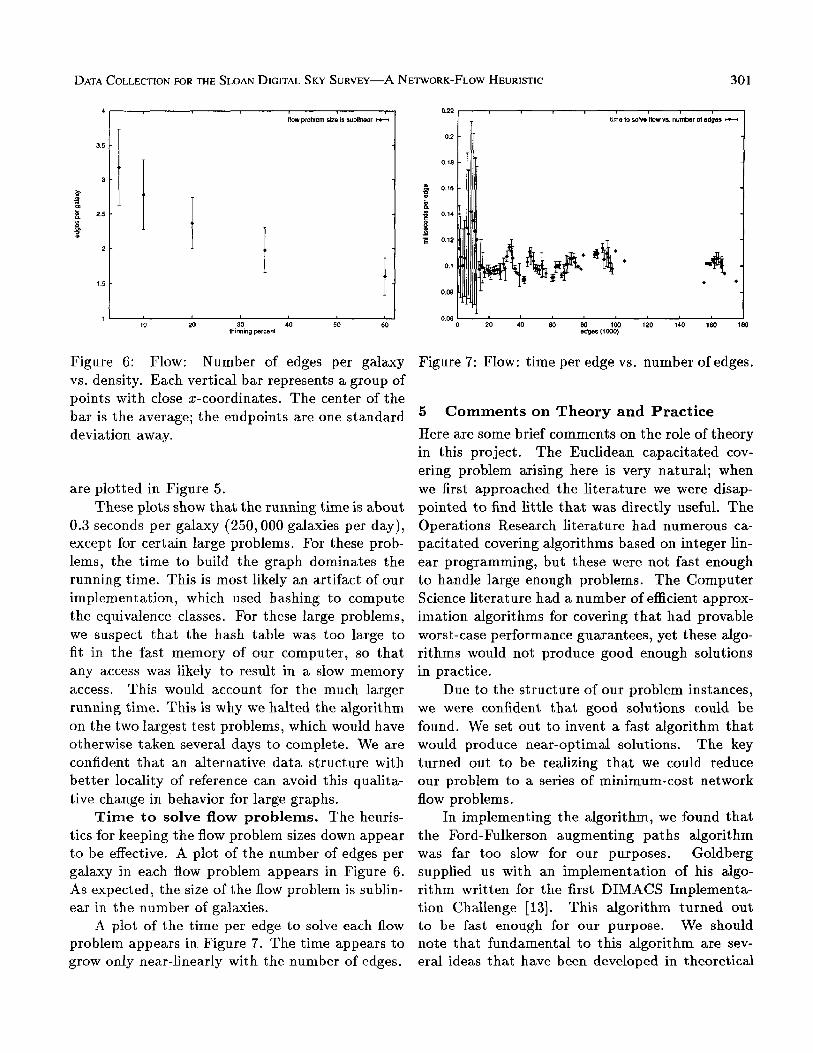
Figure 6: Flow: Number of edges per galaxy vs. density. Each vertical bar represents a group of points with close x-coordinates. The center of the bar is the average; the endpoints are one standard deviation away.
are plotted in Figure 5. These plots show that the running time is about
0.3 seconds per galaxy (250,000 galaxies per day), except for certain large problems. For these prob- lems, the time to build the graph dominates the running time. This is most likely an artifact of our implementation, which used hashing to compute the equivalence classes. For these large problems, we suspect that the hash table was too large to fit in the fast memory of our computer, so that any access was likely to result in a slow memory access. This would account for the much larger running time. This is why we halted the algorithm on the two largest test problems, which would have otherwise taken several days to complete. We are confident that an alternative data structure with better locality of reference can avoid this qualita- tive change in behavior for large graphs.
Time to solve flow problems. The heuris- tics for keeping the flow problem sizes down appear to be effective. A plot of the number of edges per galaxy in each flow problem appears in Figure 6. As expected, the size of the flow problem is sublin- ear in the number of galaxies.
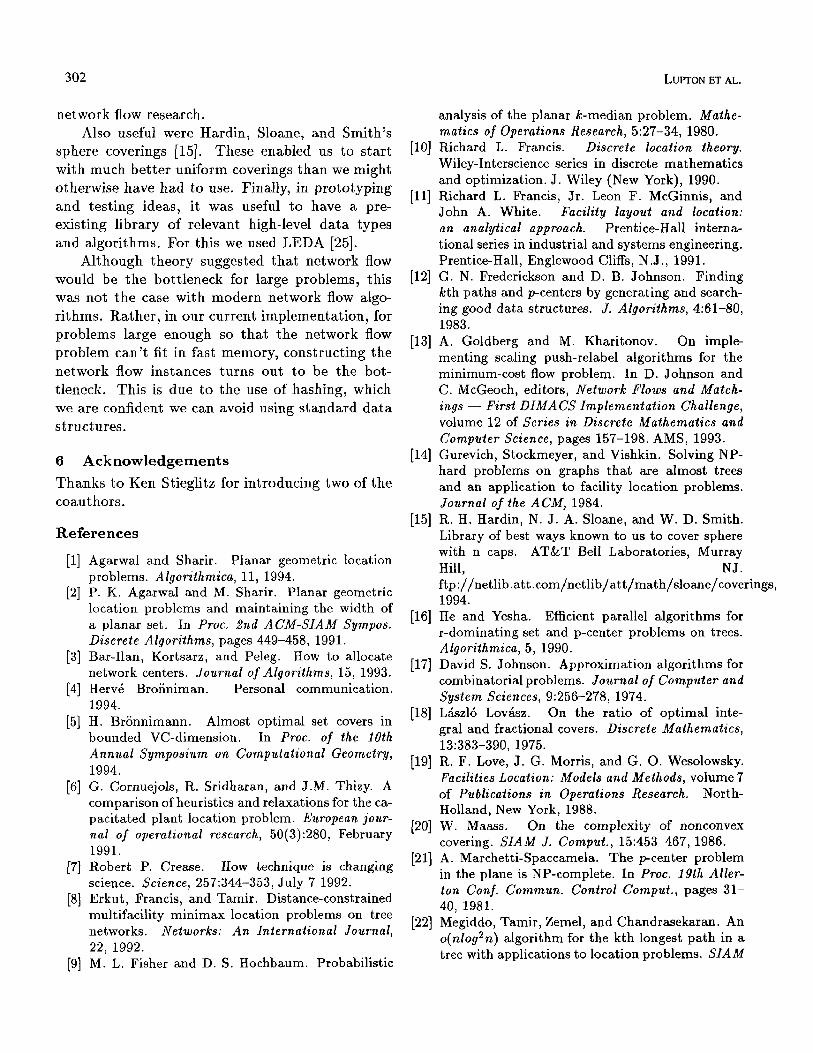
A plot of the time per edge to solve each flow problem appears in Figure 7. The time appears to grow only near-linearly with the number of edges.
Figure 7: Flow: time per edge vs. number of edges.
5 Comments on Theory and Practice Bere are some brief comments on the role of theory in this project. The Euclidean capacitated cov- ering problem arising here is very natural; when we first approached the literature we were disap- pointed to find little that was directly useful. The Operations Research literature had numerous ca- pacitated covering algorithms based on integer lin- ear programming, but these were not fast enough to handle large enough problems. The Computer Science literature had a number of efficient approx- imation algorithms for covering that had provable worst-case performance guarantees, yet these algo- rithms would not produce good enough solutions in practice.
Due to the structure of our problem instances, we were confident that good solutions could be found. We set out to invent a fast algorithm that would produce near-optimal solutions. The key turned out to be realizing that we could reduce our problem to a series of minimum-cost network flow problems.
In implementing the algorithm, we found that the Ford-Fulkerson augmenting paths algorithm was far too slow for our purposes. Goldberg supplied us with an implementation of his algo- rithm written for the first DIMACS Implementa- tion Challenge [13]. This algorithm turned out to be fast enough for our purpose. We should note that fundamental to this algorithm are sev- eral ideas that have been developed in theoretical
302
network flow research. Also useful were Hardin, Sloane, and Smith’s
sphere coverings [15]. These enabled us to start with much better uniform coverings than we might otherwise have had to use. Finally, in prototyping and testing ideas, it was useful to have a pre- existing library of relevant high-level data types and algorithms. For this we used LEDA [25].
Although theory suggested that network flow would be the bottleneck for large problems, this was not the case with modern network flow algo- rithms. Rather, in our current implementation, for problems large enough so that the network flow problem can’t fit in fast memory, constructing the network flow instances turns out to be the bot- tleneck. This is due to the use of hashing, which we are confident we can avoid using standard data structures.
6 Acknowledgements Thanks to Ken Stieglitz for introducing two of the coauthors.
References
PI PI
PI 141 [51
Agarwal and Sharir. Planar geometric location problems. Algorithmica, 11, 1994. P. K. Agarwal and M. Sharir. Planar geometric location problems and maintaining the width of a planar set. In Proc. 2nd ACM-SIAM Sympos. Discrete Algorithms, pages 449-458, 1991. Bar-Ilan, Kortsarz, and Peleg. How to allocate network centers. Journal of Algorithms, 15, 1993. Her& Broiiniman. Personal communication. 1994. H. Bronnimann. Almost optimal set covers in bounded VC-dimension. In Proc. of the 10th Annual Symposium on Computational Geometry, 1994.
161
[71
PI
G. Cornuejols, R. Sridharan, and J.M. Thizy. A comparison of heuristics and relaxations for the ca- pacitated plant location problem. European jour- nal of operational research, 50(3):280, February 1991. Robert P. Crease. How technique is changing science. Science, 257:344-353, July 7 1992. Erkut, Francis, and Tamir. Distance-constrained multifacility minimax location problems on tree networks. Networks: An International Journal, 22, 1992.
PI M. L. Fisher and D. S. Hochbaum. Probabilistic
PO1
PI
PI
P31
PI
P51
WI
P71
P31
WI
PO1 PI
WI
LUF’TON ET AL.
analysis of the planar k-median problem. Mathe- matics of Operations Research, 5127-34, 1980. Richard L. Francis. Discrete location theory. Wiley-Interscience series in discrete mathematics and optimization. J. Wiley (New York), 1990. Richard L. Francis, Jr. Leon F. McGinnis, and John A. White. Facility layout and location: an analytical approach. Prentice-Hall interna- tional series in industrial and systems engineering. Prentice-Hall, Englewood Cliffs, N.J., 1991. G. N. Frederickson and D. B. Johnson. Finding kth paths and p-centers by generating and search- ing good data structures. J. Algorithms, 4:61-80, 1983. A. Goldberg and M. Kharitonov. On imple- menting scaling push-relabel algorithms for the minimum-cost flow problem. In D. Johnson and C. McGeoch, editors, Network Flows and Match- ings - First DIMACS Implementation Challenge, volume 12 of Series in Discrete Mathematics and Computer Science, pages 157-198. AMS, 1993. Gurevich, Stockmeyer, and Vishkin. Solving NP- hard problems on graphs that are almost trees and an application to facility location problems. Journal of the ACM, 1984. R. H. Hardin, N. J. A. Sloane, and W. D. Smith. Library of best ways known to us to cover sphere with n caps. AT&T Bell Laboratories, Murray Hill, NJ. ftp://netlib.att.com/netlib/att/math/sloane/coverings, 1994. He and Yesha. Efficient parallel algorithms for r-dominating set and p-center problems on trees. Algorithmica, 5, 1990. David S. Johnson. Approximation algorithms for combinatorial problems. Journal of Computer and System Sciences, 91256-278, 1974. L&z16 Lo&z. On the ratio of optimal inte- gral and fractional covers. Discrete Mathematics, 13:383-390, 1975. R. F. Love, J. G. Morris, and G. 0. Wesolowsky. Facilities Location: Models and Methods, volume 7 of Publications in Operations Research. North- Holland, New York, 1988. W. Maass. On the complexity of nonconvex covering. SIAM J. Cornput., 15:453-467, 1986. A. Marchetti-Spaccamela. The p-center problem in the plane is NP-complete. In Proc. 19th Aller- ton Conf. Commun. Control Comput., pages 31- 40, 1981. Megiddo, Tamir, Zemel, and Chandrasekaran. An o(nlog2n) algorithm for the kth longest path in a tree with applications to location problems. SIAM

DATA COLLECTION FOR THE SLOAN DIGITAL SKY SURVEY-A NETWORK-FLOW HEURISTIC
Journal on Computing, 1981. [23] N. Megiddo and K. J. Supowit. On the complexity
of some common geometric location problems. SIAM J. Comput., 13:182-196, 1984.
[24] N. Megiddo and A. Tamir. New results on the complexity of pcenter problems. SIAM J. Com- put., 12:751-758, 1983.
[25] K. Melhorn and S. N&her. LEDA - a platform for combinatorial and geometric computing. See ftp://ftp.mpi-sb.mpg.de/pub/LEDA/leda.html.
[26] G. L. Nemhauser and L. A. Wolsey. Integer and Combinatorial Optimization. John Wiley & Sons, New York, 1988.
[27] C. H. Papadimitriou. Worst-case and probabilistic analysis of a geometric location problem. SIAM J. Comput., 10:542-557, 1981.
[28] C. H. Papadimitriou and K. Steiglitz. Combina- torial Optimization: Algorithms and Complexity. Prentice-Hall, Englewood Cliffs, NJ, 1982.
[29] Jacquelyn Savani. Sky survey receives $5 million from NSF. Princeton Weekly Bulletin, November 1994.
[30] Bala Shetty. Approximate solutions to large scale capacitated facility location problems. Applied mathematics and computation, 39(2):159, Septem- ber 1990.
[31] R. Sridharan. A lagrangian heuristic for the capac- itated plant location problem with single source constraints. European journal of operational re- search, 66(3):305, May 1993.
303