data collection and performance analysis report newborn ... · for a number of rare but serious...
TRANSCRIPT
Newborn Blood Spot
Data Collection and Performance Analysis Report Newborn Blood Spot Screening in the UK 2013-14
Version 1.0 / August 2015

Data Collection and Performance Analysis Report: Newborn Blood Spot Screening in the UK 2013-14
2
About the NHS Newborn Blood Spot
Screening Programme
The NHS Newborn Blood Spot (NBS) Screening Programme screens newborn babies
for a number of rare but serious conditions: sickle cell disease (SCD), cystic fibrosis
(CF), congenital hypothyroidism (CHT) and six inherited metabolic diseases:
phenylketonuria (PKU), medium-chain acyl-CoA dehydrogenase deficiency (MCADD),
maple syrup urine disease (MSUD), isovaleric acidaemia (IVA), glutaric aciduria type 1
(GA1) and homocystinuria (pyridoxine unresponsive) (HCU).
Public Health England (PHE) is responsible for the NHS Screening Programmes. PHE
is an executive agency of the Department of Health and works to protect and improve
the nation's health and wellbeing, and reduce health inequalities.
NHS Newborn Blood Spot Screening Programme Floor 2, Zone B Skipton House 80 London Road London SE1 6LH Tel: +44 (0)20 3682 0890 Twitter: @PHE_Screening www.gov.uk/topic/population-screening-programmes/newborn-blood-spot www.gov.uk/phe
Prepared by: Tessa Morgan and Lucy Pylypiw
For queries relating to this document, contact: [email protected]
© Crown Copyright 2015
You may re-use this information (excluding logos) free of charge in any format or
medium, under the terms of the Open Government Licence v2.0. To view this licence,
visit OGL or email [email protected].
Where we have identified any third party copyright information you will need to obtain
permission from the copyright holders concerned.
Published August 2015 PHE publications gateway number: 2015253

Data Collection and Performance Analysis Report: Newborn Blood Spot Screening in the UK 2013-14
3
Contents
Abbreviations
4
Executive summary
5
1. Introduction
1.1 Background
1.2 The screening standards (2013)
1.3 Methodology
7
8
9
10
2. Analysis and report of screening performance
11
2.1 Laboratory denominator statistics
2.2 Standard 1a: Completeness of coverage (CCG responsibility at birth)
2.3 Standard 1b: Completeness of coverage (movers in)
2.4 Standard 2. Timely identification of babies with a null or incomplete
result recorded on the child health information system
2.5 Standard 3. Baby’s NHS number (or UK equivalent) is included on the
blood spot card
2.6 Standard 4. Timely sample collection
2.7 Standard 5. Timely receipt of a sample in the newborn screening
laboratory
2.8 Standard 6. Quality of the blood spot sample
2.9 Standard 7: Timely taking of a repeat blood spot sample
2.10 Standard 9: Timely processing of all PKU, CHT and MCADD screen
positive samples
2.11 Standard 11: Timely receipt into clinical care
11
14
16
22
24
28
30
32
34
35
36
3. Conclusion
58
4. Resources 59
Data Collection and Performance Analysis Report: Newborn Blood Spot Screening in the UK 2013-14
4
Abbreviations
CCG clinical commissioning group
CF cystic fibrosis
CF SPID cystic fibrosis screen positive, inconclusive diagnosis (equivocal)
CFTR cystic fibrosis transmembrane conductance regulator
CHIS child health information system
CHRD child health records department
CHS child health service
CHT congenital hypothyroidism
CPA Clinical Pathology Accreditation
DAQA Data Analyst and Quality Assurance
GA1 glutaric aciduria type 1
GOSH Great Ormond Street Hospital
HB health board
HCU homocystinuria
IVA isovaleric acidaemia
KPI key performance indicator
MCADD medium-chain acyl-CoA dehydrogenase deficiency
MSUD maple syrup urine disease
NHS National Health Service
PKU phenylketonuria
RRTG Routine Reporting Task Group
SCD sickle cell disease
SE Thames South East Thames (St. Thomas’ Hospital)
SW Thames South West Thames (St Helier Hospital)
SQAS Screening Quality Assurance Service
TSH thyroid stimulating hormone
UK NSC UK National Screening Committee

Data Collection and Performance Analysis Report: Newborn Blood Spot Screening in the UK 2013-14
5
Executive summary
This is the tenth annual data report for the UK’s newborn blood spot screening programmes.
The aim of this report is to feedback performance against the national standards.
Coverage
The Office of National Statistics reported a drop in the birth rate of 4.3% in 2013. This is
reflected in the decrease in the number of babies tested 2013-14 compared to previous years.
Every region reached the acceptable level (95%) for completeness of coverage (CCG
responsibility at birth). However, when timeliness of coverage is measured at 17 days, not all
regions met the achievable level.
Standard 1b introduces an effective timeframe of 21 calendar days for movers in and this data
collection was piloted during 2013-14. Although many areas were unable to report due to IT
system limitations, this data will be collected from 2014-15.
Declined screening
Decline rates for newborn blood spot screening vary between local areas. Overall, there has
been a rise in the rate of declines per 10,000 babies from 5.12 in 2010-11 to 7.93 in 2013-14
(CCG responsibility at birth population).
If a child moves into an area in England with no record of being tested they are offered
screening up to one year of age. Babies may have been screened in another country but have
no evidence of the results. This accounts for a higher decline rate among movers in.
The blood spot screening programme aims to investigate the root cause for higher levels of
declines in 2015-16.
NHS number and barcoded label
Data show an overall increase in the use of the NHS number from 2007 to 2014. Overall, the
percentage of samples including a barcoded NHS number label has increased year on year
since 2010-11; however, no laboratory reported reaching the achievable standard (95% of
blood spot cards received by a laboratory have the baby’s NHS number included on a
barcoded label).
Timeliness of sample taking and despatch
Maternity services sending their samples to English laboratories met the core standard of 95%
or more for first samples taken on days 5-8. Although the percentage of samples received in
the laboratory after five working days of blood samples being taken has decreased over the
last eight years, there are still some local issues reported where transport is a concern.

Data Collection and Performance Analysis Report: Newborn Blood Spot Screening in the UK 2013-14
6
Blood spot quality
It has been recognised that there is regional variation in laboratory definitions of an unsuitable
sample, causing inequality in rejection of samples. New evidence-based blood spot quality
guidelines for the English screening laboratories were implemented in April 2015 with the aim
of improving quality of samples and, in turn, the efficiency of the screening pathway.
Failsafe
Stage 1 of the Newborn Blood Spot Failsafe Solution (NBSFS) is now fully implemented across
all English providers of maternity services. This means all babies born in England will be
identified if they have not been screened. In future, the NBSFS will capture timely taking of a
repeat blood spot sample; therefore data on standard 7 (timely taking of a repeat blood spot
sample) will be available.
Conditions
The maximum age at appointment for PKU was 22 days for England and 10 days for Northern
Ireland (excluding two babies who moved into the country after birth and were tested late).
Variation persists in compliance with the national borderline cut off level for CHT. In England,
an additional 828 babies had a borderline result on the first sample due to lower cut off levels
in six laboratories.
Incomplete outcome data for MCADD made it difficult to populate the screening and diagnostic
algorithm (Figure 24). Data on age at first appointment is outstanding for some babies in
England, and there are still babies not meeting the 17 day appointment standard in England
and Scotland.
The CF screening protocols are performing appropriately and numbers of babies with CF
suspected and CF carrier results have been consistent over the last five years.
Data on SCD is available in the NHS Sickle Cell and Thalassaemia Screening Programme’s
annual report at www.gov.uk/government/publications/sickle-cell-and-thalassaemia-screening-
data-trends-and-performance-analysis.

Data Collection and Performance Analysis Report: Newborn Blood Spot Screening in the UK 2013-14
7
1. Introduction
One of the objectives of the NHS Newborn Blood Spot Screening Programme (previously the
UK Newborn Screening Programme Centre) is to set national standards for newborn blood
spot screening. National standards are important to support the delivery and quality
assurance of a high quality screening programme and are used by local commissioners and
quality improvement groups. The aims of this report are to feedback the performance against
the national standards, to share lessons learned from incidents, and to highlight:
Completeness and accuracy of data returns
Where improvements have been made
Where standards are not being achieved and where there is variability in practice
Risks to the newborn blood spot screening programme
Key recommendations for quality improvements in newborn blood spot screening
Progress on quality improvement projects
Providers, commissioners and the Screening Quality Assurance Service (SQAS) are
encouraged to review this document to identify areas for improvement locally.

Data Collection and Performance Analysis Report: Newborn Blood Spot Screening in the UK 2013-14
8
1.1 Background
The UK National Screening Committee (UK NSC) recommends that all babies in the
UK are offered screening for nine rare disorders: sickle cell disease (SCD), cystic
fibrosis (CF), congenital hypothyroidism (CHT), phenylketonuria (PKU), medium-chain
acyl-CoA dehydrogenase deficiency (MCADD), maple syrup urine disease (MSUD),
isovaleric acidaemia (IVA), glutaric aciduria type 1 (GA1) and homocystinuria
(pyridoxine unresponsive) (HCU).
All four UK countries screen for SCD, CF, CHT, PKU and MCADD, and England and
Wales began screening for MSUD, IVA, GA1 and HCU in January 2015. This update
presents 2013-14 data on SCD, CF, CHT, PKU and MCADD only.
Table 1. Incidence of each condition in the UK
Conditions
Incidence based on
research prior to the
introduction of the
national screening
programmes
Incidence of screen positive
cases based on 5 years of
UK screening data 2008-14
Sickle cell disease (SCD) 1:2,000 1:2,000
Cystic fibrosis (CF) 1:2,500 1:2,500
Congenital hypothyroidism (CHT) 1:3,000 1:1,500
Phenylketonuria (PKU) 1:10,000 1:8,000
Medium-chain acyl-CoA dehydrogenase
deficiency (MCADD) 1:10,000 1:9,800
The overall goal is to prevent ill health, disability and death through early diagnosis and
effective intervention. Population coverage is a key objective of the programme.
Note that a significant proportion of screen positive cases will not be confirmed cases.

Data Collection and Performance Analysis Report: Newborn Blood Spot Screening in the UK 2013-14
9
1.2 The screening standards (2013)
Standard Reporting responsibility
Standard 1a: Completeness of coverage (CCG
responsibility at birth)
Reported by child health records department (CHRD)
Standard 1b: Completeness of coverage (movers
in)
Reported by CHRD
Standard 2: Timely identification of babies with a
null or incomplete result recorded on the child
health information system
Reported by CHRD
Standard 3: Baby’s NHS number (or UK equivalent)
is included on the blood spot card
Reported by newborn screening laboratory
Standard 4: Timely sample collection Reported by newborn screening laboratory
Standard 5: Timely receipt of a sample in the
newborn screening laboratory
Reported by newborn screening laboratory
Standard 6: Quality of the blood spot sample Reported by newborn screening laboratory
Standard 7: Timely taking of a repeat blood spot
sample
Not currently collected
Standard 8: CPA (screening) Not included
Standard 9: Timely processing of all PKU, CHT and
MCADD screen positive samples
Reported by newborn screening laboratory
Standard 10: CPA (diagnosis) Not included
Standard 11: Timely receipt into clinical care Reported by newborn screening laboratory
Standard 12: Timeliness of results to parents Currently reported through key performance
indicators (KPIs) to the UK NSC. Will be included
from 2015-16
For more information on these standards please see:
www.gov.uk/government/collections/newborn-blood-spot-screening-programme-standards-
and-data.

Data Collection and Performance Analysis Report: Newborn Blood Spot Screening in the UK 2013-14
10
1.3 Methodology
The data collection and performance analysis dictionary is the definitive tool to guide data
collection and provides definitions of the terms used and of data to be collected. Data are
collected using Microsoft Excel spreadsheets; these documents are accessible from
www.gov.uk/government/collections/newborn-blood-spot-screening-programme-standards-
and-data. The spreadsheets must be downloaded, completed and returned to the NHS
Newborn Blood Spot Screening Programme by email.
With the intention of improving clarity of definitions, completeness and accuracy of data, and to
keep up to date with changes in the programme, the definitions, methods and tools are
reviewed annually and amended if required. This review is undertaken in collaboration with our
stakeholders and was part of the UK NSC Routine Reporting Task Group (RRTG). The RRTG
has now been replaced with the Data Analyst and Quality Assurance (DAQA) group which
meets monthly to monitor all data-related issues for the screening programmes.
Data are collected annually for the previous fiscal year. Aggregate data are collected to
measure performance against the standards; data is grouped by CCG/CHS/HB or laboratory
catchment area.
Diagnostic outcome data are also returned by the laboratories. These data are collected at
individual baby level and are anonymous. Newborn screening laboratories inform the
designated paediatrician directly when a baby is suspected of having one of the conditions and
request diagnostic outcome data on each baby. The laboratories hold the information on
screen positive babies within their catchment area and are the logical place to capture follow-
up and outcome data. Laboratories experience various difficulties in collecting this data, and as
a result information is not always complete. This gap in the data means that the newborn blood
spot programme cannot be evaluated fully.

Data Collection and Performance Analysis Report: Newborn Blood Spot Screening in the UK 2013-14
11
2. Analysis and report of screening
performance
2.1 Laboratory denominator statistics
Table 2. Conditions tested during 2013-14 or date of implementation
Country PKU, CHT and CF SCD MCADD
England
Northern Ireland
Scotland
Wales June 2013
2.1.1 Number of babies tested for each condition
Table 3. Number of babies tested and number of screen positive results for each
condition 2013-14
Laboratory
Num
ber
of
bab
ies
teste
d f
or
PK
U
Num
ber
of scre
en
positiv
es fo
r P
KU
Num
ber
of
bab
ies
teste
d f
or
CH
T
Num
ber
of scre
en
positiv
es fo
r C
HT
Num
ber
of
bab
ies
teste
d f
or
CF
Num
ber
of scre
en
positiv
es fo
r C
F
Num
ber
of
bab
ies
teste
d f
or
MC
AD
D
Num
ber
of scre
en
positiv
es for
MC
AD
D
Num
ber
of
bab
ies
teste
d f
or
SC
D
Num
ber
of scre
en
positiv
es for
SC
D
Bristol 41,041 5 41,041 18 41,041 20 41,041 3 41,009 4
Cambridge 27,675 3 27,675 16 27,675 13 27,675 5 27,675 0
GOSH 122,157 5 122,157 153 122,157 32 122,157 10 119,911 99
Leeds 44,582 2 44,582 35 44,582 16 44,582 9 42,885 9
Liverpool 29,370 3 29,370 31 28,148 18 28,148 4 27,827 6
Manchester 55,800 9 55,800 37 55,603 21 55,800 5 55,640 13
Newcastle 33,801 3 33,801 28 33,801 18 33,801 5 34,067 2
Oxford 28,470 2 28,470 18 28,324 8 28,470 4 28,257 17
Portsmouth 37,845 2 37,750 26 37,190 13 37,846 3 37,189 5
SE Thames 56,706 5 56,706 33 56,728 10 56,706 3 56,706 86
Sheffield 72,807 7 72,807 44 72,797 26 72,807 9 72,807 20
SW
Thames 51,922 3 51,922 17 51,922 18 51,922 4 52,992 38

Data Collection and Performance Analysis Report: Newborn Blood Spot Screening in the UK 2013-14
12
West
Midlands 71,152 5 71,152 60 71,152 25 71,152 5 71,152 20
England 673,328 54 673,233 516 671,120 238 672,107 69 668,117 319
Northern
Ireland 24,345 7 24,345 21 24,241 15 24,345 5 24,322 1
Scotland 56,261 9 56,260 26 56,722 23 58,850 2 56,256 14
Wales 33,859 2 33,859 24 33,663 3 33,859 5 27,828 3
UK Total 787,793 72 787,697 587 785,746 279 789,161 81 776,523 337
We would normally expect to see a lower number of babies tested for CF as samples taken
when a baby is aged 8 weeks or more should not be tested for this condition.
Figure 1. Number of UK babies reported as screened for each condition 2005-14
Prior to 2007-8 only England, Northern Ireland and Wales returned data on numbers of babies
screened for each condition. Scotland first returned data in 2008-9 and full UK data for all
laboratories has been returned since 2008-9. This accounts for the large increase in numbers
tested between 2005 and 2008. In addition, the staggered implementation and rollout of new
screening tests described in Table 2 affect the rates shown in Figure 2.
The Office of National Statistics reported a drop in birth rate of 4.3% in 2013 which is reflected
in the decrease in number of babies tested 2013-14 compared to previous years.
0
100,000
200,000
300,000
400,000
500,000
600,000
700,000
800,000
900,000
PKU CHT CF MCADD SCD
2005-6 2006-7 2007-8 2008-9 2009-10 2010-11 2011-12 2012-13 2013-14

Data Collection and Performance Analysis Report: Newborn Blood Spot Screening in the UK 2013-14
13
Figure 2. Rate of UK babies screened positive for each condition 2005-14 (per ten
thousand)
0
1
2
3
4
5
6
7
8
9
PKU CHT CF MCADD SCD
2005-6 2006-7 2007-8 2008-9 2009-10 2010-11 2011-12 2012-13 2013-14

Data Collection and Performance Analysis Report: Newborn Blood Spot Screening in the UK 2013-14
14
2.2 Standard 1a: Completeness of coverage (CCG responsibility at birth)
Description
The proportion of babies for whom the CCG/CHS area is responsible, at birth and at the time
of the report, who are eligible for newborn blood spot screening and have a conclusive test
result recorded on the CHIS for PKU, CHT, SCD, CF and MCADD by 17 days of age.
Acceptable level: ≥ 95.0% all tests
Achievable level: ≥ 99.9% PKU, MCADD, SCD
Achievable level: ≥ 98% CF, CHT
Coverage is measured at the time of the report (there is a two month period allowed for data
return) and at 17 days of age. CCGs that did not return data on percentage tested by 17 days
are excluded.
Table 4. Completeness of coverage for PKU, in babies for whom the CCG/CHS area was
responsible for at birth and at the time of the report 2013-14
Region/
country
Regional total
number of babies
the CCG/country
is responsible for
at birth and
remain
responsible for
on the last day of
the reporting
period
Number of
babies tested
(status codes
04,05,06,07,08,
10)
Number of
babies
tested and
recorded
on the
child
health
system at
17 days
% of babies tested
(status codes
04,05,06,07,08,10)
% of babies
tested and
recorded on
the child
health
system at 17
days
East of
England 57,796 56,979 56,408 98.60% 97.60%
East Midlands 47,461 47,246 40,497 99.50% 85.30%
London 98,291 96,413 93,874 98.10% 95.50%
North East 26,967 26,960 26,293 97.97% 97.50%
North West 62,772 62,622 60,588 99.80% 96.50%
South East 97,205 96,641 93,803 99.40% 96.50%
South West 53,688 53,357 49,017 99.40% 91.30%
West
Midlands 62,701 61,736 60,436 98.50% 96.40%
Yorkshire and
Humber 58,388 58,338 51,871 99.90% 88.80%
England 565,269 560,292 532,787 99.12% 94.25%
Northern
Ireland 23,708 23,695 23,503 99.90% 99.10%

Data Collection and Performance Analysis Report: Newborn Blood Spot Screening in the UK 2013-14
15
Data for the South East region have previously been split into South Central and South East
Coast. The data for 2013-14 are the total of these two regions added together.
Figure 3. Completeness of coverage for PKU, in babies for whom the CCG/CHS area was
responsible for at birth and at the time of report 2010-14 (measured at 17 days)
0%
10%
20%
30%
40%
50%
60%
70%
80%
90%
100%
2010-11 2011-12 2012-13
2013-14 Acceptable Level Achievable Level

Data Collection and Performance Analysis Report: Newborn Blood Spot Screening in the UK 2013-14
16
2.3 Standard 1b: Completeness of coverage (movers in)
Description
The proportion of babies who ‘move in’ and become the responsibility of the CCG during the
reporting period and for whom the CCG/CHS remains responsible on the last day of the
reporting period, who are eligible for newborn blood spot screening and have a conclusive test
result recorded on the CHIS for PKU, CHT, SCD, CF and MCADD equal to or less than 21
calendar days of movement in being recorded on the child health information system
Acceptable level: ≥ 95% of eligible babies are tested for PKU
Achievable level: ≥ 99.9% of eligible babies are tested for PKU
From 2010-2014 data has been collected to measure the number of ‘mover in’ babies tested,
without applying an effective timeframe. Standard 1b introduces an effective timeframe of 21
calendar days and this data collection was piloted during 2013-14. Although many areas were
unable to report due to IT system limitations, the data will be collected from 2014-15.
Table 5. Completeness of coverage for PKU, in babies who moved into the CCG/CHS
area under one year of age and who were the responsibility of the CCG/CHS area on the
day of the report 2013-14
Region/ country
Regional total
number of
'movers in' up to
one year of age
for whom the
CCG/country is
responsible for
on the last day of
the reporting
period
Number of babies tested
(status codes
04,05,06,07,08,10)
% of babies tested
(status codes
04,05,06,07,08,10)
East of England 3,940 3,639 92.4%
East Midlands 1,463 1,323 90.4%
London 8,310 7,506 90.3%
North East 1,305 1,222 93.6%
North West 2,311 2,005 86.8%
South East 4,208 3,737 88.8%
South West 1,482 1,183 79.8%
West Midlands 2,196 1,521 92.0%
Yorkshire and Humber 4,051 3,866 95.4%
England 5,403 4,962 91.8%
Northern Ireland 356 292 82.0%

Data Collection and Performance Analysis Report: Newborn Blood Spot Screening in the UK 2013-14
17
Data for the South East region have previously been split into South Central and South East
Coast. The data for 2013-14 are the total of these two regions added together.
Figure 4. Completeness of coverage for PKU, in babies who moved into the CCG/CHS
area under one year of age and who were the responsibility of the CCG/CHS area on the
day of the report 2010-2014
0%
10%
20%
30%
40%
50%
60%
70%
80%
90%
100%
% of babies tested 2010-11 % of babies tested 2011-12
% of babies tested 2012-13 % of babies tested 2013-14

Data Collection and Performance Analysis Report: Newborn Blood Spot Screening in the UK 2013-14
18
Table 6. CHRD process data
Region
Number
of CHRDs
that
receive
newborn
screening
results
with the
screening
status
codes
Number
of
CHRDs
who
record
results
using
status
codes
Number
of
CHRDs
who
receive
results
by hard
copy
Number
of
CHRDs
who
receive
results
by email
Number of
CHRDs who
receive
results by
electronic
messaging
Number of
CHRDs who
send letters
direct to
parents
when 04 is
reported on
all 5
conditions
Total
responses
East
Midlands 20 20 10 10 11 7 20
East of
England 6 7 6 6 1 6 8
London 26 26 10 24 2 19 26
North East 12 12 12 0 0 12 12
North West 21 20 20 21 3 7 21
South East 32 32 27 28 13 8 32
South West 12 12 12 10 1 9 12
West
Midlands 20 20 3 0 20 15 20
Yorkshire
and Humber 21 21 6 10 13 19 21
England 170 170 106 109 64 102 172
Northern
Ireland 4 4 4 0 0 0 4

Data Collection and Performance Analysis Report: Newborn Blood Spot Screening in the UK 2013-14
19
Figure 5. Percentage of CHRDs who received results by hard copy, email and electronic
messaging
Table 7. Number and rate of declines using PKU as a close approximation for all
conditions 2013-14 (CCG responsibility at birth)
Region/country
Regional total number
of babies the CCG/
country is responsible
for at birth and
remains responsible
for on the last day of
the reporting period
Number of babies
declined (status
code 02)
Rate of decline per
10,000 babies PKU
2013-14
East Midlands 47,461 39 8.22
East of England 57,796 45 7.79
London 98,291 145 14.75
North East 26,967 2 0.74
North West 62,772 41 6.53
South East 97,205 71 7.30
South West 53,688 54 10.06
West Midlands 62,701 26 4.15
Yorkshire and Humber 58,388 25 4.28
England 565,269 448 7.93
Northern Ireland 23,708 12 5.06
Scotland 56,261 38 6.75
Wales 33,910 19 5.60
0%
10%
20%
30%
40%
50%
60%
70%
80%
90%
100%
CHRDs who receive results by hard copy
CHRDs who receive results by Email
CHRDs who receive results by Electronic messaging

Data Collection and Performance Analysis Report: Newborn Blood Spot Screening in the UK 2013-14
20
Decline rates vary between local areas. The blood spot screening programme aims to
investigate the root cause for higher levels of declines in 2015-16.
Figure 6. Rate of declines per 10,000 babies using PKU as a close approximation for all conditions 2010- 2014 (CCG responsibility at birth)
0
2
4
6
8
10
12
14
16
18
Rate of decline per 10,000 babies PKU 2010-11 Rate of decline per 10,000 babies PKU 2011-12
Rate of decline per 10,000 babies PKU 2012-13 Rate of decline per 10,000 babies PKU 2013-14

Data Collection and Performance Analysis Report: Newborn Blood Spot Screening in the UK 2013-14
21
Figure 7. Rate of declines per 10,000 babies using PKU as a close approximation for all
conditions, 2013-14, split between ‘Born and Registered’ and ‘Mover In’ populations
Northern Ireland has a failsafe which identifies movers in under 1 year of age and offers
screening to all movers in from outside the UK and also those who move in from other UK
countries, where there is no documented evidence of completed screening. Similarly in
England if a child moves into an area with no record of being tested they are offered screening
up to one year of age. This accounts for a higher decline rate among movers in.
0 200 400 600 800 1000 1200 1400 1600 1800
East Midlands
East of England
London
North East
North West
South East
South West
West Midlands
Yorkshire and Humber
England
Northern Ireland
Decline rate per 10,000 babiesBorn and Registered population
Decline rate per 10,000 babiesMovers In population
Data Collection and Performance Analysis Report: Newborn Blood Spot Screening in the UK 2013-14
22
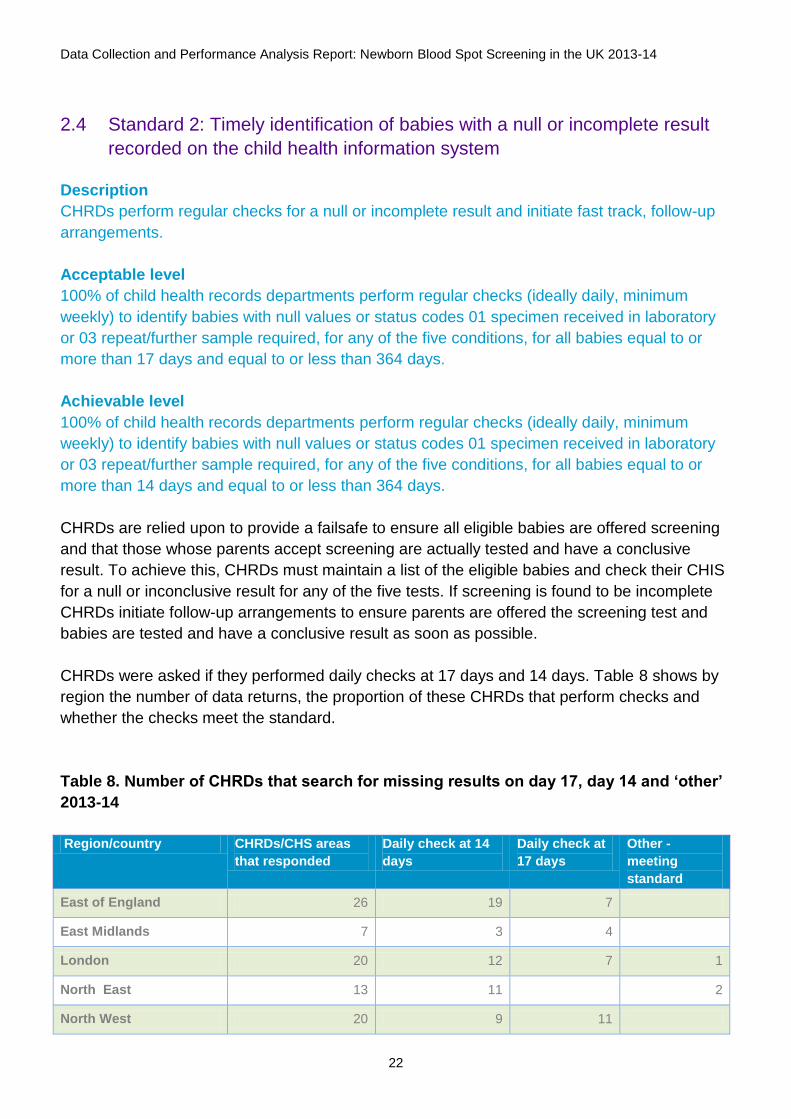
2.4 Standard 2: Timely identification of babies with a null or incomplete result
recorded on the child health information system
Description
CHRDs perform regular checks for a null or incomplete result and initiate fast track, follow-up
arrangements.
Acceptable level
100% of child health records departments perform regular checks (ideally daily, minimum
weekly) to identify babies with null values or status codes 01 specimen received in laboratory
or 03 repeat/further sample required, for any of the five conditions, for all babies equal to or
more than 17 days and equal to or less than 364 days.
Achievable level
100% of child health records departments perform regular checks (ideally daily, minimum
weekly) to identify babies with null values or status codes 01 specimen received in laboratory
or 03 repeat/further sample required, for any of the five conditions, for all babies equal to or
more than 14 days and equal to or less than 364 days.
CHRDs are relied upon to provide a failsafe to ensure all eligible babies are offered screening
and that those whose parents accept screening are actually tested and have a conclusive
result. To achieve this, CHRDs must maintain a list of the eligible babies and check their CHIS
for a null or inconclusive result for any of the five tests. If screening is found to be incomplete
CHRDs initiate follow-up arrangements to ensure parents are offered the screening test and
babies are tested and have a conclusive result as soon as possible.
CHRDs were asked if they performed daily checks at 17 days and 14 days. Table 8 shows by
region the number of data returns, the proportion of these CHRDs that perform checks and
whether the checks meet the standard.
Table 8. Number of CHRDs that search for missing results on day 17, day 14 and ‘other’
2013-14
Region/country CHRDs/CHS areas
that responded
Daily check at 14
days
Daily check at
17 days
Other -
meeting
standard
East of England 26 19 7
East Midlands 7 3 4
London 20 12 7 1
North East 13 11 2
North West 20 9 11

Data Collection and Performance Analysis Report: Newborn Blood Spot Screening in the UK 2013-14
23
South East 30 27 3
South West 12 8 4
West Midlands 20 5 15
Yorkshire and the
Humber 13 11 2
England 161 105 44 12
Northern Ireland 4 4
Figure 8. Percentage of CHRDs that search for missing results on day 17, day 14 and
‘other’ 2010-14
0%
10%
20%
30%
40%
50%
60%
70%
Daily checks at 14days
Daily checks at 17days
Other - meetingstandard
Other - notmeeting standard
No data
2010-11 2011-12 2012-13 2013-14

Data Collection and Performance Analysis Report: Newborn Blood Spot Screening in the UK 2013-14
24
2.5 Standard 3: Baby’s NHS number (or UK equivalent) is included on the
blood spot card
Description
This standard is intended to ensure use of the baby’s NHS number (or UK equivalent)
throughout the newborn screening process. The NHS number is a unique identifier that will aid
the identification and tracking of babies as they progress through the screening pathway. Since
April 2010 it has been mandatory for the NHS number to be used in England, ideally in a bar-
coded label with an eye-readable NHS number.
Acceptable level
100% of blood spot cards received by a laboratory include the baby’s NHS number.
Achievable level
95% of blood spot cards received by a laboratory have the baby’s NHS number included on a
bar-coded label.
A breakdown of performance for each laboratory catchment area is shown in Table 9 and
Figure 9 shows an overall increase in the use of the NHS number from 2007 to 2014.
Table 9. Number of blood spot cards including the baby’s NHS number (or UK country
equivalent) 2013-14
Laboratory
Number of all
samples (including
repeats)
Number of blood spot
cards including babies'
NHS number (or UK
country equivalent)
Percentage of all blood
spot cards including
babies' NHS number or
(UK country equivalent)
Bristol 45,473 45,446 99.9%
Cambridge 27,685 27,644 99.9%
GOSH 128,179 127,690 99.6%
Leeds 46,876 45,287 96.6%
Liverpool 25,222 25,094 99.5%
Manchester 58,965 58,684 99.5%
Newcastle 35,872 35,740 99.6%
Oxford 30,528 30,506 99.9%
Portsmouth 38,998 38,321 98.3%
SE Thames 60,285 59,991 99.5%
Sheffield 77,021 76,680 99.6%
SW Thames 52,918 52,818 99.8%
West Midlands 76,809 76,596 99.7%
England 704,831 700,497 99.4%
Scotland 59,413 58,370 98.2%
Wales 33,910 33,316 98.2%

Data Collection and Performance Analysis Report: Newborn Blood Spot Screening in the UK 2013-14
25
The Health + Care number (Northern Ireland equivalent to NHS number) is currently recorded
on blood spot cards and plans are underway for the regional screening laboratory to routinely
capture and report on the use of the number.
Figure 9. Percentage of all blood spot cards including the baby’s NHS number (or UK
country equivalent) 2007-14 (please note the Y axis does not begin at zero)
40%
50%
60%
70%
80%
90%
100%
2007-8 2008-9 2009-10 2010-11
2011-12 2012-13 2013-14 Acceptable standard

Data Collection and Performance Analysis Report: Newborn Blood Spot Screening in the UK 2013-14
26
Figure 10. CCG/CHS area returning the lowest, average and highest percentage of
samples including NHS number (or UK country equivalent) 2013-14 (please note the Y
axis does not begin at zero)
60%
65%
70%
75%
80%
85%
90%
95%
100%
Lowest performing area % of sampleswith NHS number Highest performing area

Data Collection and Performance Analysis Report: Newborn Blood Spot Screening in the UK 2013-14
27
Figure 11. Percentage of samples including a barcoded NHS number label 2010-14
Overall percentage of samples including a barcoded NHS number label has increased year on
year since 2010-11; however, no laboratory reported reaching the achievable standard. GOSH
and Oxford are currently unable to report usage of the barcoded label due to IT limitations.
For more information see www.gov.uk/government/publications/barcode-labels-quality-
assurance-in-newborn-blood-spot-screening.
88.2%
83.1%
66.4%
38.7%
57.5%
89.8%
78.5%
67.7% 72.3% 73.9% 75.6%
73.4%
0%
10%
20%
30%
40%
50%
60%
70%
80%
90%
100%
2010-11 2011-12 2012-13 2013-14 Achievable standard

Data Collection and Performance Analysis Report: Newborn Blood Spot Screening in the UK 2013-14
28
2.6 Standard 4: Timely sample collection
Description
It is essential to take the blood spot sample promptly to give each screen positive baby the
best possible chance of receiving early treatment. The health professional responsible for
taking the blood sample should adhere to the guidelines for newborn blood spot sampling to
ensure a valid sample is taken.
Acceptable level: Equal to or greater than 95% of first samples taken on days 5-8 (ideally on
day 5).
Achievable level: Equal to or greater than 99% of first samples taken on days 5-8 (ideally on
day 5).
The maternity services sending their samples to all English laboratories met the core standard
of 95% or more first samples taken on days 5-8. 96.9% (range 72.6-100%) of samples in
England were taken on days 5-8. 98.3% (range 98-99%) of samples were taken on days 5-8 in
Northern Ireland, and Wales achieved 96.4% (range 95.3-97.8%). Scotland reported 71.7% of
samples were taken on days 5-8; Scotland no longer counts day 4 as too early for screening
and 27.3% of samples were taken on day 4.
Figure 12. CCG/CHS/HB area returning the lowest, average and highest percentage of
samples taken on days 5-8 2013-14
40%
50%
60%
70%
80%
90%
100%
Lowest performing area % of samples taken between 5- 8 days Highest performing area

Data Collection and Performance Analysis Report: Newborn Blood Spot Screening in the UK 2013-14
29
The figure for Scotland includes samples taken on day 4. The lowest performance for SW
Thames represents a small number of samples taken in Barking and Dagenham.
Figure 13. Percentage of samples taken on days 5-8, 2006-14
0%
10%
20%
30%
40%
50%
60%
70%
80%
90%
100%
2006-7 2007-8 2008-9 2009-10
2010-11 2011-12 2012-13 2013-14
Acceptable standard Achievable Standard

Data Collection and Performance Analysis Report: Newborn Blood Spot Screening in the UK 2013-14
30
2.7 Standard 5: Timely receipt of a sample in the newborn screening laboratory
Description
To maximise accuracy of screening test. All samples must arrive within the screening
laboratory as soon as possible after the sample has been taken. This enables the laboratory to
analyse the sample at the earliest opportunity and also reduces the risk of sample deterioration
due to prolonged despatch.
Acceptable level: Equal to or greater than 99% of all samples received within 4 working days.
Achievable level: Equal to or greater than 99% of all samples received within 3 working days.
In England, 96.8% (range 88.2-99.5%) of samples were received in the screening laboratory
within four working days of the sample being taken (Figure 14). Northern Ireland achieved
99.6% (range 99.3-99.8%). Wales reported 82.9% (range 78.5-86.3%) and Scotland reported
90.3% of samples received within 4 working days.
Figure 14. Percentage of samples received by laboratories within three and four working
days of blood sample being taken 2013-14
0%
10%
20%
30%
40%
50%
60%
70%
80%
90%
100%
3 or fewer working days of sample being taken 4 or fewer working days of sample being taken

Data Collection and Performance Analysis Report: Newborn Blood Spot Screening in the UK 2013-14
31
Figure 15. Percentage of samples received in the laboratory after five working days or
more of blood sample being taken 2006-14
0%
5%
10%
15%
20%
25%
30%
35%
40%
45%
50%
2006-7 2007-8 2008-9 2009-10 2010-11 2011-12 2012-13 2013-14

Data Collection and Performance Analysis Report: Newborn Blood Spot Screening in the UK 2013-14
32
2.8 Standard 6: Quality of the blood spot sample
Description
A good quality blood spot sample is one that: is taken at the right time; has all data fields
completed on the blood spot card; contains sufficient blood to perform all tests; has not been
contaminated; and arrives in the laboratory in a timely manner.
Avoidable repeat requests (numerator) is the total number of repeat (second or subsequent)
samples requested by the laboratory during the reporting period because the previous sample
was:
Taken when the baby was too young (on or before day 4, where day of birth is day 0)
(excluding pre-transfusion admission samples)
Insufficient blood
Unsuitable sample/card (eg on an expired blood spot card, contaminated, in transit for
more than 14 days, anti-coagulated sample, baby’s NHS number and/or other details not
accurately recorded on the blood spot card)
Acceptable level: The avoidable rate is less than or equal to 2%
Achievable level: The avoidable rate is less than or equal to 0.5%
It has been recognised that there is regional variation in laboratory definitions of an unsuitable
sample, causing inequality in rejections of samples.
The Welsh newborn screening laboratory implemented more stringent blood spot quality
standards in 2014. A high avoidable repeat rate was expected for the period 2013-2014. The
new standards include requesting a repeat if the NHS number is missing or if the blood spots
contain a very low volume of blood. The laboratory has indicated that the overall quality of the
samples has improved recently.
New evidence-based blood spot quality guidelines for the English screening laboratories were
implemented in April 2015 with the aim of improving quality of samples and, in turn, the
efficiency of the screening pathway. The new quality guidelines will standardise the rejection
and acceptance criteria used by English screening laboratories. Some areas experienced an
initial rise in the avoidable repeat rate but have reported subsequent improvements. The
programme will continue to monitor this data and update the screening advisory boards.
Additional educational and information resources have been developed to support training for
samples takers (cpd.screening.nhs.uk/bloodspot-elearning).

Data Collection and Performance Analysis Report: Newborn Blood Spot Screening in the UK 2013-14
33
Figure 16. Avoidable repeat rates (insufficient and unsuitable sample) 2006-14
Figure 17. Percentage of samples repeated due to insufficient and unsuitable sample
2013-14
0%1%2%3%4%5%6%7%8%9%
10%
2006-7 2007-8 2008-9
2009-10 2010-11 2011-12
2012-13 2013-14 Acceptable standard 2%
Achievable standard 0.5%
0.0%
0.5%
1.0%
1.5%
2.0%
2.5%
3.0%
3.5%
4.0%
% unsuitable samples % insufficient samples

Data Collection and Performance Analysis Report: Newborn Blood Spot Screening in the UK 2013-14
34
2.9 Standard 7: Timely taking of a repeat blood spot sample
Description
This standard covers repeat/second samples requested by the laboratory because the first
sample was of poor quality, not valid for testing or required by the UK protocol for the specific
condition. In order that treatment and clinical referral targets are met, the timely receipt of a
repeat/second blood spot sample is imperative.
Laboratory information systems do not support collection of data for this standard, so
performance cannot be measured. However, Northgate Information Solutions UK Ltd was
awarded the contract in January 2013 to provide the Newborn Blood Spot Screening Failsafe
Solution (NBSFS). This is a web-based solution that identifies babies who have not had blood
spot screening. Stage 1 of the NBSFS is now fully implemented across all English providers of
maternity services. This means all babies born in England will be identified if they have not
been screened. The NBSFS is also linked to the Welsh blood spot screening failsafe system.
In future the NBSFS will store all the screening results that will include identifying babies that
need a repeat sample. Where applicable, the screening results will have subcategories; this
will be particularly beneficial for repeat samples as the subcategories will provide the reason
the repeat sample is required. Timeliness of repeat samples being taken and received will also
be available from the NBSFS.

Data Collection and Performance Analysis Report: Newborn Blood Spot Screening in the UK 2013-14
35
2.10 Standard 9: Timely processing of all PKU, CHT and MCADD screen
positive samples
Description
This standard relates to PKU, CHT and MCADD and subsequent action on positive screening
results. It is intended to measure the timeliness of screening laboratory processing and clinical
referral. The purpose is to facilitate high quality and timely intervention in those who wish to
participate.
Acceptable level: 100% of babies with a positive screening result have a clinical referral
initiated within four working days of sample receipt by screening laboratory.
Achievable level: 100% of babies with a positive screening result have a clinical referral
initiated within three working days of sample receipt by screening laboratory.
Table 10. Numbers of samples processed within the standard in the UK
Condition Number of screen
positive samples
Number (%) of babies
with a positive
screening result have
a clinical referral
initiated within four
working days of
sample receipt by
screening laboratory
Number (%) of babies
with a positive
screening result have
a clinical referral
initiated within three
working days of
sample receipt by
screening laboratory
PKU 72 72 (100%) 72 (100%)
CHT 587*
(*586 referrals)
586 (100%) 573 (97.8%)
MCADD 83 82 (98.8%) 79 (95.2%)

Data Collection and Performance Analysis Report: Newborn Blood Spot Screening in the UK 2013-14
36
2.11 Standard 11: Timely receipt into clinical care
Description
A baby in whom PKU, CHT (on first sample) or MCADD is suspected should attend their first
clinical appointment by:
Acceptable level: 100% by 17 days of age
Achievable level: 100% by 14 days of age
2.11.1 Phenylketonuria (PKU)
Table 11. Appointment timeliness and outcome for PKU screen positive babies
PKU England Northern
Ireland Scotland Wales
Babies screened positive for PKU 54 7 9 2
Babies with age at appointment reported 49 7 6 2
Number seen ≤ 14 days 44 6 6 2
Number seen ≤ 17 days 45 6 6 2
All babies median age at appointment: 11 9 8 12
Range * 7-329 days 7-306 days 7-9 days 10-14 days
Babies with age at appointment unknown: 4 0 3 0
Deceased 1 0 0
Not reported 3 0 3 0
Outcome:
PKU confirmed treatment required 33 5 6 2
Non PKU eg biopterin disorders 1 0 1 0
No persistent abnormalities - false positive (PKU
excluded) 10 1 2 0
PKU monitoring required 4 1 0 0
Not reported 6 0 0 0
*One baby in England and one baby in Northern Ireland moved into the country after birth and
were tested late (329 and 306 days respectively) and therefore had their first appointment very
late. Without these exceptions the maximum age at appointment would be 22 days for England
and 10 days for Northern Ireland.

Data Collection and Performance Analysis Report: Newborn Blood Spot Screening in the UK 2013-14
37
Figure 18. Age in days of PKU screen positive babies, in the UK, at time of first
appointment 2013-14
Table 12. Incidence of screen positive PKU results 2005-14
Laboratory Number of babies tested
for PKU 2005-14
Total number of screen
positives 2005-14
Rate of PKU screen
positives per 10,000
Bristol 365,707 28 0.77
Cambridge 245,096 41 1.67
GOSH 1,090,663 107 0.98
Leeds 402,183 50 1.24
Liverpool 261,510 31 1.19
Manchester 451,375 65 1.44
Newcastle 309,667 39 1.26
Oxford 265,843 20 0.75
Portsmouth 317,089 20 0.63
SE Thames 509,356 55 1.08
Sheffield 658,489 92 1.40
SW Thames 459,678 36 0.78
West Midlands 637,688 74 1.16
England 5,974,371 666 1.11
Northern Ireland 221,691 52 2.35
Wales 351,994 52 1.48
Scotland * 311,946 47 1.51
UK total 6,860,002 817 1.19
0
2
4
6
8
10
12
14
16
18
1 3 5 7 9 11 13 15 17 19 21 More
Freq
uen
cy
Age in days of baby
Age (in days) of the baby at first appointment with the designated clinician
14 day standard 17 day standard

Data Collection and Performance Analysis Report: Newborn Blood Spot Screening in the UK 2013-14
38
*Scotland incidence data is based upon figures from 2008 to 2014
Figure 19. UK PKU screening and diagnostic algorithm 2013-14

Data Collection and Performance Analysis Report: Newborn Blood Spot Screening in the UK 2013-14
39
2.11.2 Congenital hypothyroidism (CHT)
The time by which a baby in whom a diagnosis of CHT has been made should commence
treatment with oral levothyroxine depends on whether this follows an initial or second sample:
a) CHT suspected on initial screening sample
Acceptable level: 17 days of age (100% of infants)
Achievable level: 14 days of age (100% of infants)
b) CHT suspected on a repeat blood spot sample that follows a borderline TSH
Acceptable level: 24 days of age (100% of infants)
Achievable level: 21 days of age (100% of infants)
Table 13. Appointment timeliness and treatment for CHT screen positive babies
detected on first sample 2013-14
CHT – detected on first sample England Northern
Ireland Scotland Wales
Babies detected on
first sample 298 15 19 19
Babies with age at appointment reported 262 15 18 0
Number seen ≤ 14 days standard (of known data) 225 15 18
Number seen ≤ 17 days standard (of known data) 248 15 18
Median age at appointment: 12 10 10
Range 7-244 days 7-13 days 7-13 days
Babies with age at appointment unknown: 36 0 1 19
Inpatient 5
Baby died 1
Not reported 30 19
Has baby started on thyroxine at the first
appointment?
Yes 222 14 17
No 7
Not reported 43 2 19
Thyroxine not given but follow up required 15 1
Thyroxine not given and baby discharged 11

Data Collection and Performance Analysis Report: Newborn Blood Spot Screening in the UK 2013-14
40
Table 14. Appointment timeliness and treatment for CHT screen positive babies
detected on second sample 2013-14
CHT – detected on second sample England Northern
Ireland
Scotland Wales
Babies detected on second sample 219 5 7 5
Babies with age at appointment reported 181 5 7 0
Number seen ≤ 21 days standard 116 4 3
Number seen ≤ 24 days standard 138 5 5
All babies median age at appointment: 20 18 18
Range 11-59 days 14-23 days 14-32 days
Babies with age at appointment unknown: 38 0 0 5
Inpatient 14
Baby died 1
Not reported 23
4 5
Has baby started on thyroxine at the first
appointment?
Yes 104 5 4
No 5
Not reported 33
1 5
Thyroxine not given but follow up required 50
1
Thyroxine not given and baby discharged 27 1
One further baby, born at 25 weeks gestational age, had an “03/L” result (requires pre-term
CHT test) on the day 5 sample and an “08” (CHT suspected) result on the preterm CHT
sample, taken at 32 days. This baby had its first clinical appointment aged 33 days.

Data Collection and Performance Analysis Report: Newborn Blood Spot Screening in the UK 2013-14
41
Figure 20. Age of CHT screen positive babies in the UK, detected on first sample, at time
of first appointment 2013-14
0
10
20
30
40
50
60
1 4 7 10 13 16 19 22 25 28 31 34 37 More
Freq
uen
cy
Age in days of baby
Age of CHT screen positive babies in the UK, detected on first sample, at time of first appointment
14 day standard 17 day standard

Data Collection and Performance Analysis Report: Newborn Blood Spot Screening in the UK 2013-14
42
Figure 21. Age of CHT screen positive babies in the UK, detected on the second sample,
at time of first appointment 2013-14
0
5
10
15
20
25
30
35
40
1 3 5 7 9 11 13 15 17 19 21 23 25 27 29 31 33 35 37 39 41 43 45 47 49 51 53 55 57 59More
Freq
uen
cy
Age in days of baby
Age of CHT screen positive babies in the UK, detected on second sample, at time of first appointment
21 day standard 24 day standard

Data Collection and Performance Analysis Report: Newborn Blood Spot Screening in the UK 2013-14
43
CHT results depending on use of national or local standards
CHT is the only screening protocol in which a borderline result necessitates a second sample
before a conclusive result can be achieved. Table 15 shows variation persists in compliance
with the national borderline cut off level (10 mU/L). In England, an additional 828 babies had a
borderline result on the first sample due to lower cut off levels in six laboratories. Figure 22
shows the increase in borderline results, comparing local laboratory borderline cut offs levels
with the national levels.
Table 15. CHT results depending on use of national or local standards
Laboratory
What
TSH cut
off levels
do you
use to
determin
e a
positive
screen
for CHT
(mU/L)
What
TSH cut
off levels
do you
use to
determin
e a
borderlin
e screen
for CHT
(mU/L)
Total
number
of CHT
borderli
ne
results
on the
first
sample
using
national
TSH cut
off
levels
(10-20
mU/L)
Total
number
of CHT
borderlin
e results
on the
first
sample
using
your
laborator
y TSH
cut off
levels
Total
number
of babies
tested
for CHT
2007-14
Total
number
of CHT
screen
positives
2007-14
Rate of CHT
screen
positives 2007-
14 per 10,000
babies
Bristol 20 6 24 124 365,703 179 4.89
Cambridge 20 10 34 34 245,096 147 6.00
GOSH 20 6 100 508 1,099,696 1020 9.28
Leeds >20 >10 39 39 402,183 243 6.04
Liverpool >20 >5 11 146 261,510 228 8.72
Manchester 20 8 42 83 451,333 370 8.20
Newcastle 20 6 41 159 309,667 188 6.07
Oxford 20 10 38 38 265,840 172 6.47
Portsmouth 20 8 20 46 316,965 152 4.80
SE Thames 20 10 44 44 509,356 281 5.52
Sheffield 20 10 76 76 658,487 344 5.22
SW Thames 20 10 29 29 459,678 259 5.63
West
Midlands ≥20 10 94 94 637,688 462 7.24
England 592 1420 5,983,232 4045 6.76
Northern
Ireland ≥20 ≥8 16 41 221,683 144 6.50
Scotland 25 8 46 79 351993 164 4.66
Wales * 20 10 31 31 311888 194 6.22
UK 6,868,796 4547 6.62

Data Collection and Performance Analysis Report: Newborn Blood Spot Screening in the UK 2013-14
44
* Wales changed their cut off from 6 to 10 mU/L in October 2012 and only screen positives with
a TSH of >10 mU/L have been included in the table above.
Figure 22. CHT borderline results depending on use of national or local standards 2013-
14
0
100
200
300
400
500
600
Total number of CHT borderline results on the first sample using national TSH cut off levels (10-20 mU/L)
Total number of CHT borderline results on the first sample using local laboratory TSH cut off levels

Data Collection and Performance Analysis Report: Newborn Blood Spot Screening in the UK 2013-14
45
2.11.3 Medium-chain acyl-CoA dehydrogenase deficiency (MCADD)
Table 16. Appointment timeliness and outcome for MCADD screen positive babies 2013-
14
England Northern
Ireland
Wales Scotland
Babies screen positive for MCADD 69 5 5 2
Babies with age at appointment reported 64 5 5 2
Number seen ≤ 14 days 59 5 5 1
Number seen ≤ 17 days 62 5 5 1
All babies median age at appointment: 11 7 14 29
Range 1-23 days 4-13 days 11-14 days 10-47 days
Outcome:
MCADD 58 5 5 1
Unaffected carrier 0
MCADD unlikely 4
Not MCADD 2
Unknown: not reported 5
1

Data Collection and Performance Analysis Report: Newborn Blood Spot Screening in the UK 2013-14
46
Figure 23. Age of MCADD screen positive babies in the UK at time of first appointment
2013-14 (Note that there is one outlier at 47 days)
Table 17. Incidence of screen positive MCADD results 2008-14
Laboratory Number of babies
tested for MCADD
Total number of screen
positives
Rate of MCADD
screen positives
per 10,000 babies
2007-14
Bristol 229,455 21 0.92
Cambridge 163,564 22 1.35
GOSH 741,143 56 0.76
Leeds 273,208 40 1.46
Liverpool 167,914 20 1.19
Manchester 340,906 38 1.11
Newcastle 188,494 18 0.95
Oxford 154,139 19 1.23
Portsmouth 219,038 23 1.05
SE Thames 347,948 24 0.69
Sheffield 448,056 69 1.54
SW Thames 291,236 24 0.82
West Midlands 433,180 36 0.83
England 3,998,281 410 1.03
Northern Ireland 116,946 15 1.28
Scotland 206,594 6 0.29
Wales 62,406 8 1.28
UK 4,384,227 441 1.01
Figure 24. MCADD screening and diagnostic algorithm in England, Northern Ireland,
Scotland and Wales 2013-14
0
2
4
6
8
10
12
14
1 2 4 5 6 7 8 9 10 11 12 13 14 15 16 17 19 23 47
Age (in days) of the baby at first appointment with the designated clinician
14 day standard 17 day standard

Data Collection and Performance Analysis Report: Newborn Blood Spot Screening in the UK 2013-14
47
Routine newborn screening dried blood spot samples:
C8≥0.40
µMOL/L
[A]
C8≥0.50
µMOL/L
Mean [A,B,C]
Ratio2
C8:C10≥1.0
Re-test C8 in duplicate [B,C]
Test for C102
MCADD not suspected
No further action
Obtain C10 results2
Calculate C8:C10 ratio
Unknown: DNA analysis not reported
Yes No
No
MCADD985A>G
Homozygous(2 copies)
985A>GHeterozygous (1 copy)
EMS 2 mutations
Biochemically abnormal
EMS985A>G/
Other mutation
EMS 1 mutation only
Unknown: Datainsufficient
NOT MCADD
Unaffected CARRIER
MCADD
MCADD UnlikelyReview and consider need
for further biochemical investigations
Likely unaffected MCADD CARRIER
Review and consider need for further biochemical
investigations
Yes
No
Biochemically abnormal
Yes0
No4
2
Yes45
2
No32
No11
19
Yes24*
27*
Yes 0
Yes9*
No0
Yes21
Yes18
NK1
No0
24* 4 00
No4
NK = not known* = 2 EMS not known
Yes81
4
788,490
788,571

Data Collection and Performance Analysis Report: Newborn Blood Spot Screening in the UK 2013-14
48
2.11.4 Cystic fibrosis (CF)
A baby in whom CF is suspected should have their first clinical appointment by:
CF suspected: two CFTR mutations detected:
Acceptable level: 95% of babies seen by 28 days of age
Achievable level: 100% of babies seen by 28 days of age
CF suspected: none or one CFTR mutation detected:
Acceptable level: 80% of babies seen by 35 days of age
Achievable level: 100% of babies seen by 35 days of age
Babies with positive screening results for CF should have their first clinical appointment where
decisions on treatment are made by day 28, when two mutations have been detected, and by
day 35, when a second sample is required before a presumptive positive screening result is
arrived at.
Table 18. Timeliness of appointment for CF screen positive babies with two mutations
2013-14
England Northern
Ireland
Scotland Wales
Number screened with two mutations 171 4 16 3
Number clinically diagnosed
(excluded from following age data) 29 0 4 0
Number with age at appointment
reported 105 4 9 0
Number seen ≤ 28 days 97 4 9
All babies median age at
appointment: 20 23 20
Range 7-51 days 19-25 days 16-31 days
Babies with age at appointment
unknown 37 0 3 3
Outcome:
Confirmed 115 4 9 3
CF screen positive, inconclusive
diagnosis (CF SPID) (equivocal) 2
Excluded 0
Not reported 54 7

Data Collection and Performance Analysis Report: Newborn Blood Spot Screening in the UK 2013-14
49
Table 19. Timeliness of appointment for CF screen positive babies with one or no
mutations 2013-14 (and therefore a repeat sample is required)
* Excludes one baby tested > 8 weeks of age but unavoidably analysed, had an IRT > CUT-
OFF 2 and was referred as ‘CF suspected’.
England Northern
Ireland
Scotland Wales
Number screened with one or no
mutations 72 11
* 8 23
Number with age at appointment
reported 39 11 5 0
Number seen ≤ 35 days 27 10 4
All babies median age at appointment: 32 27 30
Range 12-106 days 24-36 days 26-39 days
Babies with age at appointment
unknown 33 0 3 23
Inpatient 2 2
Baby died 2
Not reported 29 1
Confirmed 23 2 1
CF SPID (equivocal) 3 1
Excluded 16 11 21
Not reported 30 6

Data Collection and Performance Analysis Report: Newborn Blood Spot Screening in the UK 2013-14
50
Figure 25. Age in days of CF screen positive babies in the UK* at time of first
appointment 2013-14
* Only UK countries that returned data on age at first appointment.
0
1
2
3
4
5
6
7
8
9
10
1 4 7 10 13 16 19 22 25 28 31 34 37 40 43 46 49 52 55 58 61
Fre
qu
en
cy
Age in days of baby
35 day standard 28 day standard
Age in days of babies screened with one or no mutations
Age in days of babies screened with two mutations at times of assessment

Data Collection and Performance Analysis Report: Newborn Blood Spot Screening in the UK 2013-14
51
Figure 26. Age in days of babies in the UK* with one or no mutations at time of
sampling, referral and assessment 2013-14 (where full data is provided)
* All four UK countries follow different testing protocols
The CF programme was fully implemented in England in October 2007. Results reported to the
NHS Newborn Blood Spot Screening Programme suggest that the protocol is performing
appropriately and numbers of babies with CF suspected and CF carrier results have been
consistent over the last five years.
Table 20. Incidence of screen positive CF results 2007-14
Laboratory Number of babies tested
for CF
Total number of screen
positives
Rate of CF screen
positives per 10,000
babies
Bristol 290,580 164 5.64
Cambridge 194,745 87 4.47
GOSH 829,293 219 2.64
Leeds 316,850 130 4.10
Liverpool 203,995 116 5.69
Manchester 366,962 138 3.76
Newcastle 242,912 119 4.90
Oxford 208,908 51 2.44
Portsmouth 259,930 91 3.50

Data Collection and Performance Analysis Report: Newborn Blood Spot Screening in the UK 2013-14
52
SE Thames 352,259 124 3.52
Sheffield 521,134 225 4.32
SW Thames 350,879 113 3.22
West Midlands 503,797 184 3.65
England 4,642,244 1761 3.79
Northern Ireland 116,529 66 5.66
Scotland 352,451 195 5.53
Wales* does not
include 0 mutations 245,570 159 6.47
UK Total 5,356,794 2,181 4.07
All four UK countries follow different testing protocols; data is mapped for England in Figure 27,
Northern Ireland in Figure 28 and Wales in Figure 29.

Data Collection and Performance Analysis Report: Newborn Blood Spot Screening in the UK 2013-14
53
Figure 27. England CF screening and diagnostic algorithm
6

Data Collection and Performance Analysis Report: Newborn Blood Spot Screening in the UK 2013-14
54
Figure 28. Northern Ireland CF screening and diagnostic algorithm
*One sample was taken after 8 weeks of age but unavoidably analysed, had an IRT > CUT-OFF 2 and was referred as’ CF suspected’

Data Collection and Performance Analysis Report: Newborn Blood Spot Screening in the UK 2013-14
55
Figure 29. Wales CF screening and diagnostic algorithm

Data Collection and Performance Analysis Report: Newborn Blood Spot Screening in the UK 2013-14
56
2.11.5 Ethnicity
Screened population
A - White British B - White IrishC - Any other White background D - White and Black CaribbeanE - White and Black African F - White and AsianG - Any other mixed background H - IndianJ - Pakistani K - BangladeshiL - Any other Asian background M - Black CaribbeanN - Black African P - Any other Black backgroundR - Chinese S - Any other ethnic categoryZ - Not stated
MCADD PKU
CHT CF

Data Collection and Performance Analysis Report: Newborn Blood Spot Screening in the UK 2013-14
57
2.11.6 Sickle cell disease (SCD)
There were approximately 668,000 babies screened through newborn blood spot
screening in England. Of these, 319 were identified as affected by significant conditions
(approximately 1 in 2,000 babies screened) and 8,850 were identified with carrier
results (approximately 1 in 76 babies screened).
There were 668,117 babies reported as being screened by newborn screening
laboratories in 2013/14. This represents a decrease in numbers screened compared to
previous years, but this drop is also reflected in ONS birth figures for 2013. Significant
conditions are most prevalent in black African and black Caribbean backgrounds, but
these conditions are not exclusive to these ethnic categories. In 2013/14 five affected
cases were identified as white British, or one in 64 cases identified with significant
conditions.
Declined newborn screening tests for sickle cell disease have continued to increase
and are now at approximately 1%. Nationally the rates for post-transfusion samples
appear to have increased, although this appears to mainly be due to an increase in the
South East Coast region.
Whilst beta thalassaemia is not currently screened for in newborn screening, F-only
cases are picked up as a by-product of screening for sickle cell disease. These are
probable beta thalassaemia major cases and require follow-up. In 2013/14 there were
32 F-only cases reported by the newborn laboratories.
The Sickle Cell and Thalassaemia (SCT) Screening Programme has expanded the
data requested on timeliness of newborn screening to include anonymised data on
screening outcomes. Data for these new fields were requested for 2013/14 so that the
programme could assess whether they are appropriate, but will only be reported from
2014/15. Preliminary findings from incomplete data based on 292 babies with
significant conditions of F-only results suggest that the median age for reporting a
screen positive result is 15 days. This suggests that the system is capable of meeting
the 28 day standard for informing parents of results.

Data Collection and Performance Analysis Report: Newborn Blood Spot Screening in the UK 2013-14
58
3. Conclusion
This is the first data report that reflects the 2013 standards for newborn blood spot
screening
This is the tenth annual data report and year-on-year data are available on some of the
original standards
Data on standard 1b (completeness of coverage, movers in) will be available in the
2014-15 data report having applied an effective timeframe of 21 calendar days of
movement in being recorded on the child health information system
Once all laboratories are providing full screening results to the NBSFS, more detailed
data on standards 6 and 7 (blood spot quality and timeliness of repeat sample) will be
available. This data will reflect postnatal services’ responsibility for screening
The programme will continue to seek ways of improving outcome data collection, which
will enable enhanced evaluation of the screening protocols
Data on performance of the expanded newborn screening programme will be presented
in the 2014-15 report
The work of the programme reflects improved partnership working with stakeholders,
Public Health England and NHS England

Data Collection and Performance Analysis Report: Newborn Blood Spot Screening in the UK 2013-14
59
4. Resources
[1] NHS England (2014) NHS public health Functions agreement 2015-16 Service
specification no.19, NHS Newborn Blood Spot Screening Programme [Online] Available:
https://www.gov.uk/government/publications/public-health-commissioning-in-the-nhs-
2015-to-2016 [Accessed: July 2015]
[2] NHS Newborn Blood Spot Screening Programme (2013) Standards for newborn blood
spot screening [Online] Available:
https://www.gov.uk/government/publications/standards-for-nhs-newborn-blood-spot-
screening [Accessed: July 2015]
[3] NHS Newborn Blood Spot Screening Programme (2015) A laboratory guide to newborn
blood spot screening for inherited metabolic diseases [Online] Available:
https://www.gov.uk/government/publications/newborn-blood-spot-screening-laboratory-
guide-for-imds [Accessed: July 2015]
[4] NHS Newborn Blood Spot Screening Programme (2014) A laboratory guide to newborn
blood spot screening in the UK for congenital hypothyroidism [Online] Available:
https://www.gov.uk/government/publications/congenital-hypothyroidism-screening-
laboratory-handbook [Accessed: July 2015]
[5] NHS Newborn Blood Spot Screening Programme (2014) A laboratory guide to newborn
blood spot screening in the UK for cystic fibrosis [Online] Available:
https://www.gov.uk/government/publications/cystic-fibrosis-screening-laboratory-
handbook [Accessed: July 2015]
[6] UK Newborn Screening Programme Centre (2005) National standard protocol for
newborn screening for cystic fibrosis: Guidelines for clinical referral [Online] Available:
https://www.gov.uk/government/publications/clinical-referral-national-standard-protocol-
for-cystic-fibrosis [Accessed: July 2015]
[7] Knowles, R. and Olafsdottir, F. (2012) Initial Clinical Referral Standards after Newborn
Screening for Congenital Hypothyroidism: Draft Report of the UK Newborn Screening
Programme Centre (UKNSPC) Expert Working Group and Systematic Evidence Review
2010-2011 [Online] Available:
http://openhealthdata.metajnl.com/articles/10.5334/jophd.ae/ [Accessed: July 2015]
[8] NHS Newborn Blood Spot Screening Programme / NHS Connecting for Health (2014)
NHS Numbers for Newborn Screening: Output Based Specification for the Blood Spot
Card Label v3.4 [Online] Available: https://www.gov.uk/government/publications/nhs-

Data Collection and Performance Analysis Report: Newborn Blood Spot Screening in the UK 2013-14
60
numbers-for-newborn-screening-specification-for-the-blood-spot-card-label [Accessed:
July 2015]