data collection & analysis as input for o&m cost...
TRANSCRIPT
Data collection & analysis as input for O&M cost modelling This paper was presented at Windpower Monthly Wind Farm Data Management & Analysis Forum, 20-21 November 2012, Hamburg, Germany
René van de Pieterman December 2012 ECN-M--12-076

ECN-M--12-0 Fout! Geen tekst met de opgegeven stijl in he
ECN Westerduinweg 3 P.O. Box 1 1755 LE Petten 1755 LG Petten The Netherlands The Netherlands T +31 88 515 4949 F +31 88 515 8338 info@ ecn.nl www.ecn.nl

www.ecn.nl
Data collection & analysis as
input for O&M cost modelling
Windpower Monthly forum
Wind Farm Data Management & Analysis
René van de Pieterman Hamburg, 20-21 November 2012
2
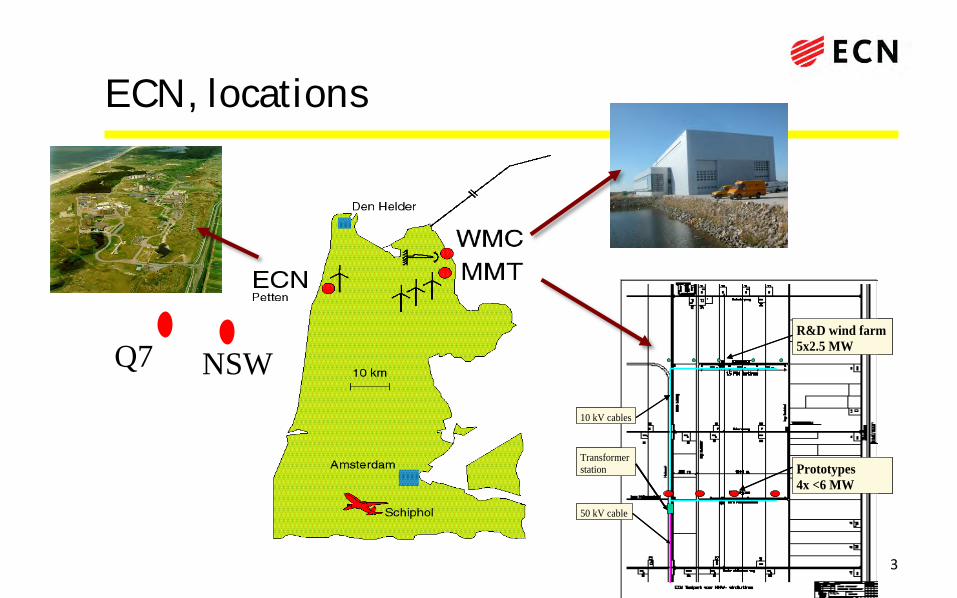
ECN, locations
50 kV cable
Transformerstation
10 kV cables
R&D wind farm
5x2.5 MW
Prototypes
4x <6 MW
50 kV cable
Transformerstation
10 kV cables
R&D wind farm
5x2.5 MW
Prototypes
4x <6 MW
Q7 NSW
3
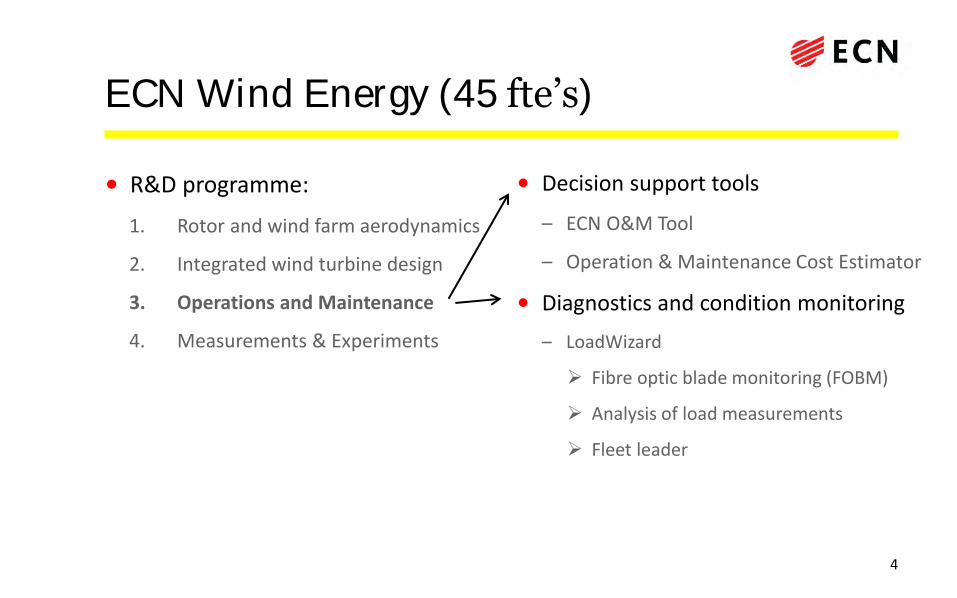
• R&D programme:
1. Rotor and wind farm aerodynamics
2. Integrated wind turbine design
3. Operations and Maintenance
4. Measurements & Experiments
ECN Wind Energy (45 fte’s)
4
• Decision support tools
– ECN O&M Tool
– Operation & Maintenance Cost Estimator
• Diagnostics and condition monitoring
– LoadWizard
Fibre optic blade monitoring (FOBM)
Analysis of load measurements
Fleet leader
Contents
• Introduction
• Structuring of raw data for O&M purposes
• Data analysis for reliability engineering and O&M optimisation
• Maintenance cost modelling
• Conclusions & acknowledgements
5
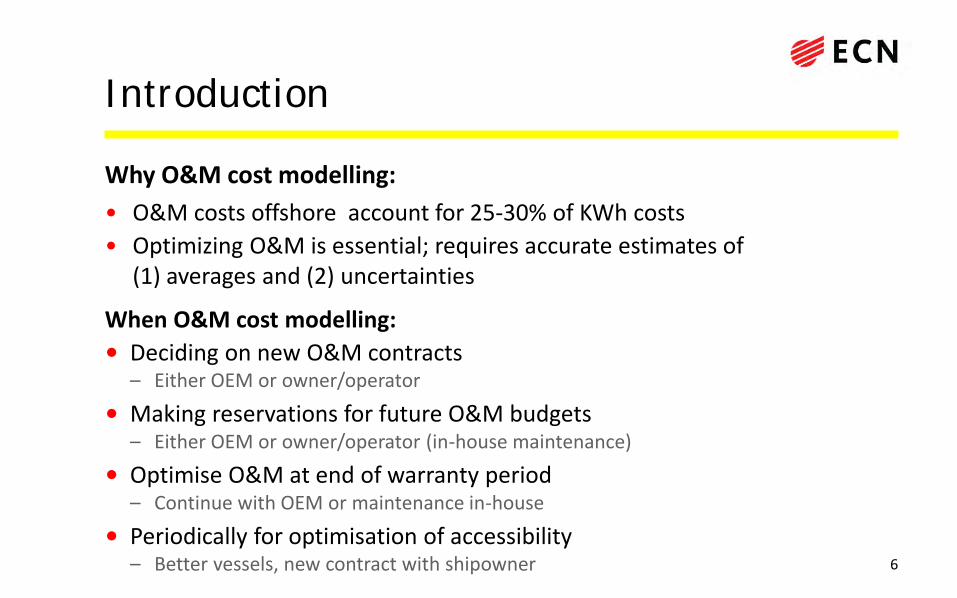
Introduction
Why O&M cost modelling:
• O&M costs offshore account for 25-30% of KWh costs
• Optimizing O&M is essential; requires accurate estimates of (1) averages and (2) uncertainties
When O&M cost modelling:
• Deciding on new O&M contracts – Either OEM or owner/operator
• Making reservations for future O&M budgets – Either OEM or owner/operator (in-house maintenance)
• Optimise O&M at end of warranty period – Continue with OEM or maintenance in-house
• Periodically for optimisation of accessibility – Better vessels, new contract with shipowner
6
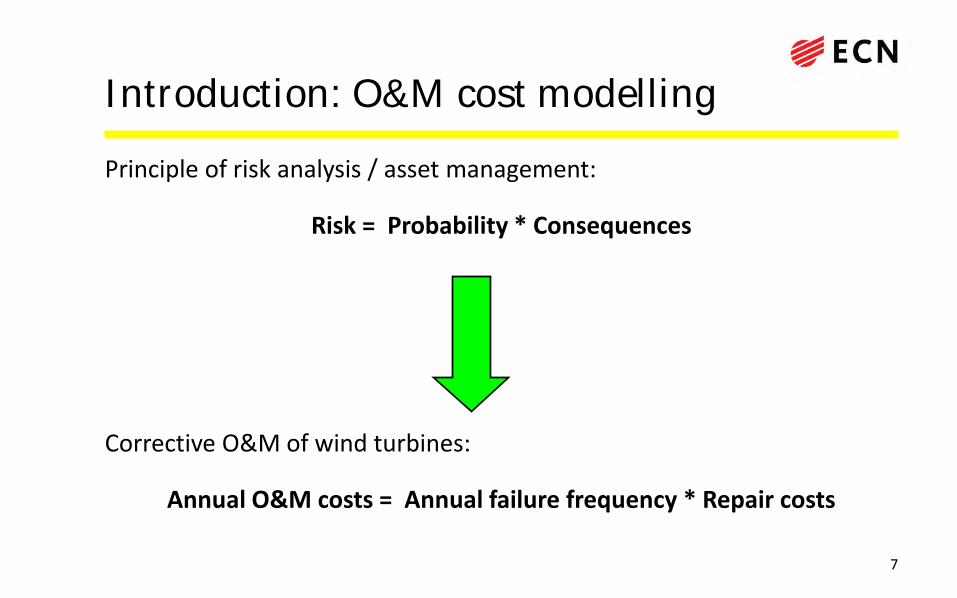
Introduction: O&M cost modelling
Principle of risk analysis / asset management:
Risk = Probability * Consequences
Corrective O&M of wind turbines:
Annual O&M costs = Annual failure frequency * Repair costs
7
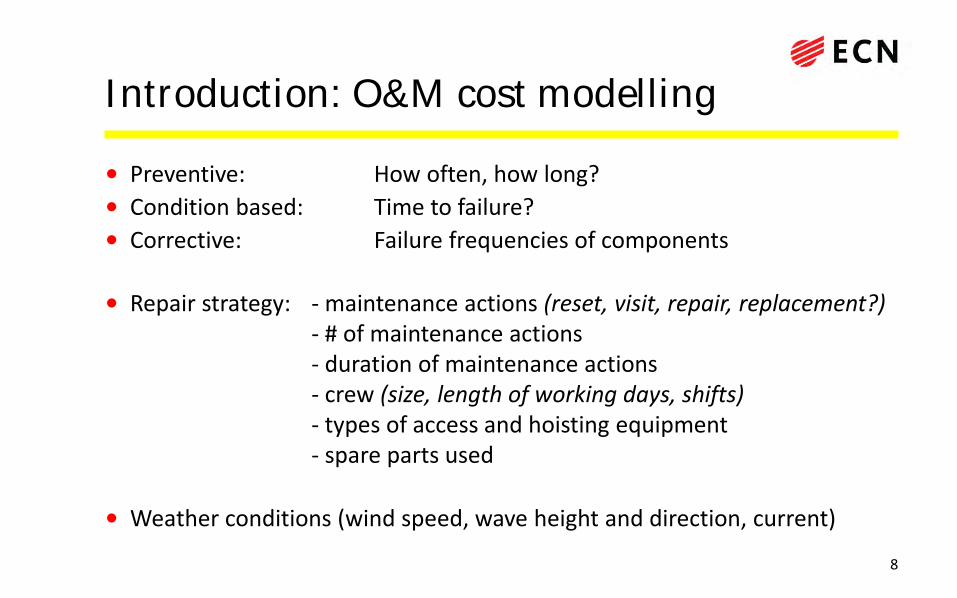
Introduction: O&M cost modelling
• Preventive: How often, how long?
• Condition based: Time to failure?
• Corrective: Failure frequencies of components
• Repair strategy: - maintenance actions (reset, visit, repair, replacement?) - # of maintenance actions - duration of maintenance actions - crew (size, length of working days, shifts) - types of access and hoisting equipment - spare parts used
• Weather conditions (wind speed, wave height and direction, current)
8
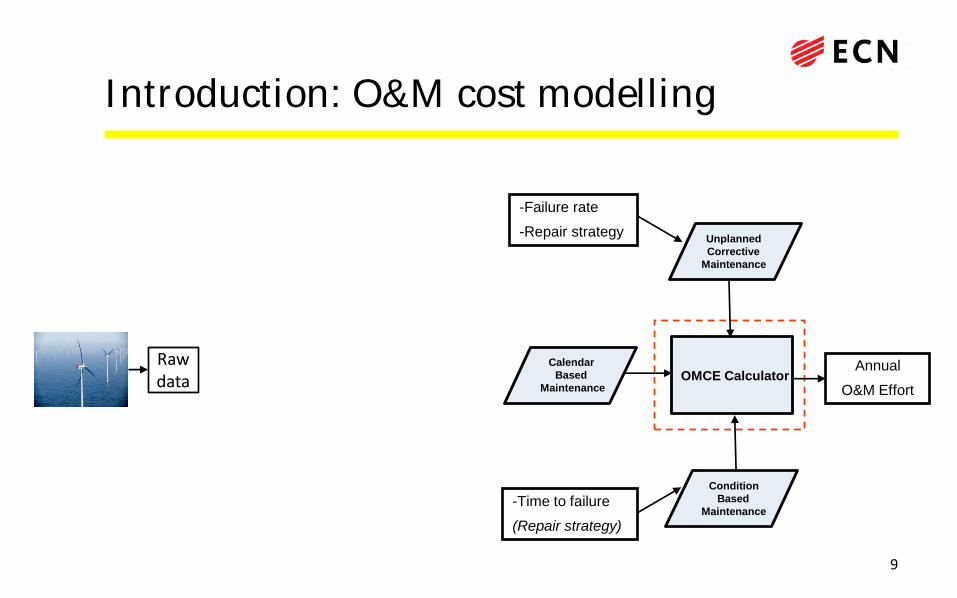
-Failure rate
-Repair strategy
-Time to failure
(Repair strategy)
Introduction: O&M cost modelling
Annual
O&M Effort OMCE Calculator
Condition Based
Maintenance
Unplanned Corrective
Maintenance
Calendar Based
Maintenance
Raw data
9
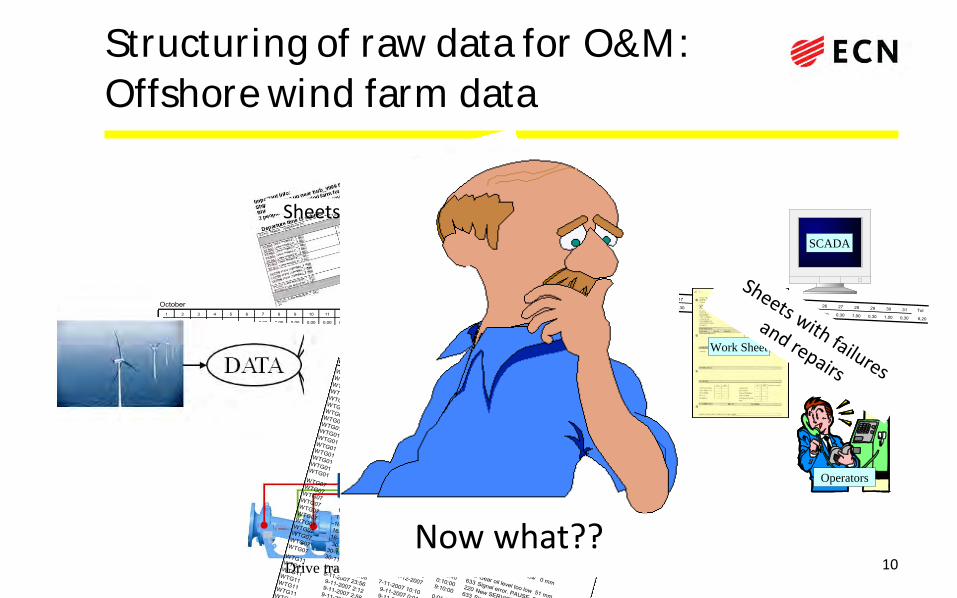
Structuring of raw data for O&M:
Offshore wind farm data
Drive train monitoringDrive train monitoring
Sheets with vessels used
October1 2 3 4 5 6 7 8 9 10 11 12 13 14 15 16 17 18 19 20 21 22 23 24 25 26 27 28 29 30 31 Tot
0,00 0,00 0,00 0,00 0,00 0,00 0,00 0,00 0,00 0,00 0,00 0,00 0,00 0,00 0,00 1,00 0,30 1,00 1,00 0,00 0,00 0,00 0,00 0,00 0,00 0,00 0,30 1,00 0,30 1,00 0,30 6,20
October1 2 3 4 5 6 7 8 9 10 11 12 13 14 15 16 17 18 19 20 21 22 23 24 25 26 27 28 29 30 31 Tot
0,00 0,00 0,00 0,00 0,00 0,00 0,00 0,00 0,00 0,00 0,00 0,00 0,00 0,00 0,00 1,00 0,30 1,00 1,00 0,00 0,00 0,00 0,00 0,00 0,00 0,00 0,30 1,00 0,30 1,00 0,30 6,20
UnitDetected
Reset/Run
DurationCode Description
WTG019-11-2007 0:29
9-11-2007 0:310:01:27 356 Extreme yawerror 24.1m/s 20.0°
WTG019-11-2007 2:16
9-11-2007 2:200:03:21 356 Extreme yawerror 25.1m/s 0.0°
WTG019-11-2007 2:20
9-11-2007 2:300:09:23 144 High windspeed: 20.5 m/s
WTG019-11-2007 3:59
9-11-2007 4:060:06:15 356 Extreme yawerror 25.1m/s 0.0°
WTG019-11-2007 4:15
9-11-2007 4:200:04:05 144 High windspeed: 44.7 m/s
WTG019-11-2007 9:30
9-11-2007 9:400:09:56 156 Chock sensor trigged: 0.0RPM
WTG019-11-2007 9:49
9-11-2007 9:500:00:47 224 Pause
WTG019-11-2007 10:58
9-11-2007 11:000:01:25 356 Extreme yawerror 0.0m/s 0.0°
WTG019-11-2007 11:09
9-11-2007 11:100:00:21 224 Pause
WTG019-11-2007 12:39
9-11-2007 12:400:01:00 356 Extreme yawerror 26.5m/s 19.5°
WTG019-11-2007 14:47
9-11-2007 14:500:03:00 356 Extreme yawerror 25.1m/s 0.0°
WTG019-11-2007 14:52
9-11-2007 15:000:07:47 144 High windspeed: 19.8 m/s
WTG019-11-2007 16:29
9-11-2007 16:300:00:59 356 Extreme yawerror 19.9m/s 21.7°
WTG0111-11-2007 23:47 11-11-2007 23:50
0:02:01 356 Extreme yawerror 0.0m/s 0.0°
WTG0115-11-2007 13:56 15-11-2007 14:00
0:03:23 220 New SERVICE state: 0, 0
WTG0115-11-2007 23:09 15-11-2007 23:49
0:39:50 276 Start auto-outyawing CCW
WTG072-11-2007 11:03
2-11-2007 11:100:06:27 224 Pause
WTG072-11-2007 11:10
16-11-2007 8:29 333:19:25 223 Stop
WTG0716-11-2007 8:30 16-11-2007 13:36
5:06:48 220 New SERVICE state: 9, 0
WTG0716-11-2007 13:42 16-11-2007 13:50
0:07:59 840 Gear oil level too low 0 mm
WTG0716-11-2007 13:52 16-11-2007 14:00
0:07:48 222 Emergency
WTG0716-11-2007 14:08 16-11-2007 14:20
0:11:21 840 Gear oil level too low 0 mm
WTG0716-11-2007 14:27 16-11-2007 14:30
0:02:32 223 Stop
WTG0716-11-2007 14:37 16-11-2007 14:51
0:14:21 840 Gear oil level too low 51 mm
WTG0730-11-2007 0:53 30-11-2007 14:40 13:46:40 633 Signal error. PAUSE 0, 0
WTG0730-11-2007 14:40 30-11-2007 14:50
0:10:00 220 New SERVICE state: 0, 22
WTG0730-11-2007 14:50
1-12-20079:10:00 633 Signal error. PAUSE 50,22
WTG117-11-2007 10:08
7-11-2007 10:100:01:43 220 New SERVICE state: 1, 0
WTG118-11-2007 23:56
9-11-2007 0:010:04:58 144 High windspeed: 25.1 m/s
WTG119-11-2007 2:12
9-11-2007 2:250:12:41 144 High windspeed: 20.8 m/s
WTG119-11-2007 2:58
9-11-2007 3:000:01:30 356 Extreme yawerror 25.1m/s 0.0°
WTG119-11-2007 3:59
9-11-2007 4:070:08:09 144 High windspeed: 25.1 m/s
WTG119-11-2007 14:45
9-11-2007 14:520:07:02 144 High windspeed: 21.5 m/s
WTG119-11-2007 16:18
9-11-2007 16:200:01:40 356 Extreme yawerror 21.9m/s 20.8°
WTG119-11-2007 19:18
9-11-2007 19:200:01:35 356 Extreme yawerror 20.3m/s 21.1°
WTG1110-11-2007 0:49
10-11-2007 0:500:01:00 356 Extreme yawerror 17.8m/s 24.7°
WTG1110-11-2007 10:09 10-11-2007 10:10
0:01:00 356 Extreme yawerror 18.6m/s 26.2°
WTG1111-11-2007 20:18 11-11-2007 20:20
0:01:51 356 Extreme yawerror 19.0m/s 23.8°
WTG1111-11-2007 23:47 11-11-2007 23:50
0:02:25 356 Extreme yawerror 9.8m/s 37.4°
WTG1113-11-2007 12:55 13-11-2007 13:00
0:04:41 356 Extreme yawerror 0.0m/s 0.0°
WTG1113-11-2007 13:09 13-11-2007 13:10
0:00:23 224 Pause
WTG211-11-2007 0:10
1-12-2007 719:50:00 226 Power cutout
Now what??
SCADASCADA
Work SheetWork Sheet
OperatorsOperators
10
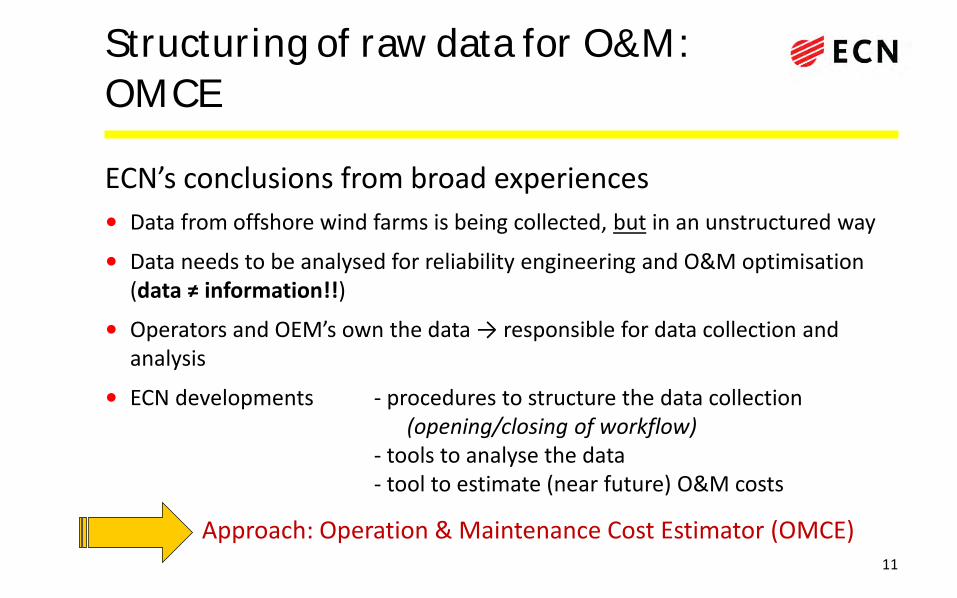
Structuring of raw data for O&M:
OMCE
ECN’s conclusions from broad experiences
• Data from offshore wind farms is being collected, but in an unstructured way
• Data needs to be analysed for reliability engineering and O&M optimisation (data ≠ information!!)
• Operators and OEM’s own the data → responsible for data collection and analysis
• ECN developments - procedures to structure the data collection (opening/closing of workflow) - tools to analyse the data - tool to estimate (near future) O&M costs
Approach: Operation & Maintenance Cost Estimator (OMCE) 11
-Failure rate
-Repair strategy
-Time to failure
(Repair strategy)
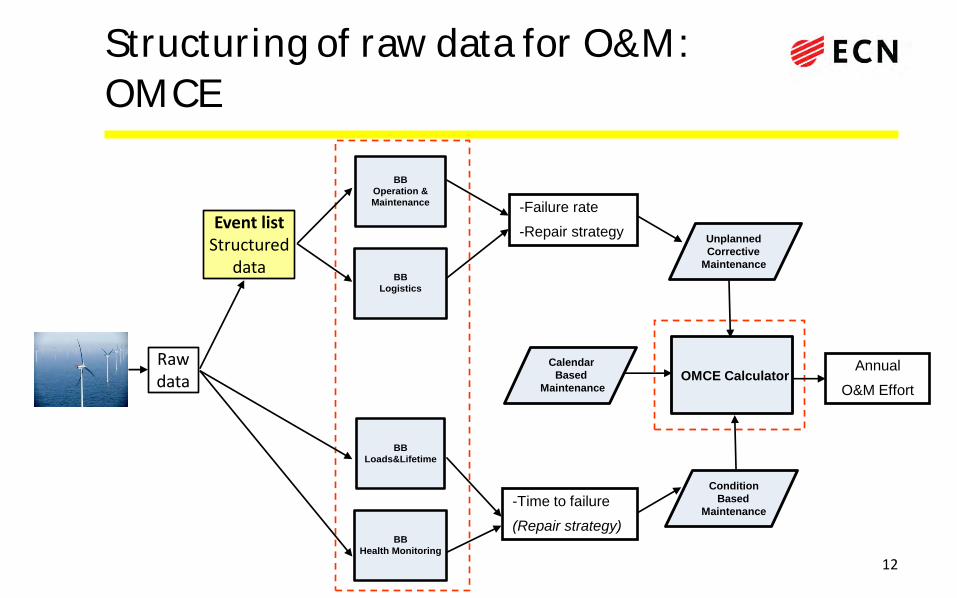
Structuring of raw data for O&M:
OMCE
BB
Operation &
Maintenance
BB
Loads&Lifetime
BB
Health Monitoring
BB
Logistics
Annual
O&M Effort OMCE Calculator
Condition Based
Maintenance
Unplanned Corrective
Maintenance
Calendar Based
Maintenance
Raw data
Event list Structured
data
12
Structuring of raw data for O&M:
Event List
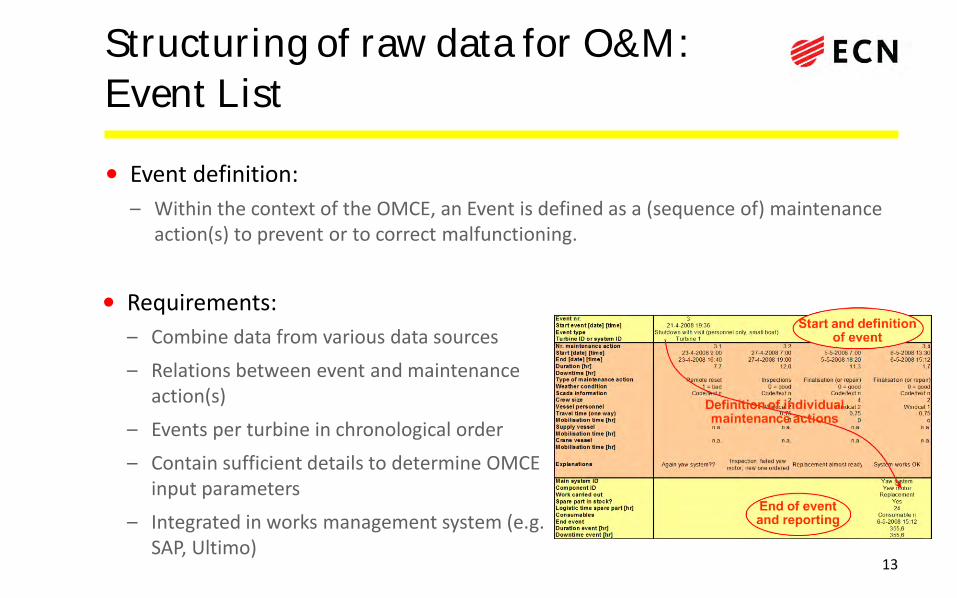
• Event definition:
– Within the context of the OMCE, an Event is defined as a (sequence of) maintenance action(s) to prevent or to correct malfunctioning.
• Requirements:
– Combine data from various data sources
– Relations between event and maintenance action(s)
– Events per turbine in chronological order
– Contain sufficient details to determine OMCE input parameters
– Integrated in works management system (e.g. SAP, Ultimo)
13
RWE
Structuring of raw data for O&M:
Event List, practical example
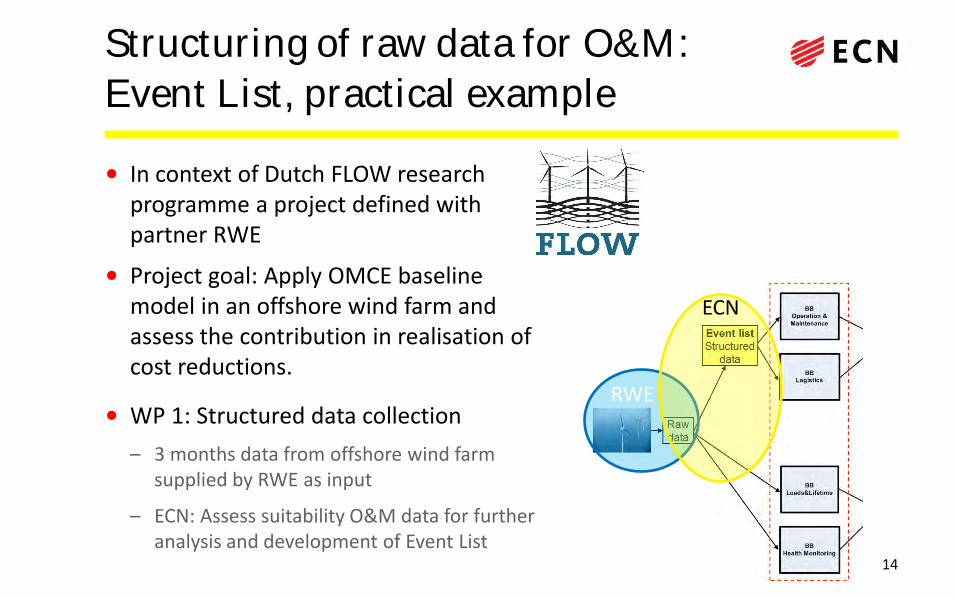
• In context of Dutch FLOW research programme a project defined with partner RWE
• Project goal: Apply OMCE baseline model in an offshore wind farm and assess the contribution in realisation of cost reductions.
• WP 1: Structured data collection
– 3 months data from offshore wind farm supplied by RWE as input
– ECN: Assess suitability O&M data for further analysis and development of Event List
ECN
14
Structuring of raw data for O&M:
Event List, practical example
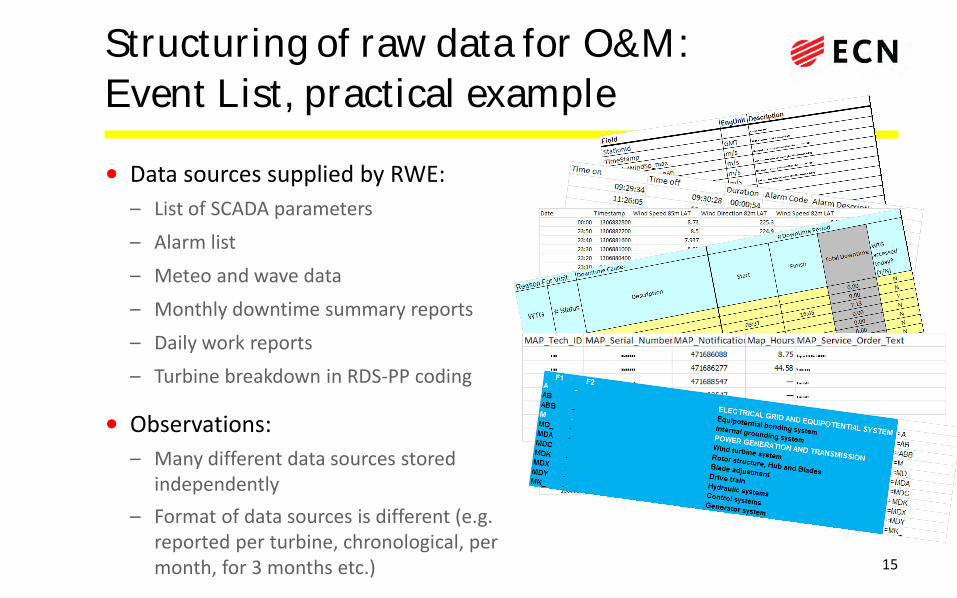
• Data sources supplied by RWE:
– List of SCADA parameters
– Alarm list
– Meteo and wave data
– Monthly downtime summary reports
– Daily work reports
– Turbine breakdown in RDS-PP coding
• Observations:
– Many different data sources stored independently
– Format of data sources is different (e.g. reported per turbine, chronological, per month, for 3 months etc.)
15
Structuring of raw data for O&M:
Event List, practical example
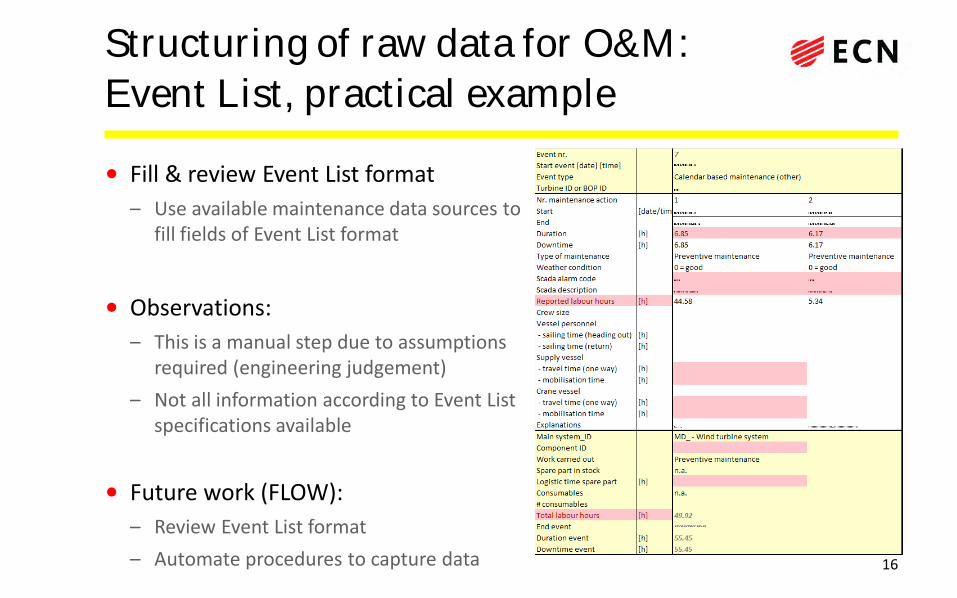
• Fill & review Event List format
– Use available maintenance data sources to fill fields of Event List format
• Observations:
– This is a manual step due to assumptions required (engineering judgement)
– Not all information according to Event List specifications available
• Future work (FLOW):
– Review Event List format
– Automate procedures to capture data
16
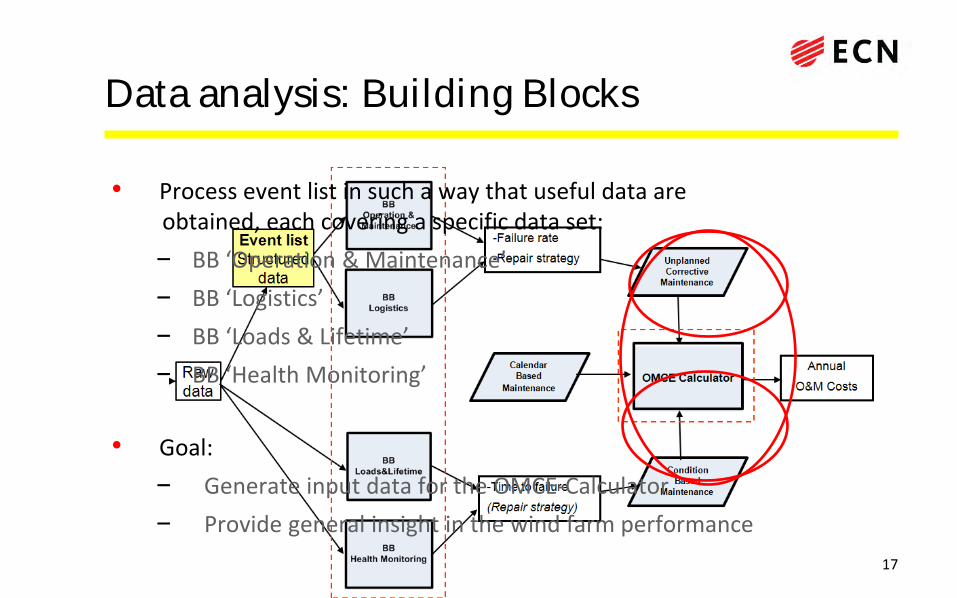
Data analysis: Building Blocks
• Process event list in such a way that useful data are obtained, each covering a specific data set:
− BB ‘Operation & Maintenance’
− BB ‘Logistics’
− BB ‘Loads & Lifetime’
− BB ‘Health Monitoring’
• Goal:
− Generate input data for the OMCE-Calculator
− Provide general insight in the wind farm performance
17
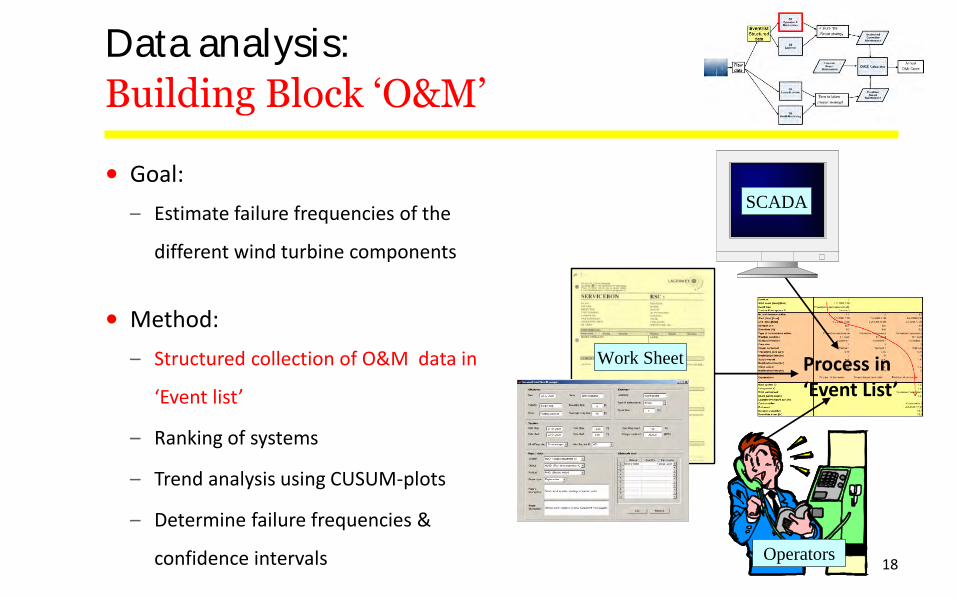
Data analysis:
Building Block ‘O&M’
• Goal:
– Estimate failure frequencies of the
different wind turbine components
• Method:
– Structured collection of O&M data in
‘Event list’
– Ranking of systems
– Trend analysis using CUSUM-plots
– Determine failure frequencies &
confidence intervals
SCADASCADA
Work SheetWork Sheet
OperatorsOperators
Process in ‘Event List’
18
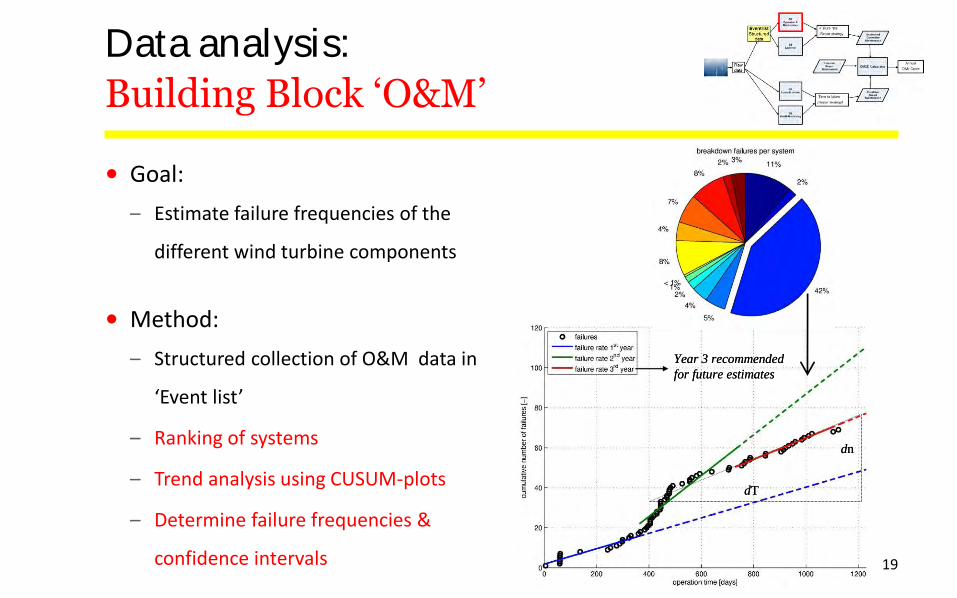
Data analysis:
Building Block ‘O&M’
• Goal:
– Estimate failure frequencies of the
different wind turbine components
• Method:
– Structured collection of O&M data in
‘Event list’
– Ranking of systems
– Trend analysis using CUSUM-plots
– Determine failure frequencies &
confidence intervals
Year 3 recommended
for future estimates
dT
dn
Year 3 recommended
for future estimates
dT
dn
Year 3 recommended
for future estimates
dT
dn
Year 3 recommended
for future estimates
dT
dn
19
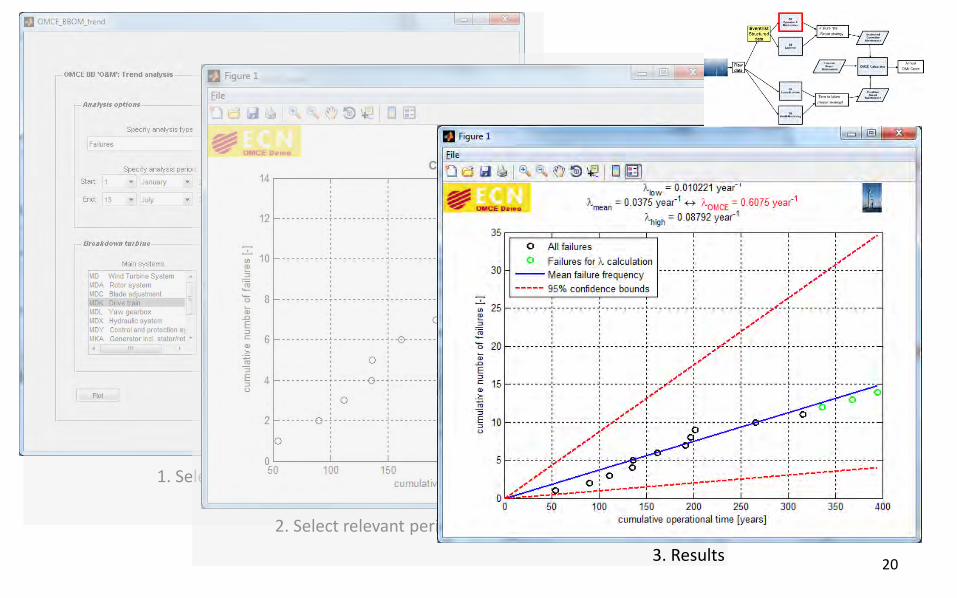
1. Select turbinesc, component , and FTC
2. Select relevant period from CUSUM plot
3. Results 20
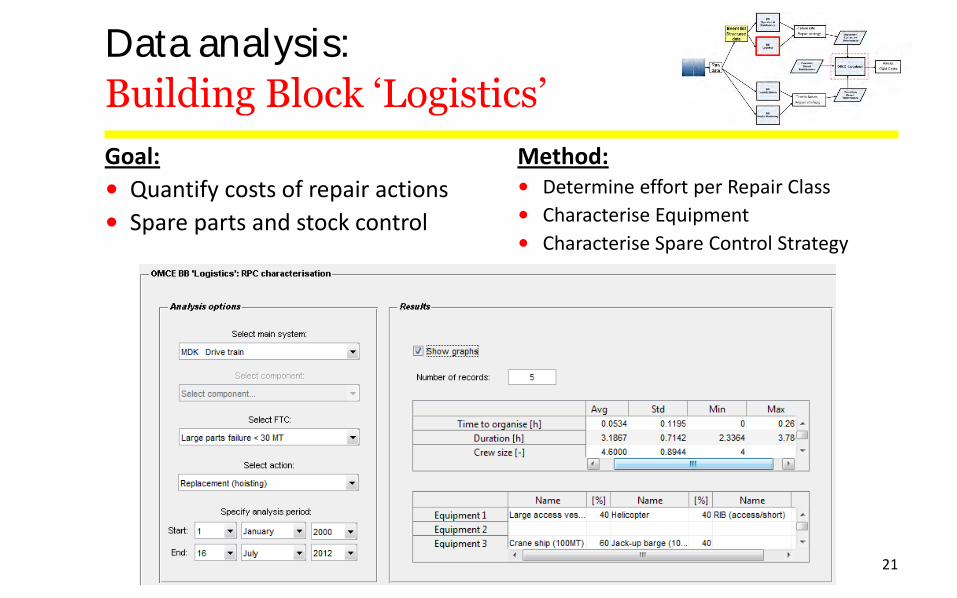
Data analysis:
Building Block ‘Logistics’
Goal:
• Quantify costs of repair actions
• Spare parts and stock control
Method: • Determine effort per Repair Class
• Characterise Equipment
• Characterise Spare Control Strategy
21
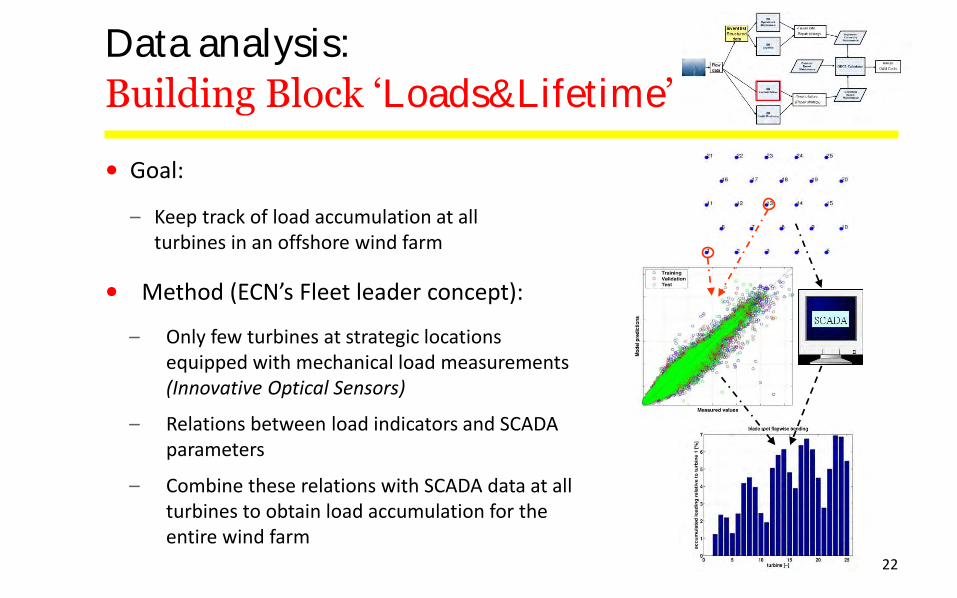
Data analysis:
Building Block ‘Loads&Lifetime’
• Goal:
– Keep track of load accumulation at all turbines in an offshore wind farm
• Method (ECN’s Fleet leader concept):
– Only few turbines at strategic locations equipped with mechanical load measurements (Innovative Optical Sensors)
– Relations between load indicators and SCADA parameters
– Combine these relations with SCADA data at all turbines to obtain load accumulation for the entire wind farm
22
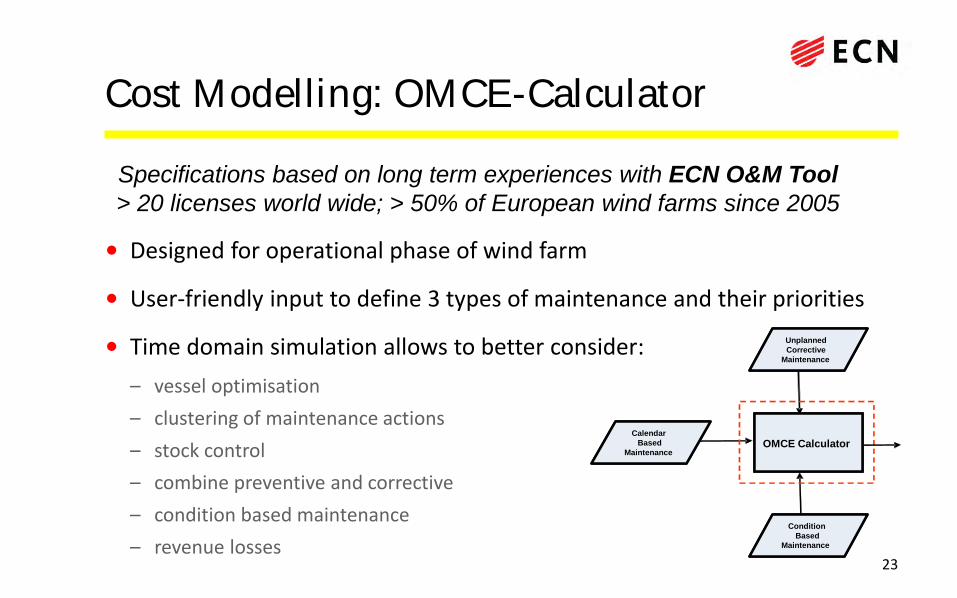
Cost Modelling: OMCE-Calculator
• Designed for operational phase of wind farm
• User-friendly input to define 3 types of maintenance and their priorities
• Time domain simulation allows to better consider:
– vessel optimisation
– clustering of maintenance actions
– stock control
– combine preventive and corrective
– condition based maintenance
– revenue losses
Specifications based on long term experiences with ECN O&M Tool
> 20 licenses world wide; > 50% of European wind farms since 2005
OMCE Calculator
Condition Based
Maintenance
Unplanned Corrective
Maintenance
Calendar Based
Maintenance OMCE Calculator
Condition Based
Maintenance
Unplanned Corrective
Maintenance
Calendar Based
Maintenance
23
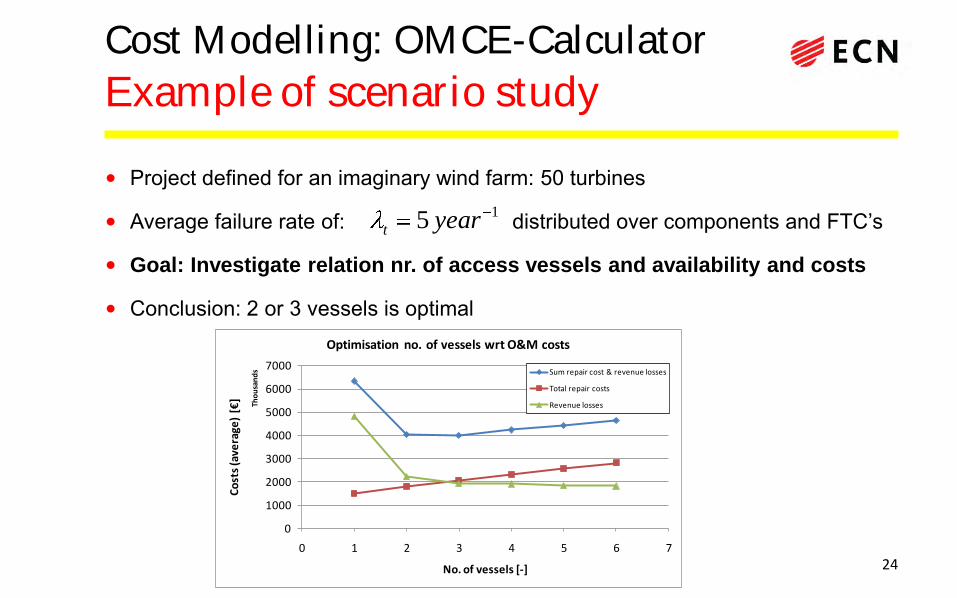
Cost Modelling: OMCE-Calculator
Example of scenario study
• Project defined for an imaginary wind farm: 50 turbines
• Average failure rate of: distributed over components and FTC’s
• Goal: Investigate relation nr. of access vessels and availability and costs
• Conclusion: 2 or 3 vessels is optimal
15 yeart
0
1000
2000
3000
4000
5000
6000
7000
0 1 2 3 4 5 6 7
Co
sts
(ave
rage
) [€
]
Tho
usa
nd
s
No. of vessels [-]
Optimisation no. of vessels wrt O&M costs
Sum repair cost & revenue losses
Total repair costs
Revenue losses
24
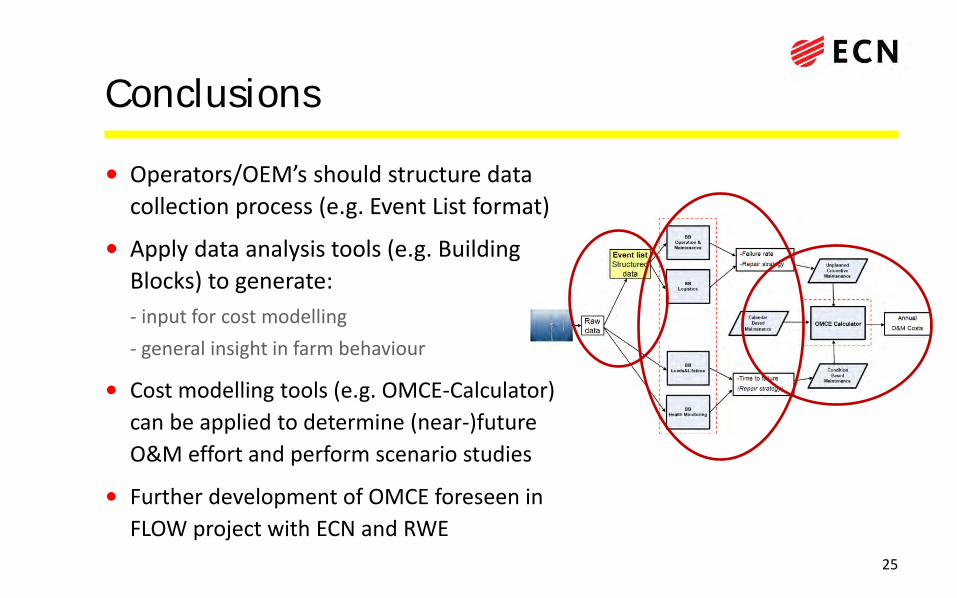
Conclusions
• Operators/OEM’s should structure data
collection process (e.g. Event List format)
• Apply data analysis tools (e.g. Building
Blocks) to generate:
- input for cost modelling
- general insight in farm behaviour
• Cost modelling tools (e.g. OMCE-Calculator)
can be applied to determine (near-)future
O&M effort and perform scenario studies
• Further development of OMCE foreseen in
FLOW project with ECN and RWE
25
Thank you for your attention
This project is sponsored by the Dutch Far and Large Offshore Wind programme (FLOW)
ECN
Westerduinweg 3 P.O. Box 1
1755 LE Petten 1755 ZG Petten
The Netherlands The Netherlands
T +31 88 515 49 49 [email protected]
F +31 88 515 44 80 www.ecn.nl
"If we knew what it was we were doing, it
would not be called research, would it?"
Albert Einstein 26

Questions
27

End of presentation