data classification in distributed computing...
TRANSCRIPT

Data Classification in Distributed Computing Environments: Getting off to a Good Start By Jon William Toigo Chairman, Data Management Institute Managing Partner, Toigo Partners International 1538 Patricia Avenue, Dunedin, Florida 34698 USA +1-727-736-5367 [email protected] www.toigopartners.com www.datainstitute.org Executive Summary Regulatory compliance has finally created a sufficiently compelling case for business leaders to underwrite the development a disciplined data management strategy for their distributed computing environments. As a result, companies are expected to spend upwards of $80M (US) by 2007 to develop data management and control mechanisms for fulfilling their obligations under a series of recent laws specifying data accessibility, privacy, and retention requirements. First to seize on the new and potentially lucrative opportunity represented by the sudden interest in data management are the monolithic storage vendors, led by Hopkinton, MA-based EMC Corporation. Courtesy of a well-funded marketing campaign, EMC has re-introduced the term “Information Lifecycle Management” (ILM) into the vernacular of tech speak. Many others in the industry, offering products as diverse as SATA disk arrays, Fibre Channel fabrics, email archiving software, and content management software, have been quick to jump on EMC’s marketing bandwagon, redefining their products as “ILM solutions.” Truth be told, no vendor today has a comprehensive data management solution. This paper covers the components that must be part of such a solution and provides initial steps that consumers can take to begin building a managed data environment.
Copyright © 2005 by Toigo Partners International. All Rights Reserved. 2
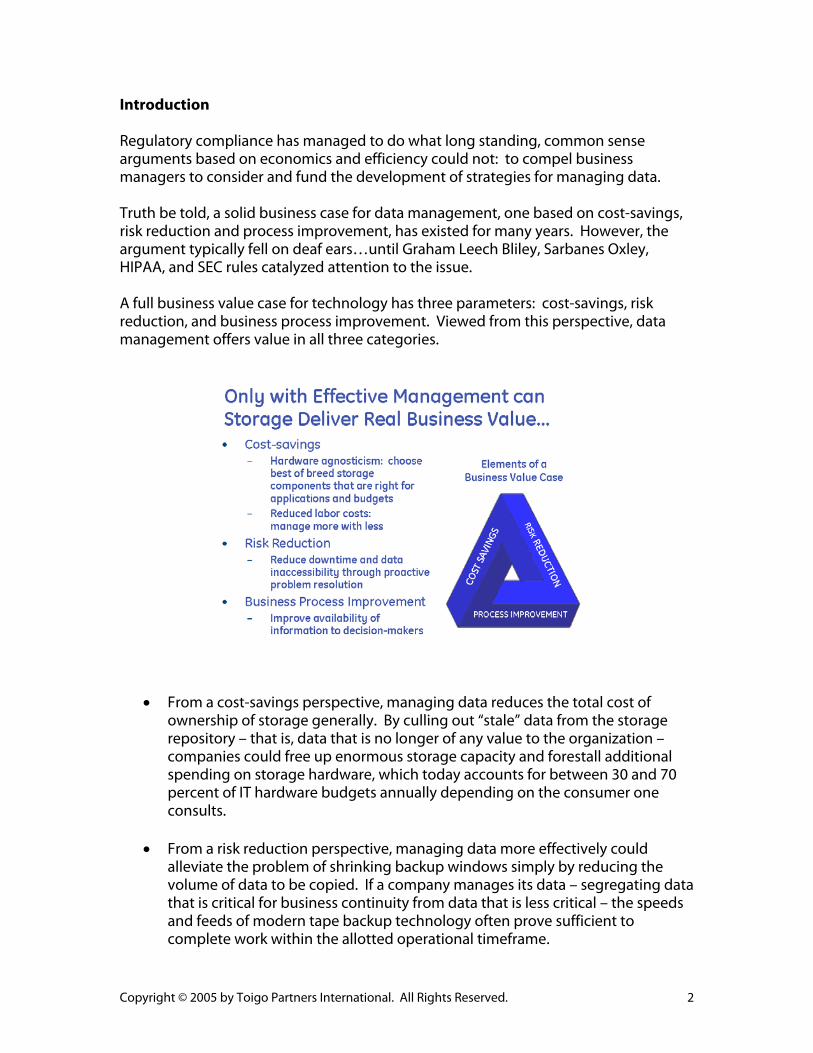
Introduction Regulatory compliance has managed to do what long standing, common sense arguments based on economics and efficiency could not: to compel business managers to consider and fund the development of strategies for managing data. Truth be told, a solid business case for data management, one based on cost-savings, risk reduction and process improvement, has existed for many years. However, the argument typically fell on deaf ears…until Graham Leech Bliley, Sarbanes Oxley, HIPAA, and SEC rules catalyzed attention to the issue. A full business value case for technology has three parameters: cost-savings, risk reduction, and business process improvement. Viewed from this perspective, data management offers value in all three categories.
• From a cost-savings perspective, managing data reduces the total cost of
ownership of storage generally. By culling out “stale” data from the storage repository – that is, data that is no longer of any value to the organization – companies could free up enormous storage capacity and forestall additional spending on storage hardware, which today accounts for between 30 and 70 percent of IT hardware budgets annually depending on the consumer one consults.
• From a risk reduction perspective, managing data more effectively could
alleviate the problem of shrinking backup windows simply by reducing the volume of data to be copied. If a company manages its data – segregating data that is critical for business continuity from data that is less critical – the speeds and feeds of modern tape backup technology often prove sufficient to complete work within the allotted operational timeframe.
Copyright © 2005 by Toigo Partners International. All Rights Reserved. 3
• From a process improvement perspective, data models prepared as part of the
data management strategy development process can have enormous ancillary value to business decision makers. Data models are created by deconstructing business processes, identifying the applications that support specific tasks and workflows, and discovering the data used by and produced by each application. Mapped to platform and labor costs, such data can be used to create an effective model of IT support costs on a line of business basis that can be of enormous probative and predictive value to business decision makers.
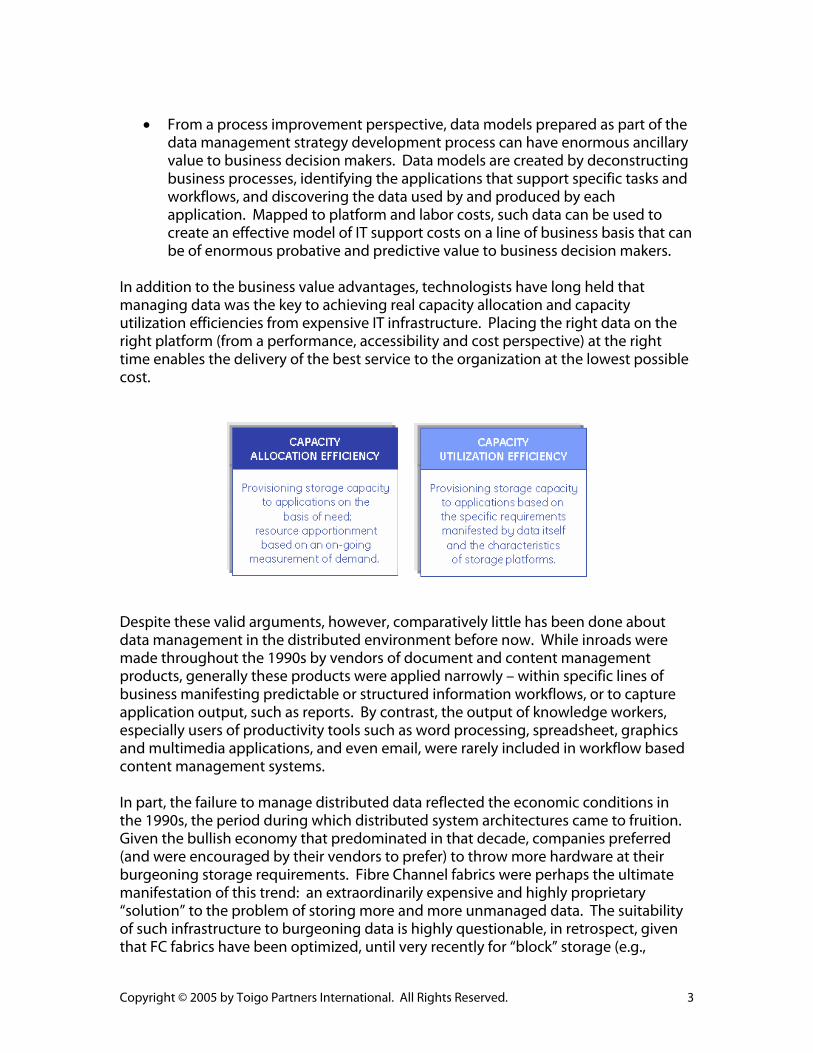
In addition to the business value advantages, technologists have long held that managing data was the key to achieving real capacity allocation and capacity utilization efficiencies from expensive IT infrastructure. Placing the right data on the right platform (from a performance, accessibility and cost perspective) at the right time enables the delivery of the best service to the organization at the lowest possible cost.
Despite these valid arguments, however, comparatively little has been done about data management in the distributed environment before now. While inroads were made throughout the 1990s by vendors of document and content management products, generally these products were applied narrowly – within specific lines of business manifesting predictable or structured information workflows, or to capture application output, such as reports. By contrast, the output of knowledge workers, especially users of productivity tools such as word processing, spreadsheet, graphics and multimedia applications, and even email, were rarely included in workflow based content management systems. In part, the failure to manage distributed data reflected the economic conditions in the 1990s, the period during which distributed system architectures came to fruition. Given the bullish economy that predominated in that decade, companies preferred (and were encouraged by their vendors to prefer) to throw more hardware at their burgeoning storage requirements. Fibre Channel fabrics were perhaps the ultimate manifestation of this trend: an extraordinarily expensive and highly proprietary “solution” to the problem of storing more and more unmanaged data. The suitability of such infrastructure to burgeoning data is highly questionable, in retrospect, given that FC fabrics have been optimized, until very recently for “block” storage (e.g.,

Copyright © 2005 by Toigo Partners International. All Rights Reserved. 4
databases), while most data growth within organizations worldwide has occurred within the domain of “unstructured” data (e.g. files) , according to UC Berkeley. Never undertaken by purveyors of large arrays and fabric topologies (and in most cases, side-stepped altogether) was any valid analysis of the root cause of storage scalability requirements. While part of the blame for storage capacity scaling requirements can be placed squarely at the feet of the vendor community, with their poorly designed array products and inadequate capacity management software products (the classic contributors to a phenomenon described as “oversubscription with underutilization”), the main cause of the huge scaling requirements exhibited by organizations in the late 1990s and early 2000s was unmanaged or poorly managed data. Enter the Storage Cost Conundrum Statistics on data proliferation abound from many sources, but what is clear is that failure to manage data effectively accounts for the majority of storage growth in most organizations. From this premise flows the best explanation available for the Storage Cost Conundrum that nearly every organization struggles with today.
• With unmanaged data, storage capacity requirements grow. • With unmanaged storage growth, labor and administration costs increase.
Companies spend upwards of 40 percent of their IT hardware budget annually on storage hardware, and this capital investment is regarded as only a fraction (between 20 and 25 percent) of storage total cost of ownership.
• With increased cost of ownership, IT budgetary requirements accelerate. This
IT budget requirements growth is occurring at precisely the time when organizations are seeking to reduce operational costs.
This is the Storage Cost Conundrum in a nutshell: IT needs to add capacity to keep pace with burgeoning data, but management is telling them to do more with less. Managing data is the only effective way to address the Storage Cost Conundrum, by reducing the demand for storage capacity itself. Getting to a managed data environment, however, is not easy.

Copyright © 2005 by Toigo Partners International. All Rights Reserved. 5
Basic Requirements for Data Management To manage data, you must first know what it is. Data must be classified at its point of creation based on a broad range of criteria that differ from one organization to the next. Common classification criteria include:
• Criticality from a business continuity standpoint (is it required to support recovery of business operations in the hours following a disaster)
• Utilization characteristics (drafts, finals, frequently referenced, frequently modified, etc.)
• Accessibility from an operational perspective (access frequency and characteristics)
• Retention and destruction timeframes • Importance from a regulatory or legal compliance perspective • Importance from an intellectual property perspective
The above is not a comprehensive list and additional categories may well be discerned by examining the typical lifecycle of the data, the processes and applications that the data serves, and other milieu factors. Once classified, the data must be directed, and migrated over time, to appropriate storage targets. What defines a storage target as “appropriate” are a mixture of classification criteria related to
• The support of the target device for
o the number, concurrency and frequency of accesses that will be made to the data;
o the nature of the accesses (whether the data will simply be read or modified);
o the security and protection services required by the data.
• The cost characteristics of the target platform, including
o Depreciated capital cost expressed in terms of price per GB o Cost of software o Cost of labor and administration
• The support of the target device for services dictated by data class and “milieu
factors” such as
o Legal and regulatory compliance (encryption, data protection, fast access in a discovery situation, etc.)
o Intellectual property protection (security features, redundancies, etc.) o Business continuity strategies (mechanisms used for data protection
and recovery)

Copyright © 2005 by Toigo Partners International. All Rights Reserved. 6
With data and storage classification schemes prepared, data must be migrated in an automated manner. The two remaining elements of a data management scheme are
• An access frequency counter, that identifies how often data is being accessed so we can better ascertain when it is appropriate to move it from one platform to another, and
• The data mover itself, which is conceived of as a software component that uses
inputs from the data classification scheme, the access frequency counter, and the storage classification scheme, and correlates these with established policies on data movement to actually move data to different platforms over time.
As shown in the figure above, these four elements
1. a data naming or classification scheme (and some way to apply it at point of data creation)
2. a storage classification scheme 3. an access frequency counter, and 4. a policy-based engine for data movement
are the basic requirements of anything properly called ILM. Unfortunately, not one vendor touting an ILM solution today offers these components. At best, they may offer a subset of functionality (for example, the better content management software packages may offer a data naming scheme and policy-based data mover), but most offer only a data mover. With the overwhelming majority of products calling themselves “ILM”, the real problems of data management – developing a workable schema for classifying data and finding some means to apply it in a non-disruptive

Copyright © 2005 by Toigo Partners International. All Rights Reserved. 7
manner, developing a workable scheme for classifying storage costs and capabilities, and developing some way to count accesses made to data once it has been written to storage platforms – are left to the consumer to solve. Without these other challenges resolved, the data mover product is virtually worthless. The resulting “solution” might be better termed Information Feng Shui Management (in the Californian use of the term) than Information Lifecycle Management.

Copyright © 2005 by Toigo Partners International. All Rights Reserved. 8
Getting to the Core Problem of Data Management Messages from vendors are mixed on this point. In some vendor marketing literature, there is an explicit assertion that “ILM version 1.0” does not exist – tacit recognition that no vendor, outside of a homogeneous mainframe environment, offers a true ILM solution. On the other hand, nearly every storage vendor describes its product as a “data management solution.” And at least one, EMC, has recently declared that, through a combination of hardware and software offerings developed or acquired by the company, it now has a comprehensive ILM solution. It is little wonder that, in the face of such vendor doublespeak, consumers are confused about the efficacy of all data management strategies. It is equally disconcerting that vendor assertions do not correlate with observations of financial directors and managers for Global 2000 companies. Organizations of financial officers, such as Financial Executives International (FEI), have gone on record with the simple statement that data management is not a technical issue, but a people and process issue. FEI and others correctly perceive that any sort of data management (ILM or “regulatory compliance”) initiative begins with the naming of data in accordance with some sort of classification scheme. Without the willing participation of knowledge workers, who produce the preponderance of the data that is being generated within business organizations today – namely, “unstructured” or file-based data, ILM simply cannot happen.
• Enterprise Content Management (ECM), the new moniker for content, document and image capture systems that have been around for at least two decades, is not properly conceived as true ILM. These systems do not, as a rule, capture the files created by knowledge workers in their workflow-based data movers. Try as they might to reform the processes of business into more structured workflows and to classify data in relation to the profiles of users who are creating files, ECM products cannot effectively capture all of the data distributed on the 80 GB hard disks of knowledge worker desktops and laptops – at least, not without forcing user conformance with a significant modification of their normal modus operandi.
• Database management systems also fail the ILM litmus test. While structured
data avails itself to better management and migration, this data only represents about 27 to 35 percent of data produced by business organizations. Unstructured and “semi-structured” (email) datasets do not conform to database management systems or methodologies at present. Repeated efforts by vendors, including IBM, Oracle Corporation, and even Microsoft, to promote the replacement of the venerable file systems of today with a database construct have failed to excite the user community, in part because of the proprietary nature of such solutions, but also because of the disruption that implementing such systems would entail.

Copyright © 2005 by Toigo Partners International. All Rights Reserved. 9
• Various efforts to solve the problem of data classification simply by directing certain types of data to certain types of storage products or infrastructure (virtualized “pools,” network attached storage, “content addressable” storage devices, or global namespaces) are also no substitute for true ILM. Such strategies mix data management concepts with storage infrastructure design approaches, usually in a manner that favors a specific vendor’s hardware products.
• ILM is also not Hierarchical Storage Management, email management and
archiving, database management and archiving, or backup. While each of these functions may be part of a data management strategy, by themselves they do not fulfill the requirements for a true ILM solution.
Data management begins and ends with the naming of data itself. There are at least four general categories of data that must be named and different strategies must be developed for each category. Files The most daunting problem confronting organizations is coming up with a data management methodology that will capture huge numbers of distributed files into a common data classification scheme. Files are the largest subset of data produced by contemporary organizations, possibly as great as 60 to 80 percent of the total volume of data produced annually, and the least well managed. To make data management work, the buy-in of knowledge workers is key. However, user reluctance to participate in a uniform data naming scheme is the stuff of legend. Workflow Files Where business processes produce routinized or predictable file-based output (for example, the documents produced in a typical mortgage loan origination process) as a product of a well-defined workflow model, it may present an opportunity for disciplined management via content management. The percentage of data produced by companies that falls into the Workflow File category, however, is often quite small relative to all data: if marketing materials from ECM vendors are to be believed, the percentage of workflow file data under some sort of ECM approach at present is between 11 and 16 percent of all business data. Adjusting for the enthusiasm of vendor marketing departments, the actual volume is probably a good deal lower in most companies. “Semi-Structured” Data Where data has a common format and structure (email and some groupware systems, for example), it may be possible to subject it to management discipline using a variety of tools and techniques. Keyword segregation, based on text searching, or segregation by recipient or sender address, and various mechanisms for separating attachments and aggregating them in purpose-built storage silos, may all have value

Copyright © 2005 by Toigo Partners International. All Rights Reserved. 10
in classifying this data type for on-going management. The volume of this type of data as a subset of all data produced in companies is unknown, but it is doubtless a substantial and growing percentage. Structured Data Databases, according to UC Berkeley, account for approximately 30 percent of the data produced by businesses annually. Databases offer excellent data management capabilities, but only if processes such as auto-archiving of older data have been engineered into the database itself. Apparently, this is not the case. Studies have revealed that up to 80 percent of the data in large databases is “stale” data that is never referenced for any purpose. While such data may have residual value that makes it worthwhile to archive, many database architects fail to implement archive processes as part of database design. Third party tools are becoming available in the market to groom databases, opening a door to better management of structured data. From the above survey, it is obvious that a data management strategy may require subordinate strategies for different types of data. Within these data types, a more granular system of data classification is required before ILM can begin to take shape. To begin formulating a strategy for data management, it is essential for planners to understand the data that is being produced and stored within their companies. This requires a three-part discovery effort in which
1. Business processes are identified and deconstructed into their tasks and workflows
2. Applications supporting workflows are identified and their data flows mapped
3. Data is analyzed to identify its management requirements and to discern a
common schema for classification This is the essential first step in data management, and one that cannot be supplanted by any vendor’s ILM solution.
Copyright © 2005 by Toigo Partners International. All Rights Reserved. 11
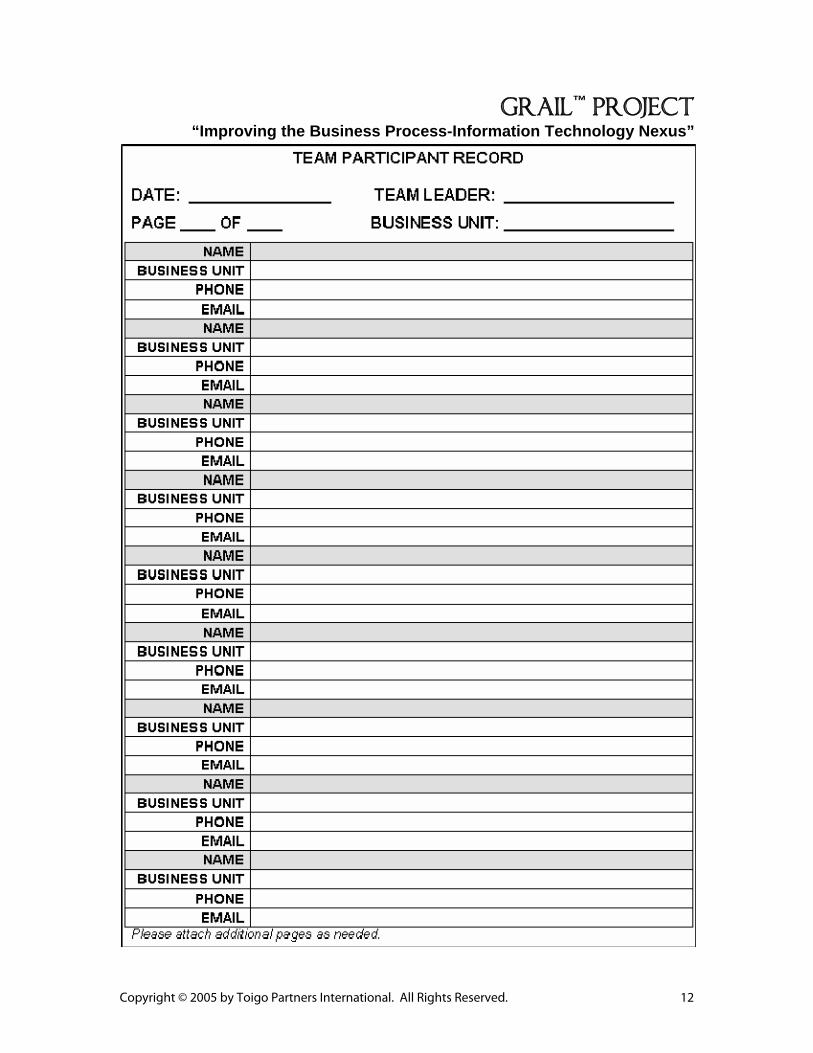
Some Helpful Forms The discovery and classification of data entails a process that is familiar to practitioners in the records management and business continuity/disaster recovery planning fields. At one time, it was fundamental to good application design, as well – though one finds fewer instances of solid structured design as more and more companies leverage “shrink-wrapped” application development tools as an expedient for development. The forms contained in the following pages should be customized by the planner to suit his or her environment. Essentially, they enable the planner to obtain information about business processes, tasks and workflows, their related application and infrastructure support, and the characteristics of data produced and used by the applications themselves. With this data collected in a structured way, it should be possible to begin discerning commonalities among data itself with respect to its accessibility, frequency of use/change, security/privacy requirements, retention requirements, protection requirements, criticality, and other factors as defined by the business. As the effort will require the participation of management and staff in the various operational areas of the business, the first form is used merely to record the identities of the participants in the process. Ultimately, participants become “owners” of the discovery process as it relates to their business process, task or workflow.
Copyright © 2005 by Toigo Partners International. All Rights Reserved. 12
GRAIL™ PROJECT“Improving the Business Process-Information Technology Nexus”

Copyright © 2005 by Toigo Partners International. All Rights Reserved. 13
The next form is used to identify a business process and to, through an interview with knowledgeable participants, name the tasks that comprise the process. This form may become several pages in length depending on the scope and complexity of tasks related to a specific business process. For each task, a subsequent analysis is performed as the discovery process proceeds.

Copyright © 2005 by Toigo Partners International. All Rights Reserved. 14
GRAIL™ PROJECT“Improving the Business Process-Information Technology Nexus”

Copyright © 2005 by Toigo Partners International. All Rights Reserved. 15
GRAIL™ PROJECT“Improving the Business Process-Information Technology Nexus”

Copyright © 2005 by Toigo Partners International. All Rights Reserved. 16
In the next form, individual tasks are analyzed to discern their component workflows. These may be well defined, or they may be more amorphous, especially in the case of tasks that are undertaken by creative or knowledge workers. Some effort may be required to discern both the typical workflows and the ad hoc or workarounds that exist in the business department or work unit. But, this is an effort that can pay dividends in the data analysis phase of strategic data management planning.

Copyright © 2005 by Toigo Partners International. All Rights Reserved. 17
GRAIL™ PROJECT“Improving the Business Process-Information Technology Nexus”
TASK WORKFLOWS LISTING
DATE: ________________ TEAM LEADER: ___________________ PAGE ____ OF ____ BUSINESS UNIT: ___________________ Please attach additional pages as needed.
BUSINESS UNIT PROCESS NUMBER
PROCESS OWNER
PROCESS TITLE
TASK NUMBER TASK OWNER
WORKFLOW LISTING WORKFLOW
NAME # DESCRIPTION
Please attach additional pages as needed to describe all tasks associated with business process.

Copyright © 2005 by Toigo Partners International. All Rights Reserved. 18
GRAIL™ PROJECT“Improving the Business Process-Information Technology Nexus”
BUSINESS PROCESS RECORD WORKFLOW LIST CONTINUATION
DATE: ________________ TEAM LEADER: ___________________ PAGE ____ OF ____ BUSINESS UNIT: ___________________
BUSINESS UNIT PROCESS NUMBER
PROCESS OWNER
PROCESS TITLE
TASK NUMBER TASK OWNER
WORKFLOW LISTING (CONTINUED) WORKFLOW
NAME # DESCRIPTION
Please attach additional pages as needed to describe all workflows associated with this task.

Copyright © 2005 by Toigo Partners International. All Rights Reserved. 19
Step-by-step documentation of workflows, even aided by diagrams, can be of enormous use in identifying interdependencies in applications and data at the business process level that are not immediately obvious or apparent from an more application-centric analysis. The next series of forms capture the details.

Copyright © 2005 by Toigo Partners International. All Rights Reserved. 20
GRAIL™ PROJECT“Improving the Business Process-Information Technology Nexus”
WORKFLOW ANALYSIS
DATE: ________________ TEAM LEADER: ___________________ PAGE ____ OF ____ BUSINESS UNIT: ___________________ Please attach additional pages as needed.
BUSINESS UNIT
PROCESS NUMBER
PROCESS OWNER
TASK NUMBER
TASK OWNER
WORKFLOW NUMBER WORKFLOW OWNER
WORKFLOW DEFINITION
# WORKFLOW STEP (IN CHRONOLOGICAL ORDER)
TYPE (PROCEDURE/
DECISION) COMMENTS
Please attach additional pages as needed to describe all steps associated with workflow.

Copyright © 2005 by Toigo Partners International. All Rights Reserved. 21
GRAIL™ PROJECT
“Improving the Business Process-Information Technology Nexus”
BUSINESS PROCESS RECORD WORKFLOW ANALYSIS CONTINUATION
DATE: ________________ TEAM LEADER: ___________________ PAGE ____ OF ____ BUSINESS UNIT: ___________________
BUSINESS UNIT
PROCESS NUMBER
PROCESS OWNER
TASK NUMBER
TASK OWNER
WORKFLOW NUMBER WORKFLOW OWNER
WORKFLOW DEFINITION
# WORKFLOW STEP (IN CHRONOLOGICAL ORDER)
TYPE (PROCEDURE/
DECISION) COMMENTS
Please attach additional pages as needed to describe all steps associated with workflow.

Copyright © 2005 by Toigo Partners International. All Rights Reserved. 22
GRAIL™ PROJECT“Improving the Business Process-Information Technology Nexus”
WORKFLOW DIAGRAM
DATE: ________________ TEAM LEADER: ___________________ PAGE ____ OF ____ BUSINESS UNIT: ___________________ Please attach additional pages as needed.
BUSINESS UNIT
PROCESS NUMBER
PROCESS OWNER
TASK NUMBER
TASK OWNER
WORKFLOW NUMBER WORKFLOW OWNER
WORKFLOW DIAGRAM
LEGEND OF SYMBOLS CIRCLE = START/END/CONNECTOR
RECTANGLE = PROCEDURE DIAMOND = DECISION POINT (YES/NO)
SQUARE = OUTPUT/RECORD/TRANSACTION Draw in this space.
Follow your workflow step list and draw the workflow here. Use the next page if you need more room. Number each page.
START

Copyright © 2005 by Toigo Partners International. All Rights Reserved. 23
GRAIL™ PROJECT“Improving the Business Process-Information Technology Nexus”
ENLARGED WORKFLOW DIAGRAM
BUSINESS UNIT
PROCESS NUMBER
PROCESS OWNER
TASK NUMBER
TASK OWNER
WORKFLOW NUMBER WORKFLOW OWNER
WORKFLOW DIAGRAM
LEGEND OF SYMBOLS CIRCLE = START/END/CONNECTOR
RECTANGLE = PROCEDURE DIAMOND = DECISION POINT (YES/NO)
SQUARE = OUTPUT/RECORD/TRANSACTION
Draw in this space.
START
Use off-page connectors (circles) to add additional diagrams. Number each page.

Copyright © 2005 by Toigo Partners International. All Rights Reserved. 24
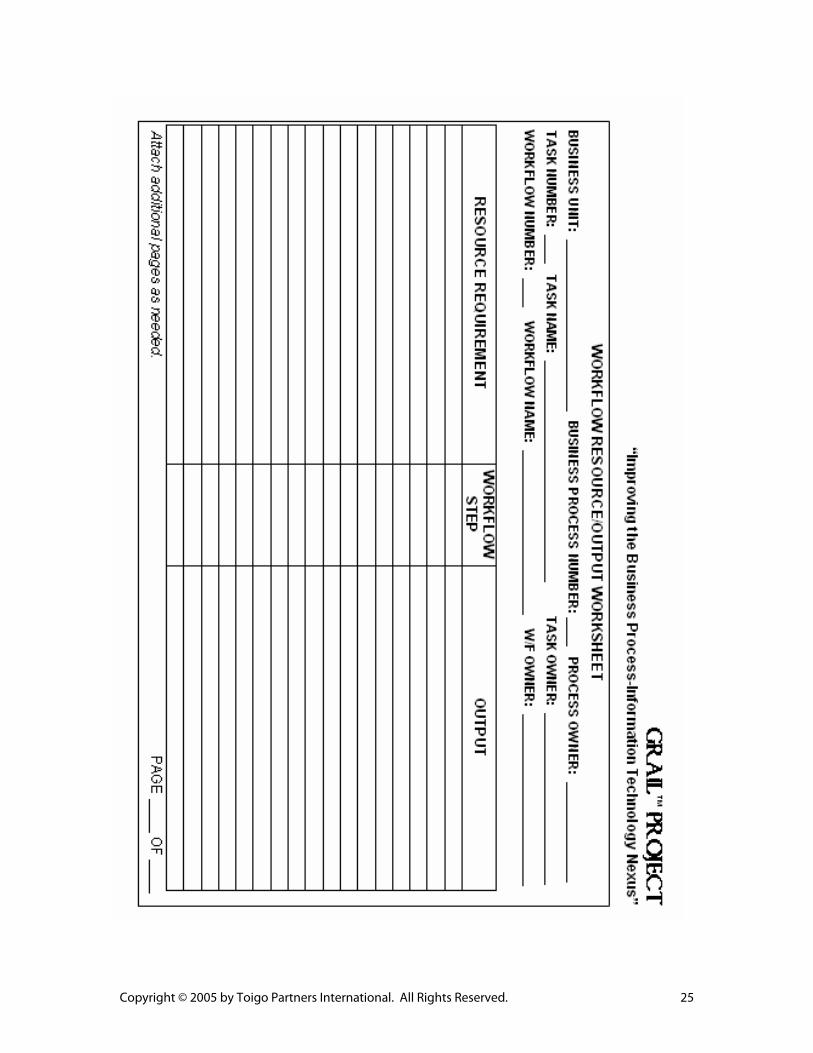
With workflows described and diagrammed, planners are ready to begin mapping data to the workflow itself. This step may require the participation of knowledgeable IT personnel as well. Essentially, for each step of the workflow, the resources for that step and the output from that step need to be documented. This can be construed narrowly, as data resources, or planners may elect to document additional resource requirements such as IT infrastructure and personnel as well. The more data collected, the more utility the resulting model of the business process may have.
Copyright © 2005 by Toigo Partners International. All Rights Reserved. 25

Copyright © 2005 by Toigo Partners International. All Rights Reserved. 26
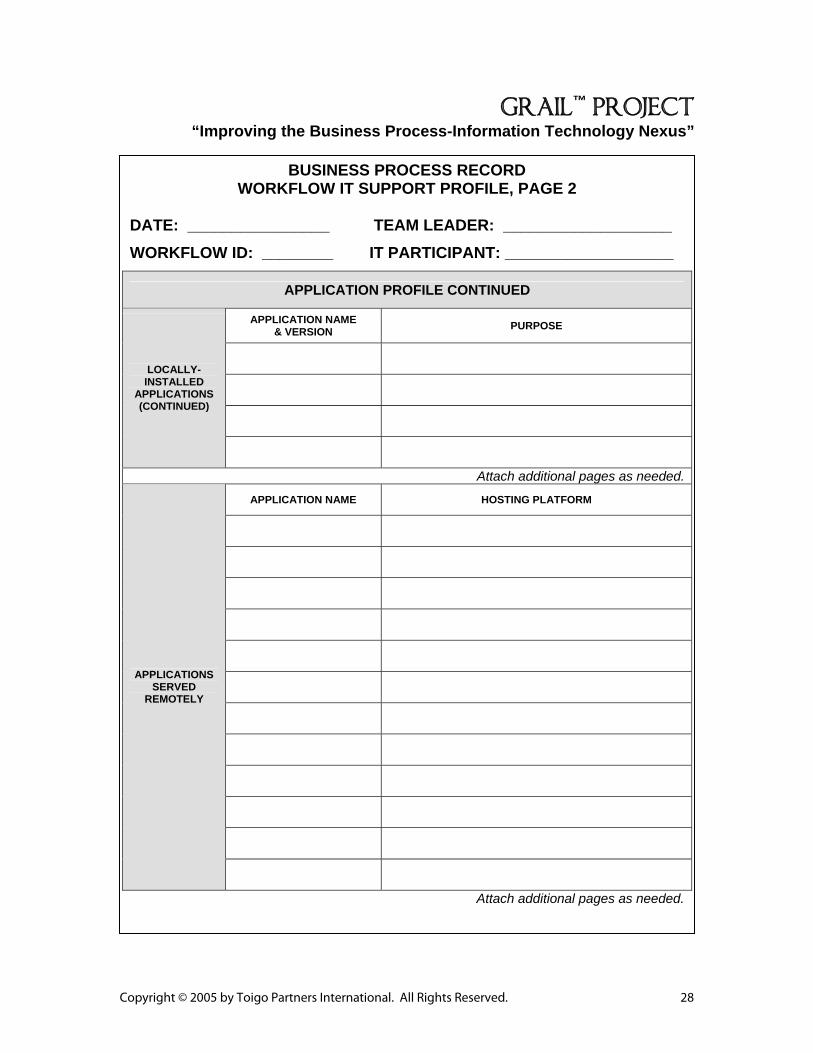
An additional step that also has potentially enormous value involves the quantification of support costs associated with current or status quo methods of data management and IT service delivery. Simplistic data collection forms are provided on the following page. Only by understanding the current costs entailed in providing business processes with application and infrastructure support can planners cost-justify the value of a more disciplined data management strategy. This analysis also identifies current infrastructure used to support business workflow so that recommendations can be made later for optimizing capital resources and their use.

Copyright © 2005 by Toigo Partners International. All Rights Reserved. 27
GRAIL™ PROJECT“Improving the Business Process-Information Technology Nexus”
WORKFLOW IT SUPPORT PROFILE
DATE: ________________ TEAM LEADER: ___________________ IT PARTICIPANT: ___________________
BUSINESS UNIT
PROCESS NUMBER PROCESS OWNER
TASK NUMBER TASK OWNER
WORKFLOW NUMBER WORKFLOW OWNER
USER COMPUTING ENVIRONMENT
WORKSTATION DESCRIPTION (HARDWARE &
OPERATING SYSTEM)
WORKSTATION PERIPHERALS &
LOCAL STORAGE
NETWORK CONNECTION
(LAN/INTERNET/VPN/MODEM &
NETWORK NODE NAME
AND IP ADDRESS)
NUMBER OF USERS
NUMBER OF SYSTEMS
USAGE PROFILE (USERS/SYSTEM,
TIME OF DAY, ETC.)
POWER PROTECTION
(UPS)? Y/N
ANTI-VIRUS PROTECTION? (Y/N)
MONITORED SYSTEM?
(Y/N)
USERS TRAINED? (Y/N)
APPLICATION PROFILE APPLICATION NAME
& VERSION PURPOSE
LOCALLY-
INSTALLED APPLICATIONS
Please continue to next page.
Copyright © 2005 by Toigo Partners International. All Rights Reserved. 28
GRAIL™ PROJECT“Improving the Business Process-Information Technology Nexus”
BUSINESS PROCESS RECORD WORKFLOW IT SUPPORT PROFILE, PAGE 2
DATE: ________________ TEAM LEADER: ___________________ WORKFLOW ID: ________ IT PARTICIPANT: ___________________
APPLICATION PROFILE CONTINUED
APPLICATION NAME & VERSION PURPOSE
LOCALLY-INSTALLED
APPLICATIONS (CONTINUED)
Attach additional pages as needed.
APPLICATION NAME HOSTING PLATFORM
APPLICATIONS SERVED
REMOTELY
Attach additional pages as needed.

Copyright © 2005 by Toigo Partners International. All Rights Reserved. 29
GRAIL™ PROJECT“Improving the Business Process-Information Technology Nexus”
BUSINESS PROCESS IT SUPPORT PROFILE WITH COSTS
DATE: ________________ TEAM LEADER: ___________________ IT PARTICIPANT: ___________________
BUSINESS PROCESS DETAILS
PROCESS NUMBER PROCESS OWNER
NUMBER OF TASKS NUMBER OF WORKFLOWS
USER COMPUTING (TOTAL BUSINESS UNIT)
WORKSTATIONS & USER PERIPHERALS
# OF WORKSTATIONS & DESCRIPTION
OF HARDWARE & OPERATING
SYSTEMS
CAPITAL COST
OF WORKSTATION
(AVERAGE)
TOTAL OF WORKSTATION PERIPHERALS
BY TYPE
AVERAGE COST OF
PERIPHERALS PER
WORKSTATION
NUMBER OF END USERS WITH PRIVATE
WORKSTATIONS
NUMBER OF END USERS WITH SHARED
WORKSTATIONS
% TIME WORKSTATIONS DEDICATED TO THIS PROCESS
(Average capital cost of workstation + average cost of peripherals) x (# private workstations + (#shared
wks/#sharing)) x (percentage of time used for process) = TWE
TOTAL WORKSTATION
EXPENSE (TWE)
WORKGROUP SERVERS
# OF WORKGROUP
SERVERS IN BU & DESCRIPTION
OF HW, OS, & PERIPHERALS
CAPITAL COST OF WORKGROUP
SERVER & PERIPHERALS
(AVERAGE)
DEDICATED SYSTEMS ADMIN?
IF YES, SALARY?
% SYS ADMIN TIME FOR THIS
PROCESS
(Average cap cost of wg server x # of servers)+(sysadmin salary x # of sysadmins)x(%sysadmin time for process) = TSE
TOTAL WG SERVER
EXPENSE (TSE)
Please continue to next page.

Copyright © 2005 by Toigo Partners International. All Rights Reserved. 30
GRAIL™ PROJECT“Improving the Business Process-Information Technology Nexus”
BUSINESS PROCESS IT SUPPORT PROFILE, PAGE 2
DATE: ________________ TEAM LEADER: ___________________ BUSINESS PROC #: _____ IT PARTICIPANT: ___________________
NETWORKING
NETWORK EQUIPMENT & SERVICES
DESCRIPTION
CAPITAL COST OF NETWORKING EQUIPMENT
THIRD PARTY NETWORK SERVICES
DESCRIPTION
ANNUAL COST OF THIRD PARTY
NETWORK SVCS
DEDICATED NETWORK
ADMIN?
IF DEDICATED NETADMIN, SALARY?
% NETADMIN
TIME TO SUPPORT BP
(Capital Equipment Costs)+(Annual 3rd Party Services Cost)+(Network Admin Salary) x (% Used by BP) = TNC
TOTAL NETWORK COSTS
TECHNICAL SUPPORT
TECHNICAL SUPPORT
SERVICES NOT INCLUDING
SYS ADMIN/NET ADMIN
# TECH SUPPORT PERSONNEL INCLUDING MAINTENANCE, DR PLANNING, TRAINING, HELP DESK, ETC.
COMBINED ESTIMATED
SALARIES OF TECH SUPPORT
PERSONNEL
% TIME TECH SUPPORT FOR THIS PROCESS
(Combined Tech Support Salaries) x (% dedicated to BP) = TSC
TOTAL TECH SUPPORT
COSTS
TOTAL EQUIPMENT AND LABOR RESOURCE EXPENSES
(TWE)+(TSE)+(TNC)+(TSC) = Total Resource Expense (excluding application software and hosting)
TOTAL RESOURCE EXPENSE
Additional Assumptions:

Copyright © 2005 by Toigo Partners International. All Rights Reserved. 31
Once this discovery process has been completed for a specific business process, planners need to advance to the next process and repeat the exercise. Additional input will likely be required from legal departments with respect to regulatory compliance requirements, from business continuity planning with respect to disaster recovery strategies, and from records managers with respect to archive, intellectual property retention, security and related matters. These interviews will help define “milieu level” considerations that must be part of any valid data naming scheme. This process is the first – and arguably the most important – step in any data management strategy development effort. It is tedious at times, requiring enormous patience, tact and diplomacy of the planner or planning team. But, there is no substitute – and no technological alternative – for this first data collection step. The reason is simple: data “inherits” its management requirements from the business processes and applications that create and use it. Business processes and milieu considerations impact the criticality of data – if the process is critical, so is the data, and may dictate retention, disposal, security/integrity, and other data management requirements. Business applications determine other attributes of the data, including access method and type of access, that will help to define how the data must be hosted and managed over its useful life.
From the preceding analysis, it is possible to construct a simple matrix that identifies data “handling” requirements. By adding all identified datasets to this matrix, a fairly comprehensive and granular data classification scheme may be derived.

Copyright © 2005 by Toigo Partners International. All Rights Reserved. 32
Conclusion Going forward, the information collected in the discovery process can not only help planners to define a workable data classification scheme, it can also help to improve the strategic planning for the storage infrastructure itself – the single most expensive capital investment in most companies today. By understanding the “hosting” requirements associated with various data classes, IT planners can begin building storage infrastructure that is designed with data in mind. Purpose-building storage will break the dependency of companies on “one-size-fits-most” storage products from vendors that meet no data requirements particularly well. Doing so will directly attack the problem of oversubscription with underutilization and drive cost and inefficiency out of storage as we know it today.
With a data classification scheme established, there is much more work to be done before data can be managed effectively throughout its useful life. The next major challenge is that of applying the classification scheme to unmanaged data, both the data that is already located in data repositories and also the data that is being freshly created on a daily basis. For now, however, data discovery and classification is an effort that must be undertaken and that can produce its own business value.
Copyright © 2005 by Toigo Partners International. All Rights Reserved. 33
GRAILTM is a trademark of Toigo Partners International LLC.
The Data Management Briefing is published six times per year by Toigo Partners International. Annual subscriptions are $60. Members of TPI communities, IT-Sense.org and Data Management Institute.org, receive a substantial discount on this newsletter and others offered by Toigo Partners International. To find out about subscribing to this newsletter or joining IT-Sense or the Data Management Institute, please contact us by email or visit the web sites at:
www.it-sense.org www.datainstitute.org