data center energy efficiency and renewable energy site
TRANSCRIPT
NREL is a national laboratory of the U.S. Department of Energy, Office of Energy Efficiency & Renewable Energy, operated by the Alliance for Sustainable Energy, LLC.
Contract No. DE-AC36-08GO28308
National Renewable Energy Laboratory 15013 Denver West Parkway Golden, CO 80401 303-275-3000 • www.nrel.gov
Data Center Energy Efficiency and Renewable Energy Site Assessment: Anderson Readiness Center Salem, Oregon I. Metzger and O. Van Geet
Work for Others Report NREL/TP-7A40-61925 June 2014
Produced under direction of U.S. Army by the National Renewable Energy Laboratory (NREL) under Interagency Agreement IAG-13-1916 Task No. WFV71007
NREL is a national laboratory of the U.S. Department of Energy, Office of Energy Efficiency & Renewable Energy, operated by the Alliance for Sustainable Energy, LLC.
Contract No. DE-AC36-08GO28308
National Renewable Energy Laboratory 15013 Denver West Parkway Golden, CO 80401 303-275-3000 • www.nrel.gov
Data Center Energy Efficiency and Renewable Energy Site Assessment: Anderson Readiness Center Salem, Oregon I. Metzger and O. Van Geet
Prepared under Task Number WFV7.1007
Work for Others Report NREL/TP-7A40-61925 June 2014

NOTICE This manuscript has been authored by employees of the Alliance for Sustainable Energy, LLC (“Alliance”) under Contract No. DE-AC36-08GO28308 with the U.S. Department of Energy (“DOE”). This report was prepared as an account of work sponsored by an agency of the United States government. Neither the United States government nor any agency thereof, nor any of their employees, makes any warranty, express or implied, or assumes any legal liability or responsibility for the accuracy, completeness, or usefulness of any information, apparatus, product, or process disclosed, or represents that its use would not infringe privately owned rights. Reference herein to any specific commercial product, process, or service by trade name, trademark, manufacturer, or otherwise does not necessarily constitute or imply its endorsement, recommendation, or favoring by the United States government or any agency thereof. The views and opinions of authors expressed herein do not necessarily state or reflect those of the United States government or any agency thereof.
Printed on paper containing at least 50% wastepaper, including 10% post consumer waste.

iii
This report is available at no cost from the National Renewable Energy Laboratory (NREL) at www.nrel.gov/publications.
Contacts Oregon Army National Guard National Renewable Energy Laboratory Kenneth Safe, PE, SE, CFMO Lieutenant Colonel Phone: 503-584-3503 Email: [email protected] Tetra Tech, Inc. Charles Senning, CEM Resource Efficiency Manager Phone: 503-584-3957 Email: [email protected]
Ian Metzger, PE, CEM, LEED AP 1,2 Engineer III Phone: 303-384-7415 Email: [email protected] Otto Van Geet, PE, LEED AP 1,2 Principal Engineer Phone: 303-384-7369 Email: [email protected]
1 Members of the site assessment team 2 Report authors to whom any questions should be directed
iv
This report is available at no cost from the National Renewable Energy Laboratory (NREL) at www.nrel.gov/publications.
Acknowledgments The U.S. Department of Energy’s (DOE) National Renewable Energy Laboratory (NREL) team thanks Oregon Military Department (OMD) for the opportunity to perform the data center energy efficiency (EE) and renewable energy (RE) assessment of the Anderson Readiness Center (ARC) in Salem, Oregon. In particular, the assessment team is grateful to the facility managers, directors, engineers, and operators for their generous assistance and cooperation during the site visit. Special thanks to Charles Senning, Dave Baca, and Jim Layne for their assistance throughout the assessment.

v
This report is available at no cost from the National Renewable Energy Laboratory (NREL) at www.nrel.gov/publications.
List of Abbreviations and Acronyms cfm cubic feet per minute CO2 carbon dioxide CRAC computer room air conditioner DOD U.S. Department of Defense DOE U.S. Department of Energy ECM energy conservation measure EE energy efficiency ERE energy reuse effectiveness ft2 square foot hp horsepower in. inch IT information technology JFHQ Joint Force Headquarters kVA kilovolt-ampere (MVA = megavolt-ampere = 1,000 kVA) kW kilowatt (MW = megawatts = 1,000 kW) kWh kilowatt-hour (MWh = megawatt-hour = 1,000 kWh) lb pound NREL National Renewable Energy Laboratory OMD Oregon Military Department PDU power distribution unit PGE Portland General Electric PUE power utilization effectiveness PV photovoltaics RE renewable energy RH relative humidity UPS uninterruptible power supply V Volt W Watt

vi
This report is available at no cost from the National Renewable Energy Laboratory (NREL) at www.nrel.gov/publications.
Executive Summary U.S. Department of Defense (DOD) has long recognized the strategic importance of energy to its mission and is working to enhance energy security by reducing energy consumption through EE while drawing on clean on-site RE sources. In 2008 DOD and DOE launched a joint initiative to address military energy use by identifying specific actions to reduce energy demand and increase RE use on DOD installations. Data centers have been specifically identified as mission critical operations that represent a large opportunity to reduce energy demand. The U.S. Army has partnered with NREL to assess data center opportunities that increase energy security and reduce energy consumption through EE and RE strategies at select installations.
This report summarizes the results from the data center EE and RE site assessment conducted for OMD in Salem, Oregon. A team led by NREL conducted the assessment of the Salem ARC data centers March 18–20, 2014 as part of ongoing efforts to reduce energy use and incorporate RE technologies where feasible.
OMD plans to construct a new facility in 2016 which may house a consolidated data center. Therefore, the NREL assessment focused on short-term energy conservation measures (ECMs) with a payback of less than 2 years, and longer-term design considerations for the new facility. Currently, two main data centers (room 158 and room 187) are located in the Salem ARC, and several more are in the Joint Force Headquarters (JFHQ) building. This report summarizes the findings from the Salem ARC data centers, but the energy conservation methodologies can be extrapolated to other data centers in the JFHQ.
During the site visit many best practices were observed, including the following:
• Reasonable space temperatures (70o–75oF) in room 158 and room 187.
• Computer room air conditioner (CRAC) units in room 187 were networked to avoid simultaneous heating/cooling and simultaneous humidification/dehumidification.
• Good lighting levels.
• T-8 fluorescent lighting.
• Minimal extraneous plug load equipment.
• High-efficiency uninterruptible power supply (UPS) (92%).
• High-efficiency transformers (95% average).
• Participation in demand response program with Portland General Electric (PGE), including generator operation and maintenance.
Although the data centers in the Salem ARC account for less than 5% of the total square footage, they are estimated to be responsible for 70% of the annual electricity consumption. This report documents the baseline information, as well as the assumptions and methods used to determine the costs and savings associated with each measure. A bulleted summary of the short-term and long-term opportunities identified during the site visit is given below:

vii
This report is available at no cost from the National Renewable Energy Laboratory (NREL) at www.nrel.gov/publications.
Short-Term Energy Conservation Measures for Existing Data Center • Turn off two CRAC units in room 187 and one CRAC unit in room 158.
• Change relative humidity set points to 40% ± 20% to decrease humidifier energy consumption.
• Turn off lights when the data center is unoccupied.
• Remove portable UPS configured in series in room 158.
Long-Term Data Center Design Considerations for New Facility • Consolidate and virtualize information technology systems.
• Utilize low-energy cooling strategies to achieve required environmental conditions.
• Optimize airflow management with hot/cold aisle containment and wire management.
• Utilize high-efficiency power distribution equipment.
• Benchmark and monitor data center performance metrics.
Renewable Energy Measures • A rooftop photovoltaic (PV) system on the Salem ARC is not cost-effective at this time.
Combined Measures The measures identified as part of the audits of the Salem ARC are quantified in Table ES-1.
Table ES-1. Combined ECMs and RE Measures Summary
Description Annual Energy
Savings (kWh/yr)
Annual Cost Savings
($/yr)
Total Installed Costs
($)
Simple Payback
(yrs)
Annual CO2 Savings
(metric tons/yr)
Short-Term ECMs 235,830 $18,159 $260 0.01 118
Long-Term Design Considerations 1,067,664 $88,210 Negligible Immediate 534
Salem ARC Rooftop PV System
199,197 $15,338 $592,000 46 100
NREL would like to continue supporting short-term and long-term energy conservation at the Salem ARC and JFHQ data centers. For long-term design consideration NREL would specifically like to assist OMD with developing performance specifications in the request for proposal, review designs, support commissioning, and verify energy performance. NREL now operates two ultra-efficient data centers and would like to apply the lessons learned and experience to help OMD achieve similar performance.3, 4
3 http://www.nrel.gov/docs/fy12osti/54374.pdf. Accessed May, 2014. 4 http://www.nrel.gov/docs/fy12osti/55423.pdf. Accessed May, 2014.
viii
This report is available at no cost from the National Renewable Energy Laboratory (NREL) at www.nrel.gov/publications.
Table of Contents Contacts ...................................................................................................................................................... iii Acknowledgments ..................................................................................................................................... iv List of Abbreviations and Acronyms ........................................................................................................ v Executive Summary ................................................................................................................................... vi
Short-Term Energy Conservation Measures for Existing Data Center ................................................ vii Long-Term Data Center Design Considerations for New Facility ....................................................... vii Renewable Energy Measures ............................................................................................................... vii Combined Measures ............................................................................................................................. vii
Background ................................................................................................................................................. 1 Project Background and Intent ............................................................................................................... 1
Energy Policy Act of 2005 ............................................................................................................ 2 Executive Order 13423 .................................................................................................................. 2 Energy Independence and Security Act of 2007 ........................................................................... 2 Executive Order 13514 .................................................................................................................. 2
Climate Data ................................................................................................................................................ 3 Utility Data.................................................................................................................................................... 4 Data Center Description ............................................................................................................................. 5
Operating Schedule ................................................................................................................................ 6 Air Conditioning and Environmental Conditions ................................................................................... 6 Power Distribution ................................................................................................................................. 6 Lighting .................................................................................................................................................. 7 Current Energy Efficiency Best Practices and Observations ................................................................. 7 Power Utilization Effectiveness ............................................................................................................. 7
1 Short-Term Energy Conservation Measures ..................................................................................... 9 1.1 Change Relative Humidity Set Points to 40% ± 20% to Decrease Humidifier Energy
Consumption ................................................................................................................................. 9 1.2 Turn Off Two CRAC Units in Room 187 and One CRAC Unit in Room 158 ........................... 10 1.3 Other Short-Term Energy Conservation Measures ..................................................................... 11
Remove Portable Uninterruptable Power Supplies Configured in Series in Room 158 .............. 11 Turn Off Lights When Data Center Is Unoccupied ...................................................................... 12
2 Long-Term Data Center Design Considerations ............................................................................. 13 2.1 Information Technology Systems ............................................................................................... 13 2.2 Environmental Conditions ........................................................................................................... 14 2.3 Air Management .......................................................................................................................... 16 2.4 Power Distribution ...................................................................................................................... 17 2.5 Energy Recovery ......................................................................................................................... 18 2.6 Data Center Performance Metrics and Benchmarking ................................................................ 18 2.7 Long-Term Energy Savings Potential ......................................................................................... 19
3 Renewable Energy Measures ............................................................................................................ 21 3.1 Install a Rooftop Photovoltaic System ........................................................................................ 21
Summary .................................................................................................................................................... 24 Appendix – Psychrometric Bin Analysis ................................................................................................ 25
ix
This report is available at no cost from the National Renewable Energy Laboratory (NREL) at www.nrel.gov/publications.
List of Tables Table ES-1. Combined ECMs and RE Measures Summary ....................................................................... vii Table 1. Salem, Oregon: Historical Weather Summary ................................................................................ 3 Table 2. Energy and Cost Savings from Changing the RH Set Point ......................................................... 10 Table 3. Energy and Cost Savings from Turning Off CRAC Units ............................................................ 11 Table 4. Energy and Cost Savings for the New High-Efficiency Data Center ........................................... 20 Table 5. Energy and Cost Savings for Installing Roof-Mounted PV System ............................................. 23
List of Figures Figure 1. Salem ARC monthly electricity breakdown .................................................................................. 4 Figure 2. Aerial view of Anderson Readiness Center in Salem, Oregon ...................................................... 5 Figure 3. Salem ARC floor plan and 2013 space utilization ......................................................................... 5 Figure 4. Power distribution and losses for Salem ARC data centers .......................................................... 7 Figure 5. Estimated PUE for room 158 and room 187 ................................................................................. 8 Figure 6. Submetered CRAC and humidifier power in room 187 and room 158 ......................................... 9 Figure 7. IT load compared to oversized cooling capacity ......................................................................... 10 Figure 8. Multiple portable UPSs configured in series with central UPS ................................................... 12 Figure 9. Example of 4:1 server virtualization impact on power footprint ................................................. 13 Figure 10. Expanded recommended and allowable operating envelopes for data centers .......................... 14 Figure 11. Psychrometric bin analysis of alternative cooling strategies for data centers in Salem, Oregon15 Figure 12. Failure rate of IT equipment as a function of air inlet temperatures ......................................... 16 Figure 13. Example of mixing hot/cold airstreams (left) and isolated hot/cold aisles (right) ..................... 17 Figure 14. Hot and cold aisle separation (left) and cable management at Salem ARC (right). .................. 17 Figure 15. Example of data center power meters required for PUE calculation ......................................... 19 Figure 16. Projected energy performance of new high-efficiency data center ........................................... 19 Figure 17. South-facing standing seam metal roof on the Salem ARC ...................................................... 21 Figure 18. Aerial view of available rooftop area for PV system................................................................. 21 Figure 19. Shading analysis of Salem ARC rooftop ................................................................................... 22 Figure 20. Major components of a grid-connected PV system ................................................................... 23
1
This report is available at no cost from the National Renewable Energy Laboratory (NREL) at www.nrel.gov/publications. This report is available at no cost from the National Renewable Energy Laboratory (NREL) at www.nrel.gov/publications.
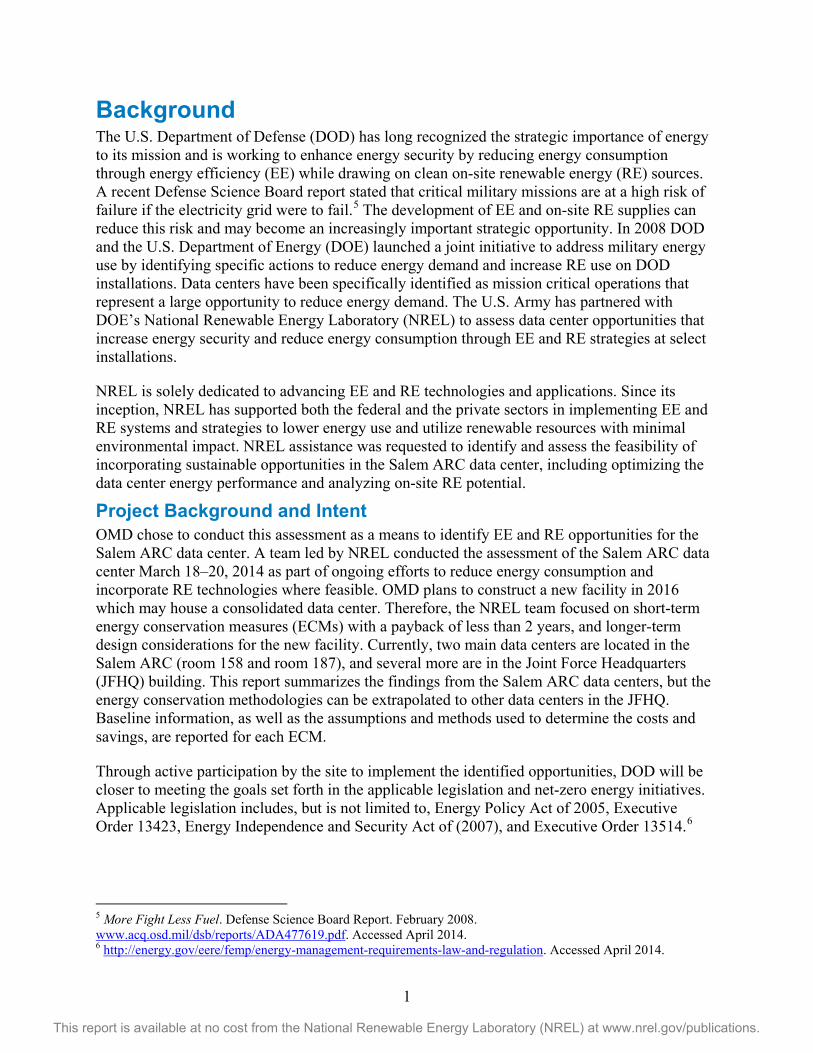
Background The U.S. Department of Defense (DOD) has long recognized the strategic importance of energy to its mission and is working to enhance energy security by reducing energy consumption through energy efficiency (EE) while drawing on clean on-site renewable energy (RE) sources. A recent Defense Science Board report stated that critical military missions are at a high risk of failure if the electricity grid were to fail.5 The development of EE and on-site RE supplies can reduce this risk and may become an increasingly important strategic opportunity. In 2008 DOD and the U.S. Department of Energy (DOE) launched a joint initiative to address military energy use by identifying specific actions to reduce energy demand and increase RE use on DOD installations. Data centers have been specifically identified as mission critical operations that represent a large opportunity to reduce energy demand. The U.S. Army has partnered with DOE’s National Renewable Energy Laboratory (NREL) to assess data center opportunities that increase energy security and reduce energy consumption through EE and RE strategies at select installations.
NREL is solely dedicated to advancing EE and RE technologies and applications. Since its inception, NREL has supported both the federal and the private sectors in implementing EE and RE systems and strategies to lower energy use and utilize renewable resources with minimal environmental impact. NREL assistance was requested to identify and assess the feasibility of incorporating sustainable opportunities in the Salem ARC data center, including optimizing the data center energy performance and analyzing on-site RE potential.
Project Background and Intent OMD chose to conduct this assessment as a means to identify EE and RE opportunities for the Salem ARC data center. A team led by NREL conducted the assessment of the Salem ARC data center March 18–20, 2014 as part of ongoing efforts to reduce energy consumption and incorporate RE technologies where feasible. OMD plans to construct a new facility in 2016 which may house a consolidated data center. Therefore, the NREL team focused on short-term energy conservation measures (ECMs) with a payback of less than 2 years, and longer-term design considerations for the new facility. Currently, two main data centers are located in the Salem ARC (room 158 and room 187), and several more are in the Joint Force Headquarters (JFHQ) building. This report summarizes the findings from the Salem ARC data centers, but the energy conservation methodologies can be extrapolated to other data centers in the JFHQ. Baseline information, as well as the assumptions and methods used to determine the costs and savings, are reported for each ECM.
Through active participation by the site to implement the identified opportunities, DOD will be closer to meeting the goals set forth in the applicable legislation and net-zero energy initiatives. Applicable legislation includes, but is not limited to, Energy Policy Act of 2005, Executive Order 13423, Energy Independence and Security Act of (2007), and Executive Order 13514.6
5 More Fight Less Fuel. Defense Science Board Report. February 2008. www.acq.osd.mil/dsb/reports/ADA477619.pdf. Accessed April 2014. 6 http://energy.gov/eere/femp/energy-management-requirements-law-and-regulation. Accessed April 2014.

2
This report is available at no cost from the National Renewable Energy Laboratory (NREL) at www.nrel.gov/publications. This report is available at no cost from the National Renewable Energy Laboratory (NREL) at www.nrel.gov/publications.
Energy Policy Act of 2005 • [§103]: federal buildings must be metered by October 1, 2012, with data provided at least
daily and electricity consumption measured hourly (requires an implementation plan and personnel responsible).
• [§203] RE is not less than 7.5% of total consumption during FY 2013 and thereafter. (Note: Accounting of RE can be doubled if on federal or Indian land and used at a federal facility.)
Executive Order 13423 • [§2(b)] ensure 50% of the required RE consumed by the agency in a fiscal year comes
from renewable sources on agency property for agency use is preferable.
Energy Independence and Security Act of 2007 • [§431] reduce building energy intensity 3% annually through 2015, or 30% total
reduction by 2015, relative to a 2003 baseline.
• [§432] energy and water evaluations must be completed every 4 years for covered facilities.
• [§434] ensure major replacements of installed equipment, renovation, or expansions of existing spaces employ the most energy-efficient designs, systems, equipment, and controls if life cycle cost effective.
• [§523] 30% of hot water demand in new federal buildings and major renovations must be met with solar hot water if life cycle cost effective.
• [§524] encourages agencies to minimize standby energy use in purchases of energy-using equipment.
• [§525] requires procurement to focus on ENERGY STAR and Federal Energy Management Program-designated products.
• [§527] each federal agency must issue an annual report that describes the status of initiatives to improve EE, reduce energy costs, and reduce greenhouse gas emissions.
Executive Order 13514 • [§2(d)(i)] reduce 2% annually potable water consumption intensity through FY 2020 or
26% by the end of FY 2020, relative to a 2007 baseline.
• [§2(g)(iv)] minimize consumption of energy, water, and materials through cost-effective, innovative strategies.
• [§2(i)(ii)] enable power management, duplex printing, and other energy-efficient or environmentally preferable features on all eligible DOE electronic products.
• [§2(i)(v)] implement best management practices in energy-efficient management of servers and federal data centers.
3
This report is available at no cost from the National Renewable Energy Laboratory (NREL) at www.nrel.gov/publications. This report is available at no cost from the National Renewable Energy Laboratory (NREL) at www.nrel.gov/publications.
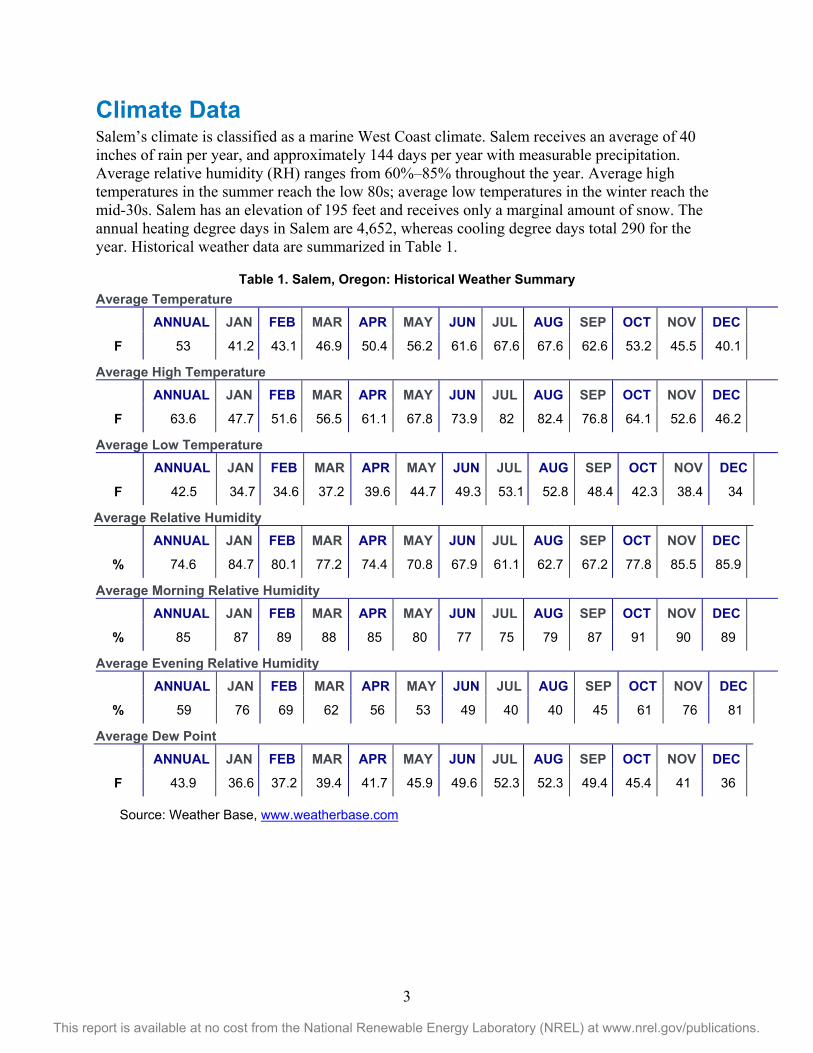
Climate Data Salem’s climate is classified as a marine West Coast climate. Salem receives an average of 40 inches of rain per year, and approximately 144 days per year with measurable precipitation. Average relative humidity (RH) ranges from 60%–85% throughout the year. Average high temperatures in the summer reach the low 80s; average low temperatures in the winter reach the mid-30s. Salem has an elevation of 195 feet and receives only a marginal amount of snow. The annual heating degree days in Salem are 4,652, whereas cooling degree days total 290 for the year. Historical weather data are summarized in Table 1.
Table 1. Salem, Oregon: Historical Weather Summary Average Temperature
ANNUAL
JAN
FEB
MAR
APR
MAY
JUN
JUL
AUG
SEP
OCT
NOV
DEC
F 53 41.2 43.1 46.9 50.4 56.2 61.6 67.6 67.6 62.6 53.2 45.5 40.1
Average High Temperature
ANNUAL
JAN
FEB
MAR
APR
MAY
JUN
JUL
AUG
SEP
OCT
NOV
DEC
F 63.6 47.7 51.6 56.5 61.1 67.8 73.9 82 82.4 76.8 64.1 52.6 46.2
Average Low Temperature
ANNUAL
JAN
FEB
MAR
APR
MAY
JUN
JUL
AUG
SEP
OCT
NOV
DEC
F 42.5 34.7 34.6 37.2 39.6 44.7 49.3 53.1 52.8 48.4 42.3 38.4 34
Average Relative Humidity
ANNUAL
JAN
FEB
MAR
APR
MAY
JUN
JUL
AUG
SEP
OCT
NOV
DEC
% 74.6 84.7 80.1 77.2 74.4 70.8 67.9 61.1 62.7 67.2 77.8 85.5 85.9
Average Morning Relative Humidity
ANNUAL
JAN
FEB
MAR
APR
MAY
JUN
JUL
AUG
SEP
OCT
NOV
DEC
% 85 87 89 88 85 80 77 75 79 87 91 90 89
Average Evening Relative Humidity
ANNUAL
JAN
FEB
MAR
APR
MAY
JUN
JUL
AUG
SEP
OCT
NOV
DEC
% 59 76 69 62 56 53 49 40 40 45 61 76 81
Average Dew Point
ANNUAL
JAN
FEB
MAR
APR
MAY
JUN
JUL
AUG
SEP
OCT
NOV
DEC
F 43.9 36.6 37.2 39.4 41.7 45.9 49.6 52.3 52.3 49.4 45.4 41 36
Source: Weather Base, www.weatherbase.com
4
This report is available at no cost from the National Renewable Energy Laboratory (NREL) at www.nrel.gov/publications. This report is available at no cost from the National Renewable Energy Laboratory (NREL) at www.nrel.gov/publications.
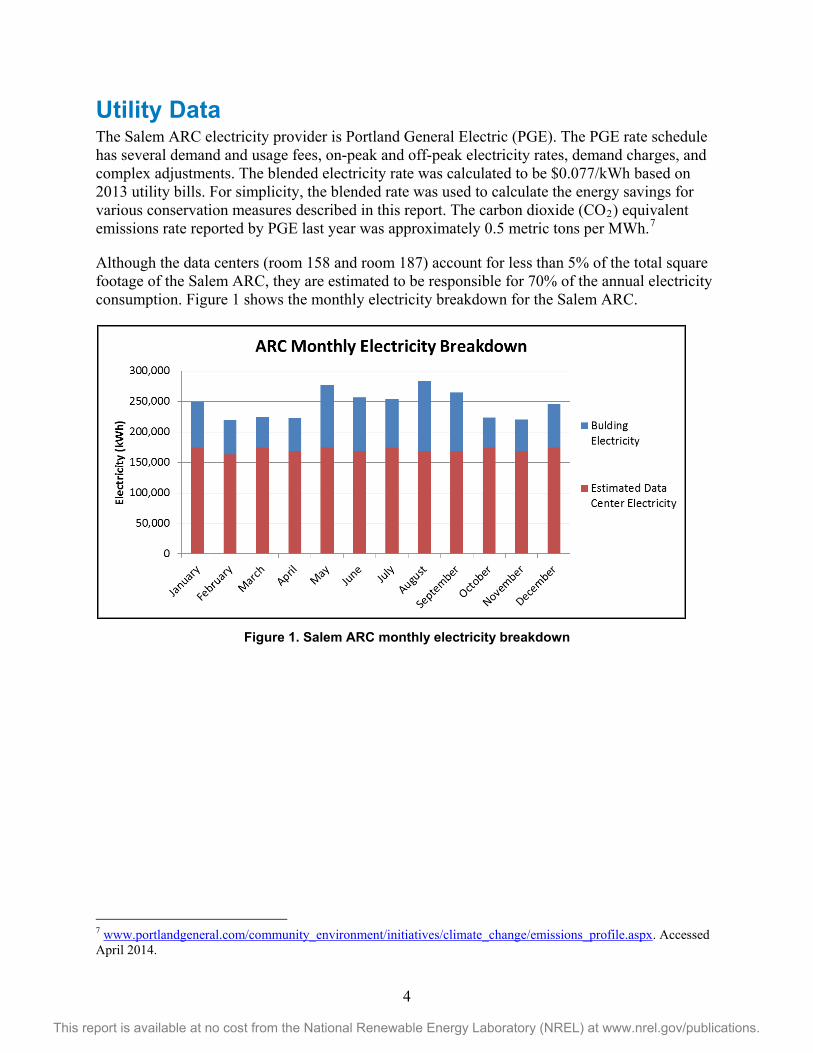
Utility Data The Salem ARC electricity provider is Portland General Electric (PGE). The PGE rate schedule has several demand and usage fees, on-peak and off-peak electricity rates, demand charges, and complex adjustments. The blended electricity rate was calculated to be $0.077/kWh based on 2013 utility bills. For simplicity, the blended rate was used to calculate the energy savings for various conservation measures described in this report. The carbon dioxide (CO2) equivalent emissions rate reported by PGE last year was approximately 0.5 metric tons per MWh.7
Although the data centers (room 158 and room 187) account for less than 5% of the total square footage of the Salem ARC, they are estimated to be responsible for 70% of the annual electricity consumption. Figure 1 shows the monthly electricity breakdown for the Salem ARC.
Figure 1. Salem ARC monthly electricity breakdown
7 www.portlandgeneral.com/community_environment/initiatives/climate_change/emissions_profile.aspx. Accessed April 2014.

5
This report is available at no cost from the National Renewable Energy Laboratory (NREL) at www.nrel.gov/publications. This report is available at no cost from the National Renewable Energy Laboratory (NREL) at www.nrel.gov/publications.
Data Center Description The ARC in Salem, Oregon has two main data centers (room 158 and room 187) supporting various agencies. The sections below describe the general characteristics of the data centers. Figure 2 shows an aerial view of the Salem ARC taken from Google Earth and Figure 3 shows the Salem ARC floor plan with room 158 and room 187 identified.
Figure 2. Aerial view of Anderson Readiness Center in Salem, Oregon
Source: Google Earth
Figure 3. Salem ARC floor plan and 2013 space utilization
6
This report is available at no cost from the National Renewable Energy Laboratory (NREL) at www.nrel.gov/publications. This report is available at no cost from the National Renewable Energy Laboratory (NREL) at www.nrel.gov/publications.
Operating Schedule Room 158 and room 187 data centers operate 24 hours per day, 7 days per week year round and generally are not occupied unless there is scheduled maintenance.
Air Conditioning and Environmental Conditions Room 158 is cooled by two 10-ton Liebert computer room air conditioner (CRAC) units, manufactured by Emerson Network Power, with rooftop condensing units. Each CRAC is equipped with a direct expansion cooling coil, a 3-hp constant-volume fan, and a 5-kW electric humidifier. Space temperature and humidity set points were 65oF ± 2oF and 50% RH ± 5% RH. The controls of CRAC units in room 158 are not networked together, and site staff has observed simultaneous humidification and dehumidification.
Room 187 is cooled by four 20-ton Liebert CRAC units, manufactured by Emerson Network Power, with air-cooled condensers located at ground level adjacent to the data center. Two of the units are newer models with digital-scroll compressors and variable-speed condenser fans. The two newer units serve the upper mezzanine level in room 187. The controls of CRAC units in room 187 are networked together to prevent simultaneous humidification and dehumidification. Each CRAC is equipped with a direct expansion cooling coil, a 7.5-hp constant-volume fan, and a 9.4-kW electric humidifier. Space temperature and humidity set points were 65oF and 50% RH.
Power Distribution Both room 158 and room 187 data centers are powered from a common uninterruptible power supply (UPS), which also serves other critical computing areas such as the emergency dispatch center. The UPS, manufactured by PowerWare and model number 9315 has a rated capacity of 225 kVA. The load on the UPS, at the time of the assessment, was 122 kW (50% of rated capacity) with an efficiency of 92%.
The UPS delivers 480-V power to transformers that step down the voltage to 208/120 V, which is then distributed to the racks. The assessment observed six transformers feeding the data centers, with capacities ranging from 45 kVA to 112.5 kVA. Spot measurements of the primary and secondary amperages revealed loading that ranged from 1%–40% of the rated capacities of the transformers. At loading levels below 20%, efficiencies can decline significantly. However, the total average operating efficiency of the transformers distributing power to the data centers was measured to be 95%.
Further power conversion losses occur within the power supplies inside the racks, but actual losses could not be measured. Figure 4 shows the loads and losses through the power distribution system serving the data centers in room 158 and room 187.

7
This report is available at no cost from the National Renewable Energy Laboratory (NREL) at www.nrel.gov/publications. This report is available at no cost from the National Renewable Energy Laboratory (NREL) at www.nrel.gov/publications.
Figure 4. Power distribution and losses for Salem ARC data centers
Source: Ian Metzger, NREL
Lighting The lighting systems in both data centers consisted of two-lamp, 4-ft, linear fluorescent fixtures with 32-W, 3500-K, T-8 lamps and electronic ballasts. Room 158 had 16 fixtures and an estimated load of 1 kW. Room 187 had 80 fixtures and an estimated load of 5.1 kW.
Current Energy Efficiency Best Practices and Observations During the site visit many best practices were observed. The following is a list of previously implemented EE projects and best practices that were identified:
• Reasonable space temperatures (70o–75oF) in room 158 and room 187.
• CRAC units in room 187 were networked to avoid simultaneous humidification and dehumidification.
• Good lighting levels.
• T-8 fluorescent lighting.
• Minimal extraneous plug load equipment.
• High-efficiency UPS (92%).
• High-efficiency transformers (95% average).
• Participation in PGE Schedule 200 Dispatchable Standby Generation which includes funds for upgrades, operation and maintenance, standby fuel costs, and monthly tests.
Power Utilization Effectiveness Power utilization effectiveness (PUE) is a metric for quantifying data center performance and operational efficiency. PUE is defined as the ratio of total facility power to the information technology (IT) equipment power. A perfect data center would have a PUE = 1.0.
𝑃𝑈𝐸 = 𝑇𝑜𝑡𝑎𝑙 𝑃𝑜𝑤𝑒𝑟
𝐼𝑇 𝐸𝑞𝑢𝑖𝑝𝑚𝑒𝑛𝑡 𝑃𝑜𝑤𝑒𝑟=𝐶𝑜𝑜𝑙𝑖𝑛𝑔 + 𝑈𝑃𝑆 𝐿𝑜𝑠𝑠𝑒𝑠 + 𝐷𝑖𝑠𝑡𝑟𝑖𝑏𝑢𝑡𝑖𝑜𝑛 𝐿𝑜𝑠𝑠𝑒𝑠 + 𝐿𝑖𝑔ℎ𝑡𝑖𝑛𝑔 + 𝐼𝑇 𝐸𝑞𝑢𝑖𝑝𝑚𝑒𝑛𝑡…
𝐼𝑇 𝐸𝑞𝑢𝑖𝑝𝑚𝑒𝑛𝑡 𝑃𝑜𝑤𝑒𝑟

8
This report is available at no cost from the National Renewable Energy Laboratory (NREL) at www.nrel.gov/publications. This report is available at no cost from the National Renewable Energy Laboratory (NREL) at www.nrel.gov/publications.
Total facility power includes everything needed to operate and support the IT equipment load, including:
• IT components, including servers, computers, and network/storage nodes
• Power delivery components, including UPS, switch gear, generators, power distribution units (PDUs), batteries, and distribution losses
• Cooling system components, including chillers, CRACs, air-handling units, fans, pumps, condensing units, and cooling towers
• Lighting, including lamps and ballasts
• Other miscellaneous components, including switches, monitors, and workstations/ laptops.
Currently, PUE is not actively being monitored at the facility. Figure 5 shows the estimated PUEs for room 158 and room 187, based on the information collected during the assessment.
Figure 5. Estimated PUE for room 158 and room 187
The Salem ARC data centers are currently operating with an estimated 2.4 PUE for room 158 (IT load = 24.1 kW, and total load = 56.9 kW), and 2.7 PUE for room 187 (IT load = 66.2 kW, and total load = 177.1 kW). These data centers are performing with PUEs higher than the average data center (PUE of 1.8–2.0), and significantly higher than energy-efficient data centers (PUE of 1.2). Many cost-effective opportunities to reduce energy consumption and improve the PUE are available, and quantified later in this report.
PUE does not fully capture the energy consumption or reduction in a data center; it shows only the total load relative to the IT load. In some instances, reducing IT energy consumption can increase the PUE, which can be misleading. Therefore, PUE is an important benchmarking metric to monitor, but total energy reduction should be the top priority.
9
This report is available at no cost from the National Renewable Energy Laboratory (NREL) at www.nrel.gov/publications. This report is available at no cost from the National Renewable Energy Laboratory (NREL) at www.nrel.gov/publications.
1 Short-Term Energy Conservation Measures OMD plans to construct a new facility in 2016 which may house a consolidated data center. Therefore, this section is focused on short-term ECMs with a payback of less than 2 years that can be implemented immediately at the data centers currently in operation at the Salem ARC.
1.1 Change Relative Humidity Set Points to 40% ± 20% to Decrease Humidifier Energy Consumption
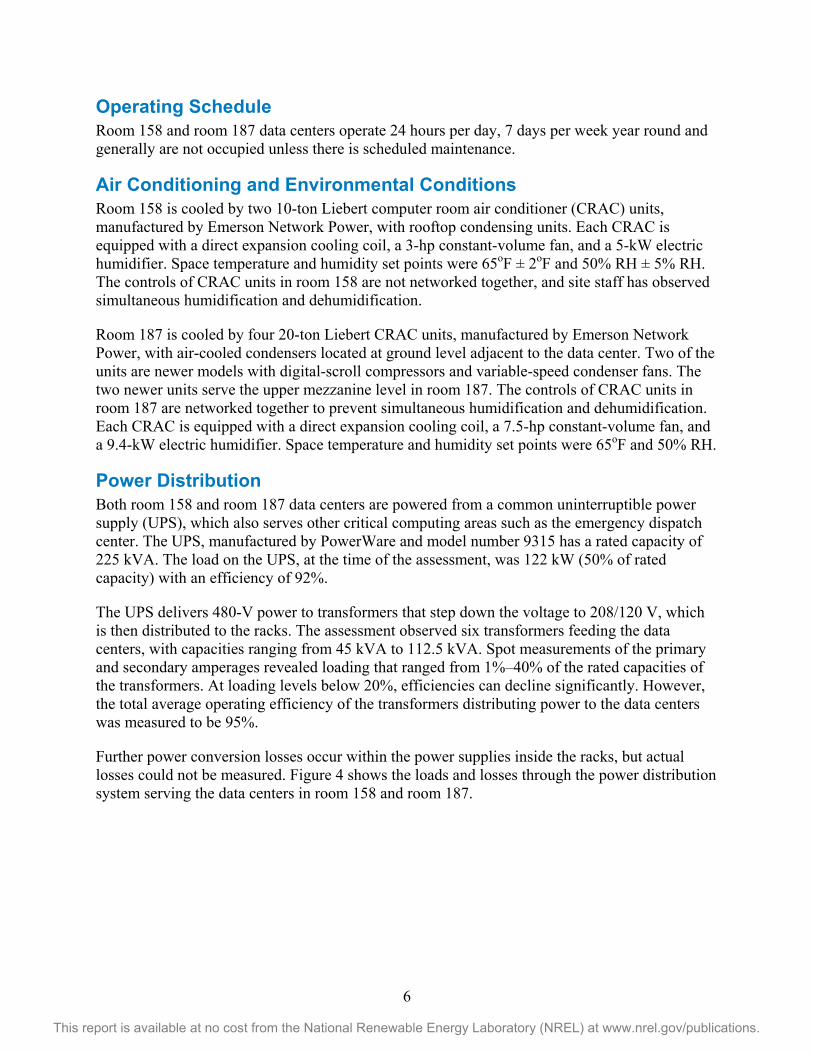
Current Condition: The data centers in room 158 and room 187 have large electric humidifier loads. The electric humidifiers have a total rated capacity of 37.5 kW in room 187, and 10 kW in room 158. Short-term monitoring of the CRAC power consumption during the assessment revealed that these humidifiers are energized for much of the day as a result of the tight deadband on the humidity set point (50% ± 5% RH). The analyzed data show that the electric humidifiers account for 33% of the total CRAC power in room 187 and 53% of the total CRAC power in room 158. Figure 6 shows the submetered data and relative energy consumption of the electric humidifiers in room 187 and room 158.
Figure 6. Submetered CRAC and humidifier power in room 187 and room 158
Recommended Action: Site staff should reprogram the controls on the CRAC units to have an RH set point of 40% ± 20%. These settings more closely reflect the ASHRAE 2011 Thermal Guidelines for Data Processing Environments.8 Reducing the set point and increasing the deadband will significantly reduce the operating hours of the electric humidifiers, while still maintaining a safe and comfortable working environment in accordance with industry and manufacturer recommendations. Table 2 provides the calculated energy and cost savings, simple payback, and CO2 emissions savings for changing the RH set point. Calculation assumptions are also given below.
8 http://ecoinfo.cnrs.fr/IMG/pdf/ashrae_2011_thermal_guidelines_data_center.pdf. Accessed April 2014.
10
This report is available at no cost from the National Renewable Energy Laboratory (NREL) at www.nrel.gov/publications. This report is available at no cost from the National Renewable Energy Laboratory (NREL) at www.nrel.gov/publications.
Table 2. Energy and Cost Savings from Changing the RH Set Point Energy and Cost Savings Energy Savings (kWh/yr) 154,545 Energy Cost Savings ($/yr) $11,900 Implementation Costs ($) $130 Simple Payback (yrs) 0.01 CO2 Savings (metric tons/yr) 77.3
Assumptions:
• Current humidifier runtime is 12 h/day, based on submetered data.
• Humidifier runtime with new set points is estimated to be 2 h/day.
• Installation costs were estimated at $50/h and 2 h of time total for reprogramming.
• 2013 CO2 equivalent emissions rate reported by PGE of 0.5 metric tons per MWh.
• A 30% contingency was added to the overall cost.
1.2 Turn Off Two CRAC Units in Room 187 and One CRAC Unit in Room 158
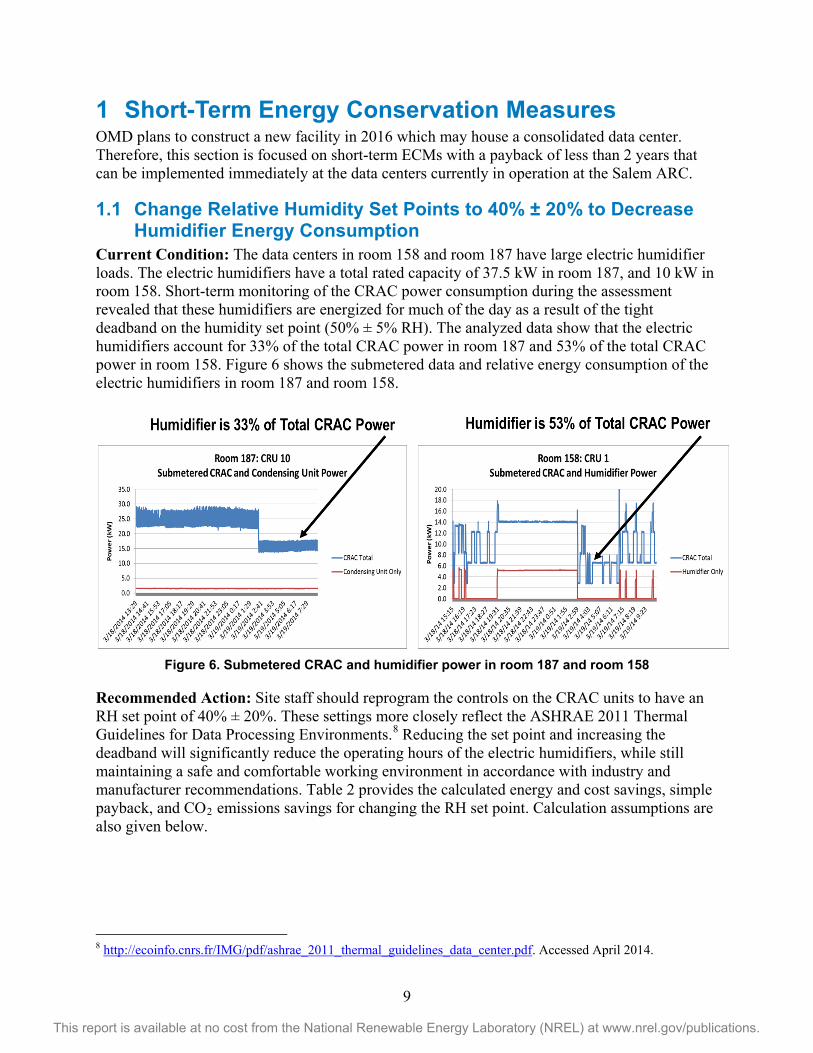
Current Condition: The cooling capacities in both room 158 and room 187 are significantly oversized for the current IT load. Room 187 has an IT load of 66.2 kW and a cooling capacity of 281 kW. Similarly, room 158 has an IT load of 24.1 kW and a cooling capacity of 70 kW. At the time of the assessment all CRAC units were operating and all constant volume fans were running. As a result, fan energy is higher than required for the given load, and CRAC units are operating at lower efficiencies. In addition, there is increased wear and tear on the compressors from low-load cycling, which can lead to increased maintenance costs and a shorter life. Figure 7 shows the IT load relative to the oversized cooling load for the data centers located in room 158 and room 187.
Figure 7. IT load compared to oversized cooling capacity

11
This report is available at no cost from the National Renewable Energy Laboratory (NREL) at www.nrel.gov/publications. This report is available at no cost from the National Renewable Energy Laboratory (NREL) at www.nrel.gov/publications.
Recommended Action: Site staff should turn off two CRAC units in room 187 and one CRAC unit in room 158. The cooling capacity will then more closely match the IT load. The proposed condition would reduce the cooling capacity in room 187 to 141 kW (compared to the IT load of 66.2 kW), and reduce the cooling capacity in room 158 to 35 kW (compared to the IT load of 24.1 kW). The unused CRACs could be programmed to remain idle unless higher temperature thresholds are exceeded. Site staff should monitor rack temperatures when implementing this measure to make sure hot spots do not develop near critical equipment. Although the actual cooling load on the compressors and condensers would remain the same, this measure would significantly reduce the fan energy, increase the operational efficiency of the CRACs, and reduce the wear and tear from compressor low-load cycling. Table 3 provides the calculated energy and cost savings, simple payback, and CO2 emissions savings for turning off the recommended CRAC units. Calculation assumptions are also given below.
Table 3. Energy and Cost Savings from Turning Off CRAC Units Energy and Cost Savings
Energy Savings (kWh/yr) 81,285
Energy Cost Savings ($/yr) $6,259
Implementation Costs ($) $130
Simple Payback (yrs) 0.02
CO2 Savings (metric tons/yr) 40.6 Assumptions:
• Only fan energy savings were considered.
o Two 7.5 hp fans, with 60% load and 88.5% efficient in room 187.
o One 3 hp fan, with 60% load and 86.5% efficient in room 158.
• Installation costs were estimated at $50/h and 2 h of time total for shutdown procedures, reprogramming, and temperature monitoring.
• 2013 CO2 equivalent emissions rate reported by PGE of 0.5 metric tons per MWh.
• A 30% contingency was added to the overall cost.
1.3 Other Short-Term Energy Conservation Measures Additional short-term ECMs should be considered. Some metrics from these measures were not calculated because quantifying the savings is difficult.
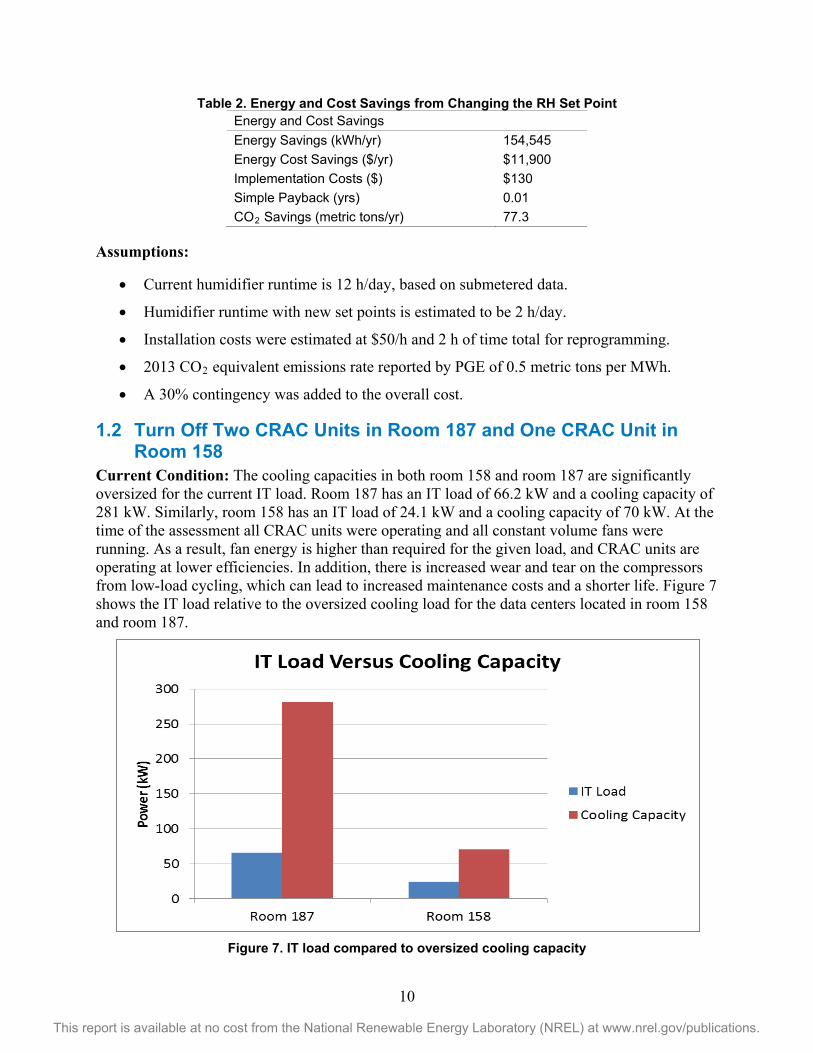
Remove Portable Uninterruptable Power Supplies Configured in Series in Room 158 The site assessment team observed multiple portable UPSs connected in series with the central UPS. Portable UPSs typically have poor power conversion efficiencies (~50%) and should not be connected in series with any other UPS. The current configuration results in large power distribution losses and adds unnecessary redundancy to the system. Site staff should remove the portable UPSs and plug whatever equipment is currently connected directly into the central UPS outlet. Figure 8 shows pictures of the multiple UPSs configured in series in room 158.
12
This report is available at no cost from the National Renewable Energy Laboratory (NREL) at www.nrel.gov/publications. This report is available at no cost from the National Renewable Energy Laboratory (NREL) at www.nrel.gov/publications.
Figure 8. Multiple portable UPSs configured in series with central UPS
Source: Ian Metzger, NREL
Turn Off Lights When Data Center Is Unoccupied The data center is unoccupied during most of the year, unless there is scheduled maintenance. Site staff should consider adding signage and reminding personnel or IT contractors to turn off the lights when exiting the data centers.
13
This report is available at no cost from the National Renewable Energy Laboratory (NREL) at www.nrel.gov/publications. This report is available at no cost from the National Renewable Energy Laboratory (NREL) at www.nrel.gov/publications.
2 Long-Term Data Center Design Considerations The following sections summarize best practices for data centers that should be implemented into the design of the new data center.9 It is recommended that all data centers and IT equipment in the Salem ARC and JFHQ be consolidated into a new high-efficiency data center which may be housed in the new facility planned for construction in 2016.
2.1 Information Technology Systems In a typical data center, most servers run at or below 20% utilization most of the time but still consume full power. Recent improvements in the internal cooling and processor design, such as variable-speed fans and throttle-down processor drives, have been made to reduce wasted energy at low utilization rates. The ENERGY STAR® program identifies high-efficiency servers, which are specified to be, on average, 30% more efficient than standard servers.10
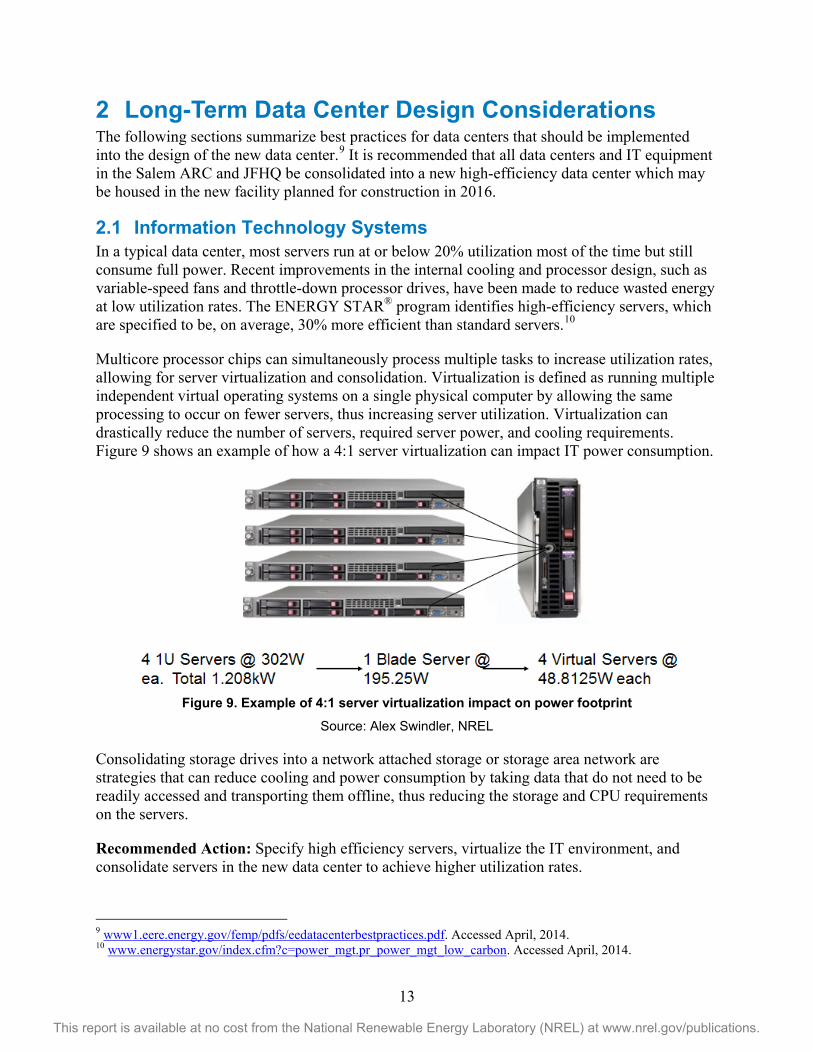
Multicore processor chips can simultaneously process multiple tasks to increase utilization rates, allowing for server virtualization and consolidation. Virtualization is defined as running multiple independent virtual operating systems on a single physical computer by allowing the same processing to occur on fewer servers, thus increasing server utilization. Virtualization can drastically reduce the number of servers, required server power, and cooling requirements. Figure 9 shows an example of how a 4:1 server virtualization can impact IT power consumption.
Figure 9. Example of 4:1 server virtualization impact on power footprint
Source: Alex Swindler, NREL
Consolidating storage drives into a network attached storage or storage area network are strategies that can reduce cooling and power consumption by taking data that do not need to be readily accessed and transporting them offline, thus reducing the storage and CPU requirements on the servers.
Recommended Action: Specify high efficiency servers, virtualize the IT environment, and consolidate servers in the new data center to achieve higher utilization rates.
9 www1.eere.energy.gov/femp/pdfs/eedatacenterbestpractices.pdf. Accessed April, 2014. 10 www.energystar.gov/index.cfm?c=power_mgt.pr_power_mgt_low_carbon. Accessed April, 2014.

14
This report is available at no cost from the National Renewable Energy Laboratory (NREL) at www.nrel.gov/publications. This report is available at no cost from the National Renewable Energy Laboratory (NREL) at www.nrel.gov/publications.
2.2 Environmental Conditions In 2011, ASHRAE, in collaboration with IT equipment manufacturers, expanded the recommended environmental envelope for inlet air entering IT equipment.11 The larger operating ranges allow greater flexibility and reduce the overall energy consumption for the heating, ventilation, and air conditioning equipment. The expanded recommended and allowable envelopes for Class 1 and 2 data centers are shown in Figure 10.
Figure 10. Expanded recommended and allowable operating envelopes for data centers12
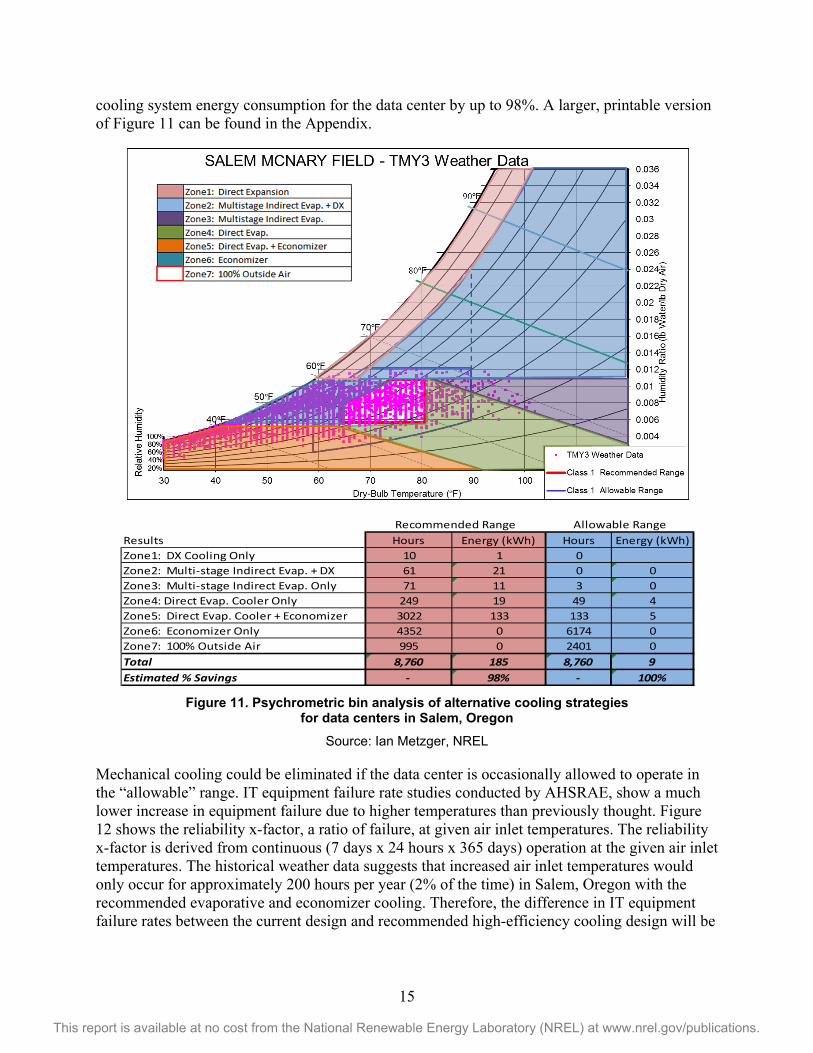
Climate conditions in Salem, Oregon were analyzed using the Psychrometric Bin Analysis Tool, developed at NREL, for examining low-energy cooling strategies for data centers.13 Outside air conditions for every hour of the year are plotted on the psychrometric chart and collected into bins. Each bin represents a thermodynamic process for low-energy cooling strategies such as evaporative and economizer cooling to achieve the required environmental conditions for data centers. The results of this analysis, shown in Figure 11, illustrate that 8,618 hours of the year outside air conditions are favorable for direct evaporative and economizer cooling to achieve the recommended environmental conditions in the data center. This approach could reduce the
11 http://ecoinfo.cnrs.fr/IMG/pdf/ashrae_2011_thermal_guidelines_data_center.pdf. Accessed April 2014. 12 http://ecoinfo.cnrs.fr/IMG/pdf/ashrae_2011_thermal_guidelines_data_center.pdf. Accessed April 2014. 13 https://buildingdata.energy.gov/cbrd/resource/681. Accessed April 2014.
15
This report is available at no cost from the National Renewable Energy Laboratory (NREL) at www.nrel.gov/publications. This report is available at no cost from the National Renewable Energy Laboratory (NREL) at www.nrel.gov/publications.
cooling system energy consumption for the data center by up to 98%. A larger, printable version of Figure 11 can be found in the Appendix.
Figure 11. Psychrometric bin analysis of alternative cooling strategies
for data centers in Salem, Oregon Source: Ian Metzger, NREL
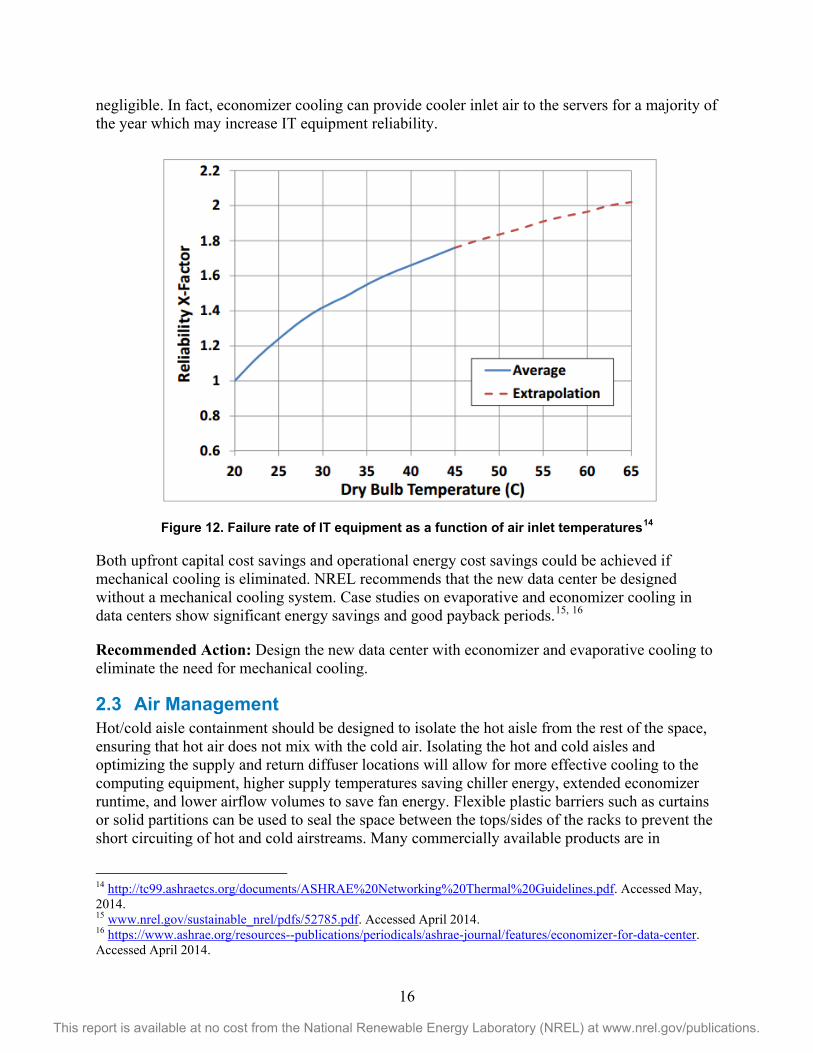
Mechanical cooling could be eliminated if the data center is occasionally allowed to operate in the “allowable” range. IT equipment failure rate studies conducted by AHSRAE, show a much lower increase in equipment failure due to higher temperatures than previously thought. Figure 12 shows the reliability x-factor, a ratio of failure, at given air inlet temperatures. The reliability x-factor is derived from continuous (7 days x 24 hours x 365 days) operation at the given air inlet temperatures. The historical weather data suggests that increased air inlet temperatures would only occur for approximately 200 hours per year (2% of the time) in Salem, Oregon with the recommended evaporative and economizer cooling. Therefore, the difference in IT equipment failure rates between the current design and recommended high-efficiency cooling design will be
Results Hours Energy (kWh) Hours Energy (kWh)Zone1: DX Cooling Only 10 1 0Zone2: Multi-stage Indirect Evap. + DX 61 21 0 0Zone3: Multi-stage Indirect Evap. Only 71 11 3 0Zone4: Direct Evap. Cooler Only 249 19 49 4Zone5: Direct Evap. Cooler + Economizer 3022 133 133 5Zone6: Economizer Only 4352 0 6174 0Zone7: 100% Outside Air 995 0 2401 0Total 8,760 185 8,760 9Estimated % Savings - 98% - 100%
Recommended Range Allowable Range
16
This report is available at no cost from the National Renewable Energy Laboratory (NREL) at www.nrel.gov/publications. This report is available at no cost from the National Renewable Energy Laboratory (NREL) at www.nrel.gov/publications.
negligible. In fact, economizer cooling can provide cooler inlet air to the servers for a majority of the year which may increase IT equipment reliability.
Figure 12. Failure rate of IT equipment as a function of air inlet temperatures14
Both upfront capital cost savings and operational energy cost savings could be achieved if mechanical cooling is eliminated. NREL recommends that the new data center be designed without a mechanical cooling system. Case studies on evaporative and economizer cooling in data centers show significant energy savings and good payback periods.15, 16
Recommended Action: Design the new data center with economizer and evaporative cooling to eliminate the need for mechanical cooling.
2.3 Air Management Hot/cold aisle containment should be designed to isolate the hot aisle from the rest of the space, ensuring that hot air does not mix with the cold air. Isolating the hot and cold aisles and optimizing the supply and return diffuser locations will allow for more effective cooling to the computing equipment, higher supply temperatures saving chiller energy, extended economizer runtime, and lower airflow volumes to save fan energy. Flexible plastic barriers such as curtains or solid partitions can be used to seal the space between the tops/sides of the racks to prevent the short circuiting of hot and cold airstreams. Many commercially available products are in
14 http://tc99.ashraetcs.org/documents/ASHRAE%20Networking%20Thermal%20Guidelines.pdf. Accessed May, 2014. 15 www.nrel.gov/sustainable_nrel/pdfs/52785.pdf. Accessed April 2014. 16 https://www.ashrae.org/resources--publications/periodicals/ashrae-journal/features/economizer-for-data-center. Accessed April 2014.

17
This report is available at no cost from the National Renewable Energy Laboratory (NREL) at www.nrel.gov/publications. This report is available at no cost from the National Renewable Energy Laboratory (NREL) at www.nrel.gov/publications.
compliance with typical fire codes. Figure 13 shows an example of a rack layout with hot and cold airstream mixing and an example of isolated hot and cold aisles.
Figure 13. Example of mixing hot/cold airstreams (left) and isolated hot/cold aisles (right)
Source: Josh Bauer and Joelynn Schroeder, NREL
Obstructions in the airflow path (back of racks, underfloor/overhead plenums) can significantly reduce the volume of air delivered to the racks, which results in higher fan energy and hot spots. Cable management practices should be implemented to reduce obstructions in the airflow path. Figure 14 shows the impacts of airflow management on supply and return air temperatures and an example of the current cable management in one of the racks at the Salem ARC.
Figure 14. Hot and cold aisle separation (left) and cable management at Salem ARC (right).
Source: Jim Leyshon (Left) and Ian Metzger (Right), NREL
Recommended Action: Design the data center layout to incorporate full hot/cold aisle containment and develop a cable management plan to minimize fan energy and increase cooling system efficiency.
2.4 Power Distribution The electrical power distribution in data centers typically consists of utility service, switchgear, backup generator, UPSs, PDUs, power conditioning equipment, and server power supplies. Each has power conversion efficiencies that not only lose power, but add heat into the data center, which increases the cooling load. Careful selection and appropriate loading of these components can increase the operating efficiency of the data center significantly.

18
This report is available at no cost from the National Renewable Energy Laboratory (NREL) at www.nrel.gov/publications. This report is available at no cost from the National Renewable Energy Laboratory (NREL) at www.nrel.gov/publications.
UPS systems provide backup power to the data center and typically consist of inverters and battery banks, but can also be designed with rotary machines, fuel cells, and other technologies. High-efficiency UPSs can have operating efficiencies that exceed 95%. However, older UPSs have efficiencies around 80% and the efficiency of oversized equipment can drop significantly if the load is less than 20% of the rated capacity.
PDU systems pass conditioned power from the UPS to multiple pieces of equipment (power servers, networking equipment, etc.) and are typically located on the data center floor. Some PDUs include built-in step transformers to supply the required voltage to data center equipment. Similar to the UPSs, transformers can have significant conversion losses if oversized and typically require a minimum load of 20% to operate efficiently.
Servers typically have local power supplies to convert power from AC to DC and transform the voltage to 5 V or 12 V for internal components, such as CPUs and fans. Older technology converts power from alternating current to direct current at efficiencies around 60%–70%. However, recent advances have allowed server power supplies to achieve operating efficiencies up to 95%. These power supplies also require a minimum loading of 20% to achieve rated efficiencies.
Recommended Action: Specify high efficiency and properly sized power distribution including 95% efficient UPS, high efficiency transformers or power distribution units, and high efficiency power supplies at the racks.
2.5 Energy Recovery If possible, energy recovery should be included in the design of the new data center. Waste heat from the data center can be captured and used elsewhere in the building during the heating season. This would reduce the heating load in the facility and reduce the cooling load for the data center. The warm air leaving the hot isle of the data center can be transferred directly to the building or a variety of commercially available products, such as enthalpy wheels, could be used for transferring waste heat from one airstream to another.
Recommended Action: Consider integrating data center energy recovery with other building systems to reduce the heating load in the new facility.
2.6 Data Center Performance Metrics and Benchmarking PUE is the industry accepted metric for quantifying data center performance and operational efficiency. If energy recovery is included in the design, another metric called energy reuse effectiveness (ERE) can also be quantified.
𝐸𝑅𝐸 = 𝑇𝑜𝑡𝑎𝑙 𝐸𝑛𝑒𝑟𝑔𝑦 − 𝑅𝑒𝑢𝑠𝑒 𝐸𝑛𝑒𝑟𝑔𝑦
𝐼𝑇 𝐸𝑞𝑢𝑖𝑝𝑚𝑒𝑛𝑡 𝐸𝑛𝑒𝑟𝑔𝑦
ENERGY STAR Portfolio Manager offers additional benchmarks and performance monitoring tools for data centers.17 When designing the new facility, OMD should incorporate submetering into the design so that energy consumption and PUE (and ERE) can be benchmarked and
17 www.energystar.gov/index.cfm?c=prod_development.server_efficiency
19
This report is available at no cost from the National Renewable Energy Laboratory (NREL) at www.nrel.gov/publications. This report is available at no cost from the National Renewable Energy Laboratory (NREL) at www.nrel.gov/publications.
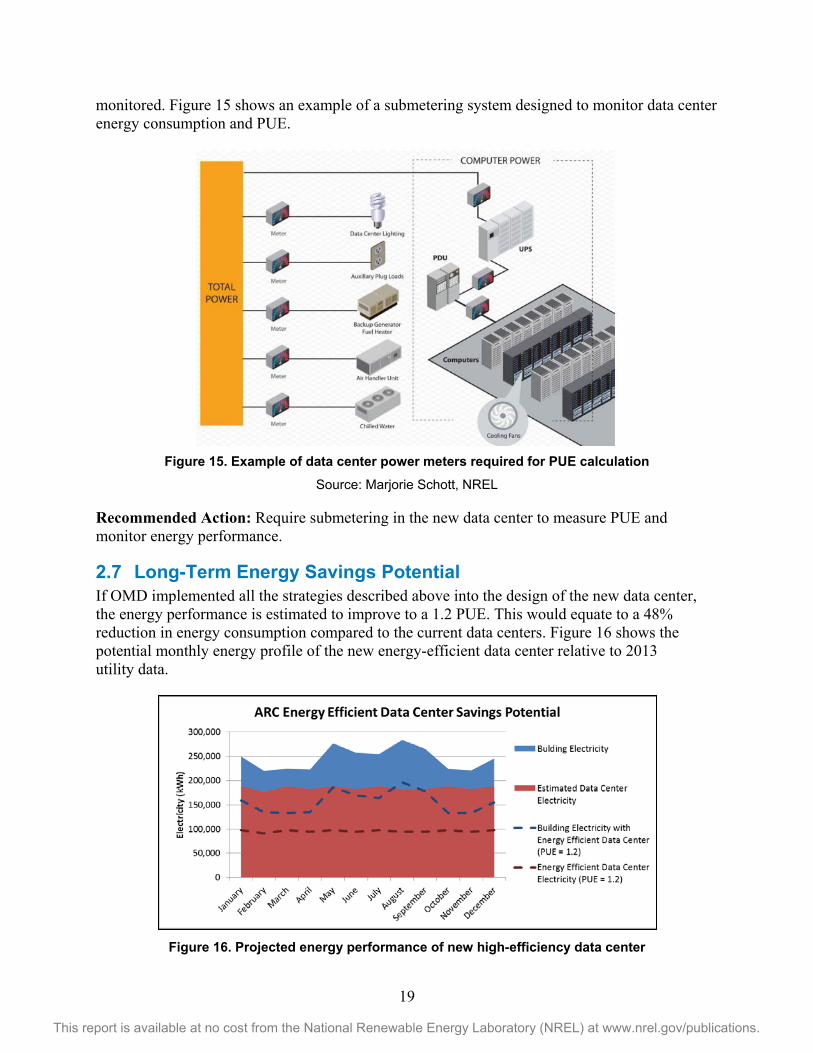
monitored. Figure 15 shows an example of a submetering system designed to monitor data center energy consumption and PUE.
Figure 15. Example of data center power meters required for PUE calculation
Source: Marjorie Schott, NREL
Recommended Action: Require submetering in the new data center to measure PUE and monitor energy performance.
2.7 Long-Term Energy Savings Potential If OMD implemented all the strategies described above into the design of the new data center, the energy performance is estimated to improve to a 1.2 PUE. This would equate to a 48% reduction in energy consumption compared to the current data centers. Figure 16 shows the potential monthly energy profile of the new energy-efficient data center relative to 2013 utility data.
Figure 16. Projected energy performance of new high-efficiency data center

20
This report is available at no cost from the National Renewable Energy Laboratory (NREL) at www.nrel.gov/publications. This report is available at no cost from the National Renewable Energy Laboratory (NREL) at www.nrel.gov/publications.
Table 4 provides the calculated energy and cost savings, simple payback, and CO2 emissions savings for designing a high-efficiency data center. Calculation assumptions are also given below.
Table 4. Energy and Cost Savings for the New High-Efficiency Data Center Energy and Cost Savings
Energy Savings (kWh/yr) 1,067,664
Energy Cost Savings ($/yr) $82,210
Implementation Costs ($) Negligible
Simple Payback (yrs) Immediate
CO2 Savings (metric tons/yr) 533.8 Assumptions:
• New data center achieves a 1.2 PUE.
• Increased capital costs are negligible because economizer and direct evaporative cooling are significantly less expensive than compressor-based cooling systems. In addition, good incentives are available through the Energy Trust of Oregon for Virtualization, Energy Efficient UPS, Airflow management, and Air-side economizer.18
• New design meets the requirements of the Energy Independence and Security Act of 2007: major replacements of installed equipment, renovation, or expansion of existing space employ the most energy-efficient designs, systems, equipment, and controls if life cycle cost effective.
18 http://energytrust.org/. Accessed April, 2014.
21
This report is available at no cost from the National Renewable Energy Laboratory (NREL) at www.nrel.gov/publications. This report is available at no cost from the National Renewable Energy Laboratory (NREL) at www.nrel.gov/publications.
3 Renewable Energy Measures The following sections summarize the RE opportunities at the Salem ARC that can help offset the energy requirements of the data center. Currently, no RE systems are installed.
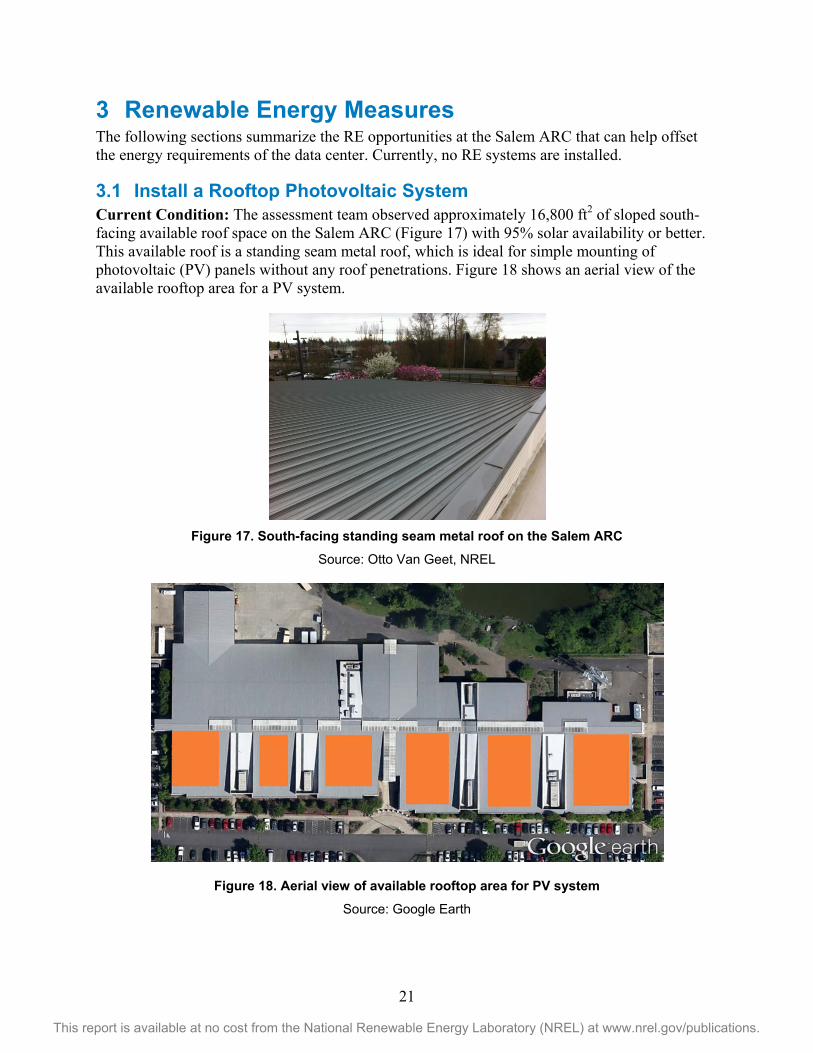
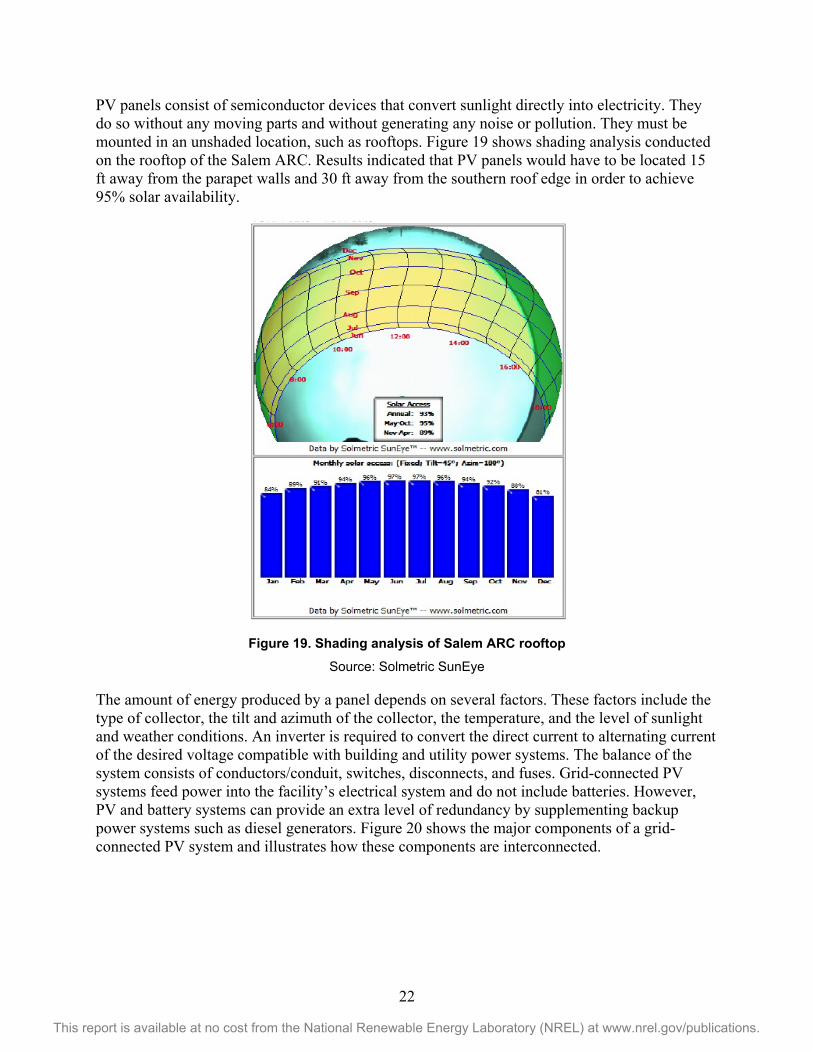
3.1 Install a Rooftop Photovoltaic System Current Condition: The assessment team observed approximately 16,800 ft2 of sloped south-facing available roof space on the Salem ARC (Figure 17) with 95% solar availability or better. This available roof is a standing seam metal roof, which is ideal for simple mounting of photovoltaic (PV) panels without any roof penetrations. Figure 18 shows an aerial view of the available rooftop area for a PV system.
Figure 17. South-facing standing seam metal roof on the Salem ARC
Source: Otto Van Geet, NREL
Figure 18. Aerial view of available rooftop area for PV system
Source: Google Earth
22
This report is available at no cost from the National Renewable Energy Laboratory (NREL) at www.nrel.gov/publications. This report is available at no cost from the National Renewable Energy Laboratory (NREL) at www.nrel.gov/publications.
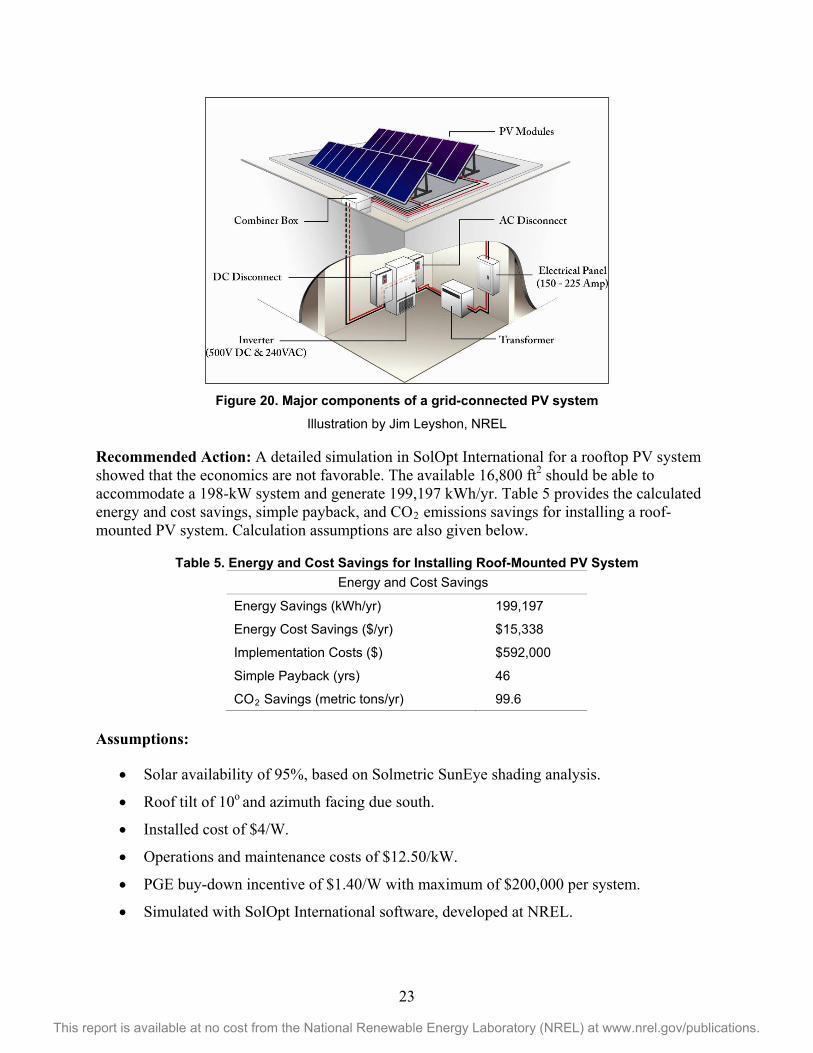
PV panels consist of semiconductor devices that convert sunlight directly into electricity. They do so without any moving parts and without generating any noise or pollution. They must be mounted in an unshaded location, such as rooftops. Figure 19 shows shading analysis conducted on the rooftop of the Salem ARC. Results indicated that PV panels would have to be located 15 ft away from the parapet walls and 30 ft away from the southern roof edge in order to achieve 95% solar availability.
Figure 19. Shading analysis of Salem ARC rooftop
Source: Solmetric SunEye
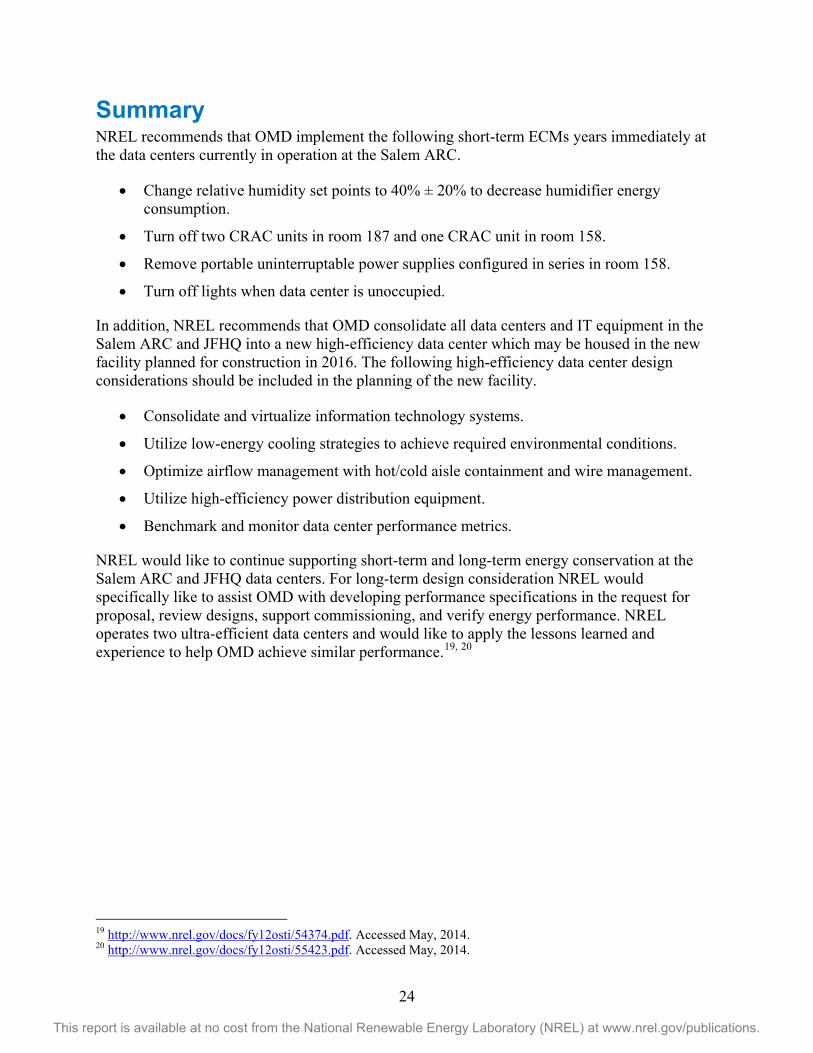
The amount of energy produced by a panel depends on several factors. These factors include the type of collector, the tilt and azimuth of the collector, the temperature, and the level of sunlight and weather conditions. An inverter is required to convert the direct current to alternating current of the desired voltage compatible with building and utility power systems. The balance of the system consists of conductors/conduit, switches, disconnects, and fuses. Grid-connected PV systems feed power into the facility’s electrical system and do not include batteries. However, PV and battery systems can provide an extra level of redundancy by supplementing backup power systems such as diesel generators. Figure 20 shows the major components of a grid-connected PV system and illustrates how these components are interconnected.
23
This report is available at no cost from the National Renewable Energy Laboratory (NREL) at www.nrel.gov/publications. This report is available at no cost from the National Renewable Energy Laboratory (NREL) at www.nrel.gov/publications.
Figure 20. Major components of a grid-connected PV system
Illustration by Jim Leyshon, NREL
Recommended Action: A detailed simulation in SolOpt International for a rooftop PV system showed that the economics are not favorable. The available 16,800 ft2 should be able to accommodate a 198-kW system and generate 199,197 kWh/yr. Table 5 provides the calculated energy and cost savings, simple payback, and CO2 emissions savings for installing a roof-mounted PV system. Calculation assumptions are also given below.
Table 5. Energy and Cost Savings for Installing Roof-Mounted PV System Energy and Cost Savings
Energy Savings (kWh/yr) 199,197
Energy Cost Savings ($/yr) $15,338
Implementation Costs ($) $592,000
Simple Payback (yrs) 46
CO2 Savings (metric tons/yr) 99.6 Assumptions:
• Solar availability of 95%, based on Solmetric SunEye shading analysis.
• Roof tilt of 10o and azimuth facing due south.
• Installed cost of $4/W.
• Operations and maintenance costs of $12.50/kW.
• PGE buy-down incentive of $1.40/W with maximum of $200,000 per system.
• Simulated with SolOpt International software, developed at NREL.
24
This report is available at no cost from the National Renewable Energy Laboratory (NREL) at www.nrel.gov/publications. This report is available at no cost from the National Renewable Energy Laboratory (NREL) at www.nrel.gov/publications.
Summary NREL recommends that OMD implement the following short-term ECMs years immediately at the data centers currently in operation at the Salem ARC.
• Change relative humidity set points to 40% ± 20% to decrease humidifier energy consumption.
• Turn off two CRAC units in room 187 and one CRAC unit in room 158.
• Remove portable uninterruptable power supplies configured in series in room 158.
• Turn off lights when data center is unoccupied.
In addition, NREL recommends that OMD consolidate all data centers and IT equipment in the Salem ARC and JFHQ into a new high-efficiency data center which may be housed in the new facility planned for construction in 2016. The following high-efficiency data center design considerations should be included in the planning of the new facility.
• Consolidate and virtualize information technology systems.
• Utilize low-energy cooling strategies to achieve required environmental conditions.
• Optimize airflow management with hot/cold aisle containment and wire management.
• Utilize high-efficiency power distribution equipment.
• Benchmark and monitor data center performance metrics.
NREL would like to continue supporting short-term and long-term energy conservation at the Salem ARC and JFHQ data centers. For long-term design consideration NREL would specifically like to assist OMD with developing performance specifications in the request for proposal, review designs, support commissioning, and verify energy performance. NREL operates two ultra-efficient data centers and would like to apply the lessons learned and experience to help OMD achieve similar performance.19, 20
19 http://www.nrel.gov/docs/fy12osti/54374.pdf. Accessed May, 2014. 20 http://www.nrel.gov/docs/fy12osti/55423.pdf. Accessed May, 2014.

25
Appendix – Psychrometric Bin Analysis
Results Hours Energy (kWh) Hours Energy (kWh)Zone1: DX Cooling Only 10 1 0Zone2: Multi-stage Indirect Evap. + DX 61 21 0 0Zone3: Multi-stage Indirect Evap. Only 71 11 3 0Zone4: Direct Evap. Cooler Only 249 19 49 4Zone5: Direct Evap. Cooler + Economizer 3022 133 133 5Zone6: Economizer Only 4352 0 6174 0Zone7: 100% Outside Air 995 0 2401 0Total 8,760 185 8,760 9Estimated % Savings - 98% - 100%
Recommended Range Allowable Range