data bulletin march 2018 - fca.org.uk · data bulletin march 2018 in focus: • findings from the...
TRANSCRIPT
Data BulletinMarch 2018
In focus:• Findings from the FCA’s Financial Lives Survey 2017 – pensions and
retirement income sector• Latest trends in the retirement income market
Issue 12

2
Financial Conduct AuthorityData Bulletin: Issue 12 – March 2018
Jo HillDirector of Market Intelligence, Data and Analysis
In this issue of the Data Bulletin we focus on how the pensions and retirement income market is evolving. This is the fifth time we have looked at our regular market data in the Bulletin, but the first time we have a wealth of new data from our Financial Lives Survey to explore alongside the market data.As you will see, drawing these two datasets together does not make for perfect comparison but useful insights are revealed. We are continuing to evolve our approach to make these data sets comparable.Section 1 of the Bulletin focuses on consumers’ perception of their pension holdings, attitudes and experience of saving for retirement. Section 2 explores the consumer experience of making retirement income choices since the pension freedoms in 2015. When compared to our retirement income market data, it is clear that many consumers lack understanding of what they will need and what products best serve these needs. In Section 3, we provide the latest data from our monitoring of market trends. The latest data highlight a number of continuing or accelerating trends in the first half of financial year 2017/18. We continue to see that annuities are declining in popularity and more people are taking drawdown products. For the first time we also publish information on the stock of existing pension plans as reported by firms at the end of financial years 2015/16 and 2016/17 providing an indication of changes in the size of the market. While lots of activity is taking place in this sector, when we look at these two data sources together it is evident that consumers may not always have confidence or understanding if their choice is the right one. I hope you find this information insightful. Please email us at [email protected] if you have any suggestions about future data you are interested in or complete our reader survey to provide us with feedback on how you use the Data Bulletin. Jo HillDirector of Market Intelligence, Data and Analysis
Contents3 Executive summary4 Section 1: Findings from the FCA’s Financial Lives Survey 2017 –
consumer attitudes and experience of pension savings14 Section 2: Retirement income choices – Financial Lives Survey and
Retirement Income market data23 Section 3: Latest trends in the retirement income market31 In case you missed them
Introductionfrom the editor
Introduction
3
Financial Conduct AuthorityData Bulletin: Issue 12 – March 2018
Since the pension freedoms were introduced in April 2015, consumers have had the choice to access their pension pots in a greater variety of ways. But our recent Financial Lives Survey shows many consumers are unsure how to navigate these choices. This Data Bulletin draws together consumer experience data from our Financial Lives Survey and trends in the retirement income market collected through our Retirement Income Data Request (RIDR).
A third of people have no private pension provision and half of consumers with a pension have not reviewed how much it is worth in the last 12 months Our Financial Lives Survey shows that a third of all UK adults, including current retirees, report having no private pension provision. Among those contributing to a pension, 53% have not reviewed how much their pension pots are worth in the last 12 months. The propensity to review increases with pot size, with the tipping point appearing to be at a pot size greater than £20,000, where people are more likely to have reviewed than not.
Consumer knowledge, understanding and engagement with pensions is low A third (32%) of defined contribution pension holders and a quarter (26%) of people 55 and over and not retired state they do not know the size of their pension savings. 45% state they do not give their pension much thought until they are two years from retirement, commonly citing that they never have enough time. Eight in ten people (81%) with a defined contribution pension state they have not given much thought to how much they should be paying into it to maintain a reasonable standard of living when they retire.
Around 300,000 pension pots have been accessed for the first time every six months since the pension freedoms were introduced In the six months following the introduction of the pension freedoms in April 2015, our market data showed more than 415,000 pension pots were accessed for the first time. Since then, around 250,000 to 315,000 pots have been accessed in each six month period. The first half of the financial year (April – September) typically has more pots being accessed than the second half. In our latest data, more than 317,000 pension pots were accessed – an increase of 15% from the previous six months.
There is uncertainty among consumers about their retirement options The Financial Lives Survey highlights a lack of understanding and confusion about retirement income options. A quarter (25%) of people who have accessed a defined contribution pension in the last two years report that they get an income or have taken a cash lump sum but are not sure how this works. There is also confusion about the features of each product. For example, only six in ten (59%) knew that a single life annuity would give them a guaranteed income for the rest of their life; 11% thought that there was a risk that the value of their fund could go up or down. In addition, less than half (46%) of consumers who made a retirement income decision in the last two years thought about their health or life expectancy.
More than half of all pension pots accessed are full cash withdrawals, but only 17% of consumers who have accessed a pension pot report fully withdrawing their pension pot in the last two years Our market data show 55% of all pots accessed since pension freedoms were taken as full cash withdrawals. The Financial Lives Survey shows that 17% of adults say that they have fully withdrawn their pension in the last two years. This difference may be explained both by those who are uncertain how they accessed their pot and also that consumers may cash in multiple smaller pots. Smaller pots are most likely to be taken as full cash withdrawals, with 88% of pots fully withdrawn totalling less than £30,000.
Since pension freedoms, twice as many pots have entered drawdown than annuities Since the pension reforms, there has been an increase in the number of pension pots entering into drawdown. 30% of pots accessed since October 2015 have gone into drawdown and 12% taken as an annuity. The Financial Lives Survey data show, however, that 20% of adults say they took out a drawdown product and 29% an annuity. A quarter of people do not recall how they accessed their pension pot which may account for these differences. These data emphasise the uncertainty and lack of engagement among consumers about their retirement income choices.
Executive summary
Executive summary
Our analysis is based on two data sets. The Financial Lives Survey is consumer data and measures the number of consumers taking different actions. The market data, or retirement income data request, measures the number of pension pots accessed. The two are, therefore, not directly comparable.

4
Financial Conduct AuthorityData Bulletin: Issue 12 – March 2018
Overview
This Bulletin draws on consumer data from the FCA’s Financial Lives Survey, published in October 2017, and market data which the FCA has been collecting since the introduction of pension freedoms in April 2015. Both give a different perspective on the retirement income market. The background and methodology for each data set is outlined below.
Overview
Financial Lives SurveyThe Financial Lives Survey is one of the largest surveys the FCA has commissioned of UK adults. It looks at the financial products they hold, and their use of and attitudes towards financial services. It covers consumers’ experiences of using products and services, as well as dealing with the firms that provide them. The survey covers almost 13,000 respondents with findings weighted to represent the UK adult population aged 18 and over.
The survey is based on interviews conducted both online and face to face. It includes those without internet access.
The relevant sections of the Financial Lives Survey data tables have been referenced in pink text and can be found in the tables published alongside the bulletin. The full published survey report and datasets can be found here. We have not reported findings for any question with an unweighted base of less than 50 responses. We have reported percentages based on 50-99 unweighted responses with a square bracket as [x%].
The Financial Lives Survey considers any type of private pension provision. This includes both individually arranged (non-workplace) pensions and employer arranged (workplace) pensions. These pensions may not yet have been accessed, or may have been accessed either fully or
partially. In other words, we consider a consumer as having private pension provision, whether, for example, they have just started contributing to a private pension or have fully accessed their pension through purchasing an annuity.
Retirement Income DataThe latest Retirement Income Data Request (RIDR) for the period 1 April – 30 September 2017 was collected from a sample of 54 firms. To date it has included both their contract and trust-based assets. We estimate the survey covered 95% of defined contribution contract-based pension scheme assets when it was first introduced in 2015. This is likely to have changed with developments in the market. It does not include trust-based occupational pension schemes or defined benefit schemes. The data enable us to track what action consumers take the first time they access a pension pot. The data refer to the number of pots accessed rather than the number of consumers accessing their pots. Consumers may have multiple pension pots. This Bulletin provides a summary of the latest data. It has not been adjusted to make an estimate for the entire market.
The full data used to produce the analysis can be found in the data tables published alongside the Bulletin.
Reporting changesThe data request will be replaced from October 2018 by two regulatory data returns (REP015 and REP016). This will happen after the next round of data collection for the period 1 October 2017 – 31 March 2018. We have changed the format of the latest data request and the information collected to match the format of the new mandatory returns via GABRIEL. GABRIEL is our online system for collecting and storing regulatory data from firms. See policy statement 17/16 for more details:
• REP015 – retirement income flow data, collected twice a year for each six month period and to be introduced for the period 1 April to 30 September 2018 (reported from 1 October 2018)
• REP016 – retirement income stock and withdrawals flow data, collected annually at the end of each financial year, to be introduced for the period 1 April 2018 to 31 March 2019 (reported from 1 April 2019)
Financial Conduct AuthorityData Bulletin: Issue 12 – March 2018
Section 1
5
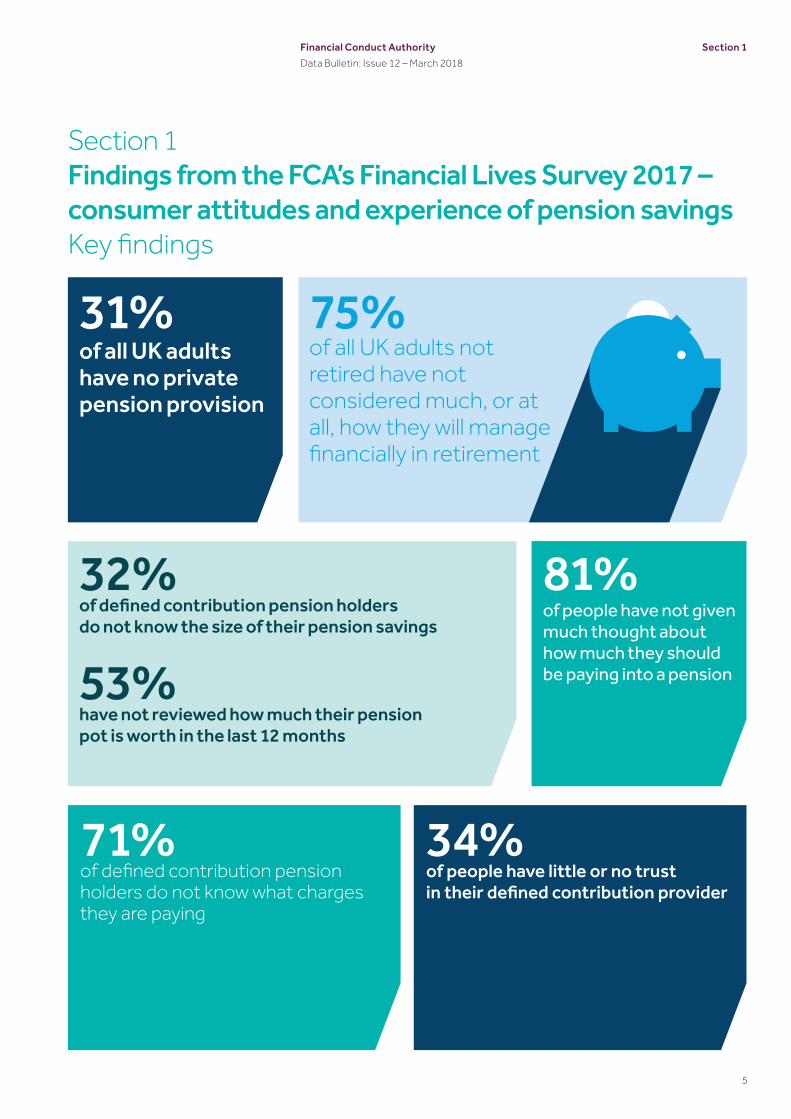
Section 1Findings from the FCA’s Financial Lives Survey 2017 – consumer attitudes and experience of pension savingsKey findings
31%of all UK adults have no private pension provision
75%of all UK adults not retired have not considered much, or at all, how they will manage financially in retirement
32%of defined contribution pension holders do not know the size of their pension savings
53%have not reviewed how much their pension pot is worth in the last 12 months
71%of defined contribution pension holders do not know what charges they are paying
34%of people have little or no trust in their defined contribution provider
of people have not given much thought about how much they should be paying into a pension
81%

6
Financial Conduct AuthorityData Bulletin: Issue 12 – March 2018
Figure 1: Private pension provision, by age and retirement status (%)
Section 1Findings from the FCA’s Financial Lives Survey 2017 – pensions and retirement income sectors
1. When respondents have an employer arranged private pension, the survey prompts them with a description of a defined benefit and defined contribution pension. If they do not recognise these, we assume they have a defined contribution pension.2 By ‘currently contributing’ we mean that contributions are currently being made -by the individual and/ or their employer.
Retired
55+ (not retired)
45-54 (not retired)
35-44
25-34
18-24
All
n Defined benefit only n Defined contribution only n Both defined contribution and defined benefit n No pension scheme n Don’t knowP_ACDV8 - Summary: All pensions schemes held, accumulating and decumulating. Base: All UK adults (w-base: 12,865 / u-base: 12,865)
%
22
22
20
13
4
20
12
10
4
1
1
6
42
46
48
47
25
39
23
20
24
32
62
31
1
1
4
7
8
30 10 20 30 40 50 60 70 80 90 100
Pension holdings
Figure 1 shows the proportion of the UK adult population that have or have had a defined contribution or defined benefit scheme, arranged themselves or through an employer.1 The chart shows that:
• Two thirds (66%) of all UK adults say they have or have had a private pension scheme which they have yet to access or have already accessed.
• A third (31%) of all UK adults, including current retirees, report they have no pension scheme and will have to rely on the state or other ways of saving to fund their retirement.
Of particular note are people over 50 years old who have no private pension provision and have few years left to build one up before they reach their 60s. When asked why they had made no provision, 32% said it was too late to set one up, 26% said they could not afford to pay into a pension and 12% said they were relying on their partner’s pension (Table A).
The findings also reveal a gender gap in pension provision and state pension reliance. Almost 6 in 10 (59%) of those without private pension provision are women (Table B). Just over half (53%) of retired women say that the state pension is their main source of retirement income, compared to only 33% of retired men (Table C ).
There are signs that auto-enrolment into workplace pensions is increasing pension take-up rates among lower
age groups. 30% of 18-24 year olds have a pension and a quarter (25%) of this age group have a defined contribution scheme. Almost half (47%) of 25-34 year olds hold a defined contribution pension (Table B). The vast majority (95%) of 18-34 year olds currently contributing to a pension said the scheme was arranged by their employer (Table D)2.
45-54 year olds are the age group most likely to hold a pension. Three quarters (77%) of 45-54 year olds have a pension they have not yet accessed (Table E).
Section 1
3431 728 1
7
Financial Conduct AuthorityData Bulletin: Issue 12 – March 2018
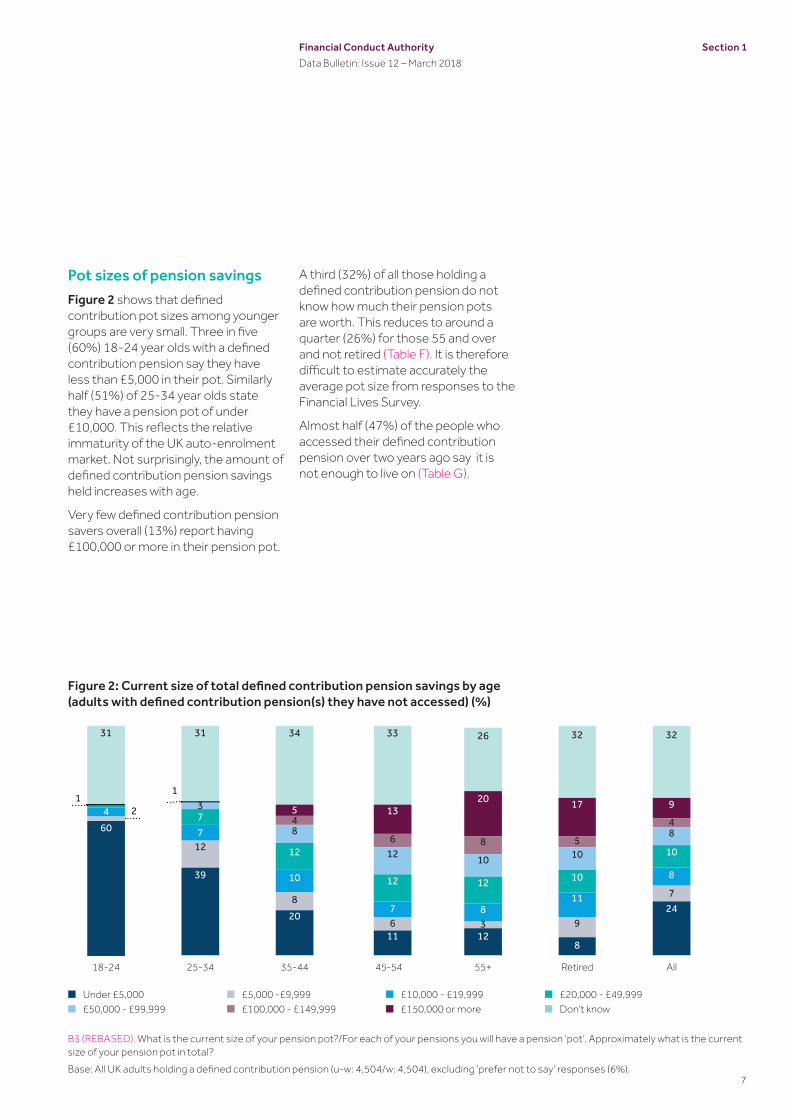
Pot sizes of pension savingsFigure 2 shows that defined contribution pot sizes among younger groups are very small. Three in five (60%) 18-24 year olds with a defined contribution pension say they have less than £5,000 in their pot. Similarly half (51%) of 25-34 year olds state they have a pension pot of under £10,000. This reflects the relative immaturity of the UK auto-enrolment market. Not surprisingly, the amount of defined contribution pension savings held increases with age.
Very few defined contribution pension savers overall (13%) report having £100,000 or more in their pension pot.
A third (32%) of all those holding a defined contribution pension do not know how much their pension pots are worth. This reduces to around a quarter (26%) for those 55 and over and not retired (Table F). It is therefore difficult to estimate accurately the average pot size from responses to the Financial Lives Survey.
Almost half (47%) of the people who accessed their defined contribution pension over two years ago say it is not enough to live on (Table G).
Figure 2: Current size of total defined contribution pension savings by age (adults with defined contribution pension(s) they have not accessed) (%)
B3 (REBASED). What is the current size of your pension pot?/For each of your pensions you will have a pension ‘pot’. Approximately what is the current size of your pension pot in total?Base: All UK adults holding a defined contribution pension (u-w: 4,504/w: 4,504), excluding ‘prefer not to say’ responses (6%).
n Under £5,000n £50,000 - £99,999
n £5,000 -£9,999n £100,000 - £149,999
n £10,000 - £19,999n £150,000 or more
n £20,000 - £49,999n Don’t know
31 31 34 33 26 32 32
2
7
10
7 811
8
12
8
6 3 9
7
4 7
12
12 12 10
10
13
8
12 10 10
8
1
4
6 8 5
45 13
20 17 9
60
39
20
11 128
24
18-24 25-34 35-44 45-54 55+ Retired All
Section 1

8
Financial Conduct AuthorityData Bulletin: Issue 12 – March 2018
Attitudes and engagement towards saving for retirementPension freedoms came into effect in April 2015 and have changed the decision horizon for those with a defined contribution pension. Before the reforms, most people only had the option of turning their pension savings into a guaranteed income for life by purchasing an annuity. This often coincided leaving work in their early to mid-60s. Now people can access pension funds in all sorts of ways at any time from 55 onwards, even while continuing to work.
Despite pension freedoms, Figure 3 shows there is a low level of engagement with planning for retirement, even among older cohorts. Just one in six (18%) 35-44 year olds have thought a great deal about how they will manage financially in retirement. This increases to just over a third (35%) of 45-54 year olds and 55% of 55 and over and not retired (Table H). Across all age groups the majority (75%) have not considered much or at all how they will manage financially in retirement. There is a marked increase in engagement for those 55 and over who plan to retire within the next two years, with 71% having given planning for retirement a great deal of thought. Proximity to retirement seems to drive people 55 and over to think more about planning their future finances.
Figure 3 shows that defined benefit only pension holders are more likely to have thought a great deal about how they will manage in retirement than those who only have a defined contribution pension (34% and 24%, respectively) (Table H). The choices that lie ahead however, are often very different for those with defined benefit or defined contribution
pensions. For those only with defined benefit pensions, there are few decisions to be made when they take an income. The responsibility of making the money last, making investment choices and deciding how much income to take, is mostly out of their hands. But for those with a defined contribution pension, who are not looking to take out an annuity, these decisions are more complex.
This apparent lack of forward thinking appears more due to the pressures of daily life rather than present bias. The survey finds that almost a quarter (24%) of those 55 and over and not retired say they would rather think about today than plan for the future (Table I). This is the lowest of any age group among non-retirees.Just over half (53%) say they never have enough time to get things done (Table J).
Figure 3: Thought given towards planning for retirement (by age and situation) (%)
P_AC14 (REBASED). Have you thought about how you are going to manage financially when you come to retire?Base: All UK adults not retired (w-base: 9,645 / u-base 9,241), excluding ‘don’t know’ responses (3%) .
0 20 40 60 80 100
Defined contribution only
Defined benefit only
55+ and no plans to retire within two years
55+ and plan to retire within two years
65+
55+
45-54
35-44
18-34
All UK adults not retired
n Have given it a great deal of thought n Have thought about it a littlen Haven’t really thought about it
%
24
34
48
71
65
55
35
18
8
25
27
18
15
6
12
13
18
33
58
35
49
48
37
23
23
32
47
49
34
40
Section 1

9
Financial Conduct AuthorityData Bulletin: Issue 12 – March 2018
Section 1
0 20 40 60 80 100
Figure 4 shows that most people with a defined contribution pension (81%) have not given much thought to how much they should be paying into their defined contribution pension each year to maintain a reasonable standard of living when they retire. Only 18% have given it a lot of thought. This increases to a third (33%) for those 55 and over and not retired. This low level of engagement is a concern, not least given the importance of early contributions, and more so for women who are less likely than men to have thought about how much they should be paying in.3 Consideration about how much contributions should be tends to increase with pot size. Figure 5 shows that those that have had regulated advice4 in the last 12 months are more likely to have considered this than those that have not. (Table K)
a
Figure 4: Thought given to size of contributions (by defined contribution pot size and gender) (%)
3. http://www.europarl.europa.eu/Reg-Data/etudes/STUD/2016/571363/IPOL_STU(2016)571363_EN.pdf 4. Advice has been defined as having received regulated financial advice about investments, saving into a pension or retirement planning. It does not include advice in the last 12 months on other financial products such as mortgages, general insurance or consumer credit.
Figure 5: Thought given to size of contributions (by advice) (%)
£150k to <£250k
£75k to <£150k
£20k to <£75k
£5k to <£20k
<£5k
55+ (not retired)
Female
Male
All UK adults with a defined contribution pension
Not advised
Advised
All UK adults with a defined contribution pension
n Have thought about it a lot n Have thought about it a littlen Haven’t considered it
n Have thought about it a lot n Have thought about it a littlen Haven’t considered it
%
%
103060
164935
245026
424315
53398
313633
454213
354223
394218
P7. Have you ever thought about how much you should be paying into your defined contribution pension each year to maintain a reasonable standard of living when you come to retire?Base: All UK adults with a defined contribution pension they have not accessed (w-base: 4,752, u-base: 1,496).
414317
273737
394218
0 20 40 60 80 100
0 20 40 60 80 100
10
Financial Conduct AuthorityData Bulletin: Issue 12 – March 2018
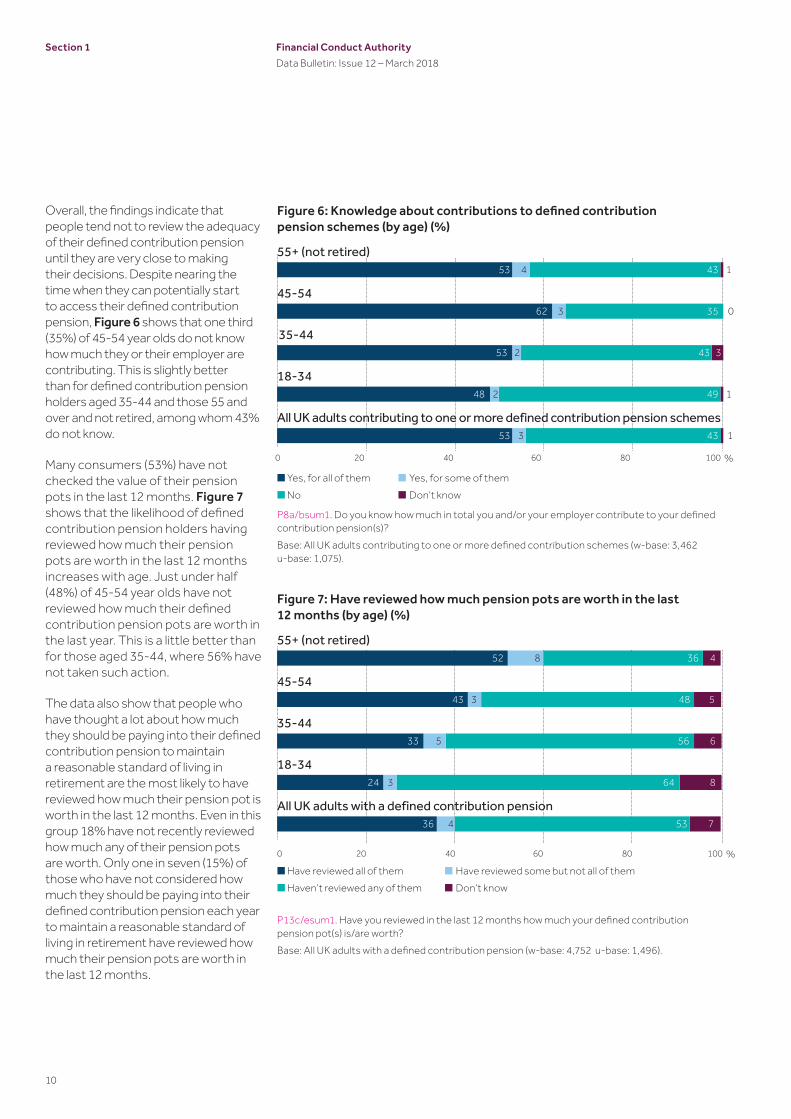
Overall, the findings indicate that people tend not to review the adequacy of their defined contribution pension until they are very close to making their decisions. Despite nearing the time when they can potentially start to access their defined contribution pension, Figure 6 shows that one third (35%) of 45-54 year olds do not know how much they or their employer are contributing. This is slightly better than for defined contribution pension holders aged 35-44 and those 55 and over and not retired, among whom 43% do not know.
Many consumers (53%) have not checked the value of their pension pots in the last 12 months. Figure 7 shows that the likelihood of defined contribution pension holders having reviewed how much their pension pots are worth in the last 12 months increases with age. Just under half (48%) of 45-54 year olds have not reviewed how much their defined contribution pension pots are worth in the last year. This is a little better than for those aged 35-44, where 56% have not taken such action.
The data also show that people who have thought a lot about how much they should be paying into their defined contribution pension to maintain a reasonable standard of living in retirement are the most likely to have reviewed how much their pension pot is worth in the last 12 months. Even in this group 18% have not recently reviewed how much any of their pension pots are worth. Only one in seven (15%) of those who have not considered how much they should be paying into their defined contribution pension each year to maintain a reasonable standard of living in retirement have reviewed how much their pension pots are worth in the last 12 months.
Figure 6: Knowledge about contributions to defined contribution pension schemes (by age) (%)
Figure 7: Have reviewed how much pension pots are worth in the last 12 months (by age) (%)
P8a/bsum1. Do you know how much in total you and/or your employer contribute to your defined contribution pension(s)? Base: All UK adults contributing to one or more defined contribution schemes (w-base: 3,462 u-base: 1,075).
P13c/esum1. Have you reviewed in the last 12 months how much your defined contribution pension pot(s) is/are worth?Base: All UK adults with a defined contribution pension (w-base: 4,752 u-base: 1,496).
55+ (not retired)
55+ (not retired)
45-54
45-54
35-44
35-44
18-34
18-34
All UK adults contributing to one or more defined contribution pension schemes
n Yes, for all of them n Yes, for some of themn No n Don’t know
n Have reviewed all of them n Have reviewed some but not all of themn Haven’t reviewed any of them n Don’t know
53
62
53
48
53
43
35
43
49
43
4
3
2
2
3
1
0
3
1
1
52
43
33
24
36
48
56
64
8
3
5
3
4
5
6
8
All UK adults with a defined contribution pension36 534 7
Section 1
%0 20 40 60 80 100
%0 20 40 60 80 100
11
Financial Conduct AuthorityData Bulletin: Issue 12 – March 2018
Section 1
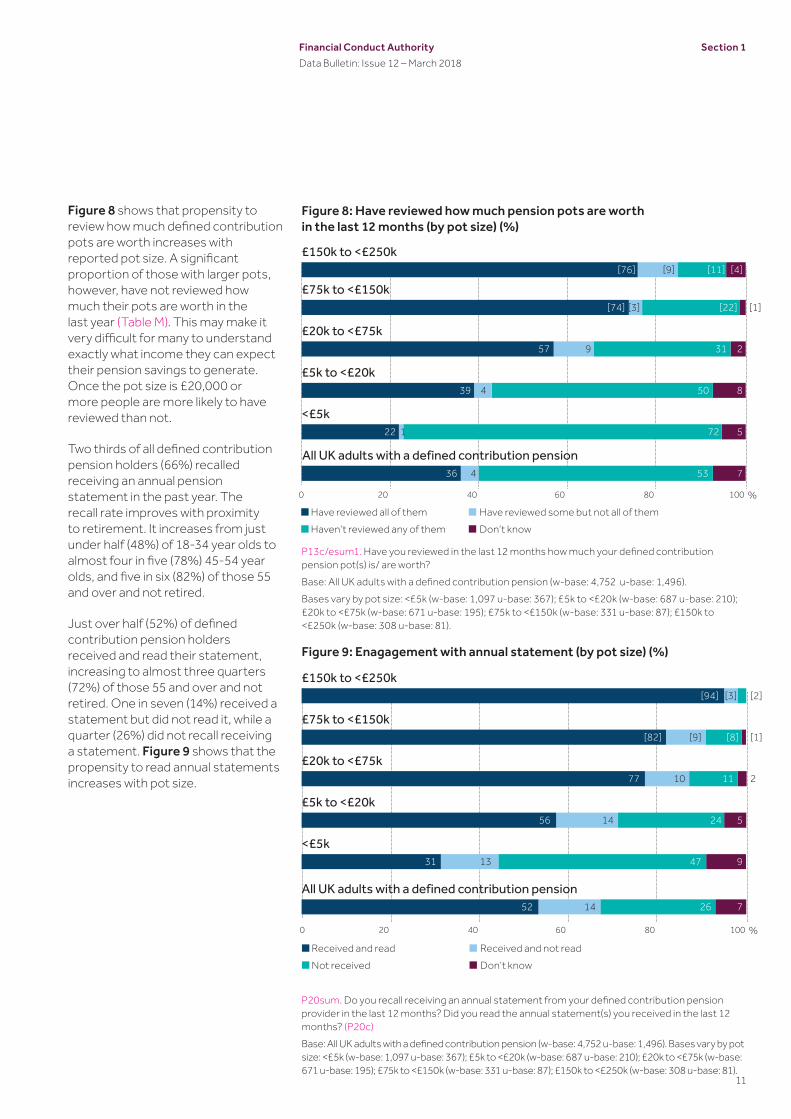
Figure 8 shows that propensity to review how much defined contribution pots are worth increases with reported pot size. A significant proportion of those with larger pots, however, have not reviewed how much their pots are worth in the last year (Table M). This may make it very difficult for many to understand exactly what income they can expect their pension savings to generate. Once the pot size is £20,000 or more people are more likely to have reviewed than not.
Two thirds of all defined contribution pension holders (66%) recalled receiving an annual pension statement in the past year. The recall rate improves with proximity to retirement. It increases from just under half (48%) of 18-34 year olds to almost four in five (78%) 45-54 year olds, and five in six (82%) of those 55 and over and not retired.
Just over half (52%) of defined contribution pension holders received and read their statement, increasing to almost three quarters (72%) of those 55 and over and not retired. One in seven (14%) received a statement but did not read it, while a quarter (26%) did not recall receiving a statement. Figure 9 shows that the propensity to read annual statements increases with pot size.
P13c/esum1. Have you reviewed in the last 12 months how much your defined contribution pension pot(s) is/ are worth?Base: All UK adults with a defined contribution pension (w-base: 4,752 u-base: 1,496).Bases vary by pot size: <£5k (w-base: 1,097 u-base: 367); £5k to <£20k (w-base: 687 u-base: 210); £20k to <£75k (w-base: 671 u-base: 195); £75k to <£150k (w-base: 331 u-base: 87); £150k to <£250k (w-base: 308 u-base: 81).
Figure 8: Have reviewed how much pension pots are worth in the last 12 months (by pot size) (%)
Figure 9: Enagagement with annual statement (by pot size) (%)
P20sum. Do you recall receiving an annual statement from your defined contribution pension provider in the last 12 months? Did you read the annual statement(s) you received in the last 12 months? (P20c)Base: All UK adults with a defined contribution pension (w-base: 4,752 u-base: 1,496). Bases vary by pot size: <£5k (w-base: 1,097 u-base: 367); £5k to <£20k (w-base: 687 u-base: 210); £20k to <£75k (w-base: 671 u-base: 195); £75k to <£150k (w-base: 331 u-base: 87); £150k to <£250k (w-base: 308 u-base: 81).
n Have reviewed all of them n Have reviewed some but not all of themn Haven’t reviewed any of them n Don’t know
£150k to <£250k
£75k to <£150k
£20k to <£75k
£5k to <£20k
<£5k
All UK adults with a defined contribution pension
£150k to <£250k
£75k to <£150k
£20k to <£75k
£5k to <£20k
<£5k
All UK adults with a defined contribution pension
n Received and read n Received and not readn Not received n Don’t know
[76]
[74]
57
39
22
36
[11]
[22]
31
50
72
53
[9]
[3]
9
4
1
4
[4]
[1]
2
8
5
7
[94]
[82]
77
56
31
52
[2]
[8]
11
24
47
26
[3]
[9]
10
14
13
14
[1]
2
5
9
7
%0 20 40 60 80 100
%0 20 40 60 80 100

12
Financial Conduct AuthorityData Bulletin: Issue 12 – March 2018
Figure 10 shows that seven in ten (71%) UK adults with a defined contribution scheme are not aware of any charges on their pension. Six in ten (61%) 45-54 year olds with a defined contribution pension are not aware of any charges on their defined contribution pension. This compares favourably with three quarters (75%) of those aged 35-44 who do not know what they are paying in charges. A significant proportion [48%] of those who have taken advice in the last 12 months also do not have awareness of any charges on their pension.
Half (49%) of UK adults with a defined contribution pension reported that they did not choose where their contributions were invested when they joined/set up their defined contributions pension. Only 16% selected where their contributions are invested themselves and 22% actively opted into the default fund. A significant portion (14%) do not know whether or not they chose where their contributions are invested, reflecting the low levels of engagement with defined contribution pensions (Table P).
Figure 10: Awareness of charges on defined contribution pension (by age) (%)
P26a/b. Are you aware of any charges incurred on your defined contribution pension? Summary showing awareness of any charges incurred on their defined contribution pension.Base: UK adults with a defined contribution scheme (w-base: 4,752 u-base: 1,496). Bases vary by advice: Advised (w-base: 385 u-base: 70); Not advised (w-base: 4,366 u-base: 1,426).
n Aware of charges for all schemes n Aware of charges for some schemesn Not aware of charges
Advised
55+ (not retired)
45-54
35-44
18-34
All UK adults with a defined contribution pension
22
[41]
37
31
19
12
23
73
[48]
54
61
75
86
71
5
[11]
9
9
6
2
6
Section 1
%0 20 40 60 80 100
Not advised

13
Financial Conduct AuthorityData Bulletin: Issue 12 – March 2018
Section 1
Trust and satisfaction with pension providerTrust and satisfaction levels among defined contribution pension holders reflect their levels of engagement with their pension. Over a third (36%) of adults with a defined contribution pension rated their satisfaction as low with their defined contribution pension provider (Table Q)5. People who had retired and still accumulating a pension have generally higher levels of satisfaction than those still working. A quarter (24%) of defined contribution pension holders could not say whether they are satisfied or dissatisfied with their pension provider.
Figure 11 shows that a third (34%) of defined contribution pension holders state they have low levels of trust in their defined contribution pension provider. Once again this is less likely for those who have retired, who have greater levels of trust than younger people still working. This reflects the low levels of engagement among those still at work. A further quarter (23%) of defined contribution pension holders, including those who have retired, do not know enough about their provider to comment.
Trust in defined contribution pension providers seems to be associated with levels of confidence in managing money. Those who are highly confident in managing their money are twice as likely to trust in their defined contribution pension provider than those who are less confident managing their money. Low levels of confidence with managing money also seems to be associated with low levels of trust in defined contribution pension providers.
Those who report a high level of knowledge about financial matters are three times as likely to have a high level of trust in their defined contribution pension provider than those with lower financial knowledge.
Figure 11: Trust in defined contribution pension provider (by confidence in managing money and retirement status) (%)
P45. How much trust do you have in this provider? Please answer on a scale of 0 to 10, where 0 is ‘do not trust at all’ and 10 is ‘trust completely’. For this question trust scores have been classified as follows: Low or not at all (0-6), Medium (7-8), High (9-10).Base: All UK adults with a defined contribution pension (w-base: 4752, u-base: 1496).* Those retired in this question have pensions they are still accumulating.
n Low n Moderate n High n Don’t know
Low or not at all
Medium
High
Retired*
55+ (not retired)
All UK adults with a defined contribution pension
48
35
27
26
38
34
9
8
22
33
18
14
19
33
30
31
30
29
24
23
21
9
14
23
%0 20 40 60 80 100
5 P43. Overall, how satisfied are you with this provider? Please answer on a scale of 0 to 10, where 0 is ‘not at all satisfied’ and 10 is ‘com-pletely satisfied’. For this question satisfaction scores have been classified as follows: Low (0-6), Medium (7-8), High (9-10) Base: All UK adults with a DC pension (w-base: 4752, u-base: 1496)
14
Financial Conduct AuthorityData Bulletin: Issue 12 – March 2018
Section 2
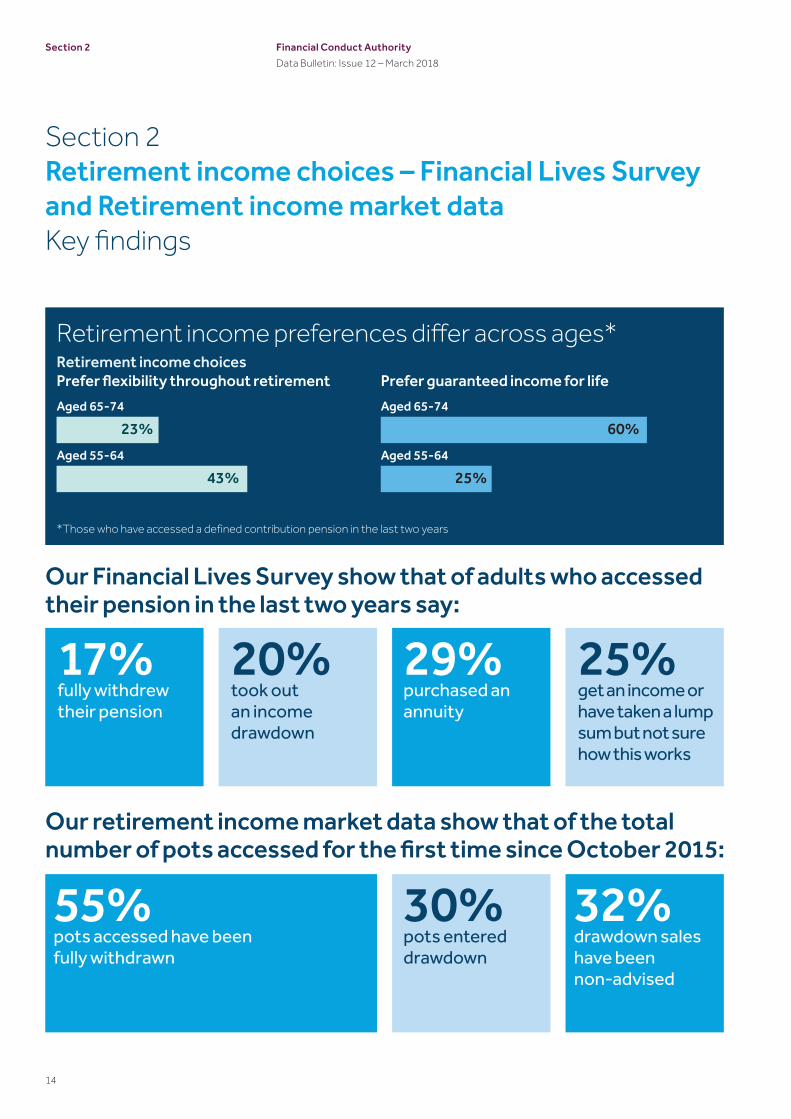
Section 2Retirement income choices – Financial Lives Survey and Retirement income market dataKey findings
Prefer flexibility throughout retirement Retirement income choicesRetirement income preferences differ across ages*
23%
43%
60%
25%
Prefer guaranteed income for life Aged 65-74
Aged 55-64 Aged 55-64
Aged 65-74
Our Financial Lives Survey show that of adults who accessed their pension in the last two years say:
Our retirement income market data show that of the total number of pots accessed for the first time since October 2015:
17%fully withdrew their pension
30%pots entered drawdown
20%took out an income drawdown
29%purchased an annuity
25%get an income or have taken a lump sum but not sure how this works
55%pots accessed have been fully withdrawn
32%drawdown sales have been non-advised
*Those who have accessed a defined contribution pension in the last two years

15
Financial Conduct AuthorityData Bulletin: Issue 12 – March 2018
Our findings from Section 1 show that many consumers lack awareness and understanding of how much they need to save in their pension to fund their retirement. This section looks at how consumers are choosing to access their pension pots, based on both the Financial Lives Survey and our market data on retirement income choices since October 2015. We focus on those who report that they accessed their pension in the last two years identifying preferences among different consumer types. We examine these findings alongside trends observed from our retirement income market data since the pension freedoms, relating to the number of pension pots accessed for the first time.
Comparing these data is insightful, but not always conclusive. We continue to explore how to make these data sets more comparable.
When referring to UK adults or consumers we are drawing on the findings from our Financial Lives Survey.
We look first at all access to pension pots and then focus on access since pension freedoms.
Consumer access to pension fundsFigure 12 shows that a fifth (19%) of all UK adults have already accessed a private pension scheme, at any point in time. They are either receiving an income or taking a cash lump sum payment. This includes 36% of those 55 and over who are not retired. Access to a private pension is not necessarily related to retiring from work completely.
Those who are already retired are more likely to have accessed a pension through a defined benefit scheme that those who are not yet retired. 58% of all retired adults have accessed a pension, a third (34%) of whom benefit from a defined benefit scheme. This compares to less than a fifth (17%) of retired adults who have a defined contribution scheme(s), either through an employer (6%) or arranged personally (11%). 11% are receiving
income or have taken a cash lump sum from a pension scheme arranged through their employer but are unsure what type of pension it is (Table S).
Those who report a high level of knowledge about financial matters are three times as likely to have a high level of trust in their defined contribution pension provider than those with lower financial knowledge.
Section 2
Figure 12: Proportion of UK adults who have accessed a pension (by type of pension) (%)
P_DEC2 (REBASED TO ALL). Thinking only of the pension or pensions you are receiving an income from, or have taken a cash lump sum from, what type of pension was this? Base: All UK adults (w-base/u-base: 12,865). Bases vary by life stage: 55+ (not retired) (w-base: 1,940 u-base: 1,979); Retired (w-base: 2,890 u-base: 3,318)
Retired
55+ (not retired)
All UK adults
n Defined benefit n Employer arranged defined contributionn Pension arranged by employer but you are not sure what typen Personally arranged defined contribution pensionn Don’t know n Not accessed any private pension scheme
34
15
10
42
64
81
11
6
4
11
4
3
3
10
2
6
3
2
%0 20 40 60 80 100
Section 2Introduction
Although not directly comparable on a like-for-like basis, we find that some of the consumer survey findings are at odds with our market data. These findings are valuable too, however, where they help illustrate consumer perception and misunderstanding, or areas for further research.

Table 1 shows that almost two fifths (39%) of those who have accessed a defined contribution pension say they have purchased an annuity and just over 1 in 10 (12%) say they are in income drawdown (Table T). A third (33%) of those 55 and over that have not retired have also purchased an annuity. This exceeds the combined proportion of those that either took up income drawdown (16%) or fully withdrew their pension pot (14%). Most did this over two years ago and therefore have not been affected by the pension freedoms.
Retirement income choices since pension freedomsFocusing on the decisions made in the last two years, Table 2 shows some notable differences in consumer responses when compared with our retirement income market data. Our market data show that over half (55%) of pots accessed since the pension freedoms have been fully withdrawn, compared to less than a fifth (17%) of those who have accessed a defined contribution pension who report to have fully withdrawn their pension in the last two years. On the other hand, since the pension freedoms, only 3% of pots have been accessed for the first time through a partial lump sum payment, compared to 12% of UK adults who report they have taken a partial lump sum (UFPLS) payment in the last two years.
Annuity purchases account for only around one in ten pots (12%) accessed since the pensions freedoms compared to 29% of those who have accessed a defined contribution pension in the last two years who report that they purchased an annuity. On the other hand, 30% of pots have entered into income drawdown compared to only a fifth (20%) of those who have accessed a defined contribution pension in the
last two years who report to have done so in the last two years.
These differences may be for a number of reasons. They may highlight the lack of understanding among consumers that have recently accessed their defined contribution pension about the decision they have made and their lack of knowledge of retirement income options. A quarter of people report not knowing how they accessed their pension pot in the last two years. A greater proportion of those who have accessed a defined contribution pension in the last two years are likely to have fully withdrawn their pension or entered into drawdown than reported in our Financial Lives Survey. Similarly, a smaller proportion of those who have accessed a defined contribution pension in the last two years are likely to have purchased an annuity or taken an UFPLS payment than reported in Table 2.
Differences in pots fully withdrawn will also partly reflect the fact that consumers can hold multiple pension pots. For example our retirement income market data in Table 2 shows that more than half of all pots are fully withdrawn. Most (88%) of these are small pots (less than £30,000), perhaps likely accumulated by consumers in multiple employer pensions. These consumers may have fully withdrawn from a number of smaller pots, but may also have taken another form of retirement income from a larger pot.
Table 2 shows that 25% of those that have accessed a defined contribution scheme in the last two years get an income or have taken a cash lump sum from their pension but they are not sure how this works.
Despite evidence of consumer uncertainty, it is clear that those who have made a decision in the last two
16
Financial Conduct AuthorityData Bulletin: Issue 12 – March 2018
Section 2
Table 1: Retirement income decisions made by those who have accessed their defined contribution pension
All who have accessed their pension savings
All UK adults 55+ (not retired) Retired
Annuity 39% 33% 45%Income drawdown
12% 16% 10%
UFPLS 5% 9% 4%Fully withdrawn 9% 14% 6%
Not sure* 15% 13% 16%None of these 18% 11% 18%
Don’t know 7% 8% 6%P_DEC3: You said you are currently receiving an income or have taken a cash lump sum from at least one pension. Which of the following have you done with your pension(s)? Base: All UK adults receiving an income or have taken a lump sum from their defined contribution pension, or DK (w-base: 1334, u-base: 1589), of whom: 55+ (not retired) (w-base: 440, u-base: 462); Retired (w-base: 837, u-base: 1075).*Not sure = I get an income or have taken a cash lump sum but am not sure how

17
Financial Conduct AuthorityData Bulletin: Issue 12 – March 2018
Section 2
Figure 13: Retirement income choices in the last two years (by advice) (%)
P_DEC5 (REBASED TO ALL DECUMULATING A DC PENSION). You said you have done the following with your pension(s). Which, if any, of these have you done in the last two years?Base: All who have decumulated a defined contribution pension in the last two years (w-base: 473, u-base: 583), of whom Advised (w-base: 102, u-base: 145); Not advised (w-base: 371, u-base: 438)
Not advised
Advised
All UK adults who accessed a defined contribution pension in the last two years
n Took out annuity n Entered into income drawdownn UFPLS n Full cash withdrawaln Not sure
31
23
29
28
13
25
9
22
12
20
7
17
15
40
20
%0 20 40 60 80 100
Accessed in the last two years* Pots accessed for the first time since Oct 2015**
All UK adults 55+ (not retired) Retired % of total pots accessed
Number of pots accessed
Annuity 29% 22% 36% 12% 152,843
Income drawdown
20% 24% 18% 30% 345,265
UFPLS 12% 16% 8% 3% 33,045
Fully withdrawn 17% 26% 9% 55% 620,150
Not sure 25% 17% 31% -
None of these - - - -
*Source: Financial Lives Survey question: P_DEC 5 (REBASED TO ALL DECUMULATING A DC PENSION): You said you have done the following with your pension(s). Which, if any, of these have you done in the last two years? Base: All UK adults who accessed a defined contribution pension in the last two years (w-base: 473, u-base: 583), of whom: 55+ (not retired) (w-base: 214, u-base: 233); Retired (w-base: 251, u-base: 342).**Source: Retirement income market data since Oct 2015.
years are less likely to have purchased an annuity than those who have accessed their pension more than two years ago. They are therefore taking on personal responsibility for managing their defined contribution pension money throughout the rest of their life. This is consistent with our market data.
Use of advice in retirement income choicesBoth sets of data also provide insights into consumer use of advice in retirement income choices. Figure 13 shows that those who have accessed their defined contribution pension in the last two year and who report taking financial advice in the last 12 months are most likely to have entered into income drawdown. 40% of people who took advice entered drawdown, compared to only 20% of all UK adults that have accessed a defined contribution pension in the
Table 2: Comparison of retirement income decisions since pension freedoms – consumers vs pots accessed
last two years. 15% of those that have accessed their defined contribution pension in the last two year and report that they have not taken advice in the last 12 months have entered into income drawdown.

18
Financial Conduct AuthorityData Bulletin: Issue 12 – March 2018
Table 3 compares the retirement income choices of those who have accessed a defined contribution pension in the last two years and who report having taken regulated advice in the last 12 months, reported in Figure 13, with our retirement income market data, showing pots accessed since October 2015 where use of financial advice was recorded by the firm.
Table 3 shows that a greater proportion of pots (69%) that entered into drawdown record use of financial advice than any other product. This is broadly consistent with the findings from our Financial Lives Survey in Figure 13, which shows that those who have accessed a defined contribution pension in the last two years and who report having taken regulated advice in the last 12 months are more likely to have entered into drawdown than any other retirement income product. Once again we see a significant difference in the proportion of those who have accessed a defined contribution pension in the last two years and who report having taken regulated advice in the last 12 months who fully withdraw their pension in the last two years (7%), and the proportion of pots fully withdrawn since October 2015 where use of financial advice is recorded (37%). This at least partly reflects definitional differences, as explained above, in the two sets of data.
Section 2
Percentage of advised consumers*
Retirement income choices where use of advice recorded**Percentage of pots accessed since Oct 2015
Number of pots accessed since Oct 2015
Annuity 23% 36% 54,042 Income drawdown
40% 69% 231,194
UFPLS 22% 34% 9,442 Fully withdrawn 7% 37% 205,749
Not sure 13%
*Source: Financial Lives Survey question P_DEC5 (REBASED TO ALL DECUMULATING A DC PENSION). You said you have done the following with your pension(s). Which, if any, of these have you done in the last two years? Base: All those advised that have accessed a defined contribution pension in the last two years (w-base: 102, u-base: 145).**Source: Retirement income market data since Oct 2015.
Table 3: Use of advice in retirement income choices
19
Financial Conduct AuthorityData Bulletin: Issue 12 – March 2018
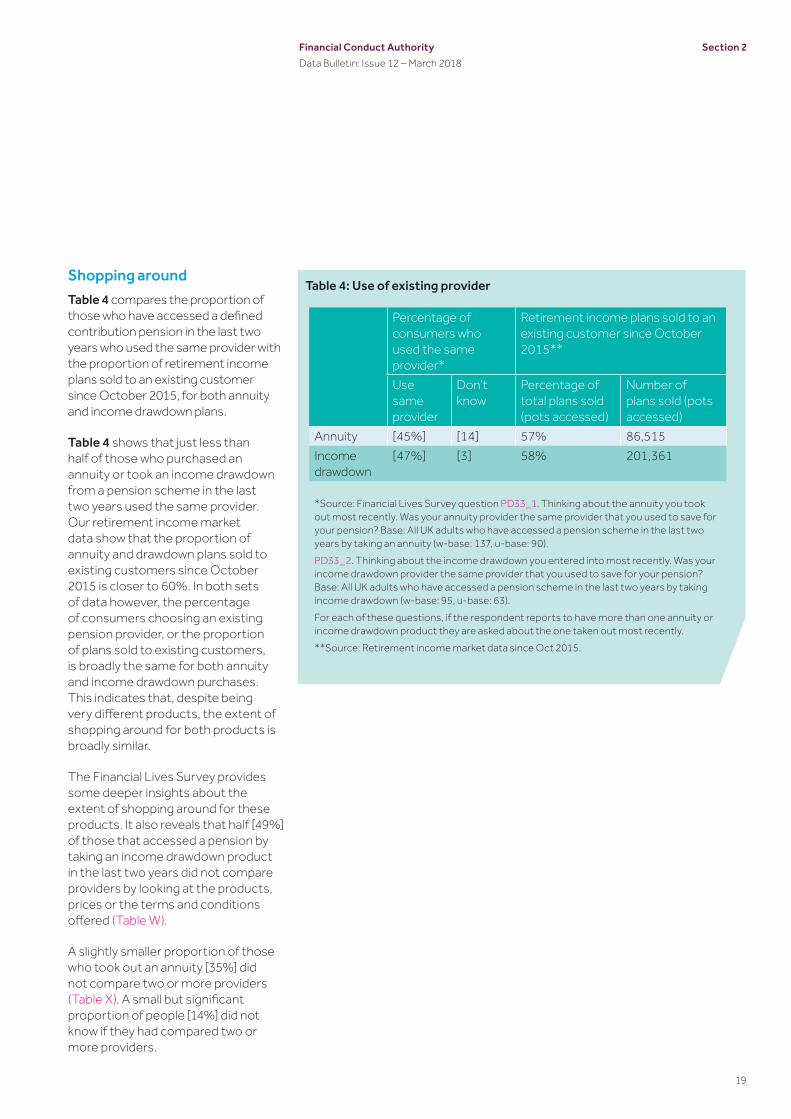
Shopping aroundTable 4 compares the proportion of those who have accessed a defined contribution pension in the last two years who used the same provider with the proportion of retirement income plans sold to an existing customer since October 2015, for both annuity and income drawdown plans.
Table 4 shows that just less than half of those who purchased an annuity or took an income drawdown from a pension scheme in the last two years used the same provider. Our retirement income market data show that the proportion of annuity and drawdown plans sold to existing customers since October 2015 is closer to 60%. In both sets of data however, the percentage of consumers choosing an existing pension provider, or the proportion of plans sold to existing customers, is broadly the same for both annuity and income drawdown purchases. This indicates that, despite being very different products, the extent of shopping around for both products is broadly similar.
The Financial Lives Survey provides some deeper insights about the extent of shopping around for these products. It also reveals that half [49%] of those that accessed a pension by taking an income drawdown product in the last two years did not compare providers by looking at the products, prices or the terms and conditions offered (Table W).
A slightly smaller proportion of those who took out an annuity [35%] did not compare two or more providers (Table X). A small but significant proportion of people [14%] did not know if they had compared two or more providers.
Percentage of consumers who used the same provider*
Retirement income plans sold to an existing customer since October 2015**
Use same provider
Don’t know
Percentage of total plans sold (pots accessed)
Number of plans sold (pots accessed)
Annuity [45%] [14] 57% 86,515 Income drawdown
[47%] [3] 58% 201,361
*Source: Financial Lives Survey question PD33_1. Thinking about the annuity you took out most recently. Was your annuity provider the same provider that you used to save for your pension? Base: All UK adults who have accessed a pension scheme in the last two years by taking an annuity (w-base: 137, u-base: 90).PD33_2. Thinking about the income drawdown you entered into most recently. Was your income drawdown provider the same provider that you used to save for your pension? Base: All UK adults who have accessed a pension scheme in the last two years by taking income drawdown (w-base: 95, u-base: 63).For each of these questions, if the respondent reports to have more than one annuity or income drawdown product they are asked about the one taken out most recently.**Source: Retirement income market data since Oct 2015.
Section 2
Table 4: Use of existing provider

20
Financial Conduct AuthorityData Bulletin: Issue 12 – March 2018
Retirement income preferencesThe survey also looks at factors people consider when making retirement income choices. Figure 14 shows that for many 55-64 year olds who report to have accessed a defined contribution pension in the last two years, flexibility is more important than having a guaranteed income for life. Two in five (43%) say they would prefer the flexibility to choose how much of their pension they take in their retirement. They are willing to risk that they might run out of money in the long term.
One in ten (13%) 55-64 year olds who report to have accessed a defined contribution pension in the last two years want to take their entire pension in the first few years of retirement, or before they give up work. They are less worried about keeping money for the long term. Just one in four (25%) 55-64 year olds who report to have accessed a defined contribution pension in the last two years prefer their pension to provide them with a guaranteed income for life. They are happy not to have access to their pension to take more or less money when they want.
Interestingly these preferences are very different to those held by older age groups. A quarter (23%) of 65-74 year olds who have accessed a defined contribution pension in the last two years prefer flexibility, while 60% prefer a guaranteed income for life (Table Y).
Although base sizes are too small to report conclusively, the data show that most retirement income choices are consistent with people’s preferences. For example, more than half [57%] of those who took out an income drawdown product in the last two years prefer flexibility and are willing
Figure 14: Consumer preferences when accessing a pension (by age) (%)
PD81N. When thinking about taking money from your pension, which of the following approaches do you prefer? Base: All UK adults who have accessed a pension scheme in the last two years (w-base: 441, u-base: 275). By age: 55 to 64 (w-base: 193, u-base: 111); 65 to 74 (w-base: 167, u-base: 118).
All UK adults who have accessed a pension scheme in the last two years
n Prefer to take entire pension in the first few years of retirement, or even before I give up work. I am less worried about keeping money for the long term
n Prefer to have flexibility to choose how much of my pension I take throughout my retirement and willing to risk that I might run out of money in the long term.
n Prefer my pension to provide me with a guaranteed income for as long as I live. I am willing not to have access to my pension to take more/less money when I want.
n Don’t know
65-74
55-64
2
13
7
60
25
46
14
19
17
23
43
31
%0 20 40 60 80 100
to risk running out of money. By contrast, three quarters [73%] of those that took out an annuity prefer to have a guaranteed income for life. A quarter [25%] of those taking out a drawdown product, however, said they prefer a guaranteed income for life. This indicates some degree of misunderstanding.
Section 2

21
Financial Conduct AuthorityData Bulletin: Issue 12 – March 2018
Figure 15 shows that just under half (46%) of those who accessed a pension scheme in the last two years thought about health or life expectancy. Those entering into income drawdown are more likely to think about these factors than those who bought an annuity. This is a key consideration for those with a defined contribution pension who choose not to take out an annuity. This is because the individual has the responsibility for making their money last in retirement. (Table Z).
People also find it difficult to envisage how long they will live. 55 to 64 year olds who were willing to make an estimate as to how long they expected to live predicted an average age of 83. This is a few years below actuarial predictions. This also masks a wide variation in expectations. Half (50%) expect to live to 80 or less, significantly under predicting longevity, while just 7% expect to live to 90 or beyond, way below the 40-50% or so who can expect this in reality. Just 4% expect to reach 100, again way below the 10% or so who can expect to reach this milestone6.
Therefore they may focus more on maximising income in their early years of retirement. They may consequently be less likely to factor in costs associated with later life, such as long-term care.
Figure 15: Factors considered when accessing a pension (by product) (%)
PD30. Thinking of the ... in the last two years. When you were deciding how to take money from your pension(s), which, if any, of the following did you consider?Base: All UK adults who have accessed a pension scheme in the last two years (w-base: 441, u-base: 275) By retirement income product type: Annuity (w-base: 137, u-base: 90); Income drawdown (w-base: 95, u-base: 63); Not sure (w-base: 110, u-base: 65).
Those who have started to get an income or taken a cash lump sum from a pension but they are not sure how
Income drawdown
Annuity
All UK adults who have accessed a pension scheme in the last two years
n Dependents/inheritance n Other income sources n Risks/guarantees/returns n Health/longevity
[6][32]
[12][23]
[37][72]
[57][79]
[17][60]
[44][51]
1749
3446
Section 2
6. “What are your chances of living to 100?”, ONS life expectancy statistics, January 2016: visual.ons.gov.uk/what-are-your-chances-of-living-to-100/

22
Financial Conduct AuthorityData Bulletin: Issue 12 – March 2018
Expectations for retirementFigure 16 shows that most people who had accessed a defined contribution pension in the last two years thought their outgoings would either decrease or stay the same in older age (27% and 42% respectively). Only a quarter (25%) thought their outgoings would increase. Just over a third [35%] of those that took out an annuity in the last two years thought that their outgoings would increase. This compares to a quarter [23%] of those that chose an income drawdown product (Table AA).
The survey also provides some insights into how people are using the money they access through their pension. The base sizes were too small to report conclusively, however, the majority of those that had fully withdrawn their pension in the last two years said they would use the money to pay off some large expense or debts. This compares to relatively few that said they would save or invest the money (Table AB).
Understanding of retirement income optionsMost (80%) of those who accessed a defined contribution pension in the last two years said that they understood their options well (54%) or to some extent (26%). Around half (49%) of those that did not report receiving regulated advice in the last 12 month said they understood their options very well (Table AC).
When tested about their understanding of the specific product features of annuities, drawdown and UFPLS as part of the Financial Lives Survey however, many were confused about what features related to each. Taking the case of a single life annuity only six in ten (59%) knew that this
option would give them a guaranteed income for the rest of their life. 11% thought that there was the risk that the value of their fund could go up or down. One in ten (10%) thought that they could leave their pot to someone when they died. Three in ten (31%) said they had never heard of a single life annuity (Table AD).
There are also misconceptions with income drawdown. Less than one in ten (8%) thought it gave a guaranteed income for life. 37% realised there would be the risk that the value of their fund could go up or down. There is evidence that those who entered into drawdown were slightly better at recognising the features of each option than those who bought an annuity (Table AE).
These data provide additional evidence of the challenges consumers face in understanding their retirement income options, which may account for the differences between the consumer and market data.
PD14. As you enter into older age do you expect that your outgoings will increase, decrease or stay about the same?
Base: All UK adults who have accessed a pension scheme in the last two years (w-base: 441, u-base: 275). By retirement income product type: Annuity (w-base: 137, u-base: 90); Income drawdown (w-base: 95, u-base: 63).
Figure 16: Expectations of outgoings for those that have accessed a pension in the last two years (%)Income drawdown
Annuity
All UK adults who have accessed a pension scheme in the last two years
n Increase n Decrease n Stay the same n Don’t know
[23]
[35]
25
[45] [4]
[4]
42 6
[33]
[29]
[28]
27
0 20 40 60 80 100
Section 2

23
Financial Conduct AuthorityData Bulletin: Issue 12 – March 2018
Section 3
Section 3:Retirement income market data April to September 2017Key findings
Compared to the same period in the previous year:
317,578
pension pots accessed for the first time
55%
517%in new drawdown plans
60%of pots entering income drawdown with existing planholder
68%of new income drawdown plans entered into were advised
613%in new annuity sales
53%of annuity purchases sold to existing customers
534%in UFPLS payments

Section 3
Latest trends in retirement income choices April 2015 – September 2017
Each period we measure the number of pension plans accessed for the first time by the planholder. This includes them taking a partial lump sum (UFPLS) payment or full cash withdrawal, moving into income drawdown or purchasing an annuity. The table below shows the take up of retirement income products for each six month period since Q2 2015, when pension freedoms were introduced.
Apr-Sept 2015
Oct 2015-Mar 2016
Apr-Sept 2016
Oct 2016-Mar 2017
Apr-Sept 2017
Year-on-year change (Apr-Sept)
Total since Oct 2015
Total pots accessed for the first time*
415,739 254,857 302,107 276,761 317,578 ▲5% 1,151,303
Annuities purchased
37,172 40,020 42,371 33,561 36,891 ▼13% 152,843
New income drawdown policies entered into and not fully withdrawn
n/a 80,182 83,450 83,687 97,946 ▲17% 345,265
Partial UFPLS payment taken and not fully withdrawn
n/a 6,747 7,521 8,707 10,070 ▲34% 33,045
Full cash withdrawals (by new customers**)
244,020 127,908 168,765 150,806 172,671 ▲2% 620,150
*It is not possible to compare returns for April – September 2015 with subsequent periods on a like for like basis. This is due to issues with data quality and changes in the format of information collected.**via UFPLS, flexi-access drawdown (FAD) or small pot lump sum
Table 5: Retirement income products entered into
24
Financial Conduct AuthorityData Bulletin: Issue 12 – March 2018

25
Financial Conduct AuthorityData Bulletin: Issue 12 – March 2018
Since the pension freedoms in April 2015, our data show that almost 1.6 million pension pots have been accessed. Over half (55%) of all pots accessed have been fully withdrawn. These are mostly small pension pots, with 88% below £30,000. More than twice as many pots are moving into drawdown than annuities. Approximately 30% of pots have entrered into drawdown, compared to only 12% that have been used to purchase annuities.
Data for the latest period show that the number of drawdown sales has continued to increase – up 17% compared to the same period in the
previous year. Almost three quarters of the growth in new drawdown plans was by plan holders aged 55-64. Almost half this growth relates to pots of over £100,000.
The majority of the fall in annuity sales is for pot sizes under £50,000.
Much of the growth in the number of full cash withdrawals has been for small value pot sizes (less than £10,000). The number of full cash withdrawals between April and September, at the start of a new tax year, is greater than those between October and March, in the second half of the tax year. This is typical of the pattern we see.
Much of the growth (40%) in the number of partial UFPLS withdrawals, where plan holders did not fully exhaust their pot, was also from pot sizes less than £10,000.
Figure 17: Number of pots accessed by product type since April 2015
n Partial UFPLS payment taken and not fully withdrawnn Annuities purchasedn New income drawdown policies entered into and not fully withdrawnn Full cash withdrawals (by new customers)l Total pots accessed for the first time
*Apr - Sept 2015 Oct 2015 - Mar 2016 Apr - Sept 2016 Oct 2016 - Mar 2017 Apr - Sept 2017
415,739
254,857
302,107276,761
317,578
8,70
7
33,5
61
150,
806
83,6
87
7,52
1 42,3
71 168,
765
83,4
50
6,74
7
40,0
20
127,
908
80,1
82
37,1
72
244,
020
10,0
70
36,8
91
97,9
46
172,
671
*Figures on drawdown and UFPLS were not collected in the same format between July and September 2015 and therefore have been omitted for this period.
Section 2

26
Financial Conduct AuthorityData Bulletin: Issue 12 – March 2018
Section 3
Product purchases by pot size and age
April – September 2017Access to pension pots varies significantly by age and by pot size. Many small pots exist and are most likely to be taken as full cash withdrawals. People aged under 65 are also more likely to take full cash withdrawals.
Figure 18 shows over 120,000 pots accessed were less than £10,000 in size. The majority (85%) of these were accessed through full cash withdrawals. As the pot size increases, the propensity for full cash withdrawals reduces. Most pots greater than £30,000 were accessed through drawdown plans. Figure 18 also shows that a greater proportion of pots between £50,000 and £249,999 were used to purchase annuities, compared to the other pot size bands.
Figure 19 shows that from April to September 2017, more pots were accessed by plan holders aged 55-64 than in any other age range. Most were fully withdrawn or entered drawdown, rather than being used to buy an annuity. A larger proportion of plan holders aged 65+ bought an annuity.
This is supported by our Financial Lives Survey data, which shows that those over 65 are more likely than younger age groups to choose an annuity. This reflects their preference for pension to provide a guaranteed income for life.
Figure 18: Composition of product purchases made between April and September 2017 (by pot size) (%)
Figure 19: Composition of product purchases made between April and September 2017 (by age) (%)
n Annuitiesn UFPLS
n Drawdownn Full cash withdrawals
l Total number of pots accessed
Less than£10,000
£10,000 - £29,000
£30,000 - £49,000
£50,000 - £99,000
£100,000 - £249,000
£250,000 and above
All pot sizes
120,052
224,2505,259
82,711
82,812
39,247
5,263
39.254
317,584
24,207 12,107 317,584.
85 61 32 16 5 2 54
2
4
4
4
44
3
9
23
45
59
7086
31
4
1319 21 20
812
Under 55 55-64 65-74 75+ All pot sizes
51 56 46 41 54
3
3 6
334
0
31
30 33
31
814
22 29
12
n Annuitiesn UFPLS
n Drawdownn Full cash withdrawals
l Total number of pots accessed by age of planholder

27
Financial Conduct AuthorityData Bulletin: Issue 12 – March 2018
Consumer behaviour when making retirement choices This section highlights the latest trends in some of the other data that are monitored through the retirement income data collection.
Shopping aroundThe proportion of sales to existing customers indicates the level of competition in the market. Customers should be encouraged to shop around when entering drawdown. Firms are also required to make customers aware of the open market option and their right to shop around when purchasing an annuity.7 Table 6 shows that during the latest six month period (April to September 2017):
• The proportion of drawdown plans entered into with an existing provider has increased. 60% of new drawdown plans were with an existing provider. This equates to roughly 59,000 plans. It compares to 57% (about 48,000 plans) during the same period the previous year. This accounts for more than two thirds of the increase in new drawdown plans entered into between the two periods.
• The proportion of annuity sales with an existing provider has decreased. The decline in annuity purchases is concentrated in sales of annuities to existing plan holders (down 6,000 or 13%). 53% of total annuity purchases were made by existing customers between April and September 2017 (about 19,000 plans) compared to 60% (about 25,000) during the same period in the previous year. Conversely, the proportion of annuity sales made to new customers or in single and multi-firm third party arrangements has increased from 40% to 47%.
Table 6: Sales to existing plan holders (October 2015-September 2017)
Number (% of total)Oct 2015-Mar 2016 Apr-Sep 2016 Oct 2016-Mar 2017 Apr-Sept 2017
Sold to existing planholder
Drawdown: 47,042
59%
47,730
57%
47,758
57%
58,831
60%Annuity Purchases:
23,406
58%
25,252
60%
18,412
55%
19,445
53%
53%of total annuity purchases were made by existing customers between April and September 2017
660%compared to the same period in 2016
7 The Retirement Outcomes Review considered whether consumers can shop around and choose from the wider range of products and options now available to them when accessing their defined contribution pension savings. The Interim Report can be accessed here.
Section 3

28
Financial Conduct AuthorityData Bulletin: Issue 12 – March 2018
Section 3
Number (% of total)Oct 2015-Mar 2016 Apr-Sep 2016 Oct 2016-Mar 2017 Apr-Sept 2017*
Pensions with guaranteed annuity rates (GARS)% of which not taken up
28,826
62%
33,366
53%
32,333
58%
38,097
54%
Access to pots with guaranteesConsumers should carefully consider the benefits and risks of their options for accessing pensions savings, including giving up the rights to guarantees. Table 7 shows that, during the latest six month period (April to September 2017):
• Around 38,000 pension pots with guaranteed benefits (eg guaranteed annuity rates (GARs) or deferred annuity) were accessed.
• In just over half (54%) the pots accessed in the period (about 21,000), the guaranteed benefit was not taken up. Of these, around two thirds (67%) were fully withdrawn. Most of this was for small pot sizes (less than £30,000).
Table 7: Take up of pensions with GARs (October 2015-September 2017)
*There was a change in the scope of the latest request (April-September 2017) to include additional guaranteed products. It is therefore not possible to compare these data on pensions with guarantees with past periods.
54%of pots accessed with a guaranteed annuity rate did not take up their guaranteed benefit
29
Financial Conduct AuthorityData Bulletin: Issue 12 – March 2018
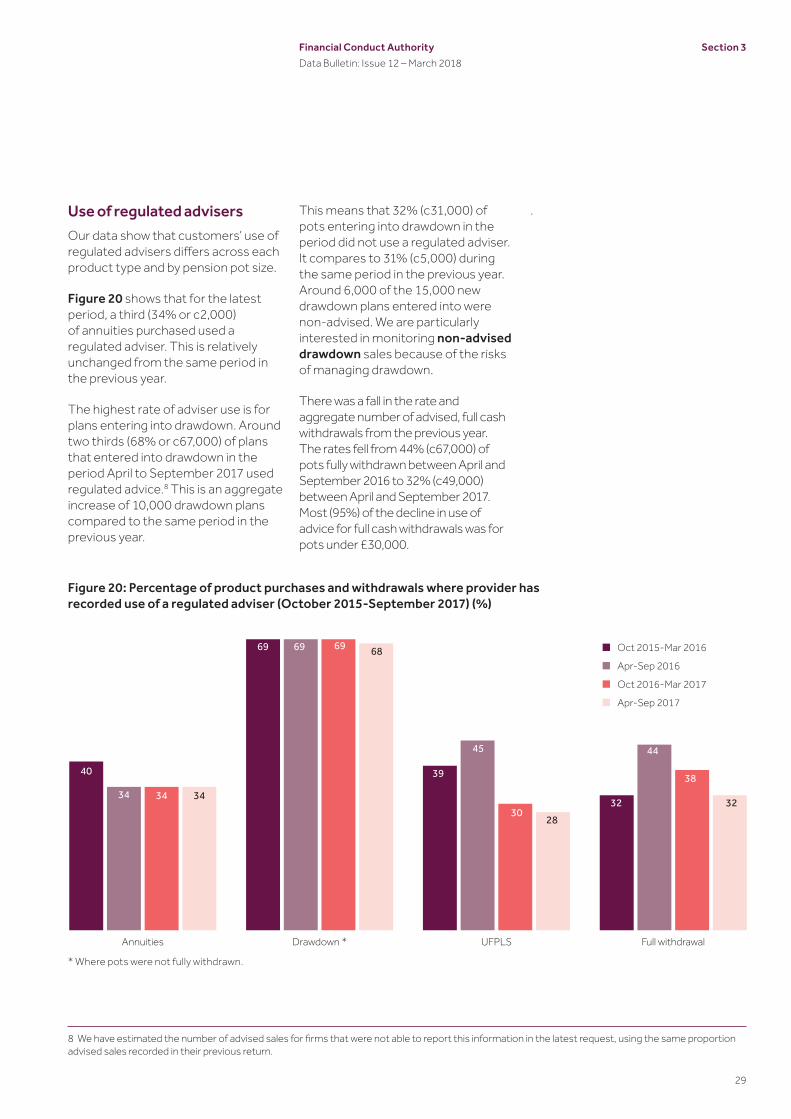
Use of regulated advisersOur data show that customers’ use of regulated advisers differs across each product type and by pension pot size.
Figure 20 shows that for the latest period, a third (34% or c2,000) of annuities purchased used a regulated adviser. This is relatively unchanged from the same period in the previous year.
The highest rate of adviser use is for plans entering into drawdown. Around two thirds (68% or c67,000) of plans that entered into drawdown in the period April to September 2017 used regulated advice.8 This is an aggregate increase of 10,000 drawdown plans compared to the same period in the previous year.
This means that 32% (c31,000) of pots entering into drawdown in the period did not use a regulated adviser. It compares to 31% (c5,000) during the same period in the previous year. Around 6,000 of the 15,000 new drawdown plans entered into were non-advised. We are particularly interested in monitoring non-advised drawdown sales because of the risks of managing drawdown.
There was a fall in the rate and aggregate number of advised, full cash withdrawals from the previous year. The rates fell from 44% (c67,000) of pots fully withdrawn between April and September 2016 to 32% (c49,000) between April and September 2017. Most (95%) of the decline in use of advice for full cash withdrawals was for pots under £30,000.
.
Figure 20: Percentage of product purchases and withdrawals where provider has recorded use of a regulated adviser (October 2015-September 2017) (%)
8 We have estimated the number of advised sales for firms that were not able to report this information in the latest request, using the same proportion advised sales recorded in their previous return.
n Oct 2015-Mar 2016
n Apr-Sep 2016
n Oct 2016-Mar 2017
n Apr-Sep 2017
Annuities Drawdown * UFPLS Full withdrawal
40
34 34 34
69 69 69 68
39
45
3028
32
44
38
32
* Where pots were not fully withdrawn.
Section 3
30
Financial Conduct AuthorityData Bulletin: Issue 12 – March 2018
Section 3
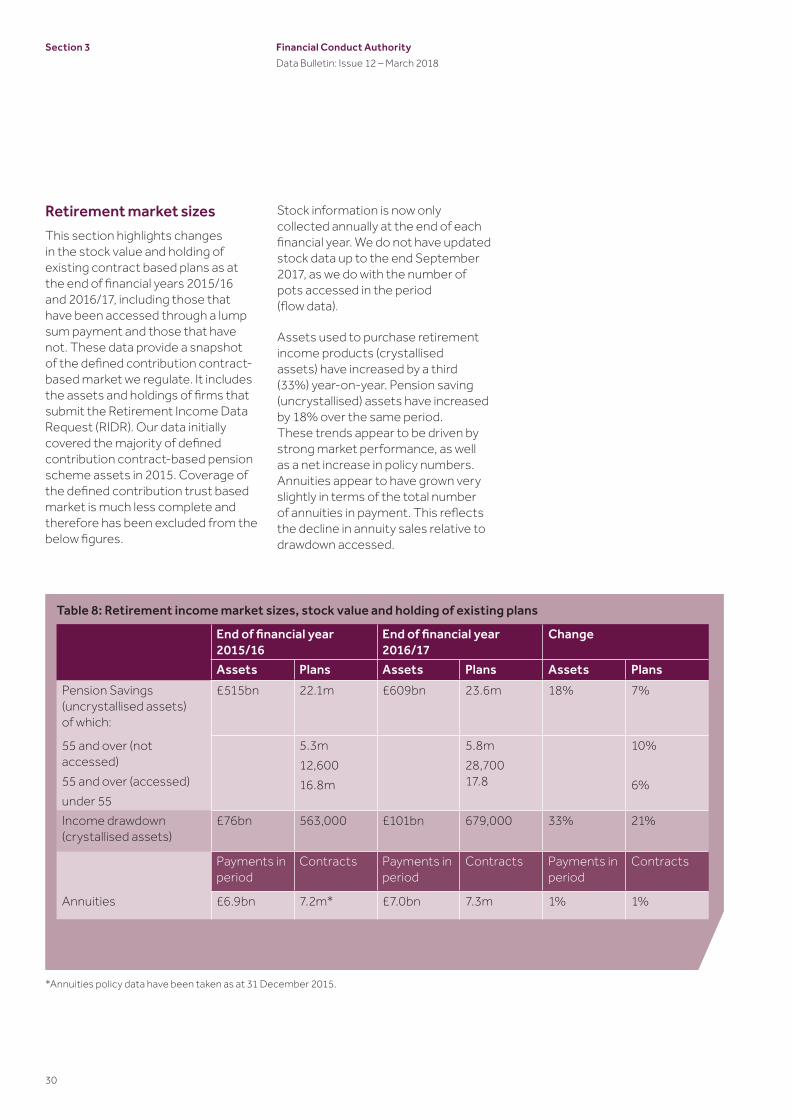
Retirement market sizesThis section highlights changes in the stock value and holding of existing contract based plans as at the end of financial years 2015/16 and 2016/17, including those that have been accessed through a lump sum payment and those that have not. These data provide a snapshot of the defined contribution contract-based market we regulate. It includes the assets and holdings of firms that submit the Retirement Income Data Request (RIDR). Our data initially covered the majority of defined contribution contract-based pension scheme assets in 2015. Coverage of the defined contribution trust based market is much less complete and therefore has been excluded from the below figures.
Stock information is now only collected annually at the end of each financial year. We do not have updated stock data up to the end September 2017, as we do with the number of pots accessed in the period (flow data).
Assets used to purchase retirement income products (crystallised assets) have increased by a third (33%) year-on-year. Pension saving (uncrystallised) assets have increased by 18% over the same period. These trends appear to be driven by strong market performance, as well as a net increase in policy numbers. Annuities appear to have grown very slightly in terms of the total number of annuities in payment. This reflects the decline in annuity sales relative to drawdown accessed.
End of financial year 2015/16
End of financial year 2016/17
Change
Assets Plans Assets Plans Assets PlansPension Savings (uncrystallised assets) of which:
£515bn 22.1m £609bn 23.6m 18% 7%
5.3m12,60016.8m
5.8m28,70017.8
10%
6%
55 and over (not accessed)55 and over (accessed)under 55Income drawdown (crystallised assets)
£76bn 563,000 £101bn 679,000 33% 21%
Payments in period
Contracts Payments in period
Contracts Payments in period
Contracts
Annuities £6.9bn 7.2m* £7.0bn 7.3m 1% 1%
Table 8: Retirement income market sizes, stock value and holding of existing plans
*Annuities policy data have been taken as at 31 December 2015.

Financial Conduct Authority25 The North Colonnade Canary Wharf London E14 5HSTelephone: +44 (0)20 7066 1000Website: www.fca.org.uk
© Financial Conduct Authority 2018 All rights reserved
Next stepsIn future issues we want to make sure we give you the information that you would find most useful, so if you have any comments or suggestions for future content please contact us at: [email protected]
Get the facts If you would like to subscribe/unsubscribe from the Data Bulletin please visit: fca.org.uk/firms/data-bulletin-subscription-form
Data Bulletin Underlying data used in this bulletin. https://www.fca.org.uk/publications/data/data-bulletin-issue-12
In case you missed themHere are some other publications of ours that you may find interesting:
Financial Lives Survey 2017Financial Lives Survey is the FCA’s largest tracking survey of consumers and their use of financial services, drawing on responses from just under 13,000 UK consumers aged 18 and over. The aim of the survey is to provide the FCA with unique insights into people’s experiences of retail financial products and services. The survey is available here: https://www.fca.org.uk/publications/research/understanding-financial-lives-uk-adults
Mortgage lending statistics (2017 Q4)We have been tracking mortgage lending trends since 2007. The latest mortgage lending statistics, which feature data up to the end of Q4 2017, show that the total value of all outstanding residential loans stood at £1,395 billion. This is a 0.7% increase from the previous quarter and a 4.3% increase from the same quarter in 2016. See all the latest findings at https://www.fca.org.uk/firms/mortgage-lending-statistics
Complaints statistics (January to June 2017)Every six months we publish complaints data we collect from firms. The total number of complaints reported by firms in the first half of 2017 was 3.32 million. The recent changes to our complaints return have led to an increase in the number of complaints reported to us. For the latest analysis of complaints trends see https://www.fca.org.uk/firms/complaints-data