data and analytics for business decision-making: breakdown of data...
TRANSCRIPT

Advancing Financial Inclusion
Data and analytics for business decision-making: Breakdown of data value chain
November 2016
Author: Krista Nordin

About insight2impact
Insight2impact | i2i is a resource centre that aims to catalyse the provision and use of data by private and public sector actors to improve financial inclusion through evidence-based, data-driven policies and client-centric product design.
i2i is funded by the Bill & Melinda Gates Foundation in partnership with The MasterCard Foundation.
For more information: Visit our website at www.i2ifacility.org. Email Mari-Lise du Preez at [email protected]. Call us on +27 (0)21 913 9510.
Client insights scoping series: Note 2 Breakdown of data value chain: From data to decisions
Acknowledgements
The author of this note would like to thank all institutions involved for their valuable inputs, as well as Abenaa Addai and Christiaan Loots for their review and comments.
Methodology
This note is based on desktop research on the existing body of knowledge on the use of data and analytics for business decision-making. In addition, the study has been informed by participation in various forums, conferences and lectures, as well as telephonic and in-person interviews with 46 financial service providers (FSPs), fintech start-ups, analytical providers, consultancy firms, design organisations, and academic or research organisations. Industry consultations focused primarily on the application of alternative data and analytics.
1
Contents
Table of contents
1. Introduction .................................................................................................................................. 2 2. Breakdown: Data ......................................................................................................................... 2 3. Breakdown: Analytics ................................................................................................................ 15 4. Conclusion ................................................................................................................................. 23 5. Bibliography ............................................................................................................................... 24 List of boxes
Box 1: Simplified data value chain ....................................................................................................... 2 Box 2: Framework for data used in FSP decision-making ................................................................... 4 Box 3: Comparison of emerging data sources in terms of accuracy and availability ......................... 15 Box 4: Analytics maturity framework .................................................................................................. 17 Box 5: Category of analytics companies rely on the most .................................................................. 23
List of tables
Table 1: Data sources categorised based on the framework in Box 2 ................................................. 5 Table 2: Example set of CDR fields ..................................................................................................... 6 Table 3: Sample questions used in psychometric evaluations (Kynge, 2014) ..................................... 9 Table 4: Example set of clickstream data ........................................................................................... 14
2
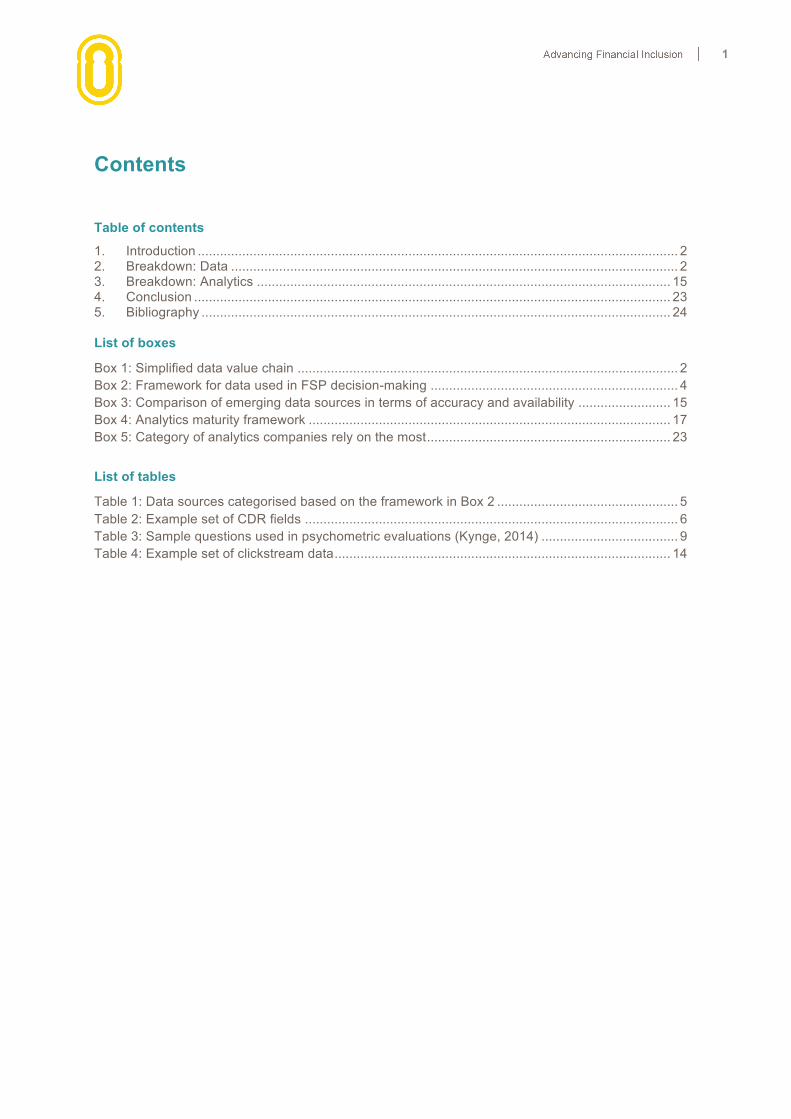
1. Introduction There are several steps in the data value chain which spans the entire journey from raw data to value creation within an organisation. The data value chain starts with data, then analytics are applied to generate insights, the insights are applied to business functions, which results in impact. This impact can be in the form of increased firm value (increased revenue, decreased profits, improved customer experience) and/or impact on expanding financial inclusion. These two do not necessarily go hand-in-hand. However, the sweet spot i2i is seeking to find and catalyse is the intersection between the two.
This report explores and unpacks two critical elements in the data value chain; data sources and analytical methodologies, as depicted in Box 1. The third note in the series will cover the remaining three elements; insights, potential applications of these insights within financial service providers (FSPs) and the impact they could have on both firm value and financial inclusion.
2. Breakdown: Data The term ‘data’ was originally recorded as a term in philosophy and was derived from the Latin word ‘datum’ in the 17th century meaning to give something. Data is an overarching term that can be used to describe any fact or statistic collected for reference or analysis. As such, there are a plethora of different types and sources of data ranging anywhere from observations and interviews, commonly seen in qualitative data, all the way to satellite images and social media networks.
Common data classifications unpacked
Data can be categorised in various ways and there are numerous industry classifications. Most descriptions of data classification categories are not mutually exclusive, which can make classifications nuanced and strongly definition-dependent. The main data classifications are unpacked and explored below.
Classifications based on data structure
• Structured data refers to data that can be organised into records identified by a unique key, with each record having the same number of attributes in the same order. An example is an excel table with a defined number of columns (attributes) per entry row, with the entry row being the unique identifier. Due to the defined nature of structured data, the overall table
Box 1: Simplified data value chain Source: Gartner and authors own
Source: Author’s own

3
structure (or schema) only needs to be defined once as metadata1 for the table (since the schema holds for all entries).
• Semi-structured data also has structure, but the overall structure can vary from record to record (an excel table with a flexible or dynamic number of columns). Records in semi-structured data can have a variable number of attributes. Because of the nature of semi-structured data, metadata has to be embedded within each data record (e.g. in the form of key-value pairs that describe the attributes and their respective values – for example JSON, XML, etc.).
• Unstructured data is any data that does not conform to the definitions for structured or semi-structured data. Unstructured data usually does have some structure (e.g. text has grammatical structure) but the structure does not follow a record layout, nor are there any embedded metadata tags describing attributes.
Classifications based on application
It is common in financial service provision for data to be referred to as “traditional” or “non-traditional” to distinguish between old data types used in decision-making and new and emerging data types.
• Traditional data usually refers to structured financial data generated internally by FSPs (transactional, repayment, claims data, etc.) or externally by traditional industry data providers (like credit bureaus) that is used in analysis which informs financial services decision-making. It also includes data generated from direct engagement with clients (surveys, interviews, etc.) and personal client data (income, demographic, etc.).
• Non-traditional (emerging) data refers to structured, semi-structured or unstructured data not traditionally used in analytics which inform financial service provision decision-making, and not necessarily related to past financial services usage. Examples include social media data, psychometric data, satellite imagery, geospatial data, mobile application data, etc. Although these are not directly related to financial services use, they are being used in new analytical processes to inform financial services decision-making. These new data types provide insight into qualitative concepts like character, behaviour, and social connectedness, allowing providers a broader understanding of individual customers (as well as market segments).
Miscellaneous classifications
• Over the last few years, big data has been one of the biggest buzzwords in tech. Big data refers to datasets whose size is beyond the ability of typical database software tools to capture, store, manage and analyse. Big datasets are characterised by the ‘3 Vs’, volume, velocity and variety. Data is considered ‘big data’ when the volume, velocity and/or variety of the data exceeds an organisation’s storage or computing capacity for accurate and timely decision-making. Big data is an all-encompassing term that can merely focus on database complexity or size (overlooking velocity and variety) or any variation of the three.
• Alternative data refers to the inclusion of non-financial payment reporting data in estimating the lending risk of an individual. It can mean anything and everything beyond the repayment data gathered by banks and credit bureaus (Klinger, 2015). Alternative data is another way of describing non-traditional data. Examples include utility bills, telecoms bills, rental payments, electronic payments etc.
1 Metadata is data that describes and gives information about other data.

4
Data used in analysis by FSPs
Data is the first step in insights generation for FSPs. It is one crucial component of decision-making; if you cannot trust the data, you cannot trust the analytics or the insights. There are numerous sources of client data used within decision-making ranging from survey data all the way to satellite imagery. Two key criteria for data use in decision-making is the data source’s availability over time (will the source continue to be available for analysis in the future) and the amount of historical data available. Building on the categorisations explored above, the data sources used in financial service decision-making have been categorised below.
Data sources are either traditional or emerging new sources. If they are traditional – based on the definition provided above – they are placed into one of three categories; data that is internally created within the FSP (through day-to-day operations), data that external sources provide, and data that is collected through direct engagement with customers. If the data source is non-traditional, it is categorised as either data sources that have been available in the past but were not used in financial service decision-making or new data sources that are recently available. The structure of the framework is visualised in Box 2.
Example data sources for each category can be found in Table 1 below.
Source: Gartner and authors own
Source: Author’s own
Box 2: Framework for data used in FSP decision-making

5
Table 1: Data sources categorised based on the framework in Box 2 Source: Author’s own
Exploring new data sources available for unbanked populations
So what exactly are these newly available non-traditional data sources being used in decision-making? Why are providers starting to use them now? What is driving adoption and what are proving to be barriers? What potential do they have with respect to both business applications and, broader, financial inclusion? Let us explore these questions in greater detail.

6
Call Detail Records (CDRs)
What are they? Call detail records (CDRs) are data records generated for every user event on a mobile network and they document the details of the communication transaction, whether it be a phone call, text message, etc. They are a type of transactional data as they are associated with a transaction that took place. CDRs capture a broad spectrum of relevant information; fields recorded include the unique caller ID, origin of the call, calling number, receiving number, start time, end time, duration, call location, call type and several others. These fields provide insight into an individual’s identity, location, social patterns, movement and finances. The data is captured in a structured log file, an example is found in Table 2. CDRs do not contain information on value-added services, data usage levels or any other services subscribers use.
Calling number
Receiving number
Latitude Longitude Date Duration
0725809724 0723115422 1.2921 S 36.8219 E 1/28/2016 0:10:17
Table 2: Example set of CDR fields Source: Author’s own Why now? CDRs are emerging as a new data source used in financial service provisioning decision-making for two main reasons; affordability and necessity of mobile phones. First, the costs associated with ownership and usage are falling, leading to an increased adoption of mobile phones in developing countries. In 2013, there were 6.8 billion active mobile subscriptions globally, nearly 96 subscriptions for every 100 people on the planet (Naef, et al., 2014). In the developing world the usage rates are 89 subscriptions per 100 people (Naef, et al., 2014). Secondly, poor people are viewing mobile phones as a necessity rather than a luxury (Naef, et al., 2014). Among the poorest, spending on mobile services varies little with income and is inelastic (signifying it is an essential good). The increased usage of mobile phones leads to extensive amounts of data being created every day that FSPs can use to better understand their customers, therefore driving adoption into decision-making.
Drivers and barriers to use in decision-making. There are both drivers and barriers to FSPs using CDRs as a data source in their decision-making. The current barriers to widespread use are; a lot of developing countries lack clear and comprehensive policies around mobile data protection; regulation in countries can impede availability and accessibility of the data; network operators might not want to share the data; and the areas of consumer privacy and data sharing (which are critical to use) are continuously evolving. These barriers either prevent FSPs from being able to access the data in the first place or pose great risk and uncertainty to using the data in decision-making. The drivers towards widespread use are; the data is relatively simple to aggregate, analyse and interpret; the outputs of analysis are potentially replicable in other markets and contexts; they capture information not easily found from other data sources at scale; and although uncertain right now, the regulatory regimes are becoming clearer and relevant parties are gradually coalescing around uniform best practices.
Potential business applications. Incorporating CDRs into analysis and decision-making allows for FSPs to better understand their customers at a more individual level. This, in turn, leads to products and services that are better designed to meet the needs of low-income individuals. CDRs provide insight on location and movement, financial and economic background, identity and demographics, social behaviour, usage and sentiment, all of which serve as proxies to build financial profiles for people who lack a conventionally documented financial history (the financially excluded). Example uses of CDRs within FSPs are: Tala (formerly inVenture) extrapolates personal budget and expenses

7
for developing credit profiles from analysing usage and Safaricom generates financial profiles of low-income earners who otherwise would not have access to traditional services to offer banking services. CDR data can help answer questions such as “does a customer return a missed call”, “do they have more outgoing or incoming calls”, “how often do they top-up”, etc.
Impact on financial inclusion. Mobile data (CDRs being one form) is one of the only large-scale, digital data sources that touches large portions of low income populations in developing countries as this source of data is available for all customers who have mobile phones. CDR data is on the horizon of becoming a major player for financial inclusion across developing countries. The extensive amounts of CDR data created every day, caused by the widespread use of mobile phones, has the potential to power development initiatives and increase access to financial services for low-income individuals. The MasterCard Advisors report on enabling financial inclusion through alternative data states “risk models based on mobile prepaid data may provide the greatest benefit to developing markets with high unbanked populations” (McEvoy, 2014). The full range of potential applications to improve the lives of low-earners is only starting to be explored. According to a report published by Gates Foundation, “in the near term, the CDR will remain the single most important source of information for research efforts” (Naef, et al., 2014). As networks expand reach, richer and more representative datasets will become available, leading to even greater potential impact.
Geographic information system data (GIS)
What is it? A GIS is a system designed to capture, store, analyse, manage, and present all types of spatial or geographical data. GIS can use any information (no matter the type or format) that includes location. GIS data consists of two types of data; spatial data and attribute data. The spatial data can be any geographical image with location or coordinate points (e.g. latitude, longitude and elevation). The attribute data is then appended to the spatial data in tabular format. Data types supported for attribute data are numbers, characters, date, time and blobs (images, multimedia, etc.). Common examples of attribute data within financial services are per capita GDP, electricity use, commercial and community banks, mobile money agents, ATMs, post offices and SACCOs etc.
Why now? Advancements over the last decade in computing power, data collection systems and GPS technology have made the application of GIS to the decision-making process more feasible and attractive (ArcUser, 2008). GIS relies heavily on vast amounts of data and the growing use of technology is increasing the amount of data available. The advancements in the technology have facilitated the production of digital maps, which has unlocked opportunities that were previously not available with traditional paper maps. Traditional maps were cumbersome, covered limited areas, lacked many details and were not easy to update, therefore not making economic sense to incorporate into the decision-making process.
Drivers and barriers to use in decision-making. The drivers to adopting GIS data in decision-making are: it allows providers to visualise and layer complex data which improves decision-making, it saves costs (in the form of improved decision-making) and there are a growing number of open-source GIS datasets (in large part coming from governments and donors). The barriers to use are: in some cases, GIS data is not readily available (or in others the desired dataset simply does not exist), there are privacy and data sharing concerns and some data is expensive to access, especially aerial imagery.
Potential business applications. There are a number of business applications for GIS data. It can be used for: optimising networks (where branches or agents should be based, which access points need to be closed or moved, to set and adjust performance expectations based on location, etc.); for marketing purposes (optimal billboard placement, finding new customers); for HR management
8
(personnel allocation management); in complaint resolution; to improve fraud detection; for security and cash distribution management (liquidity management); for evaluating credit risk; and for assessing proximity and scale of competitors or partners. Examples are Nedbank uses geospatial data in making strategic decisions about locating and evaluating branches and staff, and Metropolitan uses geospatial data to ensure low-income households have access to products tailored to their needs.
Impact on financial inclusion. GIS data has a broad potential impact on financial inclusion. GIS data can help solve access barriers. One of the greatest barriers to low-income individuals accessing financial services is the lack of physical infrastructure linking them into the digital platforms. Solving the access barrier is a key priority before the adoption and usage of financial services can occur, and GIS data can facilitate the understanding of access and potential solutions. GIS can also be used to set and evaluate KPIs for financial inclusion initiatives. Currently, researchers calculate physical financial access through branches per capita or branches per 100,000 people (Nielsen & Slind, 2013). This measurement does not give an indication of where people, especially low-income segments, live in relation to financial access points. GIS data can provide a more detailed picture for evaluating progress. Lastly, GIS can also enable sector coordination and help leverage synergies amongst FSPs. All of these benefits can lead to greater financial inclusion.
Social-media data
What is it? Social media data refers to all forms of data collected on social media. Social media can be categorised into the following types; social networks (e.g. Facebook and LinkedIn), blogs (e.g. Blogger and WordPress), microblogs (e.g. Twitter and Tumblr), social news (e.g. Digg and Reddit), social bookmarking (e.g. StumbleUpon), media sharing (e.g. Instagram and YouTube), wikis (Wikipedia and Wikihow), question-and-answer sites (e.g. Yahoo! Answers and Ask.com) and review sites (e.g. Yelp and TripAdvisor). Attributes of social media data include posts, views, likes, shares, follows and unfollows (churn rate), impressions, clicks, content of messages, sentiment of messages, network size and second-level network size, to name a few.
Why now? The proliferation of social media sites was dependent on the creation of the World Wide Web in 1991. In 1997 the first social media site, Sixdegrees.com, was created. After that, a plethora of sites emerged; LinkedIn (2002), Myspace (2003), Facebook (2004), YouTube (2005), Twitter (2006) and Instagram (2010). Social media use in developing countries has grown due to increased internet coverage and use as well as increasing smartphone penetration. By mid-2015, 200 million individuals across Sub-Saharan Africa were accessing the internet through mobile devices, a figure that will almost double by 2020 (GSMA, 2015), leading to large volumes of social media data being created. The growing penetration, use and engagement have caught the eye of financial institutions and they are now starting to recognise the opportunities that lie within leveraging social media data.
Drivers and barriers to use in decision-making. The drivers of FSPs using social media data in their decision-making are: there is a vast amount of data captured in social media; the data is easy to access and low-cost (several social media sites have APIs, most of which are open); it exposes the company to a large customer base; and it allows for providers to timely and directly engage with customers at a low cost. The barriers to FSPs using social media data are: social media data excludes a large portion of the low income population (as it requires a smartphone, internet and an active account); there are consumer privacy and protection concerns; there is regulatory uncertainty and complexity around security and compliance as regulators are trying to find a balance between protecting consumers whilst enabling financial inclusion; and, in some cases, laws have not been updated to allow organisations to realise the full potential of social media data.
9
Potential business applications. There are several business applications for social media data. First is in customer service. Social media allows companies to engage in timely and direct end-consumer contact at relatively low cost and higher levels of efficiency than traditional used methods. For example, customers can directly tweet at a company and receive a response in minutes. Second is in marketing, by improving segmentation of customers, real-time marketing and reducing acquisition costs. Third is in product and service development. Social media data can be analysed and used throughout the design process. Lastly, it can be used as a proxy to verify an applicant’s identity when either opening a bank account or accessing credit.
Impact on financial inclusion. Adoption of social media data in decision-making has been slow, but it has the potential to fundamentally change traditional business models that the finance sector has relied on for decades. Models that rely on social media data are currently most useful in high-income markets with widespread “thin-file” populations or middle-income consumers in less developed markets (Internet World Stats, 2015). The number of active social media users in Africa is already substantial (12.4%) and is set to increase by 25% per year (Internet World Stats, 2015), indicating social media data could be a predominant data source in the future. One large barrier to accessing financial services is being able to prove identity and social media data can potentially serve as a proxy going forward, expanding access to bank accounts and credit to a larger portion of the population (Eldridge, 2016).
Psychometric data
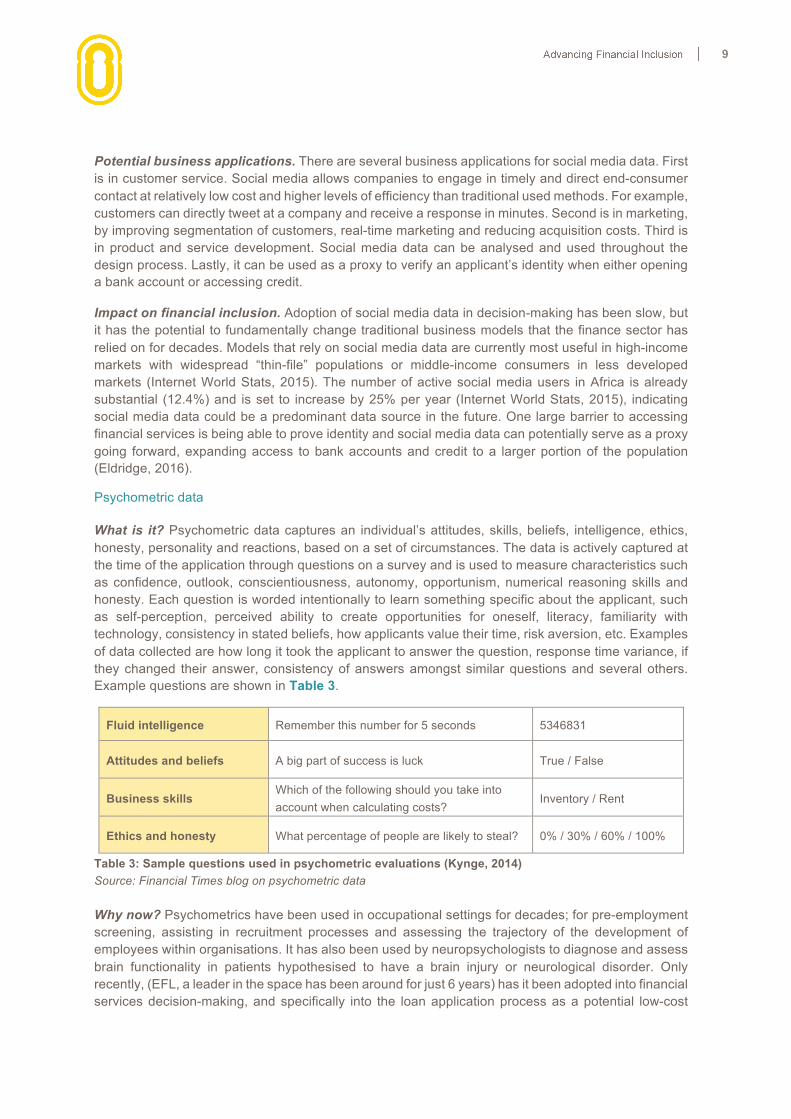
What is it? Psychometric data captures an individual’s attitudes, skills, beliefs, intelligence, ethics, honesty, personality and reactions, based on a set of circumstances. The data is actively captured at the time of the application through questions on a survey and is used to measure characteristics such as confidence, outlook, conscientiousness, autonomy, opportunism, numerical reasoning skills and honesty. Each question is worded intentionally to learn something specific about the applicant, such as self-perception, perceived ability to create opportunities for oneself, literacy, familiarity with technology, consistency in stated beliefs, how applicants value their time, risk aversion, etc. Examples of data collected are how long it took the applicant to answer the question, response time variance, if they changed their answer, consistency of answers amongst similar questions and several others. Example questions are shown in Table 3.
Fluid intelligence Remember this number for 5 seconds 5346831
Attitudes and beliefs A big part of success is luck True / False
Business skills Which of the following should you take into account when calculating costs?
Inventory / Rent
Ethics and honesty What percentage of people are likely to steal? 0% / 30% / 60% / 100%
Table 3: Sample questions used in psychometric evaluations (Kynge, 2014) Source: Financial Times blog on psychometric data Why now? Psychometrics have been used in occupational settings for decades; for pre-employment screening, assisting in recruitment processes and assessing the trajectory of the development of employees within organisations. It has also been used by neuropsychologists to diagnose and assess brain functionality in patients hypothesised to have a brain injury or neurological disorder. Only recently, (EFL, a leader in the space has been around for just 6 years) has it been adopted into financial services decision-making, and specifically into the loan application process as a potential low-cost
10
credit-scoring tool. Research and use cases began emerging showing the benefits of psychometrics, which in turn raised awareness.2 Now it is seen as an innovative approach to help make smarter loan decisions and a way to complement traditional credit scoring.
Drivers and barriers to use in decision-making. The drivers towards using psychometric data in decision-making are: it can be a good predictor for loans (EFL says lenders using its screening tool have shown up to a 50% reduction in defaults (Kynge & Schipani, 2015)); and it is a standardised test so everyone is given the same questions and the same opportunity. The barriers to use are: it is expensive to collect (the test usually requires to be administered in person); it requires a high level of expertise to administer the tests and interpret the results; the tests can take a long time (up to 40 minutes) and require the internet (as it is only available online); providers worry applicants will “game” the system; there is still doubt around whether the model can substitute traditional credit analysis.
Potential business applications. Psychometric data is being used within businesses as a means for assessing an applicant’s risk for credit lending. It is serving as a proxy in situations where traditional indicators of creditworthiness are not available. Examples of service providers partnering with lending institutions to provide psychometric testing are EFL (Entrepreneurial Finance Lab) and VisualDNA.
Impact on financial inclusion. The use of psychometric data presents a novel approach to overcome the traditional barriers to access to credit for low-income applicants (especially illiterate portions of the population, as tests can be administered with images). The technique is best suited for markets with both a significant “thin-file” population and widespread internet access (McEvoy, 2014). Overall there are proven success stories for incorporating psychometric data in decision-making. EFL’s partner banks have lowered default rates by up to 40% whilst increasing their lending to SMEs threefold (Steyn, 2014). There is also potential for psychometric data to overcome the lack of credit bureau data available on a large portion of the developing world, which could facilitate lending to the ‘invisible’ borrowers, leading to expanding financial inclusion. However, even with the technique becoming increasingly adopted, it is still far from widespread in use and the barriers to adoption remain high.
Mobile application data
What is it? Mobile application data, as the name suggests, is data that is obtained from mobile applications which are designed to run on smartphones, tablet computers and other mobile devices. It includes data that a user inputs into the application, data generated through the user interaction with the application, and data the application has permission to extract from the smartphone. Examples include personal identifiable information, geographic location, battery life, contact lists, etc.
Why now? Mobile application data is becoming increasingly popular in financial service decision-making for two reasons; more people in developing countries are accessing the internet on smartphones and it is the age of the smart consumer. Firstly, smart phones are decreasing in cost, with devices now available under USD 100, encouraging rapid adoption. By 2020 there is expected to be 540m smart phones (60% penetration), a growth of 380m from the end of 2015 (where penetration was 20%) (GSMA, 2015). In parallel to smartphones replacing feature phones, network operators are migrating to higher speed networks, increasing internet reach and quality. Commercial 3G networks had been launched in 41 countries across sub-Saharan Africa as of June 2015, whilst 4G networks had been launched in 23 countries (GSMA, 2015). Both of these shifts are creating more mobile application downloads and users. Between 2009 and 2016, there were 102 billion mobile app downloads (Statista, 2016). The more mobile applications are used or projected to be used, the more
2 A full list of list of white papers can be found on EFL’s knowledge centre: www.eflglobal.com/resources/white-papers-and-knowledge-center.
11
FSPs are pushing to invest in application initiatives. Financial institutions spent more than 25% (USD 114b) of their IT budgets on three technologies over 2015, one of which was mobility which includes mobile application development (Anon., 2015). The increased use of mobile applications drives the creation of vast amounts of data for analysts to use to inform decision-making. Secondly, this is the age of the smart consumers. Smart consumers are consumers that leverage digital services (e.g. mobile applications) to access information, anywhere and anytime. There has been a shift in consumer behaviour and mobile applications have become a crucial part of consumers’ everyday lives.
Drivers and barriers to use in decision-making. The drivers for adoption of mobile application data in decision-making are: the data is automatically generated when you have an app; and the data provides a finer view of customers. The barriers are: a limited portion of the targeted population for financial inclusion have both smartphones and access to the internet (despite the current shift towards smartphones, in 2020 nearly 450 million connections will still be based on feature phones (GSMA, 2015)); there are security questions around storing the application data and the potential for information trust issues with customers; regulation is unclear and plays a critical role; and expertise is required to build apps and analyse the data gathered.
Potential business applications. Mobile applications provide a way for FSPs to go outside the box to monitor, understand and meet customers’ risks and needs. They are increasingly being developed in the health insurance sector to prevent disease, monitor health, support treatment, and for chronic disease management. With the cost of health insurance rising and adverse selection leading to insurers being unable to accurately assess risk, mobile applications are helping insurers gather more data on the customer and promote healthy living, which in turn leads to fewer claims and overall lowers their healthcare spending. These applications allow insurers to further understand a customer’s associated risk, and do so at an earlier stage, leading to reduced claims, reduced administrative costs (through access to more information during policy renewals or new policies) and increased opportunities for cross-selling (based on the increased knowledge of the customer). Mobile application data can also be used as an input in credit scoring as a proxy to measure willingness and ability to repay a loan, it can be used to respond to customer requests faster, and as an input for further tailoring product and service offerings to the needs of customers.
Impact on financial inclusion. Smartphones are increasingly available, though have yet to reach mass-market adoption. Mobile phones remain the key platform to bring internet access to populations across sub-Saharan Africa. Once smartphones reach mass-market adoption, this data source has the potential to contain as much (or even more) information than what is currently stored in CDR data.
Sensor or IoT data
What is it? The internet of things (IoT) is the network of physical devices embedded with electronics, software, sensors, actuators, and network connectivity that enable these objects to collect and exchange data. The data collected is the output of the device and it is in response to some type of input from the physical environment. There are a variety of different types of sensors embedded; accelerometers, temperature, pressure, photoelectric and smart grid sensors, to name a few.
Why now? Because of the lowering costs of sensors and increasing data processing power there has been a movement towards IoT. The era was born in 2008 and it is defined as the point in time when more things were connected to the internet than people. It has recently taken form because it is heavily reliant on the integration of software and powerful analytics, hardware and connectivity and networks, all of which have undergone recent advancements. Within five years there will be over 50 billion smart connected devices in the world, all developed to collect, analyse and share data (Marr, 2015).

12
Drivers and barriers to use in decision making. The drivers to incorporating IoT data in financial service decision-making are: providers can gather more granular data on their customers faster; and the cost of connected devices has been reducing over time. The barriers to incorporating IoT data in financial service decision-making are: there is heightened sensitivity around security and privacy of IoT data due to the remote sensing abilities; there are legal and regulatory barriers restricting use; there is still low broadband penetration in developing countries; and concrete use cases and compelling value propositions are lacking.
Potential business applications. Applications of IoT data are mostly seen within insurance. Using IoT data, insurers can closely analyse customers’ data to identify their needs and risks (especially so for health risk through wearables), reduce turnaround time for the initiation of claims (by tracking exact location and circumstances responsible for the claim), and reduce the frequency and severity of claims (by using the sensors as warning systems). IoT data is also pushing a new insurance business model; usage-based insurance (UBI). UBI provides an opportunity for insurers to tailor their insurance offerings to customers’ specific behaviours and usage patterns, which can be understood through analysing IoT data.
Impact on financial inclusion. IoT is a new wave of technology advancement in the early stages of market development. So far, IoT data has mostly been adopted in developed countries, and it is still yet to unfold in developing countries. However, McKinsey has predicted that “the potential of IoT in developing countries is huge, with such nations expected to be accountable for 40% of the worldwide value of the IoT market by 2020” (Parker, 2016).
Satellite Imagery
What is it? Satellite imagery is an image of the whole or part of the earth taken from satellites. Imaging satellites are operated by governments and businesses around the world. Images are then licensed to other governments and businesses such as Google Maps and Apple Maps. There are three main types; visible light imagery, infrared imagery and water vapour imagery. Examples of physical or environmental variables that can be extracted from satellite images are; evapotranspiration, rainfall, soil moisture, vegetation, and landscape characteristics.
Why now? The first satellite photos of the earth were taken in 1959, and in 1972 the US started the Landsat programme, the largest programme for acquisition of imagery of earth from space. In the early 21st century, satellite imagery became more widely available when easy-to-use software with access to satellite imagery databases was offered by several companies. Now there are private companies offering commercial satellite imagery, NASA publishes all of their satellite images for free to the public and several other countries have satellite imaging programmes.
Drivers and barriers to use in decision-making. The key driver for using satellite imagery in decision-making is: it is an efficient way to view land without having to send surveyors to each property for each financial service application or insurance claim. The barriers to use are: satellite databases are huge and image processing is time-consuming; it is costly (weather conditions can affect image quality and therefore publicly available images usually need to be processed for visual and scientific use by third parties before they can be used); and there are privacy concerns (people do not want drones watching them all the time).
Potential business applications. Current business applications are mostly within credit and microinsurance. In credit, satellite images are used to understand an applicant’s assets (such as house, roofing material, property size, etc.) which can be indicators of credit worthiness. In microinsurance, the images are used to further understand risk and price accordingly (e.g. charge

13
higher premiums in flood-prone areas), to detect fraudulent claims, and vegetation indices and rainfall estimates are used to trigger payouts.
Impact on financial inclusion. The use of satellite imagery in decision-making can have profound effects on financial inclusion through offering credit and insurance to segments of the market previously excluded. Currently, applications are few and far between but have been shown to be successful. It will take time for adoption to become more widespread.
Biometric identification data
What is it? Biometric data refers to data on biological characteristics that are unique to an individual. There are several types of biometric identification; facial structure, fingerprint, hand geometry, retina, iris, signature, pitch, cadence and frequency, amongst others.
Why now? Financial institutions are beginning to look into and invest in biometrics as an alternative to passwords and PINs as customers are becoming increasingly dissatisfied and frustrated with passwords and PINs (Kazmi, n.d.). Advancements in recognition devices have improved the accuracy of readings and consumer acceptance is increasing making it a viable option for identity verification. In the future, there is an expected increase in security around mobile payments and biometrics could provide the required heightened security.
Drivers and barriers to use in decision-making. The drivers to FSPs using biometrics in decision-making are: it lowers barriers for financially excluded people to open accounts; it is a simple and convenient solution for customers; there are long-term savings for banks as biometrics removes the need for the issuance of authentication tokens and/or SMS-based alerts; and it can reduce fraud (especially in rising card-not-present fraud). The barriers to FSPs using biometrics are: the costs associated are high (requires expensive technologies and users need smartphones); it is hard for providers in countries without a unique ID system; there is fear around data security (banks fear a consumer backlash if they attempt to use their customers’ confidential biometric data); use cases remain immature; and there is uncertainty around regulation and standards (Howarth, 2015).
Potential business applications. Biometric data can be used to verify the identity for customers with insufficient traditional forms of identification, which in turn helps satisfy KYC, Know Your Customer, regulation. It can also be used to approve transactions, payments, transfers, etc.
Impact on financial inclusion. Currently, biometrics is used mainly for security purposes in the military and government. There are some promising innovative projects beginning to happen outside of that space, but most are not largescale market ready. In 2015, Pakistan became the first country in the world to leverage biometric SIM verification for remote mobile wallet account opening. So far the results have been positive, about 50% of new registered mobile wallet accounts in 2015 were opened via biometric verification (and in a year when the number of accounts tripled from 5 to 15 million). There is no doubt that the use of biometric SIM verification is helping fuel the push to achieve the goal of 50% financial inclusion in Pakistan by 2020 (Rashid & Staschen, 2016). However, the Pakistan case is still in the early days and will be hard for other countries without a sophisticated unique ID system to replicate. Once biometrics is shown to offer both value and convenience, adoption is expected to follow quickly. It will not be long before biometrics plays a central role in global mobile financial services.
14
Clickstream or mouse data
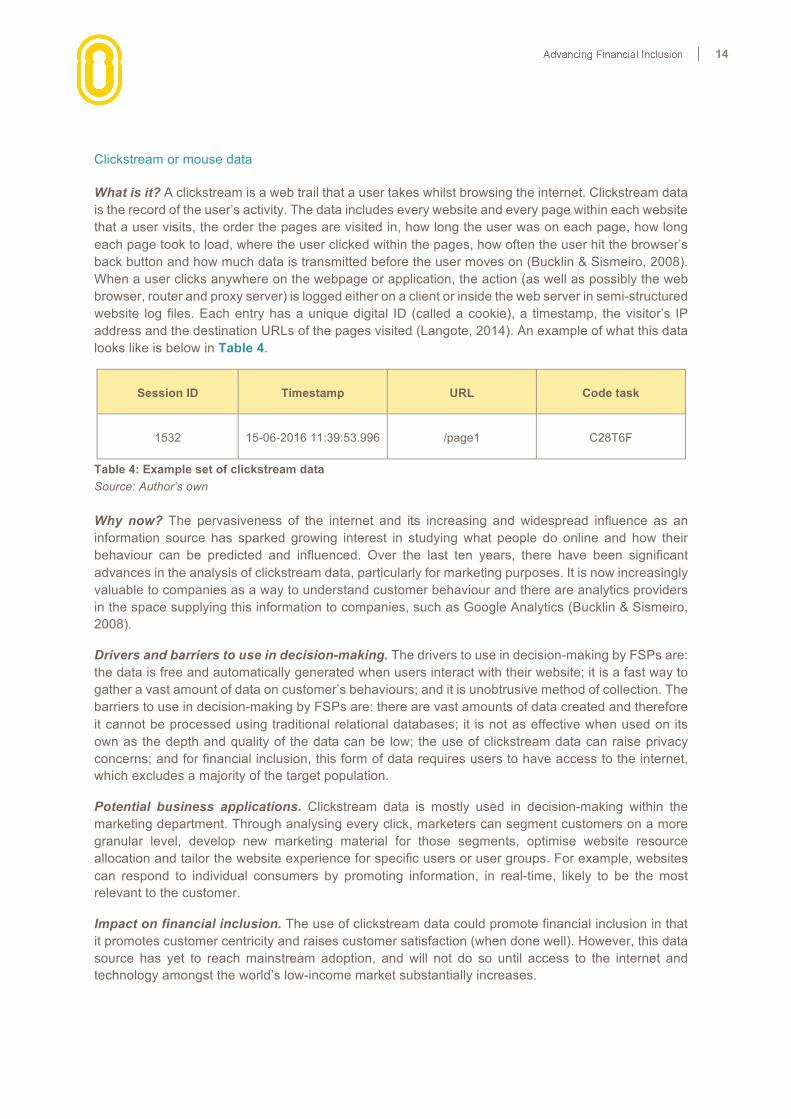
What is it? A clickstream is a web trail that a user takes whilst browsing the internet. Clickstream data is the record of the user’s activity. The data includes every website and every page within each website that a user visits, the order the pages are visited in, how long the user was on each page, how long each page took to load, where the user clicked within the pages, how often the user hit the browser’s back button and how much data is transmitted before the user moves on (Bucklin & Sismeiro, 2008). When a user clicks anywhere on the webpage or application, the action (as well as possibly the web browser, router and proxy server) is logged either on a client or inside the web server in semi-structured website log files. Each entry has a unique digital ID (called a cookie), a timestamp, the visitor’s IP address and the destination URLs of the pages visited (Langote, 2014). An example of what this data looks like is below in Table 4.
Session ID Timestamp URL Code task
1532 15-06-2016 11:39:53.996 /page1 C28T6F
Table 4: Example set of clickstream data Source: Author’s own Why now? The pervasiveness of the internet and its increasing and widespread influence as an information source has sparked growing interest in studying what people do online and how their behaviour can be predicted and influenced. Over the last ten years, there have been significant advances in the analysis of clickstream data, particularly for marketing purposes. It is now increasingly valuable to companies as a way to understand customer behaviour and there are analytics providers in the space supplying this information to companies, such as Google Analytics (Bucklin & Sismeiro, 2008).
Drivers and barriers to use in decision-making. The drivers to use in decision-making by FSPs are: the data is free and automatically generated when users interact with their website; it is a fast way to gather a vast amount of data on customer’s behaviours; and it is unobtrusive method of collection. The barriers to use in decision-making by FSPs are: there are vast amounts of data created and therefore it cannot be processed using traditional relational databases; it is not as effective when used on its own as the depth and quality of the data can be low; the use of clickstream data can raise privacy concerns; and for financial inclusion, this form of data requires users to have access to the internet, which excludes a majority of the target population.
Potential business applications. Clickstream data is mostly used in decision-making within the marketing department. Through analysing every click, marketers can segment customers on a more granular level, develop new marketing material for those segments, optimise website resource allocation and tailor the website experience for specific users or user groups. For example, websites can respond to individual consumers by promoting information, in real-time, likely to be the most relevant to the customer.
Impact on financial inclusion. The use of clickstream data could promote financial inclusion in that it promotes customer centricity and raises customer satisfaction (when done well). However, this data source has yet to reach mainstream adoption, and will not do so until access to the internet and technology amongst the world’s low-income market substantially increases.
15
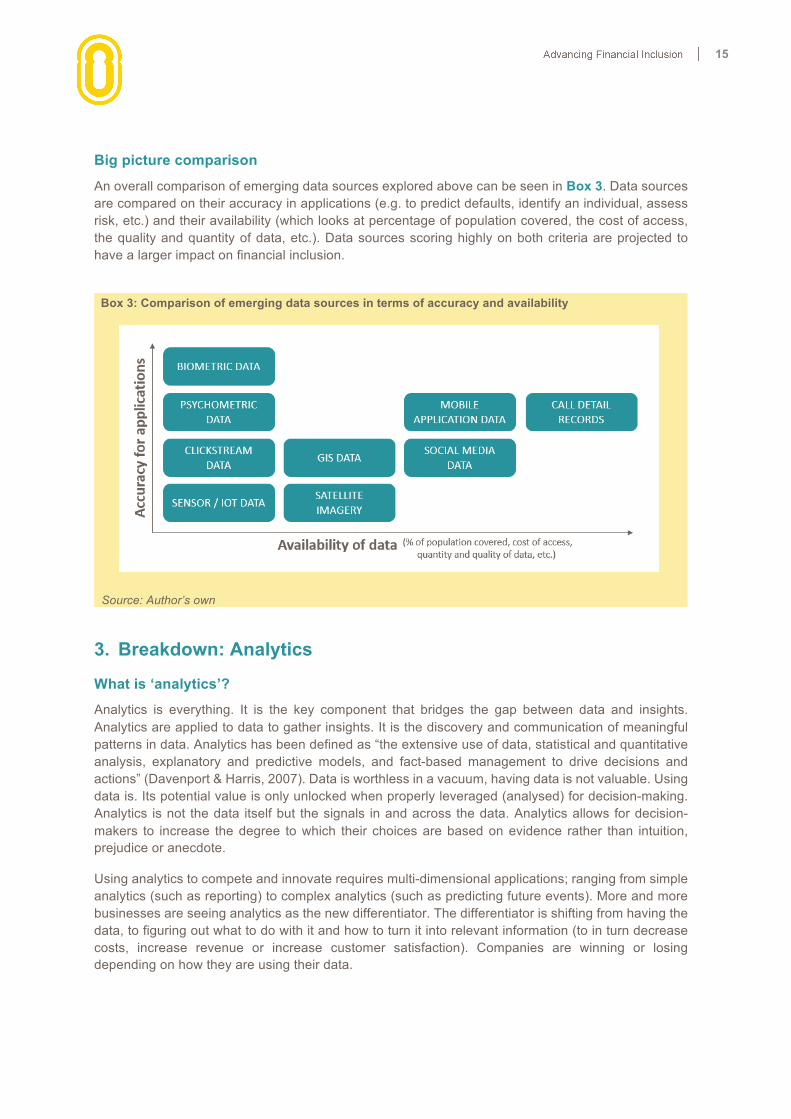
Big picture comparison
An overall comparison of emerging data sources explored above can be seen in Box 3. Data sources are compared on their accuracy in applications (e.g. to predict defaults, identify an individual, assess risk, etc.) and their availability (which looks at percentage of population covered, the cost of access, the quality and quantity of data, etc.). Data sources scoring highly on both criteria are projected to have a larger impact on financial inclusion.
3. Breakdown: Analytics
What is ‘analytics’?
Analytics is everything. It is the key component that bridges the gap between data and insights. Analytics are applied to data to gather insights. It is the discovery and communication of meaningful patterns in data. Analytics has been defined as “the extensive use of data, statistical and quantitative analysis, explanatory and predictive models, and fact-based management to drive decisions and actions” (Davenport & Harris, 2007). Data is worthless in a vacuum, having data is not valuable. Using data is. Its potential value is only unlocked when properly leveraged (analysed) for decision-making. Analytics is not the data itself but the signals in and across the data. Analytics allows for decision-makers to increase the degree to which their choices are based on evidence rather than intuition, prejudice or anecdote.
Using analytics to compete and innovate requires multi-dimensional applications; ranging from simple analytics (such as reporting) to complex analytics (such as predicting future events). More and more businesses are seeing analytics as the new differentiator. The differentiator is shifting from having the data, to figuring out what to do with it and how to turn it into relevant information (to in turn decrease costs, increase revenue or increase customer satisfaction). Companies are winning or losing depending on how they are using their data.
Source: Author’s own
Box 3: Comparison of emerging data sources in terms of accuracy and availability

16
Analytics as a field combines numerous disciplines, statistics, operational research, information systems, psychology, accounting and finance, to name a few (ORATER, 2013). Across literature, there are inconsistencies regarding what the appropriate disciplines are and there is no real consensus on what should be included. However, what literature does make clear is that there is a consensus that analytics should be considered an interdisciplinary, multidimensional field.
In order to properly leverage the data to turn it into meaningful insights, proper processes need to be applied. The process of generating insights consists of two main sub-processes; data management and analytics. Data management consists of processes, and the supporting technologies, to acquire and store data and to prepare and retrieve it for analysis. Analytics consists of the techniques to analyse and acquire intelligence from data. There is a breadth of different techniques, an exhaustive list is beyond the scope of a single paper. This report focuses on techniques that are being used or could be used in the future in decision-making within FSPs.
A brief history of analytics
From the first known population data collection project by the Swedish government in 1749, to Florence Nightingale recording and analysing mortality data in the 1850s, to British scholar Richard Doll’s tobacco and lung cancer study in the 1950s, the analysis of data has fuelled knowledge discovery for hundreds of years. Within organisations, in the 1960-70s, data was mostly used in back-office automation, in the 80s-90s in front-office productivity and in the 90s-2000s this advanced to e-commerce. In the past, analytics were mostly applied to structured data within organisations to gather hindsight, as analysing unstructured data at scale was too costly and therefore not economically feasible.
However, two significant technological advances have converged to unlock the value of unstructured data for organisations, which accounts for 80% of their data (Barrenechea, 2013): advancements in software, and advancements in cloud computing. These two advancements have been fuelled by the increasing volumes of data generated. Advancements in software (e.g. Apache Hadoop) allow for vast volumes of structured and unstructured data to be easily stored, retrieved and queried at scale through distributing storage. Just a few years ago, setting up a distributed data platform would have taken several highly skilled computer scientists months to complete, and now it is quick and easy as the software handles a majority of the complexity. Advancements in cloud computing allow for a dramatic increase in the availability, scalability and security of infrastructure capable of handling the data, all at a fraction of the traditional cost. Because of these two trends, there has been a proliferation in real-world adoption of data analytics that were out of reach for largescale operations.
Using analytics as a differentiator now lies in the ability to integrate and analyse both structured and unstructured data. Structured data can tell you what is happening and unstructured data can provide context on why it is happening, and together they paint a more complete picture.
Five distinct types of analytics
There are five distinct categories of analytical methodologies, with increasing levels of complexity and business value: methodologies that describe what happened; methodologies that describe why it happened; methodologies that predict what will happen; methodologies that make desired outcomes happen; and methodologies that decide and execute on what is the best action to take. The five categories are called descriptive, diagnostic, predictive, prescriptive and cognitive, respectively. As one progresses along the analytics continuum, the volume of data required increases, the difficulty of applying the methods increases, the processes become more reliant on high data quality and the level of human input required decreases. As well, one shifts from gathering reactive hindsight into the past
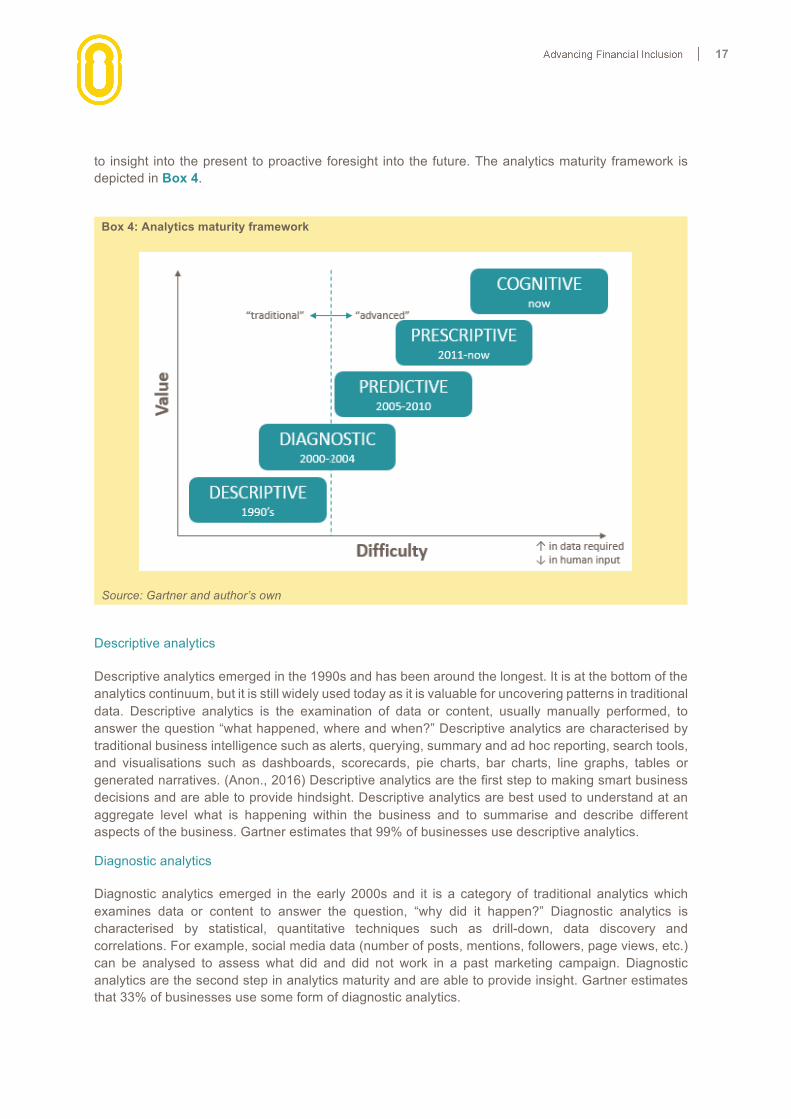
17
to insight into the present to proactive foresight into the future. The analytics maturity framework is depicted in Box 4.
Box 4: Analytics maturity framework
Source: Gartner and author’s own
Descriptive analytics
Descriptive analytics emerged in the 1990s and has been around the longest. It is at the bottom of the analytics continuum, but it is still widely used today as it is valuable for uncovering patterns in traditional data. Descriptive analytics is the examination of data or content, usually manually performed, to answer the question “what happened, where and when?” Descriptive analytics are characterised by traditional business intelligence such as alerts, querying, summary and ad hoc reporting, search tools, and visualisations such as dashboards, scorecards, pie charts, bar charts, line graphs, tables or generated narratives. (Anon., 2016) Descriptive analytics are the first step to making smart business decisions and are able to provide hindsight. Descriptive analytics are best used to understand at an aggregate level what is happening within the business and to summarise and describe different aspects of the business. Gartner estimates that 99% of businesses use descriptive analytics.
Diagnostic analytics
Diagnostic analytics emerged in the early 2000s and it is a category of traditional analytics which examines data or content to answer the question, “why did it happen?” Diagnostic analytics is characterised by statistical, quantitative techniques such as drill-down, data discovery and correlations. For example, social media data (number of posts, mentions, followers, page views, etc.) can be analysed to assess what did and did not work in a past marketing campaign. Diagnostic analytics are the second step in analytics maturity and are able to provide insight. Gartner estimates that 33% of businesses use some form of diagnostic analytics.
18
Predictive analytics
Predictive analytics emerged in the mid-2000s and is a category of advanced analytics which examines data or content to answer the question “what is going to happen?” or more precisely “what is likely to happen?” Predictive modelling mathematically represents underlying relationships in historical data in order to explain the data and make predictions, forecasts or classifications about future events. For example, clickstream data can be analysed to predict what a customer is most likely going to engage with on the website in the future. Businesses should use predictive analytics when they need to know something about the future, or fill-in the information they do not have. Predictive analytics are characterised by techniques such as regression analysis, multivariate statistics, pattern matching, data mining, predictive modelling and forecasting. The scope of predictive analytics is expanding considerably as human behaviour is modelled and expressed mathematically. Recently, predictive analytics has surged in popularity because of the growing volumes and types of data available, faster and cheaper computers, easier to use and interactive software and an increased desire to be able to predict consumer behaviour and leverage this as a competitive advantage. Predictive analytics are the next step in the analytics maturity and are really valuable, but are not largely used. This category is still in its infancy, Gartner estimates that 13% of organisations are currently using predictive modelling, but it is growing at a quick pace.
Prescriptive analytics
Prescriptive analytics emerged in the early 2010s and is a form of advanced analytics which examines data or content to answer the question “What should be done?” or “what can be do to make _____ happen?” It answers the question of what to do by providing information on optimal decisions based on the predicted future scenarios. It is best used to provide decisions with advice on what action to take. Prescriptive analytics are characterised by techniques such as graph analysis, simulation, complex event processing, neural networks, recommendation engines, heuristics, and machine and deep learning. Prescriptive analytics requires large volumes of data and lots of computing power, but is able to produce answers in real time and provide foresight. The most sophisticated organisations are using prescriptive analytics.
Cognitive analytics
Cognitive computing emerged in the last few years. It is in the very early stages and few companies are looking at it. Cognitive analytics aims to simulate human thought processing to analyse the data and answer the question “What is the best action?” Cognitive analytics combines deep learning, natural language processing and neural network algorithms to mimic the way a human brain works. The more data cognitive analytics are exposed to, the more they learn and therefore the more accurate it becomes over time. Cognitive analytics are powerful as they can see and incorporate previously unused data (dark data) and consumers have soaring expectations that can be met through cognitive systems. IDC predicts that businesses will spend upwards of USD 60 billion on cognitive solutions by 2025 (Rajpurohit, 2016).
Unpacking emerging analytics methodologies
There are various types of emerging analytical techniques for structured and unstructured data. Technological advances in storage and computations have enabled cost-effective capture of unstructured and larger amounts of data in a timely manner. Consequently, there has been a proliferation in real-world adoption of unstructured data based analytics that was not economically feasible for large-scale applications prior to the big data era (Gandomi & Haider, 2015). In addition, the academic community has made its own contributions; social media analysis and artificial
19
intelligence have both emerged from academic research. This section explores and unpacks emerging analytical methodologies that can be applied within financial service decision-making, specifically looking at what these new methodologies are, their origins, what they are good for and issues and limitations to application.
Text analytics
Text analytics (also referred to as text mining) refers to techniques that extract information from large quantities of unstructured text data. Example sources of textual data include emails, company documents, customer records, online forums, survey responses, call centre logs etc. Text analytics involves statistical analysis, computational linguistics and machine learning. Text analytics enables businesses to convert large volumes of human-generated text into meaningful insights. There are a handful of different methods applied in text analytics, two of which are text summarisation and sentiment analysis.
• Text summarisation methods produce a succinct summary of the key information in a piece of text. There are two approaches to text summarisation; the extractive approach and the abstractive approach. In extractive summarisation, the summary is created from the original text units. In abstractive summarisation, the summary is created with text units that are not necessarily present in the text. Extractive systems are easier to adopt but abstractive systems generate more coherent summaries.
• Sentiment analysis methods analyse opinionated text, which contains people’s opinions towards entities such as products, organisations, events etc. Sentiment analysis has become common as businesses are increasingly capturing more data about their customers’ sentiments. There are three sub-groups of sentiment analysis; document-level, sentence-level and aspect-based. As the names imply, document-level and sentence-level determine whether the document or sentence expresses a positive or negative sentiment. A majority of techniques categorise text into two classes, negative and positive, however, some incorporate more sentiment classes. Aspect-based techniques recognise all sentiments within a document and identify the aspects of the entity to which each sentiment refers. Sentence-level techniques tend to be more complex than document-level techniques and aspect-based techniques are able to capture valuable information about different features that would otherwise be missed if the sentence-level or document-level sentiment is only classified in terms of polarity.
Until recently, text analytics was not always useful because of the unstructured format of textual data, leading to it not neatly fitting into a relational database or columns and rows of a spreadsheet. Text analytics is now capable of telling us things we did not already know, and perhaps more importantly, had no way of knowing before. These insights can be incredibly useful in business decision-making. For example, text can be assessed for commercially relevant patterns such as an increase or decrease in positive feedback from customers or new insights that could lead to product tweaking. Text analytics is particularly useful for answering questions such as “What do my customers or employees think of my product?”, “What is the perception of our employment brand amongst Twitter users?”, “What are the most important issues customers complain to us about”, etc.
Advancements in text analytics have mostly been in North America and Europe and therefore there are limitations on how well these algorithms parse local languages across Africa. In South Africa (and generally across developing countries) text analytics are mostly done manually, but as these analytical methods progress and become cheaper and easier to apply, adoption is expected to grow.

20
Web analytics
Web analytics analyses and reports on webpage usage and visits (clickstream data). There are two categories of web analytics; on-site and off-site, depending on whether the data is about activity on your own website or about activity occurring elsewhere on the web that is about your products and services (Cooper, 2012). Web analytics started shortly after the World Wide Web began in the early 1990s.
On-site web analytics are used to answer questions such as; “Which pages do people visit?”, “How does this change with date and time?”, “Where do visitors come from geographically?”, “Which site linked them to ours?”, “What were the search terms that led people to our site?”, “Is my site user-friendly?” Off-site analytics are used to answer questions such as; “What is being said about the company, or the products?” and “What effect did our advertising have?”
Google Analytics offers a free, easy-to-use version, making web analytics very accessible. However, it is worth recognising that the reports may need a skilled interpreter or supplementary analysis to reveal an actionable insight. In addition, when companies grow out of Google Analytics, there is a lack of next-level tools available for users.
Audio, voice or speech analytics
Audio, voice or speech analytics is the process of extracting information, meaning and insights from unstructured audio recordings. There are two common technological approaches; the transcript-based approach and the phonetic-based approach.
• The transcript-based approach (widely known as large-vocabulary continuous speech recognition, LVCSR) follows a two-phase process: indexing and searching. The first phase, indexing, involves transcribing the audio into text using automatic speech recognition (ASR) algorithms that match sounds to words. The second phase, searching, involves standard text-based methods to search through and analyse the text.
• The phonetic-based approach also follows a two-step approach to indexing and then searching. However, the indexing consists of turning the input speech into a sequence of phonemes instead of words. Phonemes are the perpetually distinct units of sound in a specified language that distinguish one word from another.
Voice analytics is particularly useful for answering questions such as “How can we identify the customers that are upset and likely to leave?”, “How can we make our operations more efficient?”, and “What do customers really think about our brand or product?”
Speech analytics software became viable for ordinary people in the 1990s with the advent of faster processors in computers. In the beginning of the 2000s, voice analytics systems reached about 80% accuracy, but by the end of the decade, progress stalled until the arrival of the Google Voice Search app for the iPhone (Pinola, 2011). However, even with advancements, there are still limitations; they can still be quite inaccurate (they are only as good as their grammar file), they are quite complex and they are expensive to develop.
Social media analytics
Social media analytics refers to the analysis of structured and unstructured data from social media channels. Social media is a broad term encompassing a variety of online platforms that allow users to create and exchange content. Social media analytics can be classified into two groups; content-based
21
analytics and structure-based analytics. Content-based analytics focuses on the data posted by users on social media platforms and is analysed using text and audio analytics, as discussed earlier, to derive insight from the data. Structure-based analytics (also commonly referred to as social network analysis) is concerned with synthesising the structural attributes of a social network and extracting intelligence from the relationships amongst the participating entities. The structure of a social network is modelled through a set of nodes and edges. There are two main types of relevant network graphs; social graphs and activity graphs. In social graphs, edges signify links between the corresponding entities, whereas in an activity graph edges represent actual interactions between a pair of nodes. Activity graphs are preferable to social graphs, because activity is more relevant to analysis than a mere connection.
Various techniques have recently emerged to extract information from the structure of social networks; community detection, social influence analysis and link prediction. Community detection extracts implicit communities within a network. Social influence analysis refers to techniques that are concerned with modelling and evaluating the influence of actors and connections in a social network. Link prediction forecasts future linkages between existing nodes in the underlying network.
Social media analytics are useful for answering questions such as “Who is influential?”, “Who is controlling the flow of information?”, “What sub-groups or cliques exist?”, “Who is engaged or disengaged?”, “How can I harness user-generated content to promote my business?”, “What are the key characteristics of my most valuable customer segments?” and “What content should I share to capture my target audience’s attention?”.
The data processing for social media analytics is relatively simple and there are numerous computer programs and software packages available (several social networks have also developed APIs that give easy access to the data). However, the outputs of social media analytics are usually descriptive and not directly actionable.
Machine learning
When the term ‘machine learning’ is used in the media, it is usually followed by ‘artificial intelligence’ and ‘deep learning’. These three terms are not the same things. The easiest way to think of their relationship is to visualise concentric circles with artificial intelligence the largest, then machine learning and then finally deep learning fitting inside both (Copeland, 2016). The term ‘artificial intelligence’ was coined in 1956 and marked the birth of the field of AI. Artificial intelligence is the theory and development of computer systems to be able to perform tasks normally requiring human intelligence. Machine learning emerged in the 1980s and is an approach to achieve artificial intelligence. Deep learning emerged in the 2010s and is a technique for implementing machine learning.
Machine learning provides computers with the ability to learn without being explicitly programmed. Machine learning is an algorithm that is trained, given input data and then run on new data to predict the output. As the system processes more data, it learns from its mistakes (outputs that are returned with the incorrect labels continually train the system). Its goal and usage is to build and/or leverage existing algorithms to learn from data, in order to build generalisable models that give accurate predictions, or to find patterns, particularly with new and unseen similar data (Castrounis, 2016). When applying machine learning to business decision-making, there are two main learning styles that can be used to categorise machine learning algorithms; supervised learning and unsupervised learning. In supervised learning, the input data (or training data) has a known label, whereas in unsupervised learning the input data does not have a known label.
22
• Examples of supervised learning algorithms fall into two categories, regression models (predicting continuous variables, e.g. housing prices) or classification models (predicting discrete variables, e.g. has a mobile device, 0 or 1), and example algorithms are k-nearest neighbour, support vector machines and neural networks. K-nearest neighbour classification is one of the most fundamental and simple classification methods and should be one of the first choices for a classification study when there is little or no prior knowledge about the distribution of the data. The k-nearest neighbour classifier is commonly based on the Euclidean distance between a test sample and the specified training samples. For support vector machines (SVMs) the algorithm outputs an optimal plane (based on the training data) which then is used to categorise the new data. Neural networks are models inspired by how the brain works. They are networks, typically organised in layers with interconnected nodes which each contain activation functions. Input data is fed into the network and weights are applied on the various interconnections which will potentially trigger the activation function to classify the input data as a specific output (Peterson, 2009).
• Examples of unsupervised learning techniques fall into one category, clustering models, and example algorithms are clustering, dimensionality reduction and deep learning algorithms. Clustering is the task of grouping a set of objects in a way such that objects in the same group (or cluster) are more similar to each other than those in other groups. Dimensionality reduction is the process of reducing the number of random variables under consideration via obtaining a set of principle variables. Deep learning is the process of modelling high-level abstractions in data by using a deep graph with multiple processing layers, composed of multiple linear and non-linear transformations (Murphy, 2015).
Machine learning techniques are particularly useful for answering questions such as “Given a history of events and final outcomes, can we predict the outcome for an incomplete set of events?”, “How many products are we likely to sell?” and “What variables influence the buying decision of our customers?”
The application of machine learning in business decision-making is still quite new, and has begun, but not completed, the transition from academia to practical use (Merrett, 2015). There has been an increasing range of new business opportunities discovered through machine learning in the large datasets being accumulated through day-to-day business. However, there are numerous challenges that lie within applying machine learning within business decision-making, making it an analytical methodology largely out-of-reach for the average FSP in developing countries. Although easy to use and with open source software existing, such as Google’s TensorFlow, correct use requires extreme care and expert knowledge. In addition, well-trained machine learning algorithms require huge datasets.
Levels of adoption
Companies applying analytics need to use a range of methods, depending on the business questions they are trying to answer. Companies need to pick the analytics technique based on the problem they are trying to solve, and not let the technique shape the problem. There is a tendency for analysts to over-complicate approaches, and sometimes basic exploratory methods are best suited to address the business question. It is a continuous balancing act between descriptive, diagnostic, predictive and prescriptive analytics (eliminating cognitive as very few companies apply cognitive analytics) and the results of descriptive and diagnostic analytics should be used for determining what predictive and prescriptive approach to take.

23
PwC conducted a survey of more than 2,100 executives to understand what types of analytics companies rely on most. Most organisations are currently using data to look backwards and describe what happened and why. A quarter are predicting what will or could happen, and the most sophisticated companies are using prescriptive approaches to determine what should happen and why (PWC, 2016). A summary of the findings is presented in Box 5.
Box 5: Category of analytics companies rely on the most
Source: PwC Global Data and Analytics Survey 2016: Big Decisions Overall, adoption of these new techniques is hard; senior executives compare it to trying to replace tyres on a moving car. Decision-makers list leadership courage, budgetary constraints, availability of resource and manpower and operational capacity as the leading barriers to further adoption. Exploring organisational constraints are beyond the scope of this report, but are explored in the ‘Client insights scoping series: Note 3’ report.
4. Conclusion Data and analytical methodologies, of varying degrees of complexity, have been, and always will be, applied within financial service business decision-making. Over the last several decades, there have been emerging new data sources and analytical methodologies allowing providers to better understand customers and make more informed decisions. This report serves as a landscape scan of those available, with a particular eye on emerging data sources and analytics used in decision-making. Although major innovations in data sources and techniques have taken place, it is anticipated that even more novel analytics will emerge in the future. The question remains to be explored whether these new data sources and analytics will close the gap for financial access or define the new frontier for exclusion. The third report in this series will uncover the applications of these insights, generated through the analytics, to derive value, and the fourth report will discuss the larger impact of these trends on financial inclusion.

24
5. Bibliography Anon., 2015. The Payers. [Online] Available at: http://www.thepaypers.com/online-payments/financial-institutions-spend-over-25-of-it-budgets-on-3-transformative-technologies-in-2015/762530-3 [Accessed 07 October 2016].
Anon., 2016. Gartner. [Online] Available at: http://www.gartner.com/it-glossary/descriptive-analytics/ [Accessed 07 September 2016].
ArcUser, 2008. ESRI. [Online] Available at: http://www.esri.com/news/arcuser/1008/decisions.html [Accessed 28 September 2016].
Barrenechea, M., 2013. Forbes. [Online] Available at: http://www.forbes.com/sites/ciocentral/2013/02/04/big-data-big-hype/#37c992f01bfe [Accessed 7 October 2016].
Bucklin, R. E. & Sismeiro, C., 2008. UCLA Anderson. [Online] Available at: http://164.67.163.139/Documents/areas/fac/marketing/bucklin_clickstream.pdf [Accessed 09 Septemnber 2016].
Castrounis, A., 2016. InnoArchiTech. [Online] Available at: http://www.innoarchitech.com/machine-learning-an-in-depth-non-technical-guide/ [Accessed 25 September 2016].
Cooper, A., 2012. A Brief History of Analytics. CETIS Analytics Series, 1(9), pp. 3-17.
Copeland, M., 2016. NVIDIA. [Online] Available at: https://blogs.nvidia.com/blog/2016/07/29/whats-difference-artificial-intelligence-machine-learning-deep-learning-ai/ [Accessed 21 September 2016].
Davenport , T. H. & Harris, J. G., 2007. Competing on Analytics: The New Science of Winning. Boston, MA: Harvard Business School Publishing Corporation.
Eldridge, R., 2016. The Huffington Post. [Online] Available at: http://www.huffingtonpost.com/richard-eldridge/how-social-media-is-shapi_b_9043918.html [Accessed 07 September 2016].
Gandomi, A. & Haider, M., 2015. Beyond the hype: Big data concepts, methods and analytics. International Journal of Information Management, 35(2), pp. 137-144.
GSMA, 2015. State of Industry: Mobile money. [Online] Available at: http://www.gsmamobileeconomyafrica.com/GSMA_ME_SubSaharanAfrica_Web_Singles.pdf [Accessed 12 July 2016].
GSMA, 2015. The Mobile Economy: Sub-Sharan Africa, s.l.: GSMA.
25
Howarth, F., 2015. Security Intelligence. [Online] Available at: https://securityintelligence.com/momentum-picks-up-for-biometric-security-in-the-financial-sector/ [Accessed 9 September 2016].
Internet World Stats, 2015. Africa Internt Users November 2015, s.l.: Internet World Stats.
Kazmi, Z., n.d. Mobey Forum. [Online] Available at: http://www.mobeyforum.org/is-financial-services-ready-for-biometric-technology/ [Accessed 09 September 2016].
Klinger, B., 2015. EFLGlobal. [Online] Available at: https://www.eflglobal.com/alternative-credit-scoring-emerging-markets/ [Accessed 28 September 2016].
Kynge, J., 2014. Financial Times. [Online] Available at: http://blogs.ft.com/beyond-brics/2014/06/25/psychometrics-help-ease-the-huge-em-funding-gap/ [Accessed 21 September 2016].
Kynge, J. & Schipani, A., 2015. Financial Times. [Online] Available at: http://www.ft.com/cms/s/0/bf27f8c2-a586-11e4-8636-00144feab7de.html#axzz4JeL08H00 [Accessed 20 September 2016].
Langote, M., 2014. DataMetica. [Online] Available at: http://datametica.com/clickstream-data-and-usage/ [Accessed 09 September 2016].
Marr, B., 2015. Forbes. [Online] Available at: http://www.forbes.com/sites/bernardmarr/2015/09/30/big-data-20-mind-boggling-facts-everyone-must-read/#2bc97f276c1d [Accessed 28 September 2016].
McEvoy, M. J., 2014. MasterCard. [Online] Available at: http://compendium.mastercard.com/app/SKU_pdfs/alternativeData.pdf [Accessed 28 September 2016].
Merrett, R., 2015. CIO. [Online] Available at: http://www.cio.com.au/article/581456/machine-learning-moving-academia-into-industry/ [Accessed 07 October 2016].
Murphy, M., 2015. Tech World. [Online] Available at: http://www.techworld.com/big-data/why-does-google-need-deep-neural-network-deep-learning-3623340/ [Accessed 25 September 2016].
Naef, E. et al., 2014. Digital Principles. [Online] Available at: http://digitalprinciples.org/wp-content/uploads/2015/05/Using-Mobile-Data-for-Development.pdf [Accessed 07 October 2016].

26
Nielsen, K. B. & Slind, T., 2013. Bill & Melinda Gates Foundation. [Online] Available at: https://docs.gatesfoundation.org/Documents/The%20Power%20of%20Mapping%20Financial%20Services%20Data.pdf [Accessed 7 September 2016].
ORATER, 2013. What is Analytics. [Online] Available at: http://www.whatisanalytics.co.uk/jm/index.php/articles/analytics-degrees/103-analytics-disciplines [Accessed 19 Septmeber 2016].
Parker, B., 2016. Business Day Live. [Online] Available at: http://www.bdlive.co.za/opinion/2016/07/31/tech-hungry-africa-is-ripe-for-the-internet-of-things [Accessed 07 October 2016].
Peterson, L. E., 2009. Scholarpedia. [Online] Available at: http://www.scholarpedia.org/article/K-nearest_neighbor [Accessed 07 October 2016].
Pinola, M., 2011. PC World. [Online] Available at: http://www.pcworld.com/article/243060/speech_recognition_through_the_decades_how_we_ended_up_with_siri.html?page=2 [Accessed 30 September 2016].
PWC, 2016. PwC’s Data and Analytics Survey 2016. [Online] Available at: http://www.pwc.co.uk/data-analytics/big-decisions/big-decisions-infographics.pdf [Accessed 30 September 2016].
Rajpurohit, A., 2016. KDnuggets. [Online] Available at: http://www.kdnuggets.com/2016/01/businesses-need-one-million-data-scientists-2018.html [Accessed 30 September 2016].
Rashid, N. & Staschen, S., 2016. CGAP. [Online] Available at: http://www.cgap.org/blog/unlocking-financial-inclusion-using-biometrically-verified-sims [Accessed 09 September 2016].
Statista, 2016. The Statistics Portal. [Online] Available at: https://www.statista.com/topics/1002/mobile-app-usage/ [Accessed 07 October 2016].
Steyn, R., 2014. Ventureburn. [Online] Available at: http://www.tandfonline.com/loi/reso20 [Accessed 07 September 2016].

How to find us
Get involved. Contact us.
Mari-Lise du Preez T: +27(0)21 913 9510 E: [email protected]
Celina Lee T: +27(0)21 913 9510 E: [email protected]
i2ifacility.org
@i2ifacility /insight2impact /insight2impact /i2ifacility