data analytics for forecasting cell congestion on lte...
TRANSCRIPT

Data Analytics for Forecasting Cell Congestion on LTE Networks
Pedro Torres, Paulo Marques, Hugo Marques, Rogério Dionísio
Instituto Politécnico de Castelo Branco Castelo Branco, Portugal
[email protected], [email protected], [email protected], [email protected]
Tiago Alves, Luis Pereira, Jorge Ribeiro ALLBESMART LDA
Castelo Branco, Portugal [email protected], [email protected],
Abstract—This paper presents a methodology for
forecasting the average downlink throughput for an LTE cell by using real measurement data collected by multiple LTE probes. The approach uses data analytics techniques, namely forecasting algorithms to anticipate cell congestion events which can then be used by Self-Organizing Network (SON) strategies for triggering network re-configurations, such as shifting coverage and capacity to areas where they are most needed, before subscribers have been impacted by dropped calls or reduced data speeds. The presented implementation results show the prediction of network behaviour is possible with a high level of accuracy, effectively allowing SON strategies to be enforced in time.
Keywords—LTE; SON; Machine Learning; Forecasting
I. INTRODUCTION The overall traffic generated by mobile networks has
increased by 75 % in 2015 and the pace of growth continues to accelerate. To address the capacity needed to transport the increasing mobile traffic, telecom operators have been heavily investing in 4G networks, based on Long Term Evolution (LTE) standard and its evolution, LTE-A. This increase in capacity, taking place especially in urban centres, has been achieved thanks to mobile network densification, which implies large investments from the mobile operators to acquire new base stations and other network equipment. Furthermore, as the 4G system will need to coexist with existing networks (2G/3G/Wi-Fi), the result will be a dense, and complex, heterogeneous network topology (HetNet). This situation poses new challenges in the management of the radio access network, which has operating and maintenance costs implications. To address the requirements of today’s connectivity demands, LTE radio access networks have many features. These however increase the complexity of network planning and maintenance, cell optimisation operations and network troubleshooting. Mobile Network Operators (MNOs) use to require independent benchmarking companies to perform drive tests, to check coverage and capacity of their networks in order to identify problems and improve network performance in specific geographical areas. These drive tests are typically conducted
using a vehicle, in a predetermined test route, with a test engineer operating advanced on-board radio equipment to collect network key performance indicators (KPIs). The high efforts for executing these drive tests result in high costs and therefore in a low frequency of execution. Typically, this kind of measurement is executed no more than 2 or 3 times per year, while changes in the network and the radio environment occur on a much more frequent basis. In comparison to the existing market solutions, the described approach as some clear advantages, as depicted in Table 1. The methodology proposed in this paper uses historic measurements that have been collected by a set of LTE probes, as the input for forecasting future network behaviour. The measurements were performed daily, automated and with affordable cost. The LTE probes have been developed in the scope of the European H2020 Research Project MONROE - Measuring Mobile Broadband Networks in Europe [1][2][3]. These LTE probes have been deployed in existing transportation fleets however they can also be used in taxis, buses, private cars and trains, without need for dedicated field personnel, effectively reducing the cost of operation by up to 70%. By using forecasting, this paper also exploits the concept of Self-Organizing Network (SON) strategies. SON has the potential to minimize the lifecycle cost of running a mobile network by eliminating manual configuration of equipment and troubleshooting during operation, which can significantly reduce service cost. MNOs are keen to capitalize on SON to minimize rollout delays and operational expenditures associated with their ongoing LTE deployments [4]. The SON ecosystem is increasingly witnessing convergence with other technological trends such as Machine Learning and Big Data Analytics. Learning and prediction of network behaviour are key enablers towards the implementation of the SON paradigm. SON can use machine learning predictive functionality to adapt mobile networks to demand in a controlled manner (e.g., shifting coverage and capacity to areas with the most need before subscribers have been impacted by dropped calls or reduced data speeds). Therefore, this paper
also addresses machine learning algorithms to predict average throughput per user for a specific cell and time of the day - leveraging on priori measurements from the LTE probes. In the literature, there are some research studies that address a similar topic. In [5] load balancing algorithms are studied and compared to solve localized congestion problems. Methods based on reinforcement Q-learning algorithm are used for forecasts load status for every node and combined with the related concepts of self-organization network. In [6] the authors propose a reactive load balancing algorithm based also in the Q-learning algorithm. In [7] the autoregressive integrated moving average (ARIMA) model and exponential smoothing model are used to predict the throughput in a single cell and whole region in a LTE network. The remaining of the paper is organized as follows: Section II introduces the MONROE setup; Section III presents the forecast models whereas the case study and experimental results are presented in Section IV. Finally, the conclusions are given in Section V.
II. MONROE SETUP The MONROE LTE probe software technology is based on
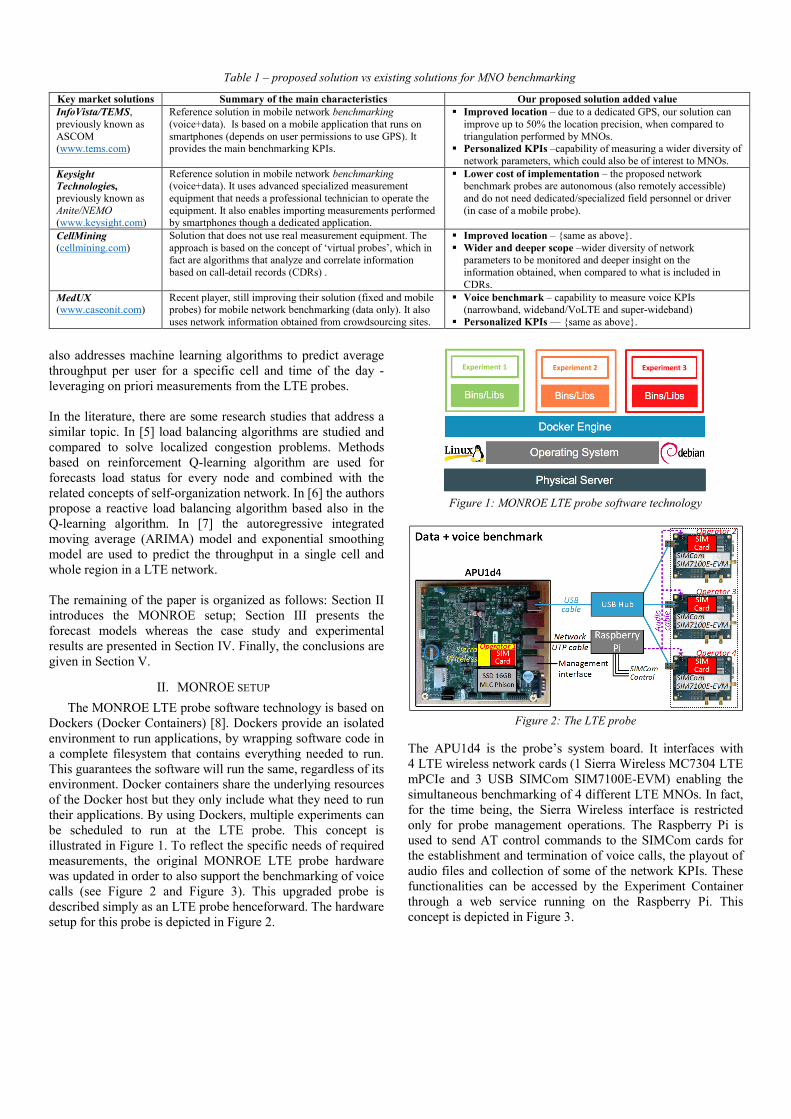
Dockers (Docker Containers) [8]. Dockers provide an isolated environment to run applications, by wrapping software code in a complete filesystem that contains everything needed to run. This guarantees the software will run the same, regardless of its environment. Docker containers share the underlying resources of the Docker host but they only include what they need to run their applications. By using Dockers, multiple experiments can be scheduled to run at the LTE probe. This concept is illustrated in Figure 1. To reflect the specific needs of required measurements, the original MONROE LTE probe hardware was updated in order to also support the benchmarking of voice calls (see Figure 2 and Figure 3). This upgraded probe is described simply as an LTE probe henceforward. The hardware setup for this probe is depicted in Figure 2.
Figure 1: MONROE LTE probe software technology
Figure 2: The LTE probe
The APU1d4 is the probe’s system board. It interfaces with 4 LTE wireless network cards (1 Sierra Wireless MC7304 LTE mPCIe and 3 USB SIMCom SIM7100E-EVM) enabling the simultaneous benchmarking of 4 different LTE MNOs. In fact, for the time being, the Sierra Wireless interface is restricted only for probe management operations. The Raspberry Pi is used to send AT control commands to the SIMCom cards for the establishment and termination of voice calls, the playout of audio files and collection of some of the network KPIs. These functionalities can be accessed by the Experiment Container through a web service running on the Raspberry Pi. This concept is depicted in Figure 3.
Experiment 1 Experiment 2 Experiment 3
Table 1 – proposed solution vs existing solutions for MNO benchmarking
Key market solutions Summary of the main characteristics Our proposed solution added value InfoVista/TEMS, previously known as ASCOM (www.tems.com)
Reference solution in mobile network benchmarking (voice+data). Is based on a mobile application that runs on smartphones (depends on user permissions to use GPS). It provides the main benchmarking KPIs.
Improved location – due to a dedicated GPS, our solution can improve up to 50% the location precision, when compared to triangulation performed by MNOs.
Personalized KPIs –capability of measuring a wider diversity of network parameters, which could also be of interest to MNOs.
Keysight Technologies, previously known as Anite/NEMO (www.keysight.com)
Reference solution in mobile network benchmarking (voice+data). It uses advanced specialized measurement equipment that needs a professional technician to operate the equipment. It also enables importing measurements performed by smartphones though a dedicated application.
Lower cost of implementation – the proposed network benchmark probes are autonomous (also remotely accessible) and do not need dedicated/specialized field personnel or driver (in case of a mobile probe).
CellMining (cellmining.com)
Solution that does not use real measurement equipment. The approach is based on the concept of ‘virtual probes’, which in fact are algorithms that analyze and correlate information based on call-detail records (CDRs) .
Improved location – {same as above}. Wider and deeper scope –wider diversity of network
parameters to be monitored and deeper insight on the information obtained, when compared to what is included in CDRs.
MedUX (www.caseonit.com)
Recent player, still improving their solution (fixed and mobile probes) for mobile network benchmarking (data only). It also uses network information obtained from crowdsourcing sites.
Voice benchmark – capability to measure voice KPIs (narrowband, wideband/VoLTE and super-wideband)
Personalized KPIs –– {same as above}.

With this setup, the LTE probe provides the information depicted in Table 2. The data connection properties are obtained by subscribing metadata feeds provided by the MONROE base container, whilst the data specific measurements are obtained through dedicated Experiment Containers. Experiments are submitted through a scheduler that allows the user to specify where the Experiment Container is located, in which probe will the experiment be executed and which interfaces (each corresponding to a different MNO) are to be used. Experiments can also be scheduled for the first available slot or for a specific date. In any case, recursive options are available. Once the experiment has started, the data are collected by the LTE probe and stored on the probe’s local storage until the experiment is concluded, only then the data are uploaded to the MONROE repository (a Cassandra database). Alternatively, during the experiment, data can also be sent in real-time to external servers for immediate processing however this approach consumes more traffic quota. Considering Cassandra is not a relational database, our approach performs daily synchronizations between the MONROE repository and its own MySQL database. This is where data is fetched for various purposes, including learning the network behaviour for specific areas and predict eventual capacity issues in an automated fashion as explained in the next section. This lifecycle of an experiment is depicted in Figure 4.
Figure 3: The LTE probe high-level architecture
Figure 4: The lifecycle of an experiment
Figure 5: allbesmart LTE Dashboard showing the RSSI measured by
a MONROE LTE probe deployed in a bus in Madrid
Table 2: Key information retrieved from the LTE probe General Information • Unique experiment identifier (Guid); • Experiment status (Defined, Aborted, Stopped, Finished, …); • Experiment start and stop time; • Node identification (NodeId). Data connection properties • Integrated Circuit Card Identifier (ICCID); • International Mobile Station Equipment Identity (IMEI); • International Mobile Subscriber Identity (IMSI); • Mobile Country Code (MCC); • Mobile Network Code (MNC); • Radio access technology used (mode) by a specific modem; • Received Signal Strength Indicator (RSSI) for a specific modem; • Reference Signal Received Power (RSRP) for a specific modem; • Reference Signal Received Quality (RSRQ) for a specific modem; • Frequency Band (band) used by a particular modem; • Local Area Code for the connected cell (LAC) for a specific modem; • Operator name for a specific modem; • Node interface(s) name(s), used by the experiment; • Cell Identification (CID) for a specific modem; • State (DeviceState) reported to the network by a particular modem; • Connection submode (DeviceSubmode) for a specific modem; • IP address used by a particular radio interface; • GPS location. Data specific measurements • Packet loss (UDP only); • Interarrival jitter (UDP only); • Round-trip-time (RTT) to a particular destination; • Download and upload throughput. Voice KPIs • Call connection establishment delay; • Call connection establishment error ratio; • Call connection loss rate (related to call retainability); • Call transfer delay of user data frame; • GSM network registration delay.

The conversion of the raw data in a meaningful and easy to understand manner is performed by the allbesmart LTE Benchmark Tool, which also acts as a dashboard. It is capable of overlaying data related to RSSI, CID, upload and download throughput, amongst others, with the LTE probe’s geolocated position. It also provides animations that show how the different network KPIs behave throughout a day, or during specific time periods. Figure 5 depicts the dashboard layout reflecting the RSSI measurements taken by a mobile LTE probe in Madrid, Spain, in a specific time period, whilst Figure 6 provides the details for the download throughput variation for a particular fixed LTE probe.
Figure 6: Sample of the average download speed variation as
measured by a fixed MONROE LTE probe in a time period of 3 days.
III. FORECAST MODELS Machine learning is a kind of artificial intelligence that
provides systems with the ability to learn without being explicitly programmed. Machine learning focuses on developing computer programs that can change when exposed to new data. The algorithms use data to detect patterns and adjust program actions accordingly. Typically, these algorithms can be categorized as being supervised, unsupervised or reinforcement learning. Supervised algorithms can apply what has been learned to new data. Unsupervised algorithms can draw inferences from datasets. In reinforcement learning the algorithm learns a policy of how to act given an observation of the world. Every action has some impact on the environment, and the environment provides feedback that guides the learning algorithm. In our proposed approach, the Machine Learning Engine uses the measurements collected by the LTE probes and stored in a local relational database to learn the network event patterns and forecast its future behaviour. The predicted KPI values are then forwarded to a Self-Optimization Process that uses these values to take timely preventive actions. In this analysis, the network is seen as a dynamic system, and to forecast its behaviour we need to use past output measurements. In other words, given observations 𝑦𝑦(𝑡𝑡) = {𝑦𝑦(1), … ,𝑦𝑦(𝑛𝑛)} of the output of the network, forecasting is the prediction of the outputs 𝑦𝑦(𝑛𝑛 + 1), … ,𝑦𝑦(𝑛𝑛 + ℎ) until a future time horizon h. In order to apply forecast, a model that fits past measured data from the network needs first to be identified. This can be a linear time series model, state-pace models, or a nonlinear model. In the literature, there are numerous time-series and
regression forecasting methods [5][6] that can be used. This paper focuses on two well-known algorithms, the naïve persistence model and a derivation of Autoregressive Integrated Moving Average model (ARIMA) [13].
A. Method 1 The first method is based on a linear time series model that includes a regression component, a variant of ARIMA model, named ARIMAX model (Autoregressive Integrated Moving Average with Explanatory Variable [9]). This model also considers a seasonality effect to estimate the new model coefficients for forecasting the future outputs. A linear time series model for response process 𝑦𝑦𝑡𝑡 and innovations 𝜀𝜀𝑡𝑡 is a stochastics process that has the form of equation 1. 𝑦𝑦𝑡𝑡 = 𝑐𝑐 + ∅1𝑦𝑦𝑡𝑡−1 + ⋯+ ∅𝑝𝑝𝑦𝑦𝑡𝑡−𝑝𝑝 + 𝜀𝜀𝑡𝑡 + 𝜃𝜃1𝜀𝜀𝑡𝑡−1 + ⋯+ 𝜃𝜃𝑞𝑞𝜀𝜀𝑡𝑡−𝑞𝑞 (1) The model expresses the conditional mean of 𝑦𝑦𝑡𝑡 as a function of both past observations, 𝑦𝑦𝑡𝑡−1, … ,𝑦𝑦𝑡𝑡−𝑝𝑝, and past innovations, 𝜀𝜀𝑡𝑡−1, … , 𝜀𝜀𝑡𝑡−𝑞𝑞. Where 𝑝𝑝 is a positive integer that indicates the degree of the nonseasonal autoregressive polynomial and 𝑞𝑞 a positive integer that indicates the degree of the nonseasonal moving average polynomial. A maximum likelihood function is used to estimate the parameters of the ARIMAX model given the observed univariate time series 𝑦𝑦𝑡𝑡 . Given its history, the innovations are conditionally independent. Let 𝐻𝐻𝑡𝑡 denote the history of the process available at time t, where t=1, …, T. The likelihood function of the innovations is obtained from equation 2.
𝑓𝑓(𝜀𝜀1, … , 𝜀𝜀𝑇𝑇|𝐻𝐻𝑇𝑇−1) = �𝑓𝑓(𝜀𝜀𝑡𝑡|𝐻𝐻𝑡𝑡−1)𝑇𝑇
𝑡𝑡=1
(2)
where f is the standard Gaussian or t probability density function.
B. Method 2 This method uses the Naïve model [6] which is a forecasting method that uses the last observation (time step (t)) to predict the expected outcome at the next time step (t+1). The naïve approach can be used with a stable series, with seasonal variations, or with trend. With a stable series, the last data point becomes the forecast for the next period. As example, if the throughput in the last hour was 25Mbps, the forecast for this hour is 25Mbps. This method is used as a supervised machine learning algorithm to identify trends, seasonality and forecast the estimated future values. The historical univariate data (throughput as a function of time) is transformed in a supervised learning problem with inputs and outputs in the way that the throughput of instance (t) is the output of instance (t+1). Typically, for stable time series data,
𝑦𝑦𝑡𝑡� = 𝑦𝑦𝑡𝑡−1 (3)

considering the seasonal variations,
𝑦𝑦𝑡𝑡� = 𝑦𝑦𝑡𝑡−𝑛𝑛 (4)
where n is the cycle last n periods. For data with trends,
𝑦𝑦𝑡𝑡� = 𝑦𝑦𝑡𝑡−1 + (𝑦𝑦𝑡𝑡−1 − 𝑦𝑦𝑡𝑡−𝑛𝑛) (5)
, if there are constant trends between 𝑦𝑦𝑡𝑡−1 and 𝑦𝑦𝑡𝑡−𝑛𝑛.
IV. EXPERIMENTAL RESULTS The goal is to forecast one entire week of the cell average
downlink (DL) throughput, with a resolution of one hour. The input data for our model was obtained from a fixed LTE probe deployed in the city of Lisbon (Portugal) in a dense urban area connected to a LTE (4G) mobile network operator. Three weeks of historical collected measurements have been used for training the prediction models and one week was used to compare the observed throughput with the forecast values, as illustrated in Figure 7. For method 1, the comparison between the forecast values and the actual DL throughput is highlighted in Figure 8. We can observe the confidence interval (uncertainty) increases as the time goes on. The ARIMAX model proved to give a very good estimation during the first 20 hours, actually enabling us to predict cell congestion events. A Cell congestion event was considered when we measured a drop of at least 75% on the average download speed per user (considering an average of 20Mbps per user during off-peak hours). The prediction capability is very relevant for a SON implementation - if the self-optimization process estimates that a change in the mobile network configuration will compensate possible trade-offs (e.g., interruption in service) it may schedule an optimization process that performs changes in the cell’s parameters (such as the activation of additional LTE carriers) to compensate a forecasted cell outage event [10]. Figure 9 depicts the forecasting results obtained from method 2 in comparison with the real (measured) values of DL throughput. Figure 10 presents the comparison between the two forecast models. The Mean Squared Error (MSE) computed for the 2 methods, presented in Table 2, shows that method 2 is more accurate than method 1, for this dataset. Although the Naïve persistence model is quite simple, usually it is quite efficient and assertive in the time series forecasting.
Figure 7: Downlink average throughput: 3 weeks for training and 1
week for forecasting.
Figure 8: One week of throughput forecast and associated confidence
intervals (Method 1)
Figure 9: One week of throughput forecast (Method 2) compared to
real measurements
Cell congestion

Figure 10: Comparison between the two forecast models
Table 3: Forecasting errors (MSE) expressed in Mbps
Method MSE [Mbps] Method 1: ARIMAX model 7.16 Method 2: Naïve persistence model 6.90
V. CONCLUSIONS This work describes a data analytics methodology and
modelling capable of forecasting the average downlink throughput of an LTE base station by using two forecast models, the ARIMAX and the Naïve persistence models. The obtained results have shown that both models are able to forecast the network behaviour with high accuracy. We are able to estimate a cell congestion event up to 30 hours in advance which provides SON strategies, enough time to react (e.g., by shifting coverage and capacity to areas in need, before subscribers have been impacted by dropped calls or reduced data speeds). As future work it is suggested the comparison with other forecasting models, probabilistic and fuzzy.
ACKNOWLEDGMENTS This work is funded by the European Union's Horizon 2020 research and innovation programme under grant agreement No. 644399 (MONROE) through the open call project Affordable LTE Network Benchmarking Based On MONROE, and the European Structural Investment Funds (ESIF), through the Operational Competitiveness and Internationalization Programme (COMPETE 2020) [Project Nr. 17787 (POCI-01-0247-FEDER-MUSCLES).
REFERENCES [1] MONROE, “Measuring Mobile Broadband Networks in
Europe”, H2020-ICT-11-2014 research project. [online]. Available: https://www.monroe-project.eu/
[2] Ö. Alay et al., "Measuring and assessing mobile broadband networks with MONROE," 2016 IEEE 17th
International Symposium on A World of Wireless, Mobile and Multimedia Networks (WoWMoM), Coimbra, 2016, pp. 1-3. doi: 10.1109/WoWMoM.2016.7523537
[3] Ö.Alay et al, “MONROE: Measuring Mobile Broadband Networks in Europe”, IRTF & ISOC Workshop on Research and Applications of Internet Measurements (RAIM), 2015.
[4] L. Jorguseski, A. Pais, F. Gunnarsson, A. Centonza and C. Willcock, "Self-organizing networks in 3GPP: standardization and future trends," in IEEE Communications Magazine, vol. 52, no. 12, pp. 28-34, December 2014. doi: 10.1109/MCOM.2014.6979983
[5] J. Xu, L. Tang, Q. Chen and L. Yi, "Study on Based Reinforcement Q-Learning for Mobile Load Balancing Techniques in LTE-A HetNets," 2014 IEEE 17th International Conference on Computational Science and Engineering, Chengdu, 2014, pp. 1766-1771.
[6] S. S. Mwanje and A. Mitschele-Thiel, "A Q-Learning strategy for LTE mobility Load Balancing," 2013 IEEE 24th Annual International Symposium on Personal, Indoor, and Mobile Radio Communications (PIMRC), London, 2013, pp. 2154-2158.
[7] Dong, Xin, Wentao Fan, and Jun Gu. "Predicting LTE Throughput Using Traffic Time Series." ZTE Communications 4 (2015): 014.
[8] Docker containers. [online]. Available: https://www.docker.com/
[9] G. G. M. J. a. G. C. R. Box, Time Series Analysis: Forecasting and Control 3rd ed., Englewood Cliffs, NJ: Prentice Hall, 1994
[10] X. S. W. L. a. J. W. Jingyu Li, “Self-Optimization of Coverage and Capacity in LTE Networks Based on Central Control and Descentralized Fuzzy Q-Learning,” International Journal of Distributed Sensor Networks, vol. 8, 2012
[11] A. M. L. Leite da Silva, W. S. Sales, L. A. d. F. Manso and R. Billinton, "Long-Term Probabilistic Evaluation of Operating Reserve Requirements With Renewable Sources," in IEEE Transactions on Power Systems, vol. 25, no. 1, pp. 106-116, Feb. 2010.
[12] L. M. Carvalho, J. Teixeira and M. Matos, "Modeling wind power uncertainty in the long-term operational reserve adequacy assessment: A comparative analysis between the Naïve and the ARIMA forecasting models," 2016 International Conference on Probabilistic Methods Applied to Power Systems (PMAPS), Beijing, 2016, pp. 1-6.
[13] M. M. Eljazzar and E. E. Hemayed, "Enhancing electric load forecasting of ARIMA and ANN using adaptive Fourier series," 2017 IEEE 7th Annual Computing and Communication Workshop and Conference (CCWC), Las Vegas, NV, USA, 2017, pp. 1-6.