data analysis - siemensmdx2.plm.automation.siemens.com/sites/default/files/flier...• effectively...
TRANSCRIPT

DATA ANALYSIS
MODERN CHALLENGES IN DATA ANALYSISImproved simulation technologies and hardware capabilities have resulted in efficient simulation-led design, accelerating the pace of product development cycles. With this constant stream of information guiding the design process, adequate data analysis is crucial and needs to address the following challenges in order to be effective:
• Access to a complete data analysis toolset without impairing productivity.• Achieving confidence in design by exploring relevant what-if scenarios.• Effective management of data.• Meaningful and clear representations of simulation results.
STAR-CCM+ OFFERS THE SOLUTIONSTAR-CCM+®helps you save valuable engineering time when managing, assembling, presenting and sharing simulation results. Using a single integrated user interface, STAR-CCM+ allows you to:
• Increase productivity and save time.• Drive design decisions with quantitative data analysis.• Effectively illustrate your results with qualitative visualization.• Make informed decisions in a collaborative environment.
KEY FEATURES AND BENEFITS
BE CONFIDENT IN DESIGN DECISIONS WITH EFFECTIVE QUANTITATIVE ANALYSIS TOOLS
SAVE ENGINEERING TIME USING A SINGLE INTEGRATED ENVIRONMENT
INTERACT WITH RUNNING SOLUTION IN REAL TIME WITH LIVE-PROCESSING
CLEARLY COMMUNICATE RESULTS WITH EFFECTIVE QUALITATIVE VISUALIZATION TOOLS SUCH AS VOLUME RENDERING AND CUSTOM COLOR MAPS
INTERACTIVELY EXPLORE COMPLEX RELATIONSHIPS IN DATA
AUTOMATE POST-PROCESSING TASKS WITH SIMULATION ASSISTANTS AND JAVA MACROS
COLLABORATE EFFECTIVELY WITH A FREE STANDALONE VIEWER AND AVOID MOVING LARGE DATA
Vortex shedding from a landing gear Air flow around a car and pressure field on the windows
“The usability of STAR-CCM+ is great compared to other codes I have used in the past, especially when it comes to pre-processing, solution, and post-processing, all accomplished from a single integrated user interface.”
Alex Stoll Joby Aviation
Volume rendering on Ares stage separation analysis
PRODUCTIVITY• See your results develop in real time with Live-Processing, or perform a
comprehensive analysis with Post-Processing.• Analyze data and process all solutions using a single integrated user
interface within STAR-CCM+.• Automate post-processing tasks with Java Macros or Simulation Assistants.• Effectively utilize high-end graphics resources with GPU acceleration. • Manage large amounts of data by storing transient data sets at select
time intervals with Simulation History files.
QUANTITATIVE DATA ANALYSIS• Use built-in or create user-defined Field Functions to gather and report data.• Access the summary of computed data through application-specific
Reports (example: forces, pressure drop).• Keep track of your simulation results with flexible Monitors based on
reports, field functions or customized quantities.• Visualize data set with Plots (XY, histogram, custom).• Perform signal processing with Data Set Functions (Fourier transform,
time history).
QUALITATIVE DATA ANALYSIS• Access the solution data anywhere in the model through Derived Parts
including probes, plane and arbitrary sections, iso-surfaces, thresholds and streamlines.
• Display different types of content in a scene including Geometry, Scalar Fields, Vectors (glyph or line integral convolution) and Streamlines.
• Improve result understanding using Volume Rendering.• Create aesthetically pleasing visualizations with Colormaps (perceptual,
high-impact, diverging, specialty, custom), Lighting and Background Images.
• Use animations to analyze transient data sets or to visually communicate results.
• Add context to your data with custom Annotations.
DECISION MAKING• Effectively communicate results with teams across the organization
using STAR-View+, a standalone viewer with no license required: - Can be installed anywhere and as often as you need. - Export visualization results (images/animations) to STAR-View+;
results can be viewed interactively by anyone anywhere or embedded into Microsoft PowerPoint presentations.
• Interactively explore and analyze complex relationships in data and broaden comprehension of simulation results with Data Focus:
- Plots and charts are interactively “brushed” to define criteria of interest which can be visualized in 3D scenes.
- What-if questions can be addressed through a unique and effective exploration of non-intuitive results, improving the decision-making process.
Mesh, surface temperature, and streamlines on a micro gas turbine (Courtesy: B&B-AGEMA)
Flow and wall stress within a human brain vessel (Courtesy: University of Magdeburg)
Sample color map in STAR-CCM+Jaguar F-Type cabin ventilation (Courtesy: Jaguar Land Rover)
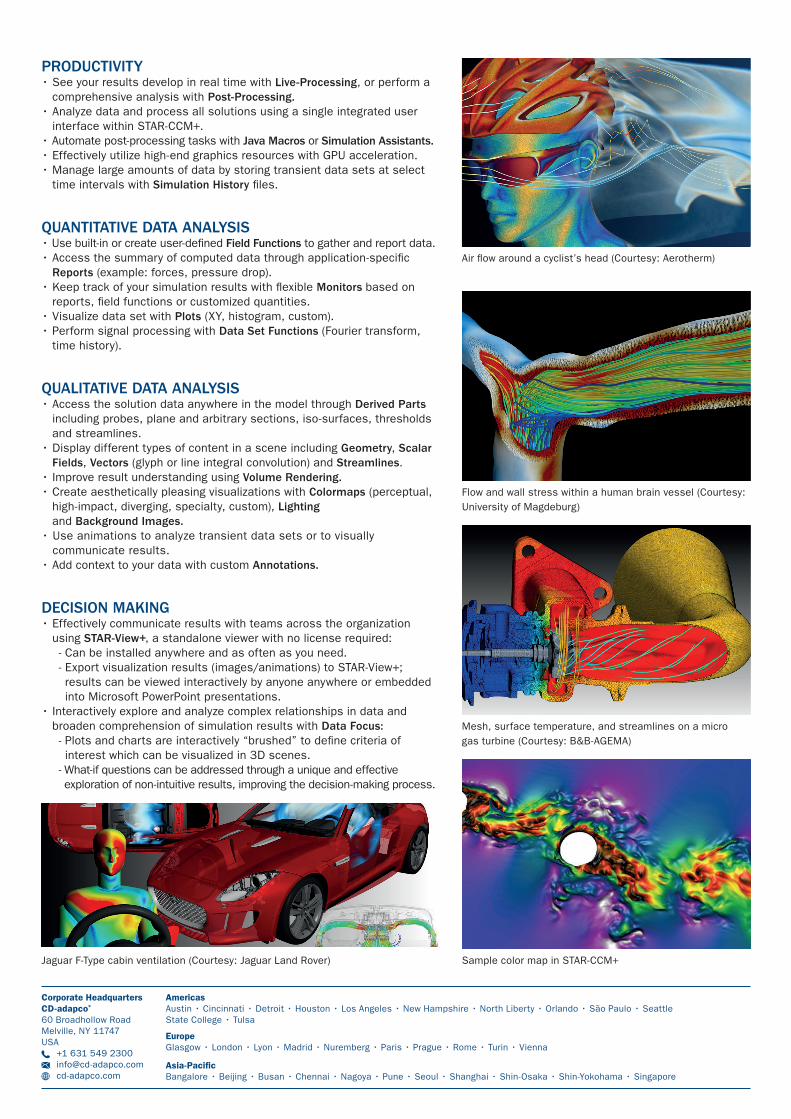
Air flow around a cyclist’s head (Courtesy: Aerotherm)
AmericasAustin • Cincinnati • Detroit • Houston • Los Angeles • New Hampshire • North Liberty • Orlando • São Paulo • SeattleState College • Tulsa
EuropeGlasgow • London • Lyon • Madrid • Nuremberg • Paris • Prague • Rome • Turin • Vienna
Asia-PacificBangalore • Beijing • Busan • Chennai • Nagoya • Pune • Seoul • Shanghai • Shin-Osaka • Shin-Yokohama • Singapore
Corporate HeadquartersCD-adapco®
60 Broadhollow RoadMelville, NY 11747USA
+1 631 549 [email protected]