data analysis and interpretation -...
TRANSCRIPT

Chapter No 7
Data analysis and Interpretation

7.0 Introduction
Considering the three important constraints as time factor, money factor, and attitude of
respondents, it was determined to cover 25 pharmaceutical companies, 5 patent lawyers and 30
doctors in and around Pune and Mumbai city. This has enabled to study effectively the impact of
Amended Patent act on research and development activities of Indian pharmaceutical
companies.
There are different methods to collect data and the suitable method of data collection can be
decided keeping in view the consideration of time, cost, and reliability of the source.
Primary data is collected by taking the interviews of research and development, production and
legal department managers of pharmaceutical companies. Also some eminent personalities
having wide experience in the line of intellectual property rights legal practice who can discuss
current scenario of patent filling as well as approving in Indian pharmaceutical company.
Similarly some eminent personalities having very wide experience in the line of medicine
practitioners are contacted to understand current scenario of Indian manufactured medicine. In
personal interviews, all respondents have given open minded replies to the questions. Free
discussions with respondents have enabled to locate the problem areas relating to amended
Patent act and research and development activities in Indian pharmaceutical company. For the
all three types of respondents’ namely pharmaceutical industry employees, legal practitioners
and doctors, separate questionnaires were prepared and circulated. Copies of the questionnaires
are enclosed at the end of this research work.
Before India signed WTO agreement, as per patent act 1970, product patent was not approved
for Agriculture, food and pharmaceutical companies only process patent was sanction. (1)
Consequently most of the Indian pharmaceutical companies were in generic medicines
manufacturing that is imitation. Even there was less research and development activities in drug
from multinational companies. Due to the amendment in patent act 2005, product patent is
approved. Indian pharmaceutical companies are facing changes in research and development
activity. Also there are changes in government policies to boost research and a development
activity in pharmaceutical industries. (2) Therefore the researcher found it necessary to give an
opportunity to companies and legal practitioners for giving useful suggestions for further
increase in research and development activities.

Secondary data collection is comparatively an easy task. It can be collected from libraries and
other places of information. In this research too, for preliminary studies and for making
background preparations, use of books, news papers articles, magazines and periodicals has been
made for studying the environment in and around the Indian pharmaceutical companies with
respect to intellectual property rights. During the pre and post amended period, especially 1990
onwards, a review of Indian pharmaceutical companies’ strategy is consider to know the
changes in Indian pharmaceutical companies with respect to changed Patent act.
1- Indian pharmaceutical company overview: Challenges and Opportunities, Daara B Patel, Product patents & drug price controls, 2nd
June 2011, Goa
2- Current Scenario of Pharmaceutical Industries in India by Gautam Arti and Kharia Anil

7.1 Data Analysis and Interpretation
The responses received from the pharmaceutical companies, legal advisor and doctors are
satisfactory. The target respondents comprised representatives of Research and
development department, legal department from pharmaceutical companies. The legal
advisor comprised of intellectual property law practitioners. And the doctors comprised of
doctors with different specialization, who are practicing since minimum 12 years who
have witnessed change in product quality of Indian pharmaceutical company after 2005.
Representation of pharmaceutical industry’s respondents’ data
PercentValid
PercentCumulative Percent
Valid
Junior level
8.0 8.0 8.0
Middle level
52.0 52.0 60.0
Top level
40.0 40.0 100.0
Total 100.0 100.0
All grades of pharmaceutical industries managers were included in the sample size, so as
to make the research comprehensive and avoid any lopsided conclusions.
Representation of legal practitioners respondents’ data (on the managerial level)
Frequency PercentValid Percent
Cumulative Percent
Valid Junior level
1 20.0 20.0 20.0
Middle level
3 60.0 60.0 80.0
Top level
1 20.0 20.0 100.0
Total 5 100.0 100.0
All grades of Intellectual property rights practitioners were included in the sample size, so as to make the research comprehensive and avoid any lopsided conclusions.
Pharmaceutical company’s questionnaires contain total 25 questions. Out of which 7
questions are about research and development activity scenario in Indian pharmaceutical
companies, 5 to 6 questions are about intellectual property right process and 8 to 10
questions are about patented product and generic products. Patent practitioner lawyers
questionnaires contain total 13 questions. Out of which 2 questions are about research and
development activity scenario in Indian pharmaceutical companies, 11 questions are about
intellectual property right process and 8 to 10 questions are about patented product and
generic products. Doctors questionnaires contain total 5 questions are about the changes
in the quality of Indian pharmaceutical company before and after Amended Patent act
2005. The responses analyzed and the inferences drawn about the effectiveness of the
intellectual property right amended act 2005. The impact of the Amended Patent act 2005
on Indian pharmaceutical company at individual level and at sector level studied. The
hypothesis formulated at the beginning of the research has tested.
After analyzing the available responses from the pharmaceutical company, lawyers and
doctors an important conclusion was drawn. Surveys enable to obtain data about current
practices, situations or views at a particular point of time through interviews. Quantitative
analytical techniques are then used to draw inferences from this data regarding existing
relationships.
7.2 Data Analysis and Interpretation for pharmaceutical companies and
Patent Experts (Lawyers)
The data analysis and interpretation for pharmaceutical companies and Patent
Experts (Lawyers) as follows,
1. Research and development activity in Indian pharmaceutical company have
increased since 2005 patent act.
Yes No For pharmaceutical companies
PercentValid
PercentCumulative Percent
Yes 100.0 100.0 100.0
Valid No 0 0 100

100% of the total says that Research and development activity in Indian pharmaceutical
company have increased since 2005 patent act.
For IPR legal practitioners
Increase in R and D activity since 2005 patent act
Frequency PercentValid
PercentCumulative
PercentValid Yes 5 100.0 100.0 100.0
100% of the total says that Research and development activity in Indian pharmaceutical
company have increased since 2005 patent act.
After 2005 patent act Indian pharmaceutical companies are trying to move from imitation to
innovation by increasing Research and development activity.
Interpretation
The introduction of product patents has important implications for both Indian and Western
pharmaceutical companies. After 2005, Indian companies will increasingly need to look
100%
0%
Yes
No
100%
0%
Yes
No

beyond the domestic generics market to sustain their sales, since their traditional strategy of
copying on-patent drugs will no longer be allowed. They will consequently need to focus on
product innovation.
Most of the pharmaceutical companies showed the most impressive increase in their R&D
intensities over the period 1998-2008. The implication which comes out from this analysis is
that these firms have realized the need of R&D in post TRIPS period and as such they have
been increasing the percentage of R&D expenditure.
2. If yes, what percentage of R and D activity,
I. 0-5%
II. 5-10%
III. 10-20%
For pharmaceutical companies
IV. 20-30%
V. More than 30%
Percentage increase in R and D activities
PercentValid
PercentCumulative
Percent
Valid
0-5% 16.0 16.0 16.05-10% 44.0 44.0 60.0
10-20% 28.0 28.0 88.0More than
30%12.0 12.0 100.0
Total 100.0 100.0
44 % of the total says that R and D activity has been increased 2005 patent act by 5-10%
in Indian pharmaceutical companies. 28% of the total says that R and D activity has been
16%
44%28%
12%
Percentage increase in R and D activitiesPercent
0-5%
5-10%
10-20%
More than 30%

increased by 10-20%. So the total 72% of total say R and D activity increased by 5 to
20%.
For IPR legal practitioners
Percentage increase in R and D activities
Frequency PercentValid
PercentCumulative
PercentValid 10-20% 2 40.0 40.0 40.0
20-30% 2 40.0 40.0 80.0More than 30%
1 20.0 20.0 100.0
Total 5 100.0 100.0
80 % of the total says that R and D activity has been increased 2005 patent act by 10-30% in Indian pharmaceutical companies.
Interpretation
Knowing that the cost of introducing a new drug into the market may cost a company
anywhere between $ 300 million to $800 million along with all the associated risks at the
developmental stage, no company will like to risk its intellectual property becoming a
public property without adequate returns.
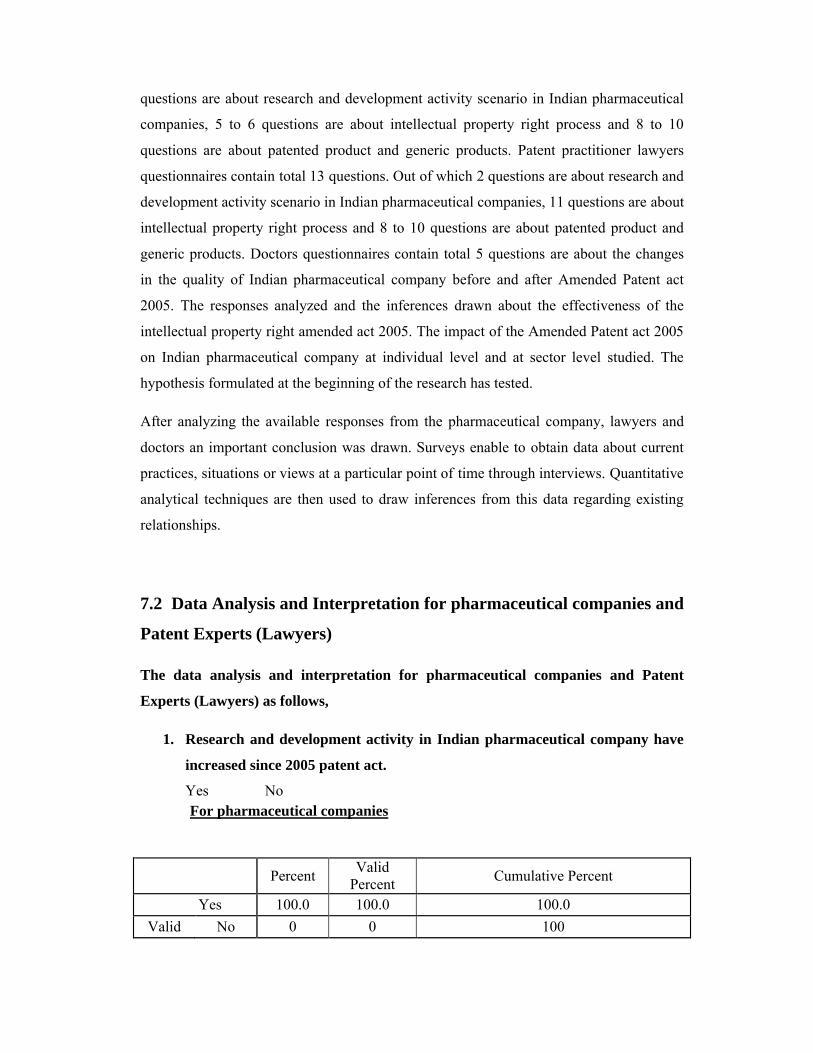
3. Research and development activity plays major role in survival of pharmaceutical company.
Yes No
For pharmaceutical companies
40%
40%
20%
Percentage increase in R and D activitiesPercent
10-20%
20-30%
More than 30%
R and D activity for survival of Pharma companies
PercentValid
PercentCumulative Percent
ValidYes 96.0 96.0 96.0No 4.0 4.0 100.0
Total 100.0 100.0
96 % of the total says that Research and development activity plays major role in
survival of pharmaceutical company.
Interpretation
India is making efforts to develop modern technology in the pharmaceutical industry.
The key task is to promote R&D that is on par with the technology in other advanced
countries. After 2005, the globally harmonized patent system would prohibit the
production and marketing of patent-protected new drugs. Indian officials want to ensure
that Indian people do not suffer in terms of high costs of medicines after 2005. Also
Increase R and D will help to survive and improve Economic status of Indian
pharmaceutical companies in global market.
4. Generally ……. % of total turnover share for research and development activity.
I. 0-2%
II. 2-4%
III. 4-6%
IV. 6-8%
V. 8-10%VI. More than 10%
For pharmaceutical companies
96%
4%
R and D activity for survival of Pharma companies Percent
Yes
No

40 % of the total says that 4
the total says that 0-2 % is the total turnover share for R & D activity.
Interpretation
Unavailability of R & D is not a problem faced by pharmaceutical companies while
registering IPR. Pharmaceutical companies have their
budget.
Expenditure on R&D is likely to increase due to the introduction of product patents,
companies need to develop new drugs to boost sales.
The above results show that R&D activity of Pharmaceutical industry has improved
the Post-TRIPS period.
5. What are the different strategies you are using for research and development department?
I. Own department is working actively
II. Collaboration with other pharmaceuticalgovernment, NGO, WHO , Educational institutes
III. OutsourcingIV. Risk sharing partnership
40
Percentage of total turnover share for R and D activity
Percentage of total turnover
Percent
Valid
0-2 % 12.02-4% 32.04-6% 40.06-8% 16.0Total 100.0
40 % of the total says that 4-6 % is the total turnover share for R & D activity. 12 % of
2 % is the total turnover share for R & D activity.
Unavailability of R & D is not a problem faced by pharmaceutical companies while
registering IPR. Pharmaceutical companies have their share for R and D activity in the
Expenditure on R&D is likely to increase due to the introduction of product patents,
companies need to develop new drugs to boost sales.
The above results show that R&D activity of Pharmaceutical industry has improved
What are the different strategies you are using for research and development department?
Own department is working actively Collaboration with other pharmaceutical company, government, NGO, WHO
tional institutes
Risk sharing partnership
V. Agreement with foreign companies.
VI. Hived off of R and D activity into different entities.
VII. merger of R and D unitsVIII. Attract investment
IX. Any other suggestion
12
3240
16
Percentage of total turnover share for R and D activity
0-2%
2-4%
4-6%
6-8%
Percentage of total turnover share for R and D activityValid
PercentCumulative Percent
12.0 12.032.0 44.040.0 84.016.0 100.0
100.0
for R & D activity. 12 % of
Unavailability of R & D is not a problem faced by pharmaceutical companies while
for R and D activity in the
Expenditure on R&D is likely to increase due to the introduction of product patents,
The above results show that R&D activity of Pharmaceutical industry has improved in
What are the different strategies you are using for research and development department?
Agreement with foreign companies.Hived off of R and D activity into different entities.merger of R and D unitsAttract investmentAny other suggestion

For pharmaceutical companies
Strategies used for R & D- Own department working actively
PercentValid
PercentCumulative Percent
ValidYes 60.0 60.0 60.0No 40.0 40.0 100.0
Total 100.0 100.0
Strategies used for R & D - Collaboration
PercentValid
PercentCumulative Percent
ValidYes 48.0 48.0 48.0No 52.0 52.0 100.0
Total 100.0 100.0
Strategies used for R & D – Outsourcing
PercentValid
PercentCumulative Percent
ValidYes 16.0 16.0 16.0No 84.0 84.0 100.0
Total 100.0 100.0
Strategies used for R & D - Risk sharing partnership
PercentValid
PercentCumulative Percent
ValidYes 16.0 16.0 16.0No 84.0 84.0 100.0
Total 100.0 100.0
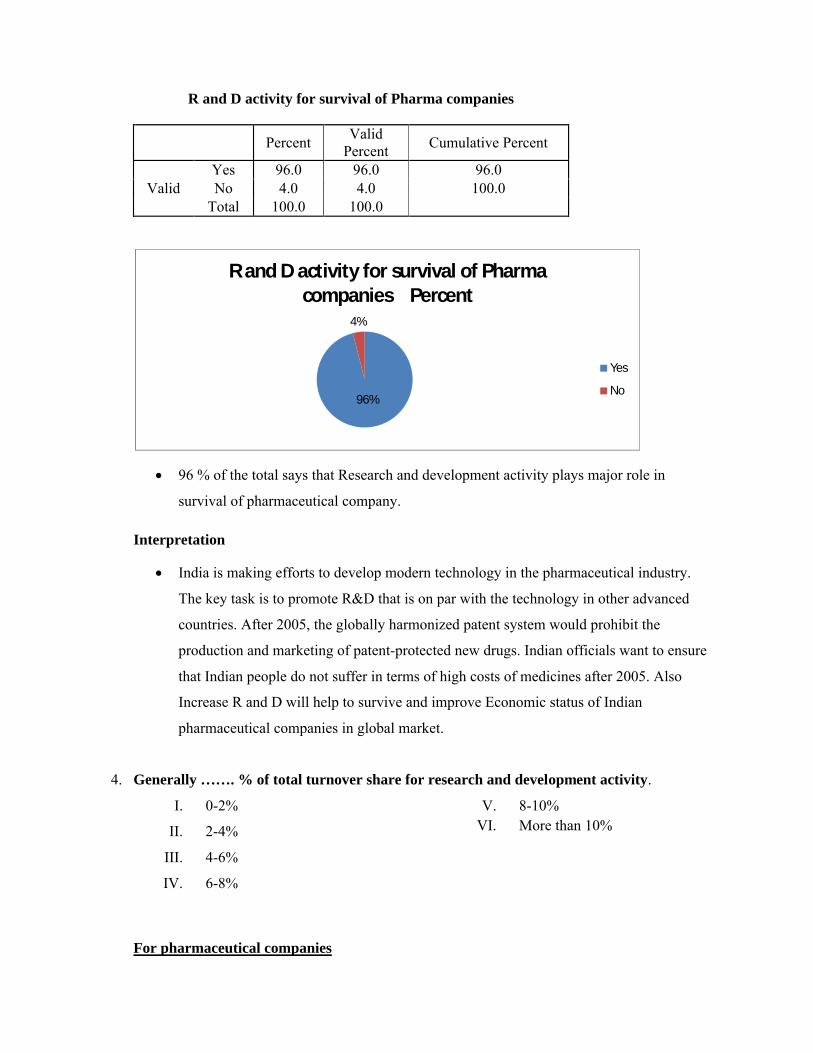
Strategies used for R & D - Agreement with foreign companies
PercentValid
PercentCumulative Percent
ValidYes 24.0 24.0 24.0No 76.0 76.0 100.0
Total 100.0 100.0
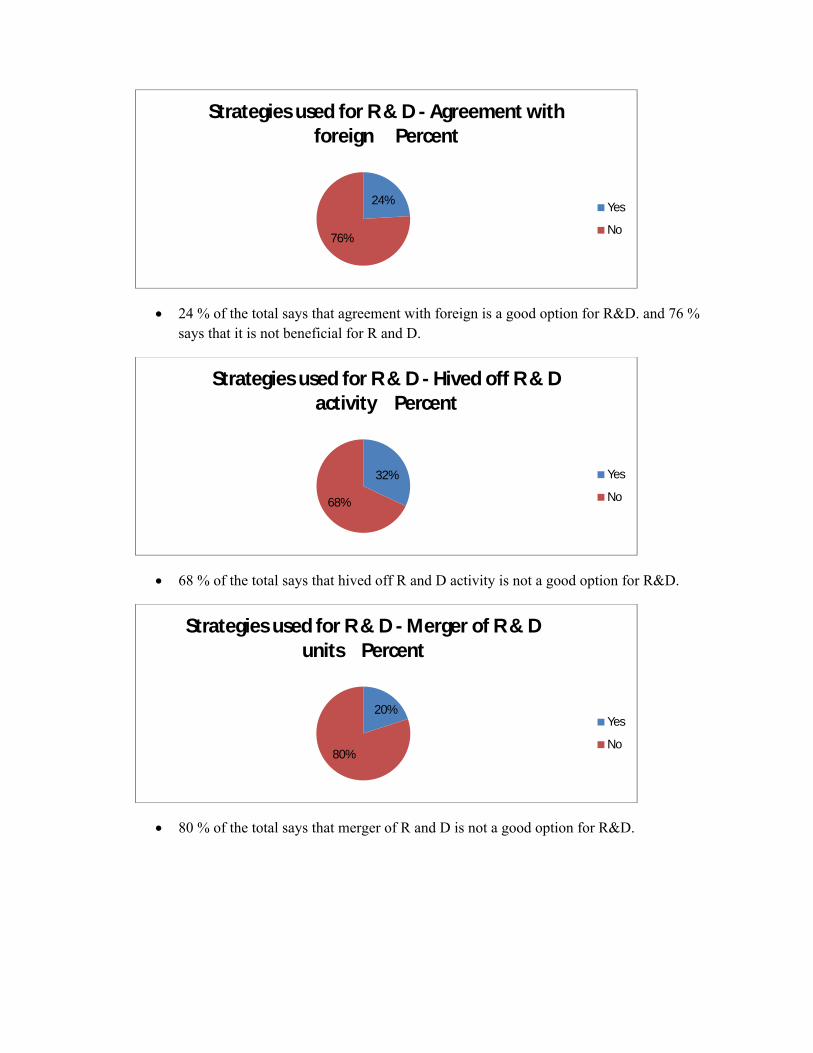
Strategies used for R & D - Hived off R & D activity
Percent Valid Cumulative Percent

Percent
ValidYes 32.0 32.0 32.0No 68.0 68.0 100.0
Total 100.0 100.0
Strategies used for R & D - Merger of R & D units
PercentValid
PercentCumulative Percent
ValidYes 20.0 20.0 20.0No 80.0 80.0 100.0
Total 100.0 100.0
Strategies used for R & D - Attract investment
PercentValid
PercentCumulative Percent
ValidYes 16.0 16.0 16.0No 84.0 84.0 100.0
Total 100.0 100.0
Strategies used for R & D - Any other strategy
PercentValid
PercentCumulative Percent
Valid No 100.0 100.0 100.0
60% of the total says that own departments are working actively.
60%
40%
Strategies used for R & D- Own department working actively Percent
Yes
No

52 % says that collaboration with the other companies for R&D it’s not a good idea.
84 % of the total says that outsourcing is not a good option for R&D.
84 % of the total says that risk sharing partnership is not a good option for R&D.
48%52%
Strategies used for R & D - Collabotation Percent
Yes
No
16%
84%
Strategies used for R & D - Outsourcing Percent
Yes
No
16%
84%
Strategies used for R & D - Risk sharing partnership Percent
Yes
No
24 % of the total says that agreement with foreign is a good option for R&D. and 76 % says that it is not beneficial for R and D.
68 % of the total says that hived off R and D activity is not a good option for R&D.
80 % of the total says that merger of R and D is not a good option for R&D.
24%
76%
Strategies used for R & D - Agreement with foreign Percent
Yes
No
32%
68%
Strategies used for R & D - Hived off R & D activity Percent
Yes
No
20%
80%
Strategies used for R & D - Merger of R & D units Percent
Yes
No

84 % of the total says that attracting investment is not a good option for R&D.
Interpretation
The current environment is challenging, but at the same time it throws up several new
opportunities for Indian pharmaceutical companies. What worked in the past may not
necessarily hold them in good balance in the future. Companies which take advantage of
the fundamental changes the industry is going through and re-jig their strategies
accordingly will be able to successfully navigate the future.
6. If outsourced, to whom I. Small scale
II. Medium scaleIII. Large scale
For pharmaceutical companies
If outsourced to whom
PercentValid
PercentCumulative Percent
Valid
Small scale 4.0 4.0 4.0
Medium scale
16.0 16.0 20.0
Large scale 8.0 8.0 28.0
Not applicable
72.0 72.0 100.0
Total 100.0 100.0
16%
84%
Strategies used for R & D - Attract investment Percent
Yes
No
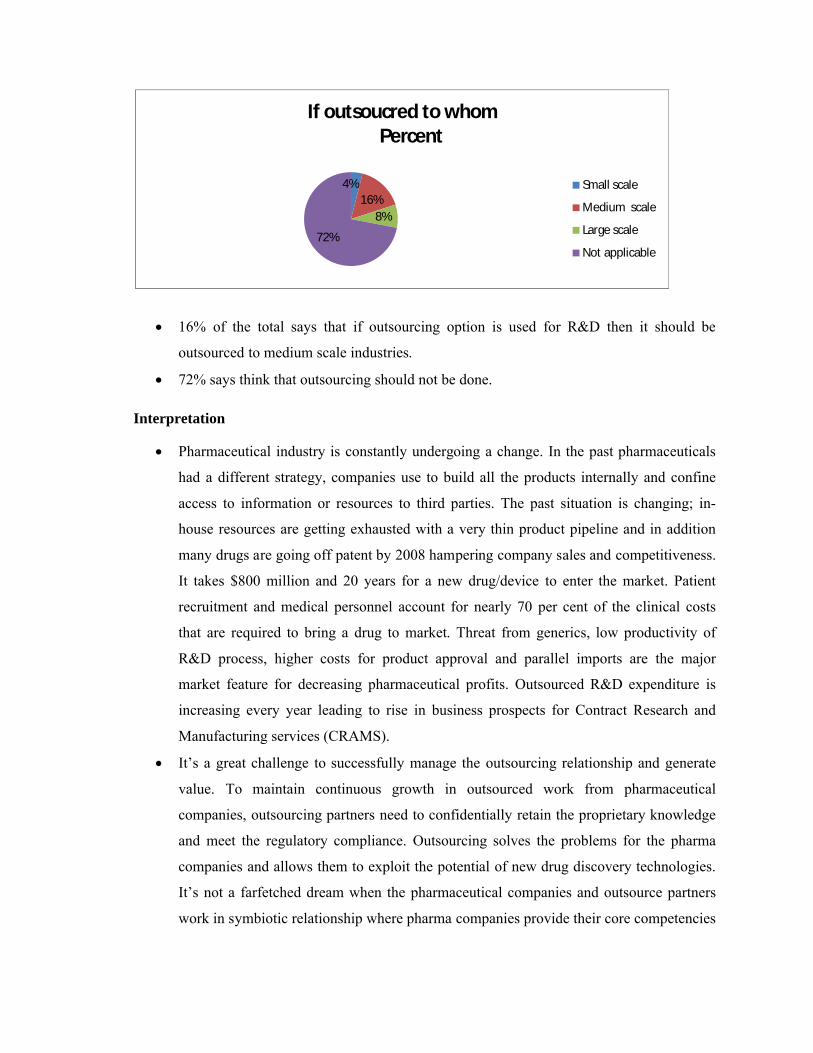
16% of the total says that if outsourcing option is used for R&D then it should be
outsourced to medium scale industries.
72% says think that outsourcing should not be done.
Interpretation
Pharmaceutical industry is constantly undergoing a change. In the past pharmaceuticals
had a different strategy, companies use to build all the products internally and confine
access to information or resources to third parties. The past situation is changing; in-
house resources are getting exhausted with a very thin product pipeline and in addition
many drugs are going off patent by 2008 hampering company sales and competitiveness.
It takes $800 million and 20 years for a new drug/device to enter the market. Patient
recruitment and medical personnel account for nearly 70 per cent of the clinical costs
that are required to bring a drug to market. Threat from generics, low productivity of
R&D process, higher costs for product approval and parallel imports are the major
market feature for decreasing pharmaceutical profits. Outsourced R&D expenditure is
increasing every year leading to rise in business prospects for Contract Research and
Manufacturing services (CRAMS).
It’s a great challenge to successfully manage the outsourcing relationship and generate
value. To maintain continuous growth in outsourced work from pharmaceutical
companies, outsourcing partners need to confidentially retain the proprietary knowledge
and meet the regulatory compliance. Outsourcing solves the problems for the pharma
companies and allows them to exploit the potential of new drug discovery technologies.
It’s not a farfetched dream when the pharmaceutical companies and outsource partners
work in symbiotic relationship where pharma companies provide their core competencies
4%16%
8%
72%
If outsoucred to whomPercent
Small scale
Medium scale
Large scale
Not applicable

in marketing and commercialization and outsource partners supply new innovative
products.
1. Indian intellectual property ri Yes No
For pharmaceutical companies
IPR system useful to IPC
Percent
ValidYes 96.0No 4.0
Total 100.0
96 % of the total says that IPR system is useful to IPC.
For IPR legal practitioners
IPR system useful to IPC
FrequencyValid Yes 5
IPR Systen useful to IPC
in marketing and commercialization and outsource partners supply new innovative
IPR information
Indian intellectual property rights system is useful to Indian pharmaceutical company.
For pharmaceutical companies
IPR system useful to IPC
Valid Percent
Cumulative Percent
96.0 96.04.0 100.0
100.0
96 % of the total says that IPR system is useful to IPC.
IPR system useful to IPC
Frequency PercentValid
PercentCumulative
Percent5 100.0 100.0 100.0
96%
4%
IPR Systen useful to IPC
in marketing and commercialization and outsource partners supply new innovative
ghts system is useful to Indian pharmaceutical company.
Yes
No

100 % of the total says that IPR system is useful to IPC.
Interpretation
Indian pharmaceutical company has taken a quantum leap thanks to The Patents Act,
2005 (Amendment to The Patents Act, 1970). Indian companies had the freedom to copy
drugs manufactured by patent holding companies without paying any kind of royalty.
They were protected by the patent act to legally reverse-engineer internationally patented
drugs and sell it within India and also in those markets that did not conform to drug
patents.
2. IPR system has helped in growth of pharma companies. Yes No
For pharmaceutical companies
IPR system helped in growth of Pharma companies
PercentValid
PercentCumulative Percent
ValidYes 96.0 96.0 96.0No 4.0 4.0 100.0
Total 100.0 100.0
100%
0%
Yes
No

96 % of the total says that IPR system helped in growth of pharma companies.
For IPR legal practitioners
IPR system helped in growth of Pharma companies
Frequency PercentValid
PercentCumulative
PercentValid Yes 5 100.0 100.0 100.0
100 % of the total says that IPR system helped in growth of pharma companies.
Interpretation
The number of patent applications filed in the Indian Patent Office has risen
approximately 420 per cent in 2006 from 1995.
Indian companies are also continuously increasing their investment in R&D and not
limiting themselves to only manufacturing drugs. They are spending around 5 to 10
percent of their turnover on R&D earlier these companies did not spend more than 1
percent on R&D.
96%
4%
IPR system helped in growth of Pharma companies Percent
Yes
No
100%
0%
Yes
No

3. Indian intellectual property right system is user friendly.
Yes No
For pharmaceutical companies
Indian IPR system is user friendly
PercentValid
PercentCumulative Percent
ValidYes 96.0 96.0 96.0No 4.0 4.0 100.0
Total 100.0 100.0
96 % of the total says that IPR system is user friendly. Still there are some loopholes in it.
For IPR legal practitioners
Indian IPR system is user friendly
Frequency PercentValid
PercentCumulative
PercentValid Yes 4 80.0 80.0 80.0
No 1 20.0 20.0 100.0Total 5 100.0 100.0
96%
4%
Indian IPR system is user friendlyPercent
Yes
No

80 % of the total says that IPR system is user friendly. Still there are some loopholes in it.
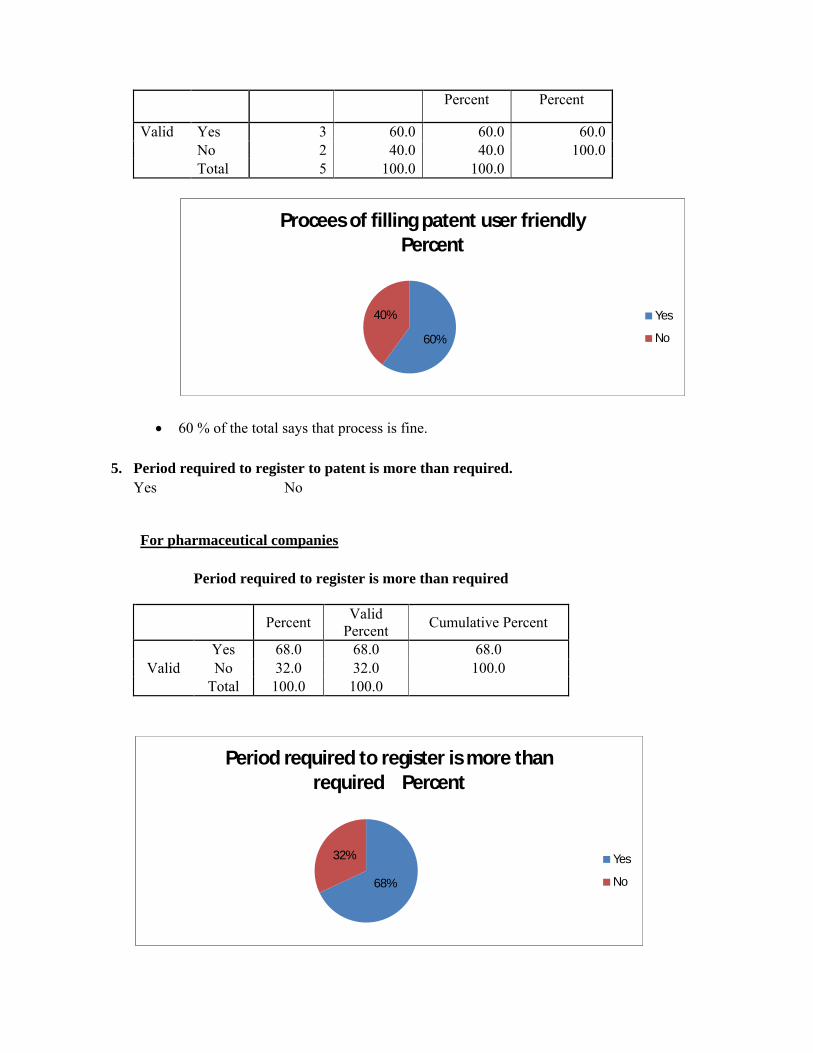
4. Process of filling patent is user friendly.
Yes No
For pharmaceutical companies
Process of filling patent user friendly
PercentValid
PercentCumulative Percent
ValidYes 96.0 96.0 96.0No 4.0 4.0 100.0
Total 100.0 100.0
96 % of the total says that process is fine.
For IPR legal practitioners
Process of filling patent user friendly
Frequency Percent Valid Cumulative
80%
20%
Indian IPR system is user friendlyPercent
Yes
No
96%
4%
Procees of filling patent user friendlyPercent
Yes
No
Percent Percent
Valid Yes 3 60.0 60.0 60.0No 2 40.0 40.0 100.0Total 5 100.0 100.0
60 % of the total says that process is fine.
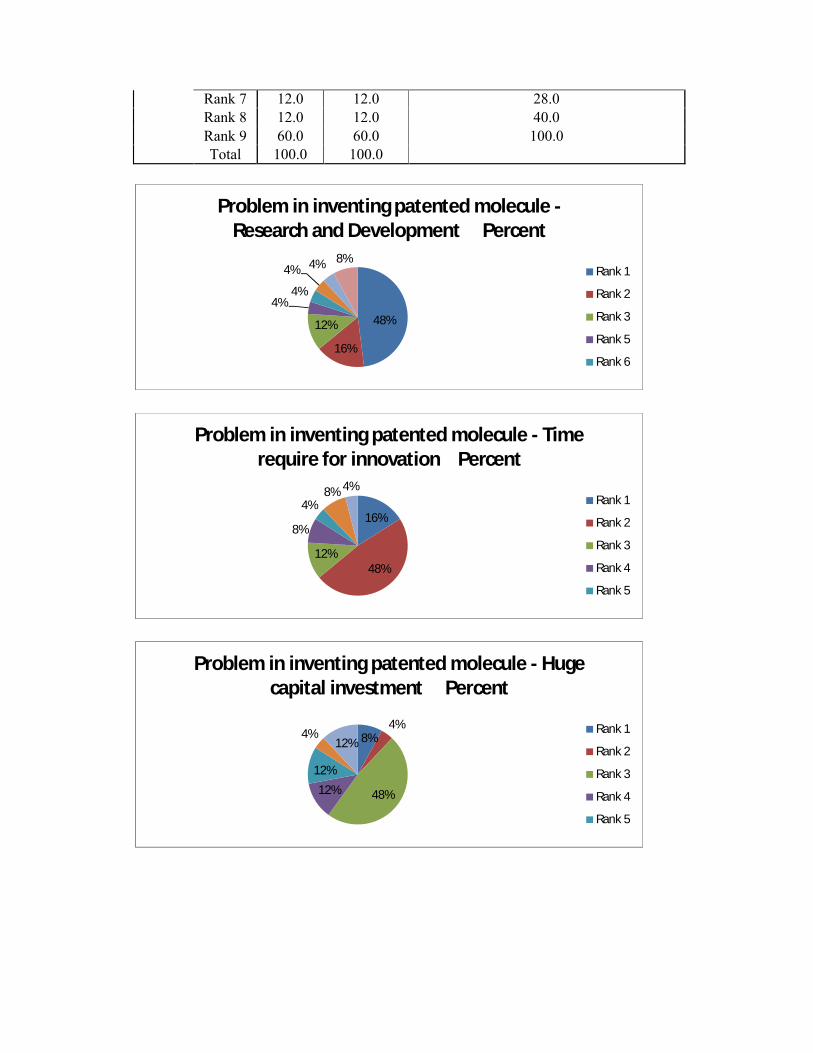
5. Period required to register to patent is more than required.Yes No
For pharmaceutical companies
Period required to register is more than required
PercentValid
PercentCumulative Percent
ValidYes 68.0 68.0 68.0No 32.0 32.0 100.0
Total 100.0 100.0
60%
40%
Procees of filling patent user friendlyPercent
Yes
No
68%
32%
Period required to register is more than required Percent
Yes
No

68 % of the total says that period required to register is more than required.
For IPR legal practitioners
Period required to register is more than required
Frequency PercentValid
PercentCumulative
PercentValid Yes 2 40.0 40.0 40.0
No 3 60.0 60.0 100.0Total 5 100.0 100.0
40 % of the total says that period required to register is more than required.
Interpretation
IPR system has helped in growth of pharma companies.
IPR system is useful due to its user friendliness,
The reduction in Period required to register patent will be of great use.
The lengthy time period between patent filing and placing a product on the market means
that pharmaceutical manufacturers receive far shorter periods of patent exclusivity than
is the case for other patent dependent industries.
6. Problems faced by pharmaceutical companies while registering IPR.
a. Documentation
b. Financial support for innovation
c. Technology
d. Unavailability of R and D center
For pharmaceutical companies
40%
60%
Period required to register is more than required Percent
Yes
No
Problem faced while registration – documentation
PercentValid
PercentCumulative Percent
ValidYes 60.0 60.0 60.0No 40.0 40.0 100.0

60 % of the total says that documentation is a problem while registering IPR.
60%40%
Problem faced while registration -documentation Percent
Yes
No
Total 100.0 100.0
Problem faced while registration - Financial support
PercentValid
PercentCumulative Percent
ValidYes 52.0 52.0 52.0No 48.0 48.0 100.0
Total 100.0 100.0
Problem faced while registration – Technology
PercentValid
PercentCumulative Percent
ValidYes 52.0 52.0 52.0No 48.0 48.0 100.0
Total 100.0 100.0
Problem faced while registration - Unavailability of R & D center
PercentValid
PercentCumulative Percent
ValidYes 24.0 24.0 24.0No 76.0 76.0 100.0
Total 100.0 100.0

52 % of the total says that financial support is a problem while registering IPR.
52 % of the total says that technology is a problem while registering IPR.
24 % of the total says that unavailability of R and D is a problem while registering IPR.
For IPR legal practitioners
Problem faced while registration – documentation
52%48%
Problem faced while registration - Financial support Percent
Yes
No
52%48%
Problem faced while registration - Technology Percent
Yes
No
24%
76%
Problem faced while registration -Unavailability of R & D Percent
Yes
No

Frequency PercentValid
PercentCumulative
PercentValid No 1 20.0 20.0 20.0
Yes 4 80.0 80.0 100.0Total 5 100.0 100.0
Problem faced while registration - Financial support
Frequency Percent Valid PercentCumulative
PercentValid 1 20.0 20.0 20.0
Yes 3 60.0 60.0 80.0No 1 20.0 20.0 100.0Total 5 100.0 100.0
Problem faced while registration - Technology
Frequency Percent Valid PercentCumulative
PercentValid 0 1 20.0 20.0 20.0
Yes 2 40.0 40.0 60.0No 2 40.0 40.0 100.0Total 5 100.0 100.0
Problem faced while registration - Unavailability of R & D center
Frequency Percent Valid PercentCumulative
PercentValid No 2 40.0 40.0 40.0
Yes 3 60.0 60.0 100.0Total 5 100.0 100.0
80 % of the total says that documentation is a problem while registering IPR.
20%
80%
Problem faced while registration -documentation Percent
0
Yes

60% of the total says that financial support is a problem while registering IPR.
60 % of the total says that technology is a problem while registering IPR.
24% of the total says that unavailability of R and D is a problem while registering IPR.
Interpretation
Documentation, Financial Support & Technology these are the major problem areas
faced by pharmaceutical companies while registering IPR.
40%
60%
Problem faced while registration - Financial support Percent
No
Yes
40%
60%
Problem faced while registration - Technology Percent
No
Yes
24%
76%
Problem faced while registration - Unavailability of R & D Percent
Yes
No

Despite the increasing expenditure on R&D, the introduction of new molecules by Indian
players has been limited. It is, in fact, a hit-and-miss situation in the field of discovery
and developments of new chemical entity (NCEs), where misses are more than hits. Very
few discoveries reach the final stages of approvals, and in most of the cases, the claim
for patent gets stuck in legal battles.
Indian pharma companies need to accelerate the transition from reverse engineering of
generic drugs to development of new molecules. The Indian industry needs to develop
and improve capabilities in new drugs and delivery mechanisms. Several companies are
developing their capability in NCEs but the inflexion point for the domestic industry will
be the launch of its own patented drugs. Domestic companies should continue their focus
on innovation to develop New Chemical Entities/New Molecular Entities (NCEs/NMEs)
which will offer sustainable revenues going forward. Increasing collaboration with
global pharma companies’ help in sharing costs and risks, while ensuring better results.
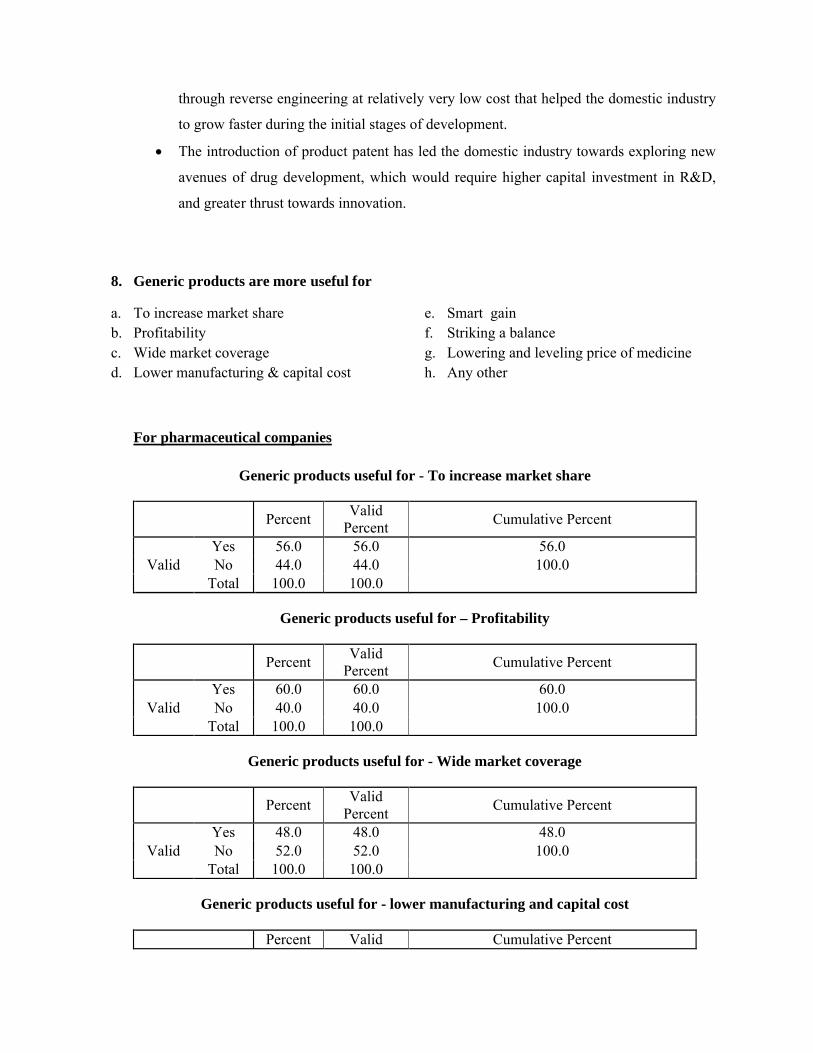
7. Rank the following problem in ascending order in inventing patented molecule drug
I. Research and Development facility
II. More time require for innovation
III. Huge capital investmentIV. Lack of Human resource
V. Insufficient venture capital funding
VI. Paucity of trained personVII. different private equity
marketVIII. Early stage funding.
IX. Any other
For pharmaceutical companies
Problem in inventing patented molecule - Research and development facility
PercentValid
PercentCumulative Percent
Valid
Rank 1 48.0 48.0 48.0Rank 2 16.0 16.0 64.0Rank 3 12.0 12.0 76.0Rank 5 4.0 4.0 80.0Rank 6 4.0 4.0 84.0Rank 7 4.0 4.0 88.0Rank 8 4.0 4.0 92.0Rank 9 8.0 8.0 100.0Total 100.0 100.0

Problem in inventing patented molecule - Time require for innovation
PercentValid
PercentCumulative Percent
Valid
Rank 1 16.0 16.0 16.0Rank 2 48.0 48.0 64.0Rank 3 12.0 12.0 76.0Rank 4 8.0 8.0 84.0Rank 5 4.0 4.0 88.0Rank 7 8.0 8.0 96.0Rank 8 4.0 4.0 100.0Total 100.0 100.0
Problem in inventing patented molecule - Huge capital investment
PercentValid
PercentCumulative Percent
Valid
Rank 1 8.0 8.0 8.0Rank 2 4.0 4.0 12.0Rank 3 48.0 48.0 60.0Rank 4 12.0 12.0 72.0Rank 5 12.0 12.0 84.0Rank 6 4.0 4.0 88.0Rank 8 12.0 12.0 100.0Total 100.0 100.0
Problem in inventing patented molecule - Lack of human resource
PercentValid
PercentCumulative Percent
Valid
Rank 2 4.0 4.0 4.0Rank 3 8.0 8.0 12.0Rank 4 44.0 44.0 56.0Rank 5 16.0 16.0 72.0Rank 6 20.0 20.0 92.0Rank 9 8.0 8.0 100.0Total 100.0 100.0
Problem in inventing patented molecule - Insufficient venture capital funding
PercentValid
PercentCumulative Percent
Valid
Rank 1 8.0 8.0 8.0Rank 2 16.0 16.0 24.0Rank 3 8.0 8.0 32.0Rank 4 12.0 12.0 44.0Rank 5 40.0 40.0 84.0Rank 7 4.0 4.0 88.0

Rank 8 8.0 8.0 96.0Rank 9 4.0 4.0 100.0Total 100.0 100.0
Problem in inventing patented molecule - Paucity of trained person
PercentValid
PercentCumulative Percent
Valid
Rank 2 8.0 8.0 8.0Rank 4 4.0 4.0 12.0Rank 5 8.0 8.0 20.0Rank 6 48.0 48.0 68.0Rank 7 20.0 20.0 88.0Rank 8 12.0 12.0 100.0Total 100.0 100.0
Problem in inventing patented molecule - Different private equity market
PercentValid
PercentCumulative Percent
Valid
Rank 1 12.0 12.0 12.0Rank 4 12.0 12.0 24.0Rank 5 12.0 12.0 36.0Rank 7 36.0 36.0 72.0Rank 8 16.0 16.0 88.0Rank 9 12.0 12.0 100.0Total 100.0 100.0
Problem in inventing patented molecule - Unavailability of early stage funding
PercentValid
PercentCumulative Percent
Valid
Rank 1 8.0 8.0 8.0Rank 2 4.0 4.0 12.0Rank 3 4.0 4.0 16.0Rank 5 4.0 4.0 20.0Rank 6 24.0 24.0 44.0Rank 7 16.0 16.0 60.0Rank 8 32.0 32.0 92.0Rank 9 8.0 8.0 100.0Total 100.0 100.0
Problem in inventing patented molecule - Any other
PercentValid
PercentCumulative Percent
ValidRank 3 8.0 8.0 8.0Rank 4 8.0 8.0 16.0
Rank 7 12.0 12.0 28.0Rank 8 12.0 12.0 40.0Rank 9 60.0 60.0 100.0Total 100.0 100.0
48%
16%
12%
4%4%
4% 4% 8%
Problem in inventing patented molecule -Research and Development Percent
Rank 1
Rank 2
Rank 3
Rank 5
Rank 6
16%
48%12%
8%
4%8% 4%
Problem in inventing patented molecule - Time require for innovation Percent
Rank 1
Rank 2
Rank 3
Rank 4
Rank 5
8%4%
48%12%
12%
4%12%
Problem in inventing patented molecule - Huge capital investment Percent
Rank 1
Rank 2
Rank 3
Rank 4
Rank 5

4%8%
44%16%
20%
8%
Problem in inventing patented molecule - Lack of human reosurce Percent
Rank 2
Rank 3
Rank 4
Rank 5
Rank 6
8%
16%
8%
12%40%
4%8%
4%
Problem in inventing patented molecule -Insufficient venture capital funding Percent
Rank 1
Rank 2
Rank 3
Rank 4
Rank 5
8%4%
8%
48%
20%
12%
Problem in inventing patented molecule -Paucity of trained person Percent
Rank 2
Rank 4
Rank 5
Rank 6
Rank 7

For IPR legal practitioners
Problem in inventing patented molecule - Research and development facility
Frequency Percent
Valid Percent Cumulative Percent
Valid Rank 2 1 20.0 20.0 20.0Rank 3 1 20.0 20.0 40.0Rank 4 1 20.0 20.0 60.0Rank 7 1 20.0 20.0 80.0
12%
12%12%
36%
16%
12%
Problem in inventing patented molecule -Different private equity market Percent
Rank 1
Rank 4
Rank 5
Rank 7
Rank 8
8%
4%4%
4%
24%
16%
32%
8%
Problem in inventing patented molecule -Unavailability of early stage funding Percent
Rank 1
Rank 2
Rank 3
Rank 5
Rank 6
8%8%
12%
12%60%
Problem in inventing patented molecule - Any other Percent
Rank 3
Rank 4
Rank 7
Rank 8
Rank 9

Rank 8 1 20.0 20.0 100.0Total 5 100.0 100.0
Problem in inventing patented molecule - Time require for innovation
Frequency Percent
Valid Percent Cumulative Percent
Valid Rank 1 2 40.0 40.0 40.0Rank 6 2 40.0 40.0 80.0Rank 7 1 20.0 20.0 100.0Total 5 100.0 100.0
Problem in inventing patented molecule - Huge capital investment
Frequency Percent
Valid Percent Cumulative Percent
Valid Rank 1 1 20.0 20.0 20.0Rank 2 1 20.0 20.0 40.0Rank 3 1 20.0 20.0 60.0Rank 5 1 20.0 20.0 80.0Rank 7 1 20.0 20.0 100.0Total 5 100.0 100.0
Problem in inventing patented molecule - Lack of human resource
Frequency Percent
Valid Percent Cumulative Percent
Valid Rank 2 1 20.0 20.0 20.0Rank 3 1 20.0 20.0 40.0Rank 4 1 20.0 20.0 60.0Rank 6 1 20.0 20.0 80.0Rank 7 1 20.0 20.0 100.0Total 5 100.0 100.0
Problem in inventing patented molecule - Insufficient venture capital funding
Frequency PercentValid
Percent Cumulative PercentValid Rank 1 1 20.0 20.0 20.0
Rank 2 1 20.0 20.0 40.0Rank 3 1 20.0 20.0 60.0Rank 5 1 20.0 20.0 80.0Rank 8 1 20.0 20.0 100.0Total 5 100.0 100.0
Problem in inventing patented molecule - Paucity of trained person

Frequency PercentValid
Percent Cumulative PercentValid Rank 3 1 20.0 20.0 20.0
Rank 4 2 40.0 40.0 60.0Rank 5 1 20.0 20.0 80.0Rank 6 1 20.0 20.0 100.0Total 5 100.0 100.0
Problem in inventing patented molecule - Different private equity market
Frequency PercentValid
Percent Cumulative PercentValid Rank 6 1 20.0 20.0 20.0
Rank 7 2 40.0 40.0 60.0Rank 8 2 40.0 40.0 100.0Total 5 100.0 100.0
Problem in inventing patented molecule - Unavailability of early stage funding
Frequency PercentValid
Percent Cumulative PercentValid Rank 1 1 20.0 20.0 20.0
Rank 4 1 20.0 20.0 40.0Rank 5 2 40.0 40.0 80.0Rank 8 1 20.0 20.0 100.0Total 5 100.0 100.0
Problem in inventing patented molecule - Any otherFrequenc
y PercentValid
Percent Cumulative PercentValid Rank 9 5 100.0 100.0 100.0
20%
20%
20%
20%
20%
Problem in inventing patented molecule -Research and development facility Percent
Rank 2
Rank 3
Rank 4
Rank 7
Rank 8

40%
40%
20%
Problem in inventing patented molecule - Time require for innovation Percent
Rank 1
Rank 6
Rank 7
20%
20%
20%
20%
20%
Problem in inventing patented molecule - Huge capital investment Percent
Rank 1
Rank 2
Rank 3
Rank 5
Rank 7
40%
40%
20%
Problem in inventing patented molecule - Lack of human resource Percent
Rank 1
Rank 6
Rank 7
20%
20%
20%
20%
20%
Problem in inventing patented molecule -Insufficient venture capital funding Percent
Rank 1
Rank 2
Rank 3
Rank 5
Rank 8

Interpretation
Research and Development facility, more time require for innovation,
Huge capital investment is the top 3 Problem in inventing patented molecule.
The original Indian patent law, which recognized only process patent, gave Indian
companies the opportunity to produce products under patent in overseas markets,
particularly regulated markets, by adopting new processes. But companies are facing
problems in it. Consequently, companies were in advantageous position to produce drugs
20%
40%20%
20%
Problem in inventing patented molecule -Paucity of trained person Percent
Rank 3
Rank 4
Rank 5
Rank 6
20%
40%
40%
Problem in inventing patented molecule -Different private equity market Percent
Rank 6
Rank 7
Rank 8
20%
20%40%
20%
Problem in inventing patented molecule -Unavailability of early stage Percent
Rank 1
Rank 4
Rank 5
Rank 8
through reverse engineering at relatively very low cost that helped the domestic industry
to grow faster during the initial stages of development.
The introduction of product patent has led the domestic industry towards exploring new
avenues of drug development, which would require higher capital investment in R&D,
and greater thrust towards innovation.
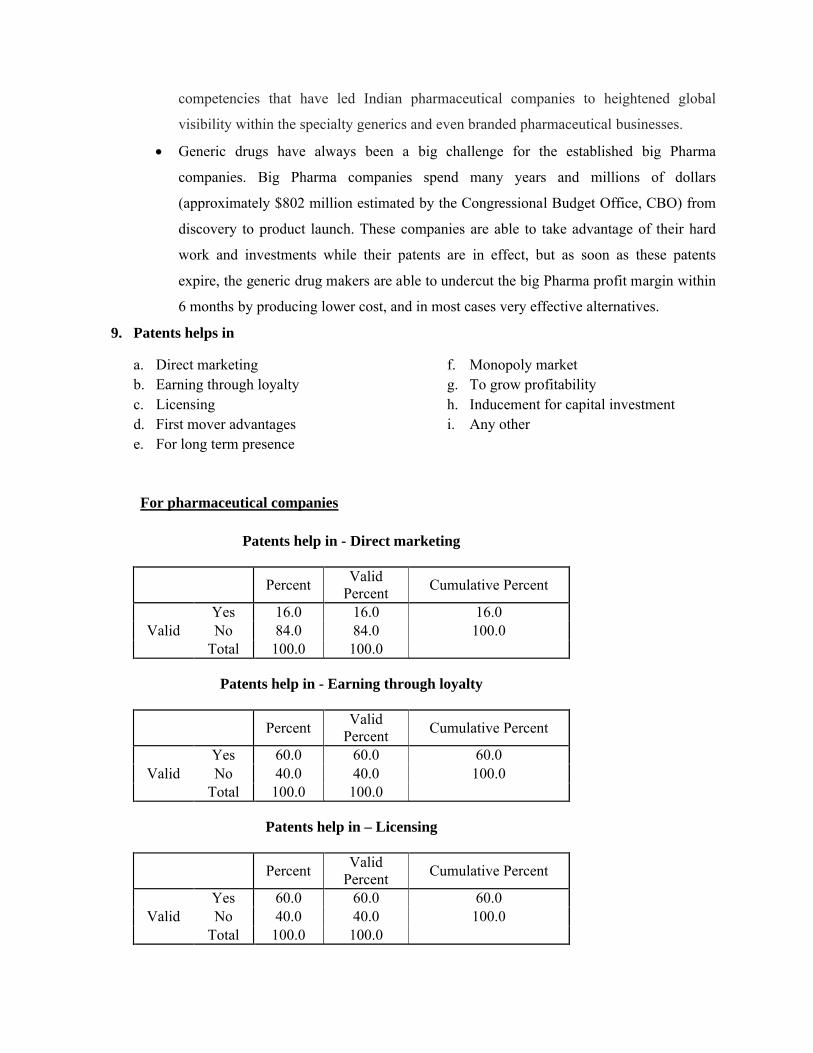
8. Generic products are more useful for
a. To increase market shareb. Profitabilityc. Wide market coveraged. Lower manufacturing & capital cost
e. Smart gainf. Striking a balanceg. Lowering and leveling price of medicineh. Any other
For pharmaceutical companies
Generic products useful for - To increase market share
PercentValid
PercentCumulative Percent
ValidYes 56.0 56.0 56.0No 44.0 44.0 100.0
Total 100.0 100.0
Generic products useful for – Profitability
PercentValid
PercentCumulative Percent
ValidYes 60.0 60.0 60.0No 40.0 40.0 100.0
Total 100.0 100.0
Generic products useful for - Wide market coverage
PercentValid
PercentCumulative Percent
ValidYes 48.0 48.0 48.0No 52.0 52.0 100.0
Total 100.0 100.0
Generic products useful for - lower manufacturing and capital cost
Percent Valid Cumulative Percent

Percent
ValidYes 52.0 52.0 52.0No 48.0 48.0 100.0
Total 100.0 100.0
Generic products useful for - Smart gain
PercentValid
PercentCumulative Percent
ValidYes 20.0 20.0 20.0No 80.0 80.0 100.0
Total 100.0 100.0
Generic products useful for - Striking a balance
PercentValid
PercentCumulative Percent
ValidYes 32.0 32.0 32.0No 68.0 68.0 100.0
Total 100.0 100.0
Generic products useful for - Lowering & leveling price of medicine
PercentValid
PercentCumulative Percent
ValidYes 28.0 28.0 28.0No 72.0 72.0 100.0
Total 100.0 100.0
Generic products useful for - Any other
PercentValid
PercentCumulative Percent
ValidYes 4.0 4.0 4.0No 96.0 96.0 100.0
Total 100.0 100.0

56% of the total says that generic products are useful to increase market share.
60% of the total says that generic products are useful for profitability.
48% of the total says that generic products are useful for wide market coverage.
56%44%
Generic producsts useful for - To increase market share Percent
Yes
No
60%
40%
Generic producsts useful for - Profitability Percent
Yes
No
48%52%
Generic producsts useful for - Wide market coverage Percent
Yes
No

52% of the total says that generic products are useful for manufacturing and capital cost
Only 20% of the total says that generic products are useful for smart gain
32% of the total says that generic products are useful for striking a balance
52%48%
Generic producsts useful for - lower manufacturing and capital cost Percent
Yes
No
20%
80%
Generic producsts useful for - Smart gain Percent
Yes
No
32%
68%
Generic producsts useful for - Striking a balance Percent
Yes
No

Only 28% of the total says that generic products are useful for lowering and leveling price of medicine
Only 4% of the total says that generic products are useful for any other option.
Interpretation
Generic products are used mostly To increase market share To enhance Profitability To widen market coverage
Due to its cost advantage, India has emerged as a major producer of generic drugs with
several companies focusing on this sector.
With an expected market size of USD35 billion in 2015 vis-à-vis USD15 billion
currently, there is immense potential for growth in India’s generic market.
Due to their competence in generic drugs, growth in this market offers a great
opportunity for the Indian firms. Complex synthesis capabilities, increasingly good
manufacturing practices (GMP) and low-cost production, as detailed below, are core
28%
72%
Generic producsts useful for - Lowering & levelling price of medicine Percent
Yes
No
4%
96%
Generic producsts useful for - Any other Percent
Yes
No
competencies that have led Indian pharmaceutical companies to heightened global
visibility within the specialty generics and even branded pharmaceutical businesses.
Generic drugs have always been a big challenge for the established big Pharma
companies. Big Pharma companies spend many years and millions of dollars
(approximately $802 million estimated by the Congressional Budget Office, CBO) from
discovery to product launch. These companies are able to take advantage of their hard
work and investments while their patents are in effect, but as soon as these patents
expire, the generic drug makers are able to undercut the big Pharma profit margin within
6 months by producing lower cost, and in most cases very effective alternatives.
9. Patents helps in
a. Direct marketingb. Earning through loyaltyc. Licensingd. First mover advantagese. For long term presence
f. Monopoly marketg. To grow profitabilityh. Inducement for capital investmenti. Any other
For pharmaceutical companies
Patents help in - Direct marketing
PercentValid
PercentCumulative Percent
ValidYes 16.0 16.0 16.0No 84.0 84.0 100.0
Total 100.0 100.0
Patents help in - Earning through loyalty
PercentValid
PercentCumulative Percent
ValidYes 60.0 60.0 60.0No 40.0 40.0 100.0
Total 100.0 100.0
Patents help in – Licensing
PercentValid
PercentCumulative Percent
ValidYes 60.0 60.0 60.0No 40.0 40.0 100.0
Total 100.0 100.0

Patents help in - First mover advantages
PercentValid
PercentCumulative Percent
ValidYes 52.0 52.0 52.0No 48.0 48.0 100.0
Total 100.0 100.0
Patents help in - For long term presence
PercentValid
PercentCumulative Percent
ValidYes 28.0 28.0 28.0No 72.0 72.0 100.0
Total 100.0 100.0
Patents help in - Monopoly market
PercentValid
PercentCumulative Percent
ValidYes 20.0 20.0 20.0No 80.0 80.0 100.0
Total 100.0 100.0
Patents help in - To grow profitability
PercentValid
PercentCumulative Percent
ValidYes 60.0 60.0 60.0No 40.0 40.0 100.0
Total 100.0 100.0
Patents help in - Inducement for capital investment
PercentValid
PercentCumulative Percent
ValidYes 36.0 36.0 36.0No 64.0 64.0 100.0
Total 100.0 100.0
Patents help in - Any other
PercentValid
PercentCumulative Percent
Valid No 100.0 100.0 100.0
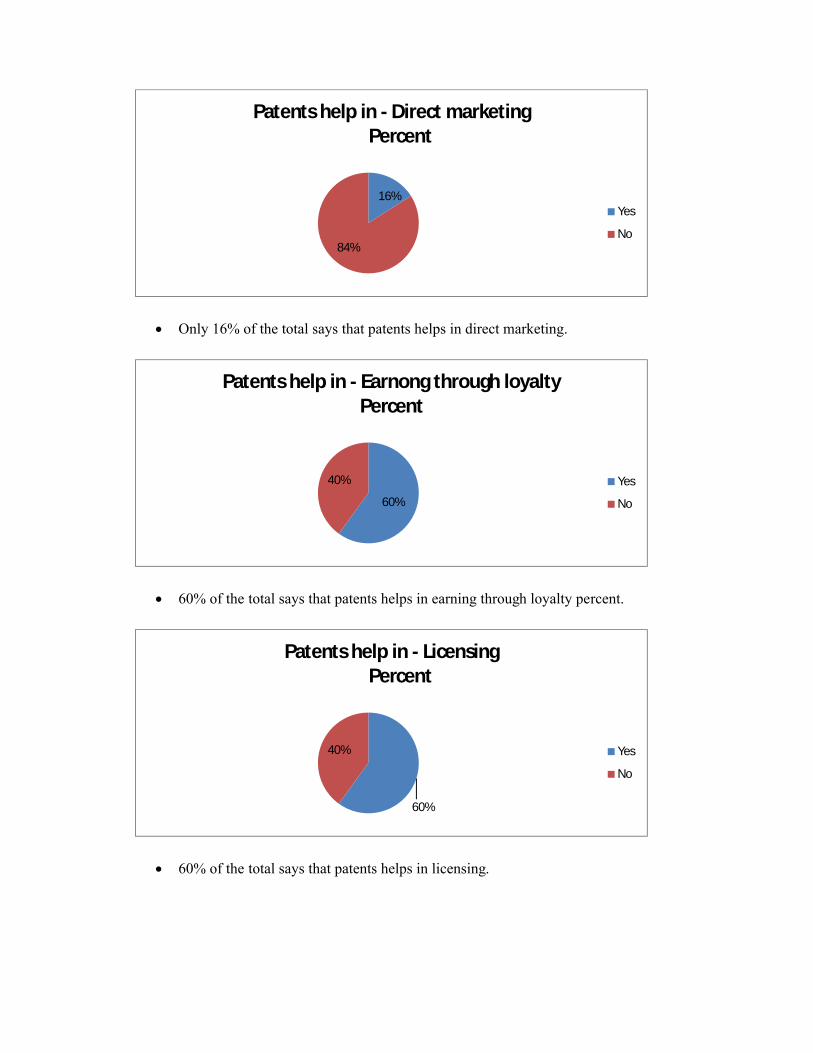
Only 16% of the total says that patents helps in direct marketing.
60% of the total says that patents helps in earning through loyalty percent.
60% of the total says that patents helps in licensing.
16%
84%
Patents help in - Direct marketingPercent
Yes
No
60%
40%
Patents help in - Earnong through loyalty Percent
Yes
No
60%
40%
Patents help in - LicensingPercent
Yes
No
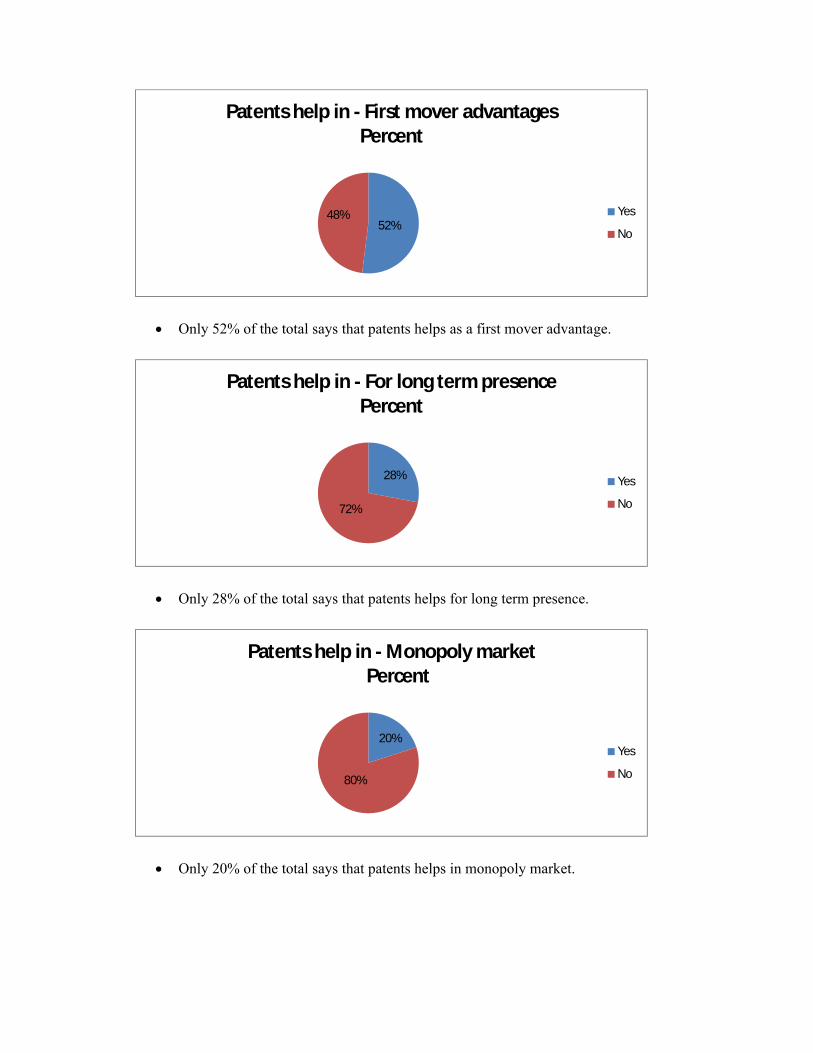
Only 52% of the total says that patents helps as a first mover advantage.
Only 28% of the total says that patents helps for long term presence.
Only 20% of the total says that patents helps in monopoly market.
52%48%
Patents help in - First mover advantages Percent
Yes
No
28%
72%
Patents help in - For long term presence Percent
Yes
No
20%
80%
Patents help in - Monopoly marketPercent
Yes
No

60% of the total says that patent helps to grow profitability.
36% of the total says that patents helps in inducement for capital investment.
Interpretation
Patents help pharma companies to earn through loyalty, Licensing and which result to grow
profitability.
Following the introduction of product patents, several multinational companies are expected
to launch patented drugs in India.
Growth in the number of lifestyle related diseases in India could boost the sale of drugs in
this segment.
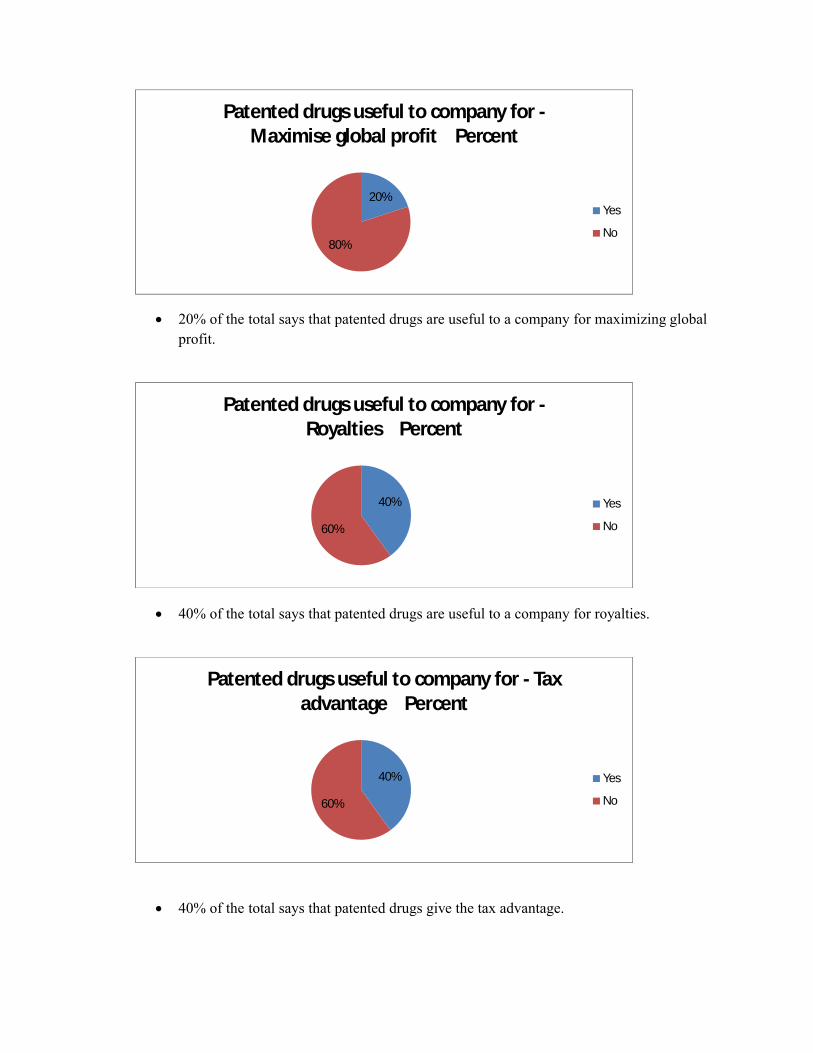
10. Patented drugs are more useful to company for
a. Brand Building b. Goodwill Generation
c. Market Penetrationd. Profitability
60%
40%
Patents help in - To grow profitabilityPercent
Yes
No
36%
64%
Patents help in - Inducement for capital investment Percent
Yes
No

e. Maximize global profitf. Royaltiesg. Justify Indian pricesh. Tax advantage
i. Sale by considering Indian population(Mass selling).
j. Any Other
For Pharmaceutical industry-
Patented drugs useful to company for - Brand building
PercentValid
PercentCumulative Percent
ValidYes 36.0 36.0 36.0No 64.0 64.0 100.0
Total 100.0 100.0
Patented drugs useful to company for - Goodwill generation
PercentValid
PercentCumulative Percent
ValidYes 32.0 32.0 32.0No 68.0 68.0 100.0
Total 100.0 100.0
Patented drugs useful to company for - Market penetration
PercentValid
PercentCumulative Percent
ValidYes 68.0 68.0 68.0No 32.0 32.0 100.0
Total 100.0 100.0
Patented drugs useful to company for – Profitability
PercentValid
PercentCumulative Percent
ValidYes 84.0 84.0 84.0No 16.0 16.0 100.0
Total 100.0 100.0
Patented drugs useful to company for - Maximize global profit
PercentValid
PercentCumulative Percent
ValidYes 48.0 48.0 48.0No 52.0 52.0 100.0
Total 100.0 100.0

Patented drugs useful to company for – Royalties
PercentValid
PercentCumulative Percent
ValidYes 28.0 28.0 28.0No 72.0 72.0 100.0
Total 100.0 100.0
Patented drugs useful to company for - Justify Indian prices
PercentValid
PercentCumulative Percent
ValidYes 20.0 20.0 20.0No 80.0 80.0 100.0
Total 100.0 100.0
Patented drugs useful to company for - Tax advantage
PercentValid
PercentCumulative Percent
ValidYes 16.0 16.0 16.0No 84.0 84.0 100.0
Total 100.0 100.0
36% of the total says that patent drugs are useful to a company for brand building.
36%
64%
Patented drugs useful to company for - Brand building Percent
Yes
No

32% of the total says that patent drugs are useful to a company for goodwill generation.
68% of the total says that patented drugs are useful to a company for market penetration.
84% of the total says that patented drugs are useful to a company for profitability.
32%
68%
Patented drugs useful to company for -Goodwill generation Percent
Yes
No
68%
32%
Patented drugs useful to company for - Market penetration Percent
Yes
No
84%
16%
Patented drugs useful to company for -Profitability Percent
Yes
No

48% of the total says that patented drugs are useful to a company for maximizing global profit.
28% of the total says that patented drugs are useful to a company for royalties.
Only 20% of the total says that patented drugs are useful to a company for justifying Indian prices.
48%52%
Patented drugs useful to company for -Maximise global profit Percent
Yes
No
28%
72%
Patented drugs useful to company for -Royalties Percent
Yes
No
20%
80%
Patented drugs useful to company for - Justify Indian prices Percent
Yes
No

Only 16% of the total says that patented drugs give the tax advantage.
Only 20% of the total says that patented drugs are useful to a company for sale by considering Indian population.
Only 4% of the total says that patented drugs are useful to a company for any other reason.
For IPR legal practitioners
Patented drugs useful to company for - Brand building
16%
84%
Patented drugs useful to company for - Tax advantage Percent
Yes
No
20%
80%
Patented drugs useful to company for - Sale by considerimg Indian population Percent
Yes
No
4%
96%
Patented drugs useful to company for - Any other Percent
1
2

Frequency Percent Valid PercentCumulative
PercentValid Yes 3 60.0 60.0 60.0
No 2 40.0 40.0 100.0Total 5 100.0 100.0
Patented drugs useful to company for - Goodwill generation
Frequency Percent Valid PercentCumulative
PercentValid Yes 3 60.0 60.0 60.0
No 2 40.0 40.0 100.0Total 5 100.0 100.0
Patented drugs useful to company for - Market penetration
Frequency Percent Valid PercentCumulative
PercentValid Yes 2 40.0 40.0 40.0
No 3 60.0 60.0 100.0Total 5 100.0 100.0
Patented drugs useful to company for – Profitability
Frequency Percent Valid PercentCumulative
PercentValid Yes 3 60.0 60.0 60.0
No 2 40.0 40.0 100.0Total 5 100.0 100.0
Patented drugs useful to company for - Maximize global profit
Frequency Percent Valid PercentCumulative
PercentValid Yes 1 20.0 20.0 20.0
No 4 80.0 80.0 100.0Total 5 100.0 100.0
Patented drugs useful to company for – Royalties
Frequency Percent Valid PercentCumulative
PercentValid Yes 2 40.0 40.0 40.0
No 3 60.0 60.0 100.0Total 5 100.0 100.0

Patented drugs useful to company for - Justify Indian prices
Frequency Percent Valid PercentCumulative
PercentValid No 5 100.0 100.0 100.0
Patented drugs useful to company for - Tax advantage
Frequency Percent Valid PercentCumulative
PercentValid Yes 2 40.0 40.0 40.0
No 3 60.0 60.0 100.0Total 5 100.0 100.0
Patented drugs useful to company for - Sale by considering Indian population
Frequency Percent Valid PercentCumulative
PercentValid Yes 1 20.0 20.0 20.0
No 4 80.0 80.0 100.0Total 5 100.0 100.0
60% of the total says that patent drugs are useful to a company for brand building.
60%
40%
Patented drugs useful to company for - Brand building Percent
Yes
No

60% of the total says that patent drugs are useful to a company for goodwill generation.
40% of the total says that patented drugs are useful to a company for market penetration.
60% of the total says that patented drugs are useful to a company for profitability.
60%
40%
Patented drugs useful to company for -Goodwill generation Percent
Yes
No
40%
60%
Patented drugs useful to company for - Market penetration Percent
Yes
No
60%
40%
Patented drugs useful to company for -Profitability Percent
Yes
No
20% of the total says that patented drugs are useful to a company for maximizing global profit.
40% of the total says that patented drugs are useful to a company for royalties.
40% of the total says that patented drugs give the tax advantage.
20%
80%
Patented drugs useful to company for -Maximise global profit Percent
Yes
No
40%
60%
Patented drugs useful to company for -Royalties Percent
Yes
No
40%
60%
Patented drugs useful to company for - Tax advantage Percent
Yes
No

20% of the total says that patented drugs are useful to a company for sale by considering Indian population.
Interpretation
Patented drugs are useful to company for Market Penetration.
To increase Profitability and maximize global profit which in turn will improve
economic status of IPC.
The development of the pharmaceutical industry would help the Indian economy produce
more national wealth. Foreign investment would increase, and Indian companies would
have the opportunity to collaborate with many companies from around the world.
Indirectly, developing the pharmaceutical industry would also help other industries.
11. Due to IPR act 2005 price of medicines is increasing to common man by
I. 0-25%II. 25-50%
III. 50-75%
IV. 75-100%V. Above 100%
60 % of the total says that due to IPR act 2005 prices increases between 25-30%.
20%
80%
Patented drugs useful to company for - Sale by considerimg Indian population Percent
Yes
No
16%
60%
20%
4%
Due to IPR act 2005 % increase in price Percent
0-25%
25-50%
50-75%

Interpretation
The producer's cost includes R&D costs, production costs, marketing costs and profits.
The research-based pharmaceutical industry is distinguished from others by relatively
high R&D costs, marketing costs and profit margins. Risks are high even though patents
support high margins for new, innovative drugs because only a small proportion of
chemical entities tested reach the market and of these only a few are best sellers.
Consequently, R&D expenditures have to be recovered from the relatively few
commercially successful products. Moreover, it is sometimes claimed that a combination
of lengthy regulatory approval periods, high up-front R&D costs, high marketing costs
and high risk limit entry into the research-based industry and thus help explain the
relatively high profit margins observed. The pricing of patented pharmaceuticals has
attracted a great deal of attention recently.
12. Patent has adverse effect on availability for common man.
a. Highb. Moderatec. Low.

For pharmaceutical companies
60 % of the total says that there is moderate percentage of patent’s adverse effect on availability for common man.
Interpretation
The problem of availability of the patented drug also becomes more acute when local
producers cannot imitate and produce the product due to the existence of Patent Act.
13. Suggest ways or strategies to make patented drug affordable to common man
Government subsidy
NGO support
Tax exemption
Any other
CSR activity of the company
For pharmaceutical companies
Strategies to make patented drugs affordable - Government subsidy
PercentValid
PercentCumulative Percent
ValidYes 84.0 84.0 84.0No 16.0 16.0 100.0
Total 100.0 100.0
Strategies to make patented drugs affordable - NGO support
PercentValid
PercentCumulative Percent
ValidYes 52.0 52.0 52.0No 48.0 48.0 100.0
Total 100.0 100.0
12%
60%
28%
Patent's adverse effect on availability for common man Percent
High
Moderate
Low

Strategies to make patented drugs affordable - CSR activity of the company
PercentValid
PercentCumulative Percent
ValidYes 40.0 40.0 40.0No 60.0 60.0 100.0
Total 100.0 100.0
Strategies to make patented drugs affordable - Tax exemption
PercentValid
PercentCumulative Percent
ValidYes 12.0 12.0 12.0No 88.0 88.0 100.0
Total 100.0 100.0
Strategies to make patented drugs affordable - Any other
PercentValid
PercentCumulative Percent
Valid No 100.0 100.0 100.0
84 % of the total thinks that government subsidy is a way or strategy to make patented
drug affordable to common man.
84%
16%
Startegies to make patented drugs affordable -Governmnet subsidy Percent
Yes
No

52 % of the total thinks that NGO support is a way or strategy to make patented drug affordable to common man.
40 % of the total thinks that CSR activity of the company is a way or strategy to make patented drug affordable to common man.
Only 12 % of the total thinks that tax exemption is a way or strategy to make patented drug affordable to common man.
For IPR legal practitioners
52%48%
Startegies to make patented drugs affordable -NGO support Percent
Yes
No
40%60%
Startegies to make patented drugs affordable -CSR activity of the company Percent
Yes
No
12%
88%
Startegies to make patented drugs affordable -Tax exemption Percent
Yes
No

Strategies to make patented drugs affordable - Government subsidy
Frequency PercentValid
PercentCumulative
PercentValid Yes 1 20.0 20.0 20.0
No 4 80.0 80.0 100.0Total 5 100.0 100.0
Strategies to make patented drugs affordable - NGO support
Frequency PercentValid
PercentCumulative
PercentValid Yes 2 40.0 40.0 40.0
No 3 60.0 60.0 100.0Total 5 100.0 100.0
Strategies to make patented drugs affordable - CSR activity of the company
Frequency PercentValid
PercentCumulative
PercentValid Yes 2 40.0 40.0 40.0
No 3 60.0 60.0 100.0Total 5 100.0 100.0
Strategies to make patented drugs affordable - Tax exemption
Frequency PercentValid
PercentCumulative
PercentValid Yes 2 40.0 40.0 40.0
No 3 60.0 60.0 100.0Total 5 100.0 100.0
20 % of the total thinks that government subsidy is a way or strategy to make patented
drug affordable to common man.
20%
80%
Strategies to make patented drugs affordable - Government subsidy
Yes
No

60 % of the total thinks that NGO support is a way or strategy to make patented drug affordable to common man.
40 % of the total thinks that CSR activity of the company is a way or strategy to make patented drug affordable to common man.
40%
60%
Strategies to make patented drugs affordable - NGO support
Yes
No
40%
60%
Strategies to make patented drugs affordable - CSR activity of the
company
Yes
No

Only 40 % of the total thinks that tax exemption is a way or strategy to make patented drug affordable to common man.
Interpretation
The government of India is also providing incentives to encourage investment in
pharmaceutical sector and helping domestic players. Under the automatic route in the
drugs and pharmaceuticals sector including the companies using recombinant technology
the government has permitted 100 percent foreign direct investment (FDI). According to
a report, the Indian government plans to set-up a US$639.56 million venture capital (VC)
fund. This fund is expected to encourage discovery of new drugs and also help
strengthen the pharma infrastructure.
14. Reduction in patented life of product will result in the economic treatment of the poor population, do you agree?
Yes No
For pharmaceutical companies
Reduction of patented life of product result in economic treatment
PercentValid
PercentCumulative Percent
ValidYes 84.0 84.0 84.0No 16.0 16.0 100.0
Total 100.0 100.0
40%
60%
Strategies to make patented drugs affordable - Tax exemption
Yes
No

84 % of the total says that reduction of patented life of product result in economic treatment.
For IPR legal practitioners
Reduction of patented life of product result in economic treatment
Frequency PercentValid
PercentCumulative
PercentValid Yes 2 40.0 40.0 40.0
No 3 60.0 60.0 100.0Total 5 100.0 100.0
60 % of the total says that reduction of patented life of product result in economic treatment.
15. Suggest expected patent life of the productI. 0-5 yrs
84%
16%
Reduction of patented life of product result in economic treatment Percent
Yes
No
100%
0%
Reduction of patented life of product result in economic treatment Percent
Total

II. 5-10yrsIII. 10-15yrsIV. 15-19yrs
For pharmaceutical companies
48 % of the total suggested expected life of the product is 5-10 years.
For IPR legal practitioners
Suggested patent life of the productFrequenc
y PercentValid
PercentCumulative
PercentValid 5-10 yrs 2 40.0 40.0 40.0
10-15yrs 2 40.0 40.0 80.015-19 yrs 1 20.0 20.0 100.0Total 5 100.0 100.0
80 % of the total suggested expected life of the product is 5-15 years.
Interpretation
20%
48%
32%
Suggested patent life of the product Percent
0-5 yrs
5-10 yrs
10-15yrs
17%
83%
0%
Suggested patent life of the productPercent
15-19 yrs
Total

Patents provide the patent owner with the legal means to prevent others from making,
using or selling, importing or offering for sale the new, patented drug for a limited period
of time. The TRIPS-compatible 20-year term of a patent runs from the time of filing of
the application. In the case of pharmaceutical products, which are subjected to lengthy
procedures that verify safety and efficacy, the effective patent life may only be an
average of 11 or 12 years. In the pharmaceutical sector it is patents that are especially
crucial in appropriating the returns to R&D. This is because once the originator,
breakthrough drug is produced through lengthy and relatively expensive R&D processes,
the time, capital and effort involved in copying it is often minimal.
7.3 Data analysis and Interpretation for doctors
1) Do you use imported medicines?
Yes No
Use of imported medicines
Frequency Percent
Valid Percent
Cumulative Percent
Valid Yes 12 40.0 40.0 40.0No 18 60.0 60.0 100.0Total 30 100.0 100.0
Yes No
Use of inported medicines
0
10
20
30
40
50
60
Percent
Use of inported medicines

Interpretation
40% of the total says that they are using imported medicine & 60% says that they are
not using imported medicine
2) Since how many years………………
From many years using imported medicines
Frequency Percent
Valid Percent
Cumulative Percent
Valid 0 Years 19 63.3 63.3 63.31 to 5 years 2 6.7 6.7 70.05 to 10 years
2 6.7 6.7 76.7
more than 10 years
7 23.3 23.3 100.0
Total 30 100.0 100.0
Interpretation Around 63 % of the total says that they are rarely using imported medicine & around 23
% says that they are using imported medicine from more than 10 years
0 Yeras 1 to 5 years 5 to 10 years more than 10 years
From many years using imported medicines
0
10
20
30
40
50
60
70
Per
ce
nt
From many years using imported medicines

3) Due to globalization, few of the medicines are now available in Indian market. Do you
prefer these medicines?
Yes No
Prefer Indian medicines
Frequency Percent
Valid Percent
Cumulative Percent
Valid Yes 17 56.7 56.7 56.7No 13 43.3 43.3 100.0Total 30 100.0 100.0
Interpretation 57 % of the total says that they prefer imported medicines
4) Reasons behind using Indian Medicines,
1. Quality2. Availability3. Affordability
Reasons behind using Indian medicines
Frequency Percent
Valid Percent
Cumulative Percent
Valid Quality 18 60.0 60.0 60.0Availability
6 20.0 20.0 80.0
Yes No
Prefer Indian medicines
0
10
20
30
40
50
60
Percent
Prefer Indian medicines

Affortability
6 20.0 20.0 100.0
Total 30 100.0 100.0
Interpretation
Quality is the major factor which is affecting the use of Indian medicines which is 60 % of the total population
Availability and affordability carries 20 % each.
5) Do you prefer imported medicines over locally available parallel brands only for quality reason?
Yes No
Use of imported medicines over locally available medicines
Frequency Percent
Valid Percent
Cumulative Percent
Valid Yes 13 43.3 43.3 43.3No 17 56.7 56.7 100.0Total 30 100.0 100.0
Yes No
Prefer Indian medicines
0
10
20
30
40
50
60
Perc
ent
Prefer Indian medicines

Interpretation
It can be seen that use of imported medicines over locally available medicines of the
parallel brands for the quality factor is nearly giving mixed result that 43 % of total says
that quality is a factor for using those medicines and rest says quality is not an issue.
Yes No
Use of imported medicines over locally available medicnes
0
10
20
30
40
50
60
Pe
rce
nt
Use of imported medicines over locally available medicnes