data acquisition modalities
TRANSCRIPT

Data Acquisition Modalities
Vedran Omeragic∗
0727422Vienna University of Technology
Figure 1: Different types of data acquisition modalities in medical imaging. From left to right: computed tomography (CT), positron emissiontomography (PET) and magnetic resonance imaging (MRI). Courtesy of Wikipedia. [Wikipedia 2011h]
Abstract
The development in technology in the past few decades brought rev-olutionary changes and significant advancements to the techniquesof medical imaging. At the heart of every medical imaging modalityis a sophisticated mathematical model of the measurement process,as well as the algorithms to reconstruct an image from the measureddata. This paper will focus on introducing data acquisition in suchtechniques, their process, advantages, limitations, as well as theirshort history.
Keywords: medical imaging, data acquisition, image processing,tomography, magnetic resonance, ultrasound, nuclear medicine
1 Introduction
Medical imaging describes a process of acquiring an image of thehuman body or parts of it for either clinical purposes or medicalscience [Branstetter 2007]. As a scientific method it is a part ofbiological imaging and incorporates a wide set of techniques, suchas radiology, nuclear imaging, endoscopy, medical thermographyand photography, microscopy and many more. For example, threedimensional volumetric visualization of MRI data of internal organshas become a standard for routine patient diagnostic care.
∗e-mail: [email protected]
According to Basics of Imagig informatics [Branstetter 2007] non-invasive procedures are used to designate a set if imaging tech-niques, which produce images of the internal aspects of the body.In short, noninvasive is a term based on a fact that these imagin-ing technique do not penetrate the skin physically. However, onthe atomic levels they are very invasive. From high energy pho-tons of X-ray to the Tesla coils of an magnetic resonance imagingmachine, these modalities alter physical and chemical environmentof the body in order to obtain certain data. In computed tomog-raphy for example, the denser tissues such as bones, absorb moreX-rays and show as light areas on X-ray film. Furthermore, a con-trast medium can be used to highlight soft tissues in X-ray picturesor can be followed on X-ray films as it moves through the body torecord bodily processes.
The discovery of magnetic resonance, ultrasound, radioactivity andX-rays, as well as the development of imaging instruments, provedto be one of the most effective diagnostic tools. Today we are ableto probe into a structure and function of the human body using anumber of imaging systems, which are further used to plan treat-ment and surgery of patients. Use of such technology is not limitedonly to clinical purposes. For example, computed tomography isoften used in industry to detect flaws of products. Data sets in twoor three dimensions convey a vast array of information for clini-cal or research applications. This information, however, needs tobe interpreted in a timely and accurate manner for it to be usable[Branstetter 2007]. In order to visually interpret images, the inter-national imaging community developed numerous techniques, eachwith advantages, limitations and field of application.
The advancements in medical imaging require a significant innova-tions in computational techniques. The use of multiple modalitieson a single patient requires sophisticated algorithms for image reg-istration and pattern matching. Automated recognition and diag-nosis require image segmentation, quantification and enhancementtools. The widespread availability of imaging requires efficient andeffective image compression and communication methods.

1.1 Data Acquisition
Medical imaging is an interdisciplinary subject that requires un-derstanding of physics, technology, and practice of each medicalimaging modality. In order to explain the basics of imaging processit is imperative to first understand the term data acquisition. Suchprocess describes a way of sampling signals in an analog wave-forms, which measure real world physical conditions and then con-vert them into digital values, which can further be analyzed andmanipulated by a computer. Data acquisition systems, hereafter re-ferred to as DAQ, consist of three components [Wikipedia 2011g]:
• Sensors (convert physical parameters to electrical signals).
• Signal conditioning circuitry (convert sensor signals into aconditioned form, which can further be used to converted todigital values).
• Analog-to-digital converters (convert conditioned signals todigital values).
Next step requires a software component, usually developed bya general purpose programming languages such as BASIC, C,Fortran, Java List, Pascal and graphical programming environ-ments which include Visual Basic, Visual C++ and Ladder logic[Wikipedia 2011g].
1.1.1 Methodology
The process of acquisition begins once physical phenomenon whichneeds to be measured occurs. For example light intensity, tempera-ture or pressure. Their physical state is then measured, transformedinto a unified form, which can later be read by a DAQ. This task isperformed by a device called sensor, a type of transducer (devicewhich converts one type of energy to another) [Wikipedia 2011g].A sensor converts a physical property into a corresponding electri-cal signal, e.g. voltage. Different types of sensors have differentapplication fields, each with the ability to measure different physi-cal properties and states.
Depending on used transducer, signals can be either analog or digi-tal. Some signals need to be conditioned first [Wikipedia 2011g] ifthe signal form from transducer is not suitable for a specific DAQhardware. The signal my need to be amplified, filtered or demodu-lated. For transmission purposes single ended analog signals, whichare more susceptible to noise, can be converted to the differentialsignals. Once digitized, the signal can be encoded to reduce andcorrect transmission errors.
DAQ hardware represents an interface between the signal and a PC[Wikipedia 2011g]. It could be in the form of modules that can beconnected to the computers ports or cards which can be connectedto the corresponding slots. DAQ cards often contain multiple com-ponents like multiplexer, ADC, DAC, TTL-IO, high speed timersand RAM. Many times reconfigurable logic is used to achieve highspeed for specific tasks. Digital signal processors are used after thedata has been acquired to obtain some results. The fixed connectionwith the PC allows for comfortable compilation and debugging.
1.1.2 Modalities
Medical modalities produce representations of anatomical (struc-tural) or molecular, physical and psychological (functional) infor-mation of a body part, or a body in whole. X-rays images for exam-ple, are representations of the distribution of linear attenuation co-efficients of tissues and are usually images of anatomy or the struc-
tural nature of the tissues [Wikipedia 2011e]. On the other hand,radioisotope imaging (nuclear medicine) produces images of dis-tributions of chemical, molecular or physiological function of thetissue. Other modalities like ultrasound can measure signal propa-gation or flow through vessels.
Modalities are characterized by the type of energy source they use,and can be separated in two groups [Wikipedia 2011g]:
• One group uses ionizing radiation and is an invasive tech-nique, which produces energetic charged particles that pen-etrate a medium or an object where the energy is absorbed.This group counts radiography, fluoroscopy, mammography,computer tomography and nuclear medicine.
• Other group uses non-ionizing radiation, which is a non in-vasive technique and it counts ultrasound and magnetic reso-nance imaging.
1.1.3 Imaging types
Depending on the method of acquiring images, there are two typesof imaging, planar and cross-sectional [Wikipedia 2011g].
In projection (planar) imaging X-rays pass through the object,which are then detected on the opposite side of the said object. Asa result, a two-dimensional shadow representation of the tissues ly-ing between the source and the detector is produced. Sometimes,overlapping layers of tissues can make planar imaging a bit difficultto interpret.
Figure 2: What exactly is an image? Processed image represents atwo dimensional array of pixels.
Figure 3: Planar imaging, showing X-rays penetrating the objectand passing through it. Courtesy of Carver College of Medici, Uni-versity of Iowa. [Ni 2009]

Figure 4: Cross-sectional imaging showing X-rays penetrating atransverse section of the object, while the source and detector rotatesynchronously around the object. Courtesy of Carver College ofMedicine, University of Iowa. [Ni 2009]
Tomographic (cross-sectional) imaging modalities include com-puter tomography, magnetic resonance imaging and ultrasound.The source and detectors rotate together around the object. Theresult is a large number of one-dimensional projections at a numberof different angles, which are then mathematically reconstructed tomake a two-dimensional image of a slice through the object.
1.1.4 From 2D to 3D
In order to reconstruct a 3D representation of the object, a set of2D image slices taken around a single axis of rotation is required[Branstetter 2007]. Afterward, digital geometric processing is usedto generate a three-dimensional image of the object. Historically,images have been generated in the axial (transverse) plane, whichis orthogonal to the long axis of the body, but modern scanners canreformat the data in any orientation or as a volumetric representa-tion.
2 Imaging technology
Imaging defines the ability to capture, storage, manipulation anddisplay images [Wikipedia 2011g] . In medical imaging the em-phasis lies on the ability to capture sensory data from various medi-cal machine (e.g. medical resonance imaging scanners or computedtomography scanners) and convert the analog data into digital, mak-ing a usable image which can further be used for clinical purposesor medical research.
2.1 Computed tomography
Computed tomography(CT) or Computed axial tomography(CAT)is a medical imaging technique which uses tomography, whichrefers to imaging by sections through the use of any kind of pene-trating waves [Wikipedia 2011e]. Later, digital geometry process-ing is used to create 3D representation of an object, using a large
Figure 5: The object, a human in this example, which needs to bereconstructed in 3D. Long body axis represents an axis of rotation,around which source of energy and detectors rotate. Courtesy ofCarver College of Medici, University of Iowa. [Ni 2009]
Figure 6: A patient receiving a CT scan for cancer. In the rightcorner is an imaging computer that reveals a 3D image of the body’sinterior. Courtesy of Wikipedia. [Wikipedia 2011c]
set of 2D X-ray images taken around a single axis of rotation ofthe mentioned object. CT employs a windowing technique in orderto show different bodily structures based on their ability to reflector absorb X-rays. In practice CT refers to a tomography from X-ray images, but sometimes the term computer tomography can alsobe used to describes positron emission topography (PET) or singlephoton emission computed tomography (SPECT), which belong tonuclear medicine.
2.1.1 Data acquisition
In order to generate X-ray slice of an object, a source of X-rayis placed on the opposite side of the detectors (sensors), with theobject standing between them. Earliest versions of sensors werescintillation detectors with photomultiplier tubes excited by cesiumiodide crystals. These crystals were later replaced by Xenon gas,while the photomultipliers were replaced by photodiodes [Branstet-ter 2009]. Newer machines, faster computers and more advancesoftware allow processing of continuously changing cross sections.

Figure 7: Computed tomography of human brain, from base of theskull to top. Intravenous contrast medium is used to enhacne theimage. Courtesy of Wikipedia. [Wikipedia 2011d]
In conventional CT machines, an X-ray tube (a vacuum tube whichproduces X-rays) and detector are physically rotated in a circularmotion around the imaged object.
2.1.2 Data processing and reconstruction
Once the sensory data is acquired it must be processed by tomo-graphic reconstruction which produces a set of cross-sectional im-ages [Wikipedia 2011e]. The projection of an object at a givenangle is made up of a set of line integrals. In X-ray CT, the lineintegral represents the total attenuation of the beam of x-rays as ittravels in a straight line through the object. The resulting image isa 2D or 3D model of the attenuation coefficient.
In theory an any image µ(x,y) can be found using the functionknown as the Radon transform (or sinogram) [Preim and Bartz2007]. Data is collected as a series of parallel rays, at position r,across a projection at angle θ . This is repeated for various angles.
While Radon transform is most commonly used today, there areother techniques as well [Preim and Bartz 2007]. Linear algebra,for example, was used by early EMI scanners, but the it was verylimited due to computational complexity and technical capabili-ties of that time. Recently, manufacturers have developed iterativephysical model-based expectation-maximization techniques. Theadvantage of this technique lies in its ability to use internal modelof scanner’s physical properties and the laws of X-ray interactions,the result are images with improved resolution, reduced noise andfewer artifacts, as well as the ability to greatly reduce the radiationdose in certain circumstances. The disadvantage, however, is a veryhigh computational requirement [Wikipedia 2011e].
The result of processing is an image consisting of pixels which in-dividually display the relative radiodensity of one part of the tis-sue according to the mean attenuation of that tissue, which cor-responds to values of Hounsfield scale (from the most attenuating3071 to least attenuating -1024) [Branstetter 2007]. While a pixelis a two-dimensional unit, once CT slice thickness is factored in, itis then known as a Voxel [Wikipedia 2011e], a three-dimensionalunit. The phenomenon in which a part of the detector cannot dif-ferentiate between different tissues is called the Partial Volume Ef-fect. Some materials like steel iron, can completely extinguish the
Figure 8: Parallel beam geometry. Each projection is made up ofthe set of line integrals through the object. The projection of anobject at a given angle µ is made up of a set of line integrals. Theline integral represents the total attenuation of the beam of x-rays asit travels in a straight line through the object. The resulting image isa 2D model of the attenuation coefficient. Courtesy of Wikipedia.[Wikipedia 2011k].
Figure 9: Radon transform, where searched image µ(x,y) is repre-sented by f(x,y), x and y are the coordinates, θ is an angle and pis total attenuation of a beam at position r. Courtesy of Wikipedia.[Wikipedia 2011o]
X-rays, which causes line-artifacts. Such artifact are caused byabrupt transition from low and high density materials, causing val-ues which exceed the technical limitations of processing electron-ics. Sometimes a contrast medium is used for CT to enhance thestructural integrity of internal organs on the image. Such materialis called radiocontrast and it is usually iodine-based.
Contemporary CT scanners offer isotropic or near isotropic resolu-tion. Such display of images does not have to be restricted to theconventional axial images. With the use of a software program, itis possible to build a three-dimensional representation of the objectby stacking individual slices on top of the other.
2.1.3 Field of application
Computed tomography is vastly used for diagnostic purposes to im-age patients head, lungs, abdomen, pelvic or extremities, and lateruse this data to diagnose the disorder. Other then just the medi-cal application, industrial CT Scanning is a process which utilizesX-ray equipment to produce 3D representations of components. Ithas been utilized in many areas of industry for internal inspectionof components. Some of the key uses for CT scanning have beenflaw detection, failure analysis, meteorology, assembly analysis andreverse engineering applications. [Wikipedia 2011e]

Figure 10: Three different pixels, showing the radiodensity of anobject. Since every tissue absorbs X-Rays at different rates, someparts of the body will be showns as white (bones), shadowy gray(soft tissue like muscle) or black(air).
Figure 11: 3D reconstruction of the cranial CT. The 3D construc-tion of the model is done by taking 2D images of the head andstacking them on top of each other. The result is the 3D model ofthe patients head. Since these are simply 2D images stacked up,when viewed on edge the slices disappear since they have effec-tively zero thickness. Courtesy of Wikipedia. [Wikipedia 2011b]
2.2 Magnetic Resonance Imaging
Magnetic resonance imaging (MRI) or magnetic resonance tomog-raphy (MRT) is a noninvasive medical imaging technique used tovisualize internal structures and unlike CT scans, MRI uses no ion-izing radiation [Wikipedia 2011i]. MRI uses nuclear magnetic res-onance to image nuclei of atoms inside the body. MRI machinescreates a powerful magnetic field which aligns the magnetization ofsome atoms in the body and uses the radio frequency fields to alterthe alignment. As the effect, the nuclei produce a rotating magneticfield detectable by scanners. This information is then recorded toconstruct the image of scanned area of the body. Stronger magneticfields can cause nuclei at different locations to rotate at differentspeed and three-dimensional image can be constructed if gradientis provided in each direction. The 3DFT technique is similar to2DFT except that there is no slice selection and phase-encoding isperformed in two separate directions.
Objects with metal parts or with properties of metal are not allowedin MRI machines due to effects of the strong magnetic field andpowerful radio frequency pulses [Branstetter 2007]. Once the mag-netic field is turned on, a patient with a metal implant would havethe implant ripped out of him by the strong magnetic force.
Figure 12: Magnetic Resonance Imaging Scanner. Courtesy ofWikipedia. [Exchange 2011]
Figure 13: Representation of the brain in MRI. Courtesy ofWikipedia. [Wikipedia 2011j]
2.2.1 Data acquisition
When an object is placed inside the MRI machine, the powerfulmagnetic field aligns the magnetic moments of all protons of thisobjects atoms with the direction of the field. Radio frequency elec-tromagnetic field is then used to alter the magnetization alignmentof protons relative to the field. Once radio EM frequency is deacti-vated, protons will return to the original magnetization alignment.Such changes in magnetization alignment of protons create a signaldetectable by the scanner. The position of all protons in the bodycan be determined by using additional magnetic fields during thescan. The sensory data is then used to construct an image of theobject. [Branstetter 2009]
2.2.2 Data processing and reconstruction
A number of techniques have been developed for combining fieldgradients and radio frequency excitations for a purpose of con-structing an image [Wikipedia 2011i]. Such techniques include 2Dor 3D reconstruction from projections (similar to CT), building theimage point-by-point or line-by-line and gradients in the RF fieldrather than the static field. Although each of these techniques isused for specialist applications, the majority of MRI images areconstructed by two dimensional Fourier transform (2DFT) tech-nique with slice selection or three-dimensional Fourier transform(3DFT).

Figure 14: Simplified timing diagram for two-dimensional-Fourier-transform (2DFT) Spin Echo (SE) pulse sequence. Legend: SSslice selection, PE phase shift, FE frequency-encoding, Gi gradi-ent fields, Tr time before the whole sequence repeat itself, TE timeof spin echo, nFE number of times the signal is sampled, nPE num-ber of times th whole sequence is repeated. Courtesy of Wikipedia.[Wikipedia 2011a]
First, image contrast is created by the differences in the nuclearmagnetic resonance signal from different locations. Usually thisdepends on relative density of exited nuclei and the differencesin relaxation times after the pulse sequence ( T1 , T2 , and T ∗
2 )[A. L. Baert 2006]. Carefully designed pulse sequence allows oneone contrast mechanism to be emphasized, giving MRI a great ad-vantage with flexibility. For example, in the brain white matter ap-pears white and the congregations of neurons of gray matter appeargray, while cerebrospinal fluid (CSF) appears dark. Just as with theCT, patient may take contrast agents to enhance the contrast.
Very valuable technique in the unification of different MRI tech-niques is called k-space formalism [Wikipedia 2011i]. It showsthat the demodulated MR signal generated by freely precessing nu-clear spins in the presence of a linear magnetic field gradient equalsthe Fourier transform of the effective spin density. The importanceof k-space in determining image contrast lays in advanced imagingtechniques, like spiral acquisition, where a rotating gradient fieldis applied which then causes the trajectory of k-space to spiral outfrom the center to the edges. Due to decay the signal is greatest atthe start; acquiring the center of k-space first improves contrast tonoise ratio (CNR).
Final imaging step is pulse sequence [Bankman 2000]. Its firstpart consists of slice selection, which causes a 90 degree nuta-tion of longitudinal nuclear magnetization within a slice, creatinga transverse magnetization. The second imparts a phase shift uponthe slice-selected nuclear magnetization. In the third par, anotherslice selection (of the same slice) uses another pulse to cause a180 degree rotation of transverse nuclear magnetization within theslice. This causes a spin echo to form at a time, during which afrequency-encoding is applied. The signal is sampled a number of-time times. Longitudinal magnetization is then recovered and aftercertain time the whole sequence is repeated several times, but withphase-encoding gradient incremented. After 2D matrix has beencreated a two-dimensional Fourier transform is performed.
2.2.3 Field of application
Turning the gradient coils on and off will affect the frequency atwhich protons resonate. Diseased tissue, such as tumors, can be de-tected because the protons in different tissues return to their equi-librium state at different rates. This effect is used to create con-trast between different types of body tissue. MRI can be used toimage every part of the body, but is particularly useful for neuro-logical conditions, disorders of the muscles and joints, evaluatingtumors and for showing abnormalities in the heart and blood ves-sels. [Wikipedia 2011i]
2.3 Ultrasound
Ultrasound imaging, also called ultrasound scanning, sonographyor ultrasonography, is a medical imaging technique which applieshigh-frequency sound waves on the parts of the body in order to vi-sualize subcutaneous body structures like muscles, joints and ves-sels [Wikipedia 2011t]. The term ultrasound refers to any soundwave withe frequency above 20kHz. It is a very common andwidely used clinical procedure during pregnancies. Ultrasound isa noninvasive examination which does not use ionizing radiation.Due to its ability to capture the data in real-time, ultra sound canbe used to show the structure and movement of the bodys internalorgans, as well as blood flowing through blood vessels. As with theprevious modalities, ultrasound procedures sometimes endores theuse of microbubble contrast media to enhance the resulting image.
Though ultrasound has a wide range of application, a general-purpose sonograph can be used for almost all ultrasound imagingprocesses with the help of specialty transducer. Such transducercan be used directly on skin or placed inside the body.
Figure 15: A general-purpose sonographic instrument. Courtesy ofWikipedia. [Wikipedia 2011s]

Figure 16: Linear array transducer. Courtesy of Wikipedia.[Wikipedia 2011f]
2.3.1 Data acquisition
First step in ultrasound imaging is the creation of the sound wave,a process usually done by piezoelectric transducer. Ultrasound ma-chine sends electrical pulses which will make the transducer ringat desired frequencies, usually between 2 and 18 MHz. Focusingof the beam is done using lenses or a set of pulses, or by the shapeof the transducer. Ultrasound transducer produces a sound wavewhich travels through the body and comes into a focus at a desireddepth. Materials in transducer help the sound to be more efficientlytransmitted in the body [A. L. Baert 2006]. Usually a gel is placedon the patient’s skin before the procedure. This will help differen-tiate between different parts of body, because the wave is partiallyreflected from the layers between different tissues. In short, soundwaves are reflected whenever the density of the body changes.
Sound wave is then returned to the transducer. This is exactlythe same process in reverse, where sound vibrates the transducer.Transducer turns these vibrations into electrical pulses, which aresent to ultrasonic scanner. Ultrasound scanner processes thesepulses and a digital representation is constructed [A. L. Baert 2006].
2.3.2 Data processing and reconstruction
As desribed in Image Processing in Radiology [A. L. Baert 2006]next step in ultrasonography is determining three values:
• How long does it take for echo to be received from the mo-ment the sound wave was transmitted.
• Focal length is then deduced which enables a sharp image ofthe echo at a desired depth.
• Strength of the echo, which determines the brightness.
Once these values have been calculated the scanner can determinewhich pixel will light up and which will not. The scanner also cal-culates to what intensity and at what hue will each pixel be colored[A. L. Baert 2006]. The result is a digital greyscale image. Theseimages can be displayed through a computer using a frame grabber,which captures individual, digital still frames from analog signal.
2.3.3 Field of application
Sonography is most often used for clinical purposes, because itsability to be used for both diagnosis, as well as some therapeu-tic procedures [Wikipedia 2011t]. For therapeutic applications it is
Figure 17: Power Doppler ultrasound of the kidney. This imageshows the tiny blood vessels in the kidney like the branches of atree. Courtesy of Wikipedia. [Wikipedia 2011r]
used to heat or agitate the body, however such procedures use muchhigher energies then for diagnostic. It is very effective for imagingsoft tissues of the body, breaking a kidney stone and generating heatfor the treatment of cysts and tumors.
2.4 Positron emission tomography
Positron emission tomography or PET, is a nuclear medicine imag-ing technique that produces a three-dimensional image of func-tional processes in the body [Wikipedia 2011l]. It uses a specialtype of camera and a tracer (usually fluorodeoxyglucose, a sugar),a radioactive chemical which can be metabolized in the body. Dur-ing the procedure the tracer liquid is introduce intravenously. As ittravels through the body much of it is collected in specific organsor tissues. The traces emits positively charged particle positrons,hence the name, which are then recorded by a special camera. PETscan pictures do not show as much detail as computed tomographyscans or magnetic resonance imaging because the images show onlythe location of the tracer. PET scan images are usually matchedwith those from a CT scan for a more detailed information. It is of-ten used to evaluate cancer, check blood flow or see how organs areworking. Three-dimensionality is often accomplished with the helpof CT scans performed during the same session and in the samemachine.
2.4.1 Data acquisition
First step of every PET scan is intravenous introduction of tracerisotope in the living subject. This tracer is incorporated into a bio-logically active molecule, which can later be absorbed by the body.Once the active molecules become concentrated in the tissue, a PETscan is conducted on the subject. During the scan the PET machinerecords as the tracer molecules slowly decay which results in the re-lease of the positron. As it travels through the tissue, it slowly loseskinetic energy until the moment it is able to interact with electrons.The result of the encounter is annihilation of both and creation ofphotons, which moves in opposite direction of positrons trajectory.As newly created photons travel eventually they reach a scintilla-tor in the PET scanner and result in a burst of light detectable byphotomultiplier tunes or silicon photodiodes [Gershon 1990]. Thistechnique requires on simultaneous detection of a pair of photons.Those that do not arrive in pairs are ignored by the scanner.
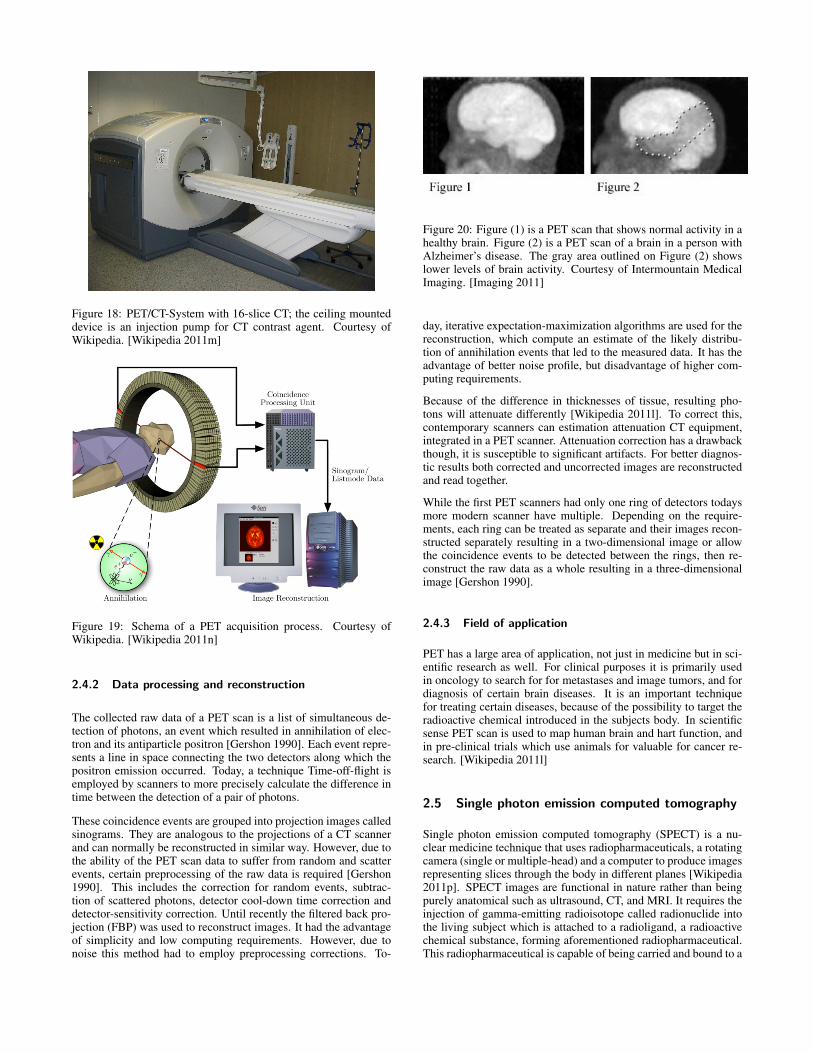
Figure 18: PET/CT-System with 16-slice CT; the ceiling mounteddevice is an injection pump for CT contrast agent. Courtesy ofWikipedia. [Wikipedia 2011m]
Figure 19: Schema of a PET acquisition process. Courtesy ofWikipedia. [Wikipedia 2011n]
2.4.2 Data processing and reconstruction
The collected raw data of a PET scan is a list of simultaneous de-tection of photons, an event which resulted in annihilation of elec-tron and its antiparticle positron [Gershon 1990]. Each event repre-sents a line in space connecting the two detectors along which thepositron emission occurred. Today, a technique Time-off-flight isemployed by scanners to more precisely calculate the difference intime between the detection of a pair of photons.
These coincidence events are grouped into projection images calledsinograms. They are analogous to the projections of a CT scannerand can normally be reconstructed in similar way. However, due tothe ability of the PET scan data to suffer from random and scatterevents, certain preprocessing of the raw data is required [Gershon1990]. This includes the correction for random events, subtrac-tion of scattered photons, detector cool-down time correction anddetector-sensitivity correction. Until recently the filtered back pro-jection (FBP) was used to reconstruct images. It had the advantageof simplicity and low computing requirements. However, due tonoise this method had to employ preprocessing corrections. To-
Figure 20: Figure (1) is a PET scan that shows normal activity in ahealthy brain. Figure (2) is a PET scan of a brain in a person withAlzheimer’s disease. The gray area outlined on Figure (2) showslower levels of brain activity. Courtesy of Intermountain MedicalImaging. [Imaging 2011]
day, iterative expectation-maximization algorithms are used for thereconstruction, which compute an estimate of the likely distribu-tion of annihilation events that led to the measured data. It has theadvantage of better noise profile, but disadvantage of higher com-puting requirements.
Because of the difference in thicknesses of tissue, resulting pho-tons will attenuate differently [Wikipedia 2011l]. To correct this,contemporary scanners can estimation attenuation CT equipment,integrated in a PET scanner. Attenuation correction has a drawbackthough, it is susceptible to significant artifacts. For better diagnos-tic results both corrected and uncorrected images are reconstructedand read together.
While the first PET scanners had only one ring of detectors todaysmore modern scanner have multiple. Depending on the require-ments, each ring can be treated as separate and their images recon-structed separately resulting in a two-dimensional image or allowthe coincidence events to be detected between the rings, then re-construct the raw data as a whole resulting in a three-dimensionalimage [Gershon 1990].
2.4.3 Field of application
PET has a large area of application, not just in medicine but in sci-entific research as well. For clinical purposes it is primarily usedin oncology to search for for metastases and image tumors, and fordiagnosis of certain brain diseases. It is an important techniquefor treating certain diseases, because of the possibility to target theradioactive chemical introduced in the subjects body. In scientificsense PET scan is used to map human brain and hart function, andin pre-clinical trials which use animals for valuable for cancer re-search. [Wikipedia 2011l]
2.5 Single photon emission computed tomography
Single photon emission computed tomography (SPECT) is a nu-clear medicine technique that uses radiopharmaceuticals, a rotatingcamera (single or multiple-head) and a computer to produce imagesrepresenting slices through the body in different planes [Wikipedia2011p]. SPECT images are functional in nature rather than beingpurely anatomical such as ultrasound, CT, and MRI. It requires theinjection of gamma-emitting radioisotope called radionuclide intothe living subject which is attached to a radioligand, a radioactivechemical substance, forming aforementioned radiopharmaceutical.This radiopharmaceutical is capable of being carried and bound to a

Figure 21: SPECT Siemens brand. It consists of two gamma cam-eras. Courtesy of Wikipedia. [Wikipedia 2011q]
place of interest, which allows the ligand to be detected by gamma-camera.
2.5.1 Data acquisition
SPECT procedure is very similar to PET in its use of traceable ra-dioactive material and detection of gamma rays, but unlike PETscan, gamma radiation of the tracer molecule is measured directlyinstead of measuring photons [Branstetter 2009]. The resulting im-age of PET scan has higher resolution then SPECT scan due to moreradiation event localization information provided by detectors. Theadvantage of PET scan is in the ability to use longer-lived moreeasily-obtained radioisotopes.
Due to the similarity in procedure, SPECT scan also uses radio-pharmaceuticals [Wikipedia 2011p]. Gamma camera is then usu-ally rotated a full 360 degrees around the subject and during certainpoints (every few degrees) projections are acquired. Depending onthe number of cameras it is possible for a scan to last up to 20 min-utes.
2.5.2 Data processing and reconstruction
The resulting image of this modality has very low resolution, usu-ally 64x64 or 128x128 pixels with the number of projections equalto the width [Wikipedia 2011p]. These images are susceptible tonoise and artifacts. Other disadvantage include movement of thesubject, which cause significant degradation in reconstruction, anduneven distribution of radiopharmaceutical which can cause in ar-tifacts. Areas of intense activity can cause streaking, a problemwhich is being solved with iterative reconstruction algorithm whichis less sensitive to artifacts and has the ability to correct attenuationand blurring.
2.5.3 Field of application
Most important advantage of SPECT is its ability to create a truethree-dimensional representation of the body part, especially ingamma imaging where its used for tumor, infection and bone imag-ing. SPECT scans have accurate localization in 3D, which can pro-vide more information on localised functions of internal organs likebrain and heart. [Wikipedia 2011p]
Figure 22: A SPECT scan of a patient with uncontrolled complexpartial seizures. The temporal lobe on the left side of the brainshows less blood flow than the right, confirming for the surgeon thenon-functioning area of the brain causing seizures. Courtesy of MyField Clinic. [Clinic 2011]
3 Conclusion
It has become more and more apparent that in the world with newertechnology and new health risks, more effective and advance imag-ing techniques are required to diagnose, treat and cure patients. Thesheer number of deaths is a good indication of the hundreds of thou-sands of people who have cancer around the world, and modernmedical imaging techniques are capable of diagnosing patients inearlies of the stages, saving thousands. This is but one of manyexamples that show the need for such technology. Though costsimaging equipment are extremely high their development is of theessence. As it was in times before and as it will be in time afterthe technical limitations of our times will eventually be surpassed.Newer imaging technology does not only help diagnose the patientin an early stage, but is slowly reducing any risks these machinesand procedures may have. Another great requirement of new tech-nology is the computing ability. As stated several times in this pa-per each technique requires sophisticated algorithms for image con-struction and correction of any errors it may have, thus showing theimportance of parallel development on both fields.
References
A. L. BAERT, M. KNAUTH, K. S. 2006. Image processing inradiology. Springer.
BANKMAN, I. N. 2000. Handbook of medical imaging. AcademicPress.
BRANSTETTER, B. F. 2007. Basics of Imaging informatics. RSNA.
BRANSTETTER, B. F. 2009. Practical Imaging Informatics.Springer.
BUI, A. A., AND TAIRA, R. K. 2009. Medical Imaging Informat-ics. Springer.
CAMERON MELVIN, M. X., AND THULASIRAMAN, P. Hpc foriterative image reconstruction in ct. In C3S2E ’08 Proceedingsof the 2008 C3S2E conference, 61–68.

CLINIC, M. F., 2011. Cranial spect scan. http://www.mayfieldclinic.com/PE-SPECT.htm. Retreived on Novem-ber 17, 2011.
EXCHANGE, M., 2011. Mri scanner. http://www.medicexchange.com/Neurology/. Retreived on November16, 2011.
GERSHON, N. D. 1990. Visualization and three-dimensional imageprocessing of pet brain images. In VIS ’90 Proceedings of the 1stconference on Visualization ’90, IEEE Computer Society PressLos Alamitos, CA, 144 – 149.
IMAGING, I. M., 2011. Cranial pet scan. http://www.webmd.com/brain/pet-scans-of-the-brain. Retreivedon November 17, 2011.
KALPATHY-CRAMER, J., AND HERSH, W. Multimodal medicalimage retrieval: image categorization to improve search preci-sion. In MIR ’10 Proceedings of the international conference onMultimedia information retrieval, 165–174.
NI, J., 2009. Medical imaging modalities and digital imaging. Pre-sentation. Retreived on November 15, 2011.
PREIM, B., AND BARTZ, D. 2007. Visualization in medicine:theory, algorithms, and applications. Elsevir, inc.
ROBERT A. DREBIN, L. C., AND HANRAHAN, P. Volume render-ing. In SIGGRAPH ’88 Proceedings of the 15th annual confer-ence on Computer graphics and interactive techniques, 65–74.
VAN DER GLAS, M. 2000. Principle of computerized tomographicimaging. 1–7.
WIKIPEDIA, 2011. 2-dimensional fourier transform pulse se-quence. http://en.wikipedia.org/wiki/Physics_of_Magnetic_Resonance_Imaging. Retreived on November 16,2011.
WIKIPEDIA, 2011. 3d cranial reconstruction. http://en.wikipedia.org/wiki/Computed_Tomography. Retreived onNovember 15, 2011.
WIKIPEDIA, 2011. Computed tomography scanner. http://en.wikipedia.org/wiki/Computed_Tomography. Retreived onNovember 15, 2011.
WIKIPEDIA, 2011. Cranial computed tomography. http://en.wikipedia.org/wiki/Computed_Tomography. Retreived onNovember 15, 2011.
WIKIPEDIA, 2011. Ct. http://en.wikipedia.org/wiki/Computed_tomography. Accessed November 17, 2011.
WIKIPEDIA, 2011. Linear array transducer. http://en.wikipedia.org/wiki/Ultrasound. Retreived on November17, 2011.
WIKIPEDIA, 2011. Medical imaging. http://en.wikipedia.org/wiki/Medical_imaging. Accessed November 17, 2011.
WIKIPEDIA, 2011. Medical imaging modalities. http://en.wikipedia.org/wiki/Medical_imaging. Retreived onNovember 17, 2011.
WIKIPEDIA, 2011. Mri. http://en.wikipedia.org/wiki/Magnetic_resonance_Imaging. Accessed November 17,2011.
WIKIPEDIA, 2011. Mri cranial scan. http://en.wikipedia.org/wiki/Magnetic_Resonance_Imaging. Retreived onNovember 16, 2011.
WIKIPEDIA, 2011. Parallel beam geometry. http://en.wikipedia.org/wiki/Tomographic_reconstruction. Re-treived on November 15, 2011.
WIKIPEDIA, 2011. Pet. http://en.wikipedia.org/wiki/Photon_emission_tomography. Accessed November 17,2011.
WIKIPEDIA, 2011. Pet scanner. http://en.wikipedia.org/wiki/Positron_emission_tomography. Retreived onNovember 17, 2011.
WIKIPEDIA, 2011. Pet scanner schema. http://en.wikipedia.org/wiki/Positron_emission_tomography. Retreived onNovember 17, 2011.
WIKIPEDIA, 2011. Radon trasform. http://en.wikipedia.org/wiki/Radon_transform. Retreived on November 15,2011.
WIKIPEDIA, 2011. Spect. http://en.wikipedia.org/wiki/SPECT. Accessed November 17, 2011.
WIKIPEDIA, 2011. Spect scanner. http://en.wikipedia.org/wiki/SPECT. Retreived on November 17, 2011.
WIKIPEDIA, 2011. Ultrasound scan of the kidney. http://en.wikipedia.org/wiki/Ultrasound. Retreived on November17, 2011.
WIKIPEDIA, 2011. Ultrasound scanner. http://en.wikipedia.org/wiki/Ultrasound. Retreived on November 17, 2011.
WIKIPEDIA, 2011. Us. http://en.wikipedia.org/wiki/Ultrasound. Accessed November 17, 2011.