data 101: introduction to data visualization
TRANSCRIPT

Data VisualizationData 101May 10th, 2016
Data 101. David Newbury — @workergnome 1

David NewburyProfessional nerd artist
@workergnomewww.workergnome.com
Data 101. David Newbury — @workergnome 2

What We're Doing Today:
—(Brief) History of Data Visualization—(Tiny) Theory of Visualization—(Nerdy) Overview of Concepts—(Fake) Data Exploration—(Incomplete) Overview of Tools
Data 101. David Newbury — @workergnome 3
What We're not Doing Today:
—Writing Code—Thinking about Mapping—Worrying about Data Provenance
Data 101. David Newbury — @workergnome 4

Which is biggest?
15012, 8271, 30193, 1189, 9913, 16000, 92481, 49801, 100407, 2910, 3809, 8018, 61528, 18083, 38691, 1800
Data 101. David Newbury — @workergnome 5

Which is biggest?
Data 101. David Newbury — @workergnome 6

Which is biggest?
Data 101. David Newbury — @workergnome 7

Why?Data 101. David Newbury — @workergnome 8

(Brief)History ofData Visualization
Data 101. David Newbury — @workergnome 9

Tabula Peutingeriana, 5th century CE
Data 101. David Newbury — @workergnome 10

Data 101. David Newbury — @workergnome 11

Rene Descartes, 1600s
Data 101. David Newbury — @workergnome 12

Joseph Priestly, New Chart of History (1769)
Data 101. David Newbury — @workergnome 13

William Playfair, (1786 & 1801)
Data 101. David Newbury — @workergnome 14

Data 101. David Newbury — @workergnome 15

Data 101. David Newbury — @workergnome 16
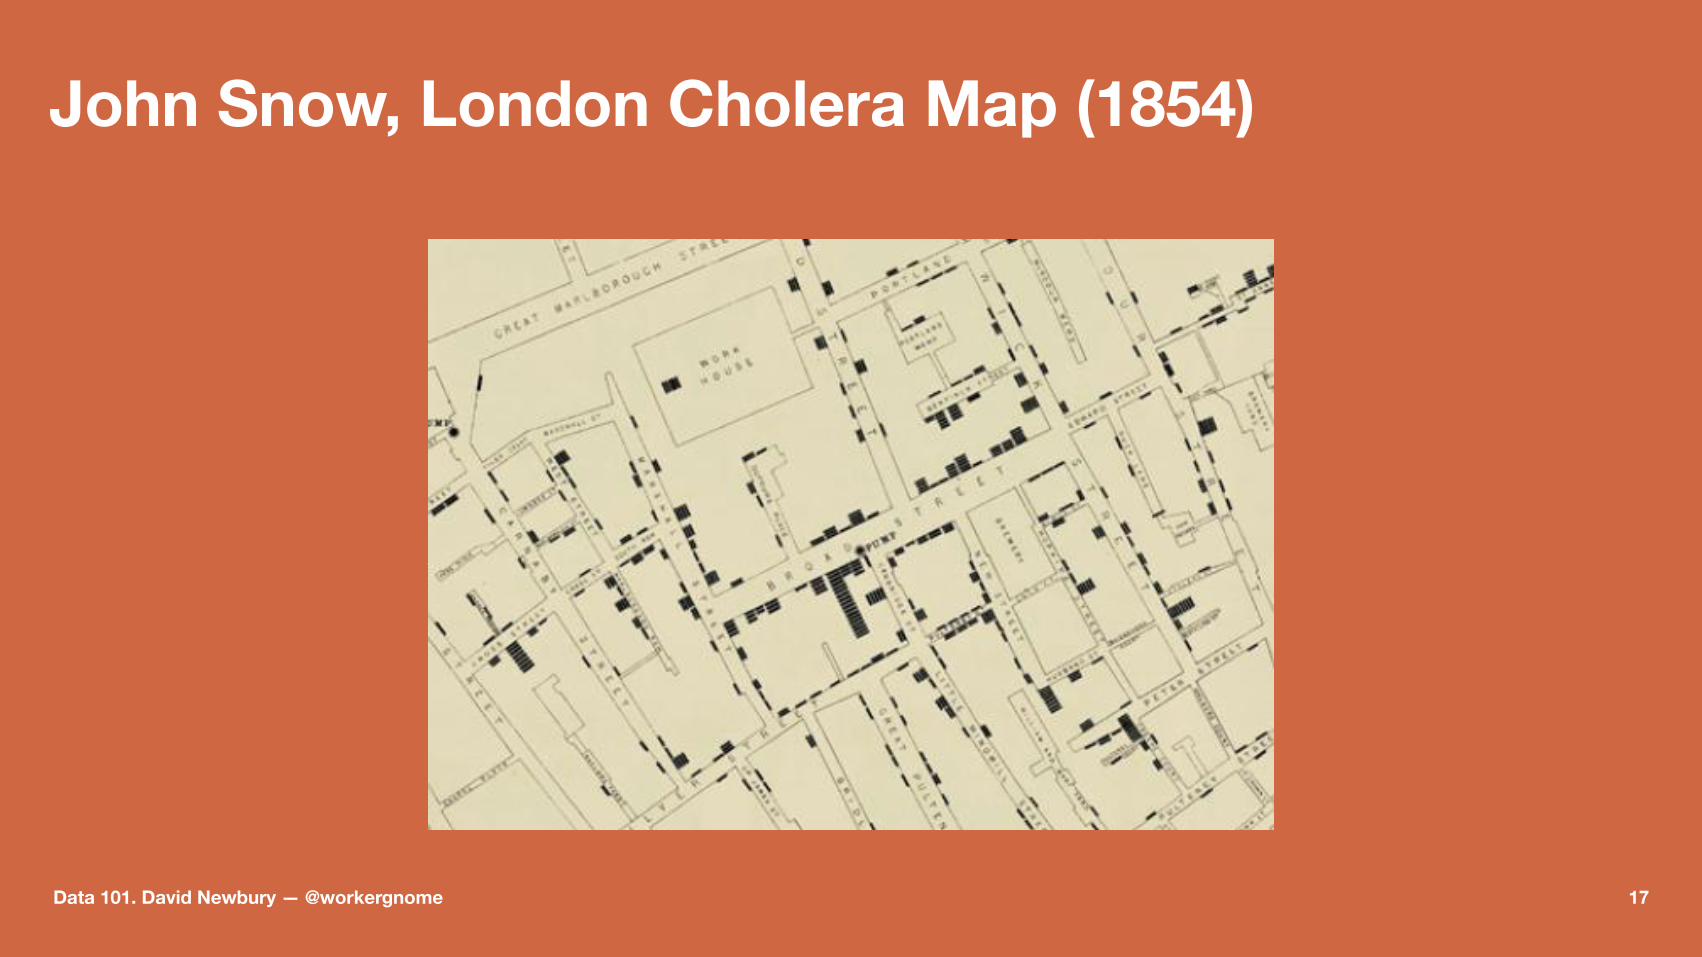
John Snow, London Cholera Map (1854)
Data 101. David Newbury — @workergnome 17
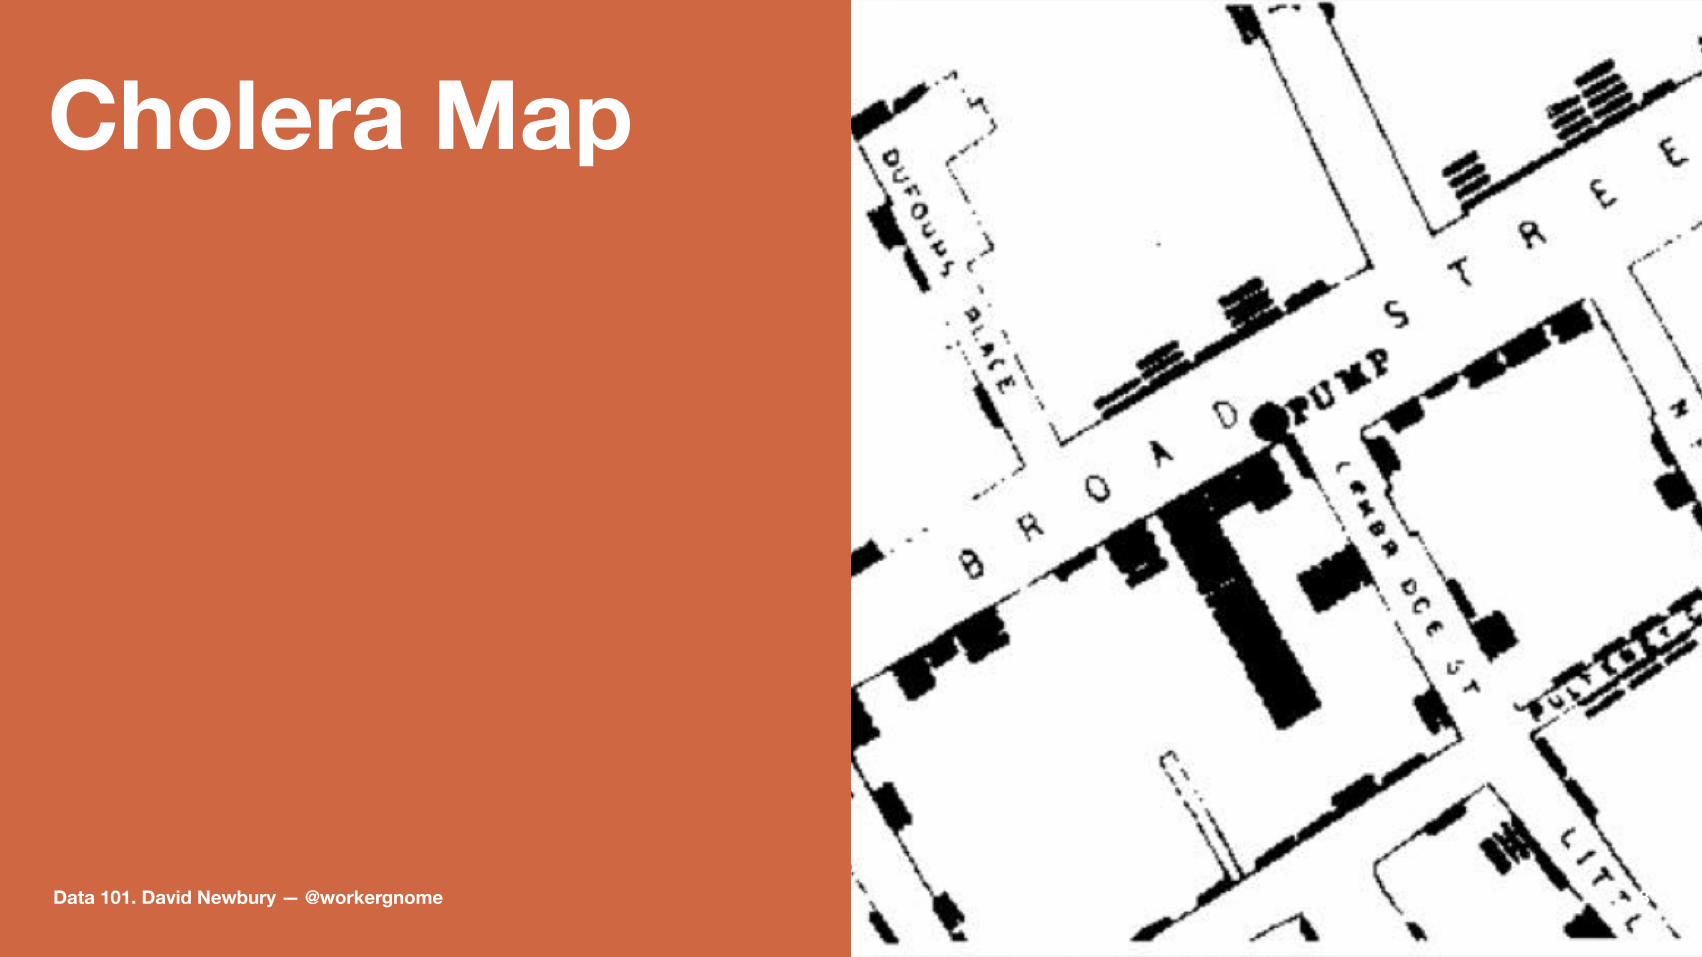
Cholera Map
Data 101. David Newbury — @workergnome 18

Florence Nightingale, War Deaths (1855)
Data 101. David Newbury — @workergnome 19
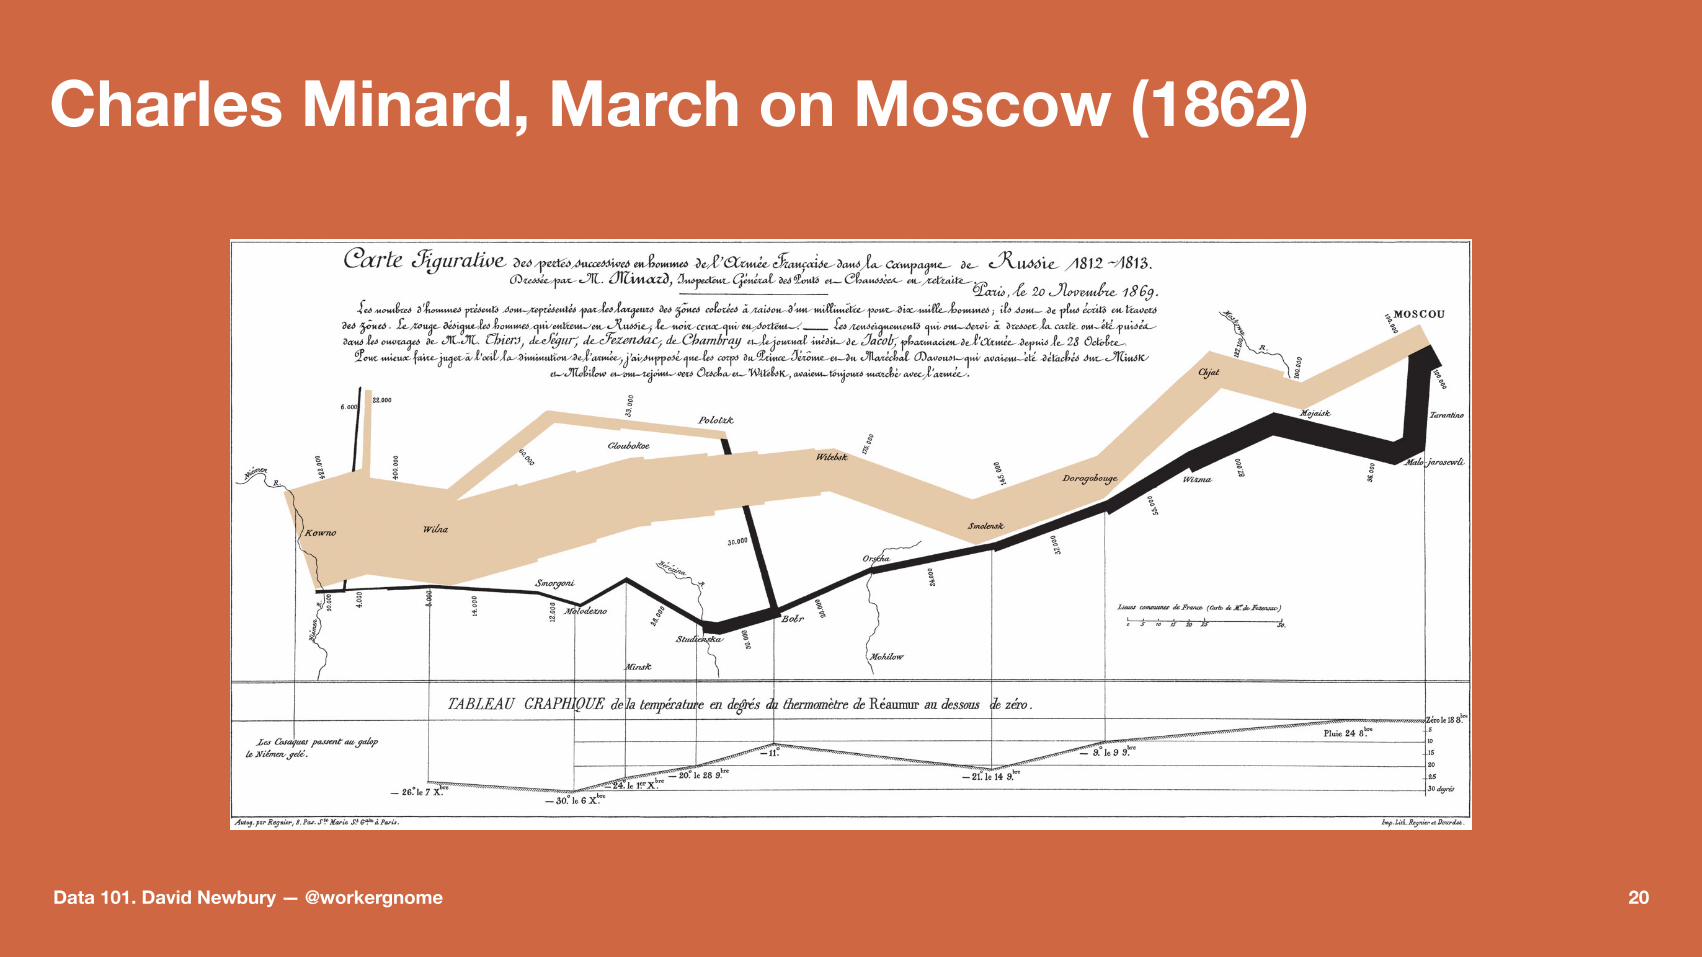
Charles Minard, March on Moscow (1862)
Data 101. David Newbury — @workergnome 20

More recent history.
Data 101. David Newbury — @workergnome 21

Data 101. David Newbury — @workergnome 22

Edward Tufte
The Visual Display of Quantitative Information.
Data 101. David Newbury — @workergnome 23

Data 101. David Newbury — @workergnome 24

New York Times
Data 101. David Newbury — @workergnome 25

Data 101. David Newbury — @workergnome 26

(tiny)
Theory of Visualization
Data 101. David Newbury — @workergnome 27

Dataviz is constructed reality.You are telling a story, not (just) stating facts.
Data 101. David Newbury — @workergnome 28

data artas opposed to
data visualization
as opposed to
statistical graphicsData 101. David Newbury — @workergnome 29

StatisticalGraphicsHow do I create Statistical Graphs in SAS 9.1.3 without Proc Gplot. UCLA: Statistical Consulting Group.http://www.ats.ucla.edu/stat/sas/notes2/Data 101. David Newbury — @workergnome 30

Data Art
Dear Data Giorgia Lupi & Stefanie Posavec.http://www.dear-data.com
Data 101. David Newbury — @workergnome 31

Two Uses1). help people grasp things outside their reach
Data 101. David Newbury — @workergnome 32

Two Uses1). help people grasp things outside their reach
2.) tell stories
Data 101. David Newbury — @workergnome 33

explanatory visualization work
as opposed to
exploratory visualizations
Data 101. David Newbury — @workergnome 34

Dataviz is constructed reality.Do you care how true your story is?
Do you care how accurate your story is?
Are you trying to teach, entertain, or convince?
Data 101. David Newbury — @workergnome 35

Data 101. David Newbury — @workergnome 36

Data 101. David Newbury — @workergnome 37

Data 101. David Newbury — @workergnome 38

Data 101. David Newbury — @workergnome 39

(Nerdy)Overview of Concepts
Data 101. David Newbury — @workergnome 40

What can you visualise?
Data 101. David Newbury — @workergnome 41

Potential Subjects.
subways, sheep, the solar system,shoes, sleep, skyline,snow, supermarket, sausages,school,the sea, spiders,staircases, syrup, soap,sawmills, stereos...
Data 101. David Newbury — @workergnome 42

Potential Subjects.
subways, sheep, the solar system,shoes, sleep, skyline,snow, supermarket, sausages,school,the sea, spiders,staircases, syrup, soap,sawmills, stereos...
...and other things that begin with S.
Data 101. David Newbury — @workergnome 43

Dimension and Scopeare about choosing what to focus on.
Data 101. David Newbury — @workergnome 44

Scope
Out of the infinite stories about any subject, which parts are you going to choose?
Data 101. David Newbury — @workergnome 45

Possible Scopes
All trains in a dayAll the rides that I've been on this yearMy train this morningAll of the stops in the cityEach lineEvery train stop in the past 50 years
Data 101. David Newbury — @workergnome 46

Dimension
Which bits of information about a subjectare you going to focus on?
Data 101. David Newbury — @workergnome 47

Possible Dimensions
number of carsduration of ridedate of a ridedifferent linesnumber of stopscost per ridenumber of stops per daytime between stopsData 101. David Newbury — @workergnome 48

What does yourdata look like?
Data 101. David Newbury — @workergnome 49

Types of Data
DatesNumbersGeo CoordinateStringsCategories
Data 101. David Newbury — @workergnome 50

Types of Data
number of cars - Numericduration of ride - Numericdate of a ride - Datedifferent lines - Categorynumber of stops - Numericcost per ride - Categorynumber of stops per day - Numerictime between stops - NumericData 101. David Newbury — @workergnome 51

Two (related ides):
Categories & measures
Data 101. David Newbury — @workergnome 52

Categories are Discrete Things
Measures are for Counting
Data 101. David Newbury — @workergnome 53

number of cars - Measureduration of ride - Measuredate of a ride - Measuredifferent lines - Categoriesnumber of stops - Measurecost per ride - Categoriesnumber of stops per day - Measuretime between stops - Measurecleanliness - Categories
Data 101. David Newbury — @workergnome 54

A hidden dimension:
David, Daniel, Dawn, Danique
Data 101. David Newbury — @workergnome 55

A hidden dimension:
David (1), Daniel (2), Dawn (3), Danique (4)
Position of the item in the group.
Data 101. David Newbury — @workergnome 56

(Fake)Data Exploration
Data 101. David Newbury — @workergnome 57

TRY IT.Data 101. David Newbury — @workergnome 58

Choose one.
subways, sheep, the solar system,shoes, sleep, skyline,snow, supermarket, sausages,school,the sea, spiders,staircases, syrup, soap,sawmills, stereos...
...and other things that begin with S.
Data 101. David Newbury — @workergnome 59

NowWhat?
Data 101. David Newbury — @workergnome 60

We need to map our datafrom a domainto a range.
Data 101. David Newbury — @workergnome 61

Domain
number of cars - 1...8duration of ride - 30 sec...2 hoursdate of a ride - - 24ft...200ftdifferent lines - Red line, Blue line, Green line, Silver Line, Yellow Linenumber of stops - **2..20cost per ride - "$2.50, $1.75, $3.00, $0.00"number of stops per day - ??...???Data 101. David Newbury — @workergnome 62

Range
Domain is the possible input values
Range is the possible output values
Data 101. David Newbury — @workergnome 63

Data3, 7, 10, 6, 2Position of the item in the group.
Domain[0-10][1-5]
RangeX: 400px Y: 800px
MappingX: item position Y: numeric value Data 101. David Newbury — @workergnome 64

Data3, 7, 10, 6, 2Position of the item in the group.
AreaData 101. David Newbury — @workergnome 65

Data3, 7, 10, 6, 2Position of the item in the group.
ColorData 101. David Newbury — @workergnome 66

Data3, 7, 10, 6, 2Position of the item in the group.
MultiplesDimensions
Data 101. David Newbury — @workergnome 67
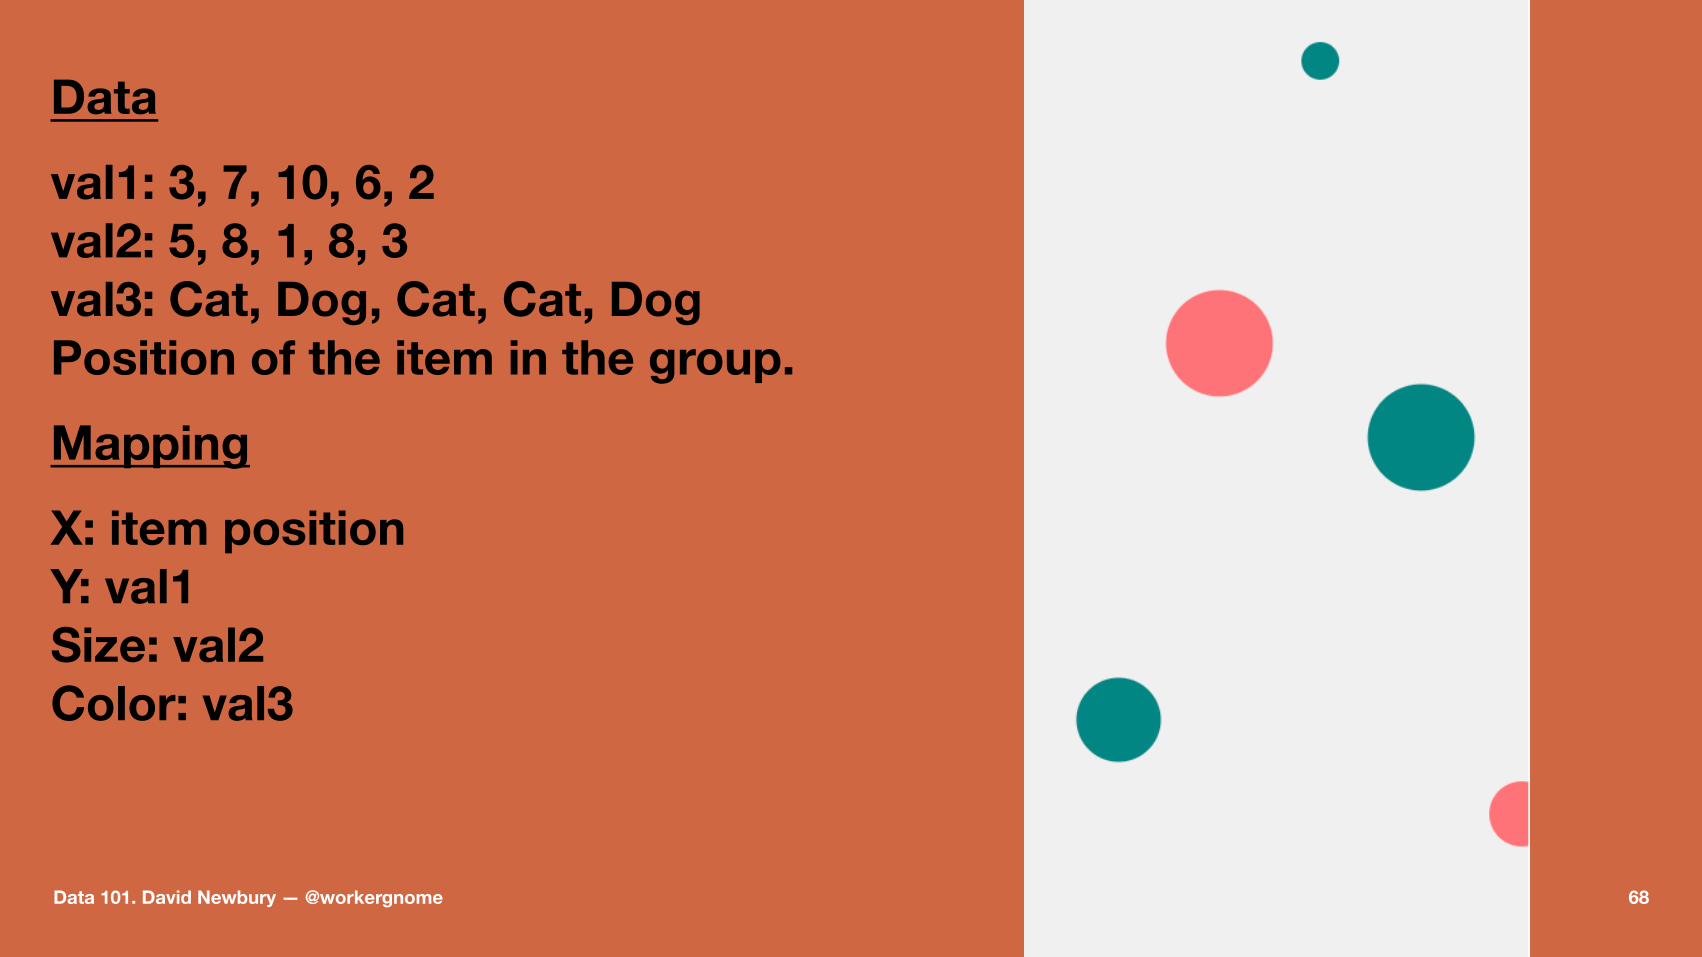
Dataval1: 3, 7, 10, 6, 2val2: 5, 8, 1, 8, 3val3: Cat, Dog, Cat, Cat, DogPosition of the item in the group.
MappingX: item position Y: val1 Size: val2 Color: val3
Data 101. David Newbury — @workergnome 68

Dimensions beyond X and Y.
ColorSizeShapeLabelsPatternsIconsAnything Else You Can Imagine
Data 101. David Newbury — @workergnome 69

TRY IT.Data 101. David Newbury — @workergnome 70

FinishingTouches
Data 101. David Newbury — @workergnome 71

Measures get AxisCategories get Headers
Data 101. David Newbury — @workergnome 72

Labels
Data 101. David Newbury — @workergnome 73

Axis
Category AxisNumber AxisDate AxisLog axis
Data 101. David Newbury — @workergnome 74

Legends
Data 101. David Newbury — @workergnome 75

TRY IT.Data 101. David Newbury — @workergnome 76

Review
DimensionsScope
DomainRange
CategoriesMeasures
Data 101. David Newbury — @workergnome 77

(Incomplete)
Overview of Tools
Data 101. David Newbury — @workergnome 78

Data 101. David Newbury — @workergnome 79

Data 101. David Newbury — @workergnome 80

Data 101. David Newbury — @workergnome 81

Data 101. David Newbury — @workergnome 82

Data 101. David Newbury — @workergnome 83
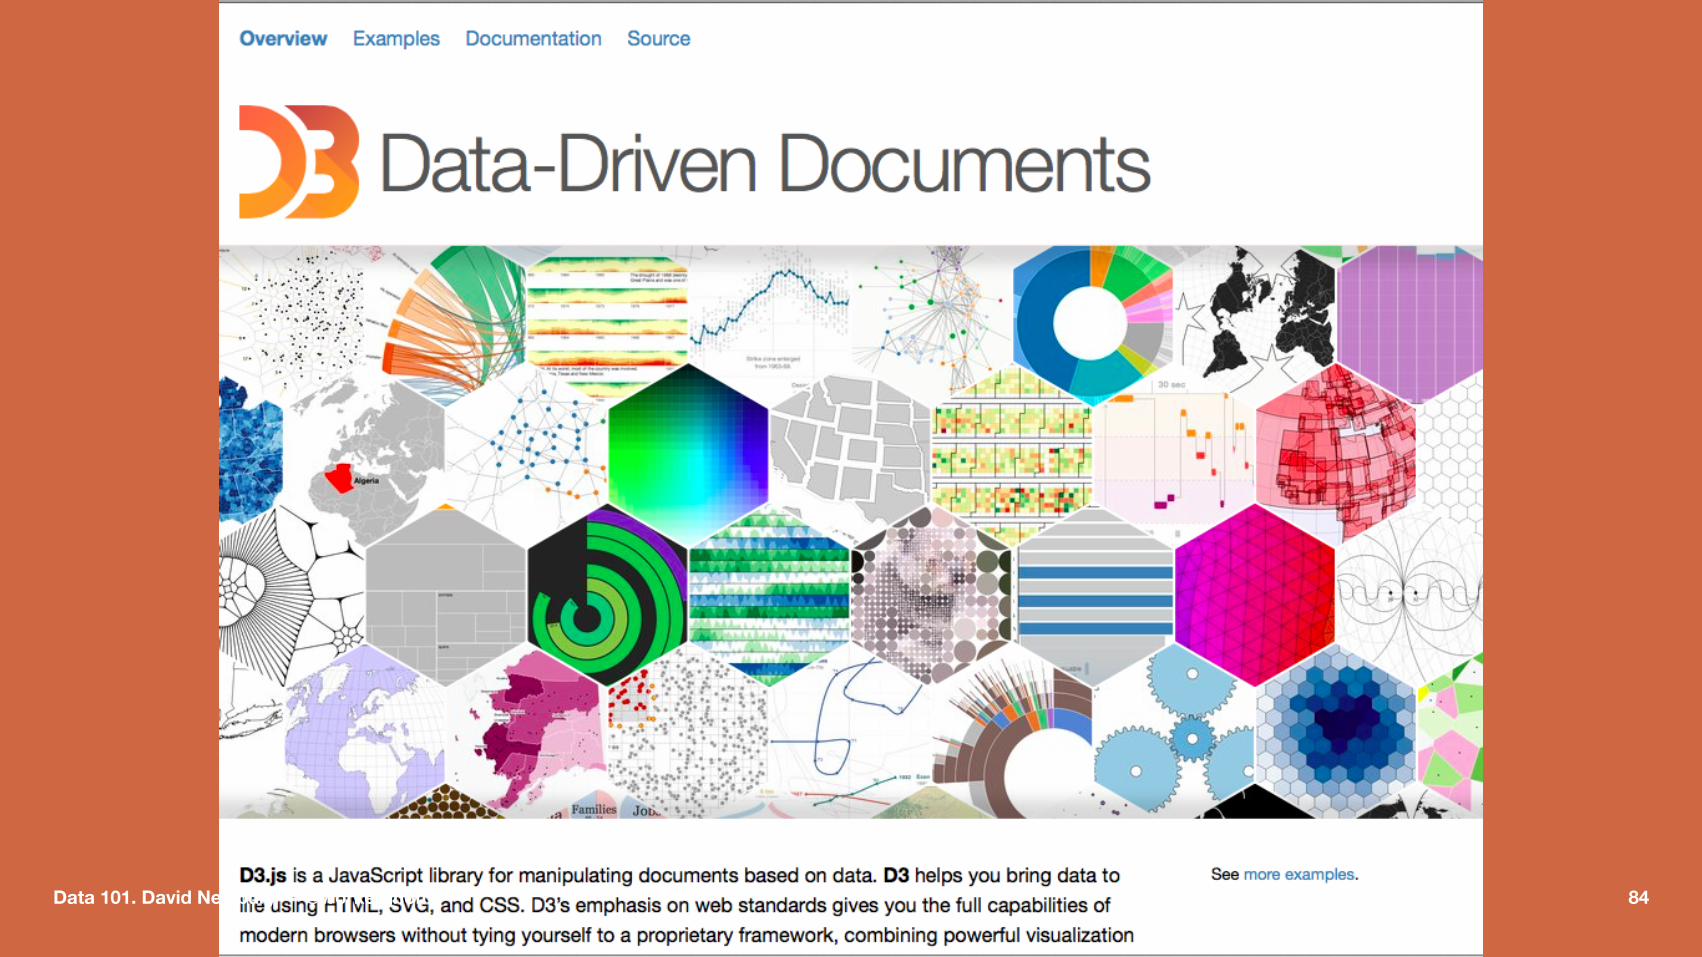
Data 101. David Newbury — @workergnome 84
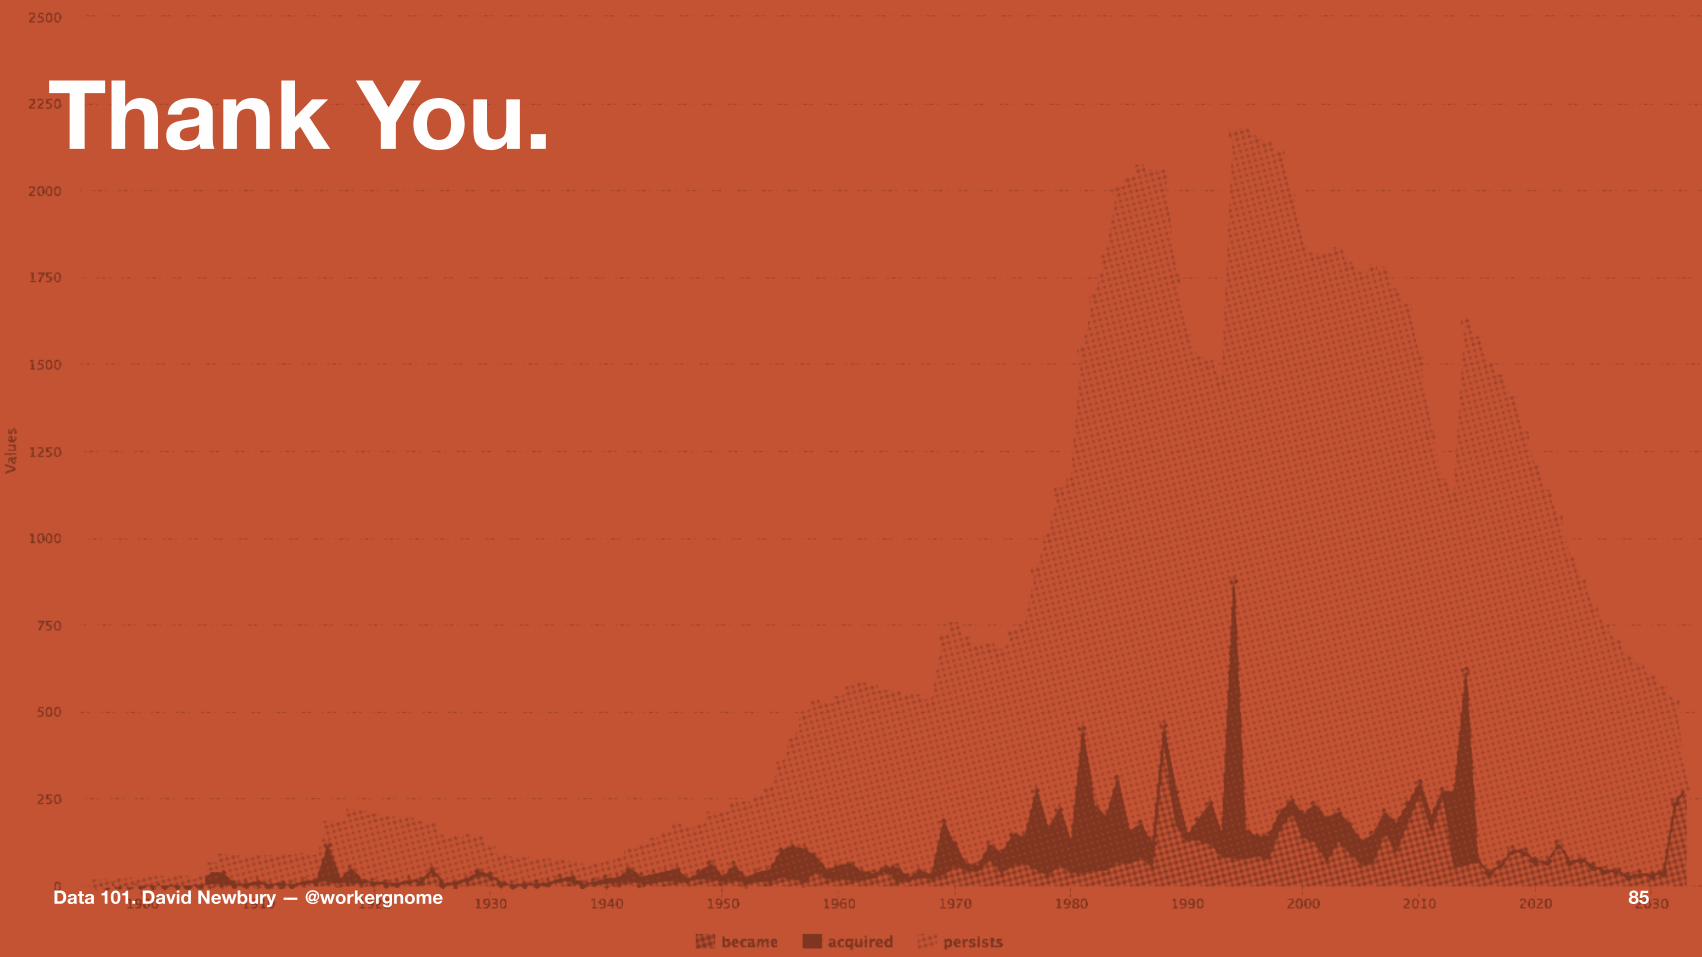
Thank You.
Data 101. David Newbury — @workergnome 85