dashboards and culture: how openness changes ... - jax devops · •managers can justify budget...
TRANSCRIPT
@spoole167@spoole167
Dashboards and Culture: How Openness changes your
BehaviorSteve Poole, IBM

@spoole167@spoole167
About me
Steve Poole
IBM Lead Engineer / Developer advocate
JVM Developer
Open Source Advocate
DevOps Practitioner (whatever that means!)
Driving Change

@spoole167@spoole167
How it all began
@spoole167@spoole167
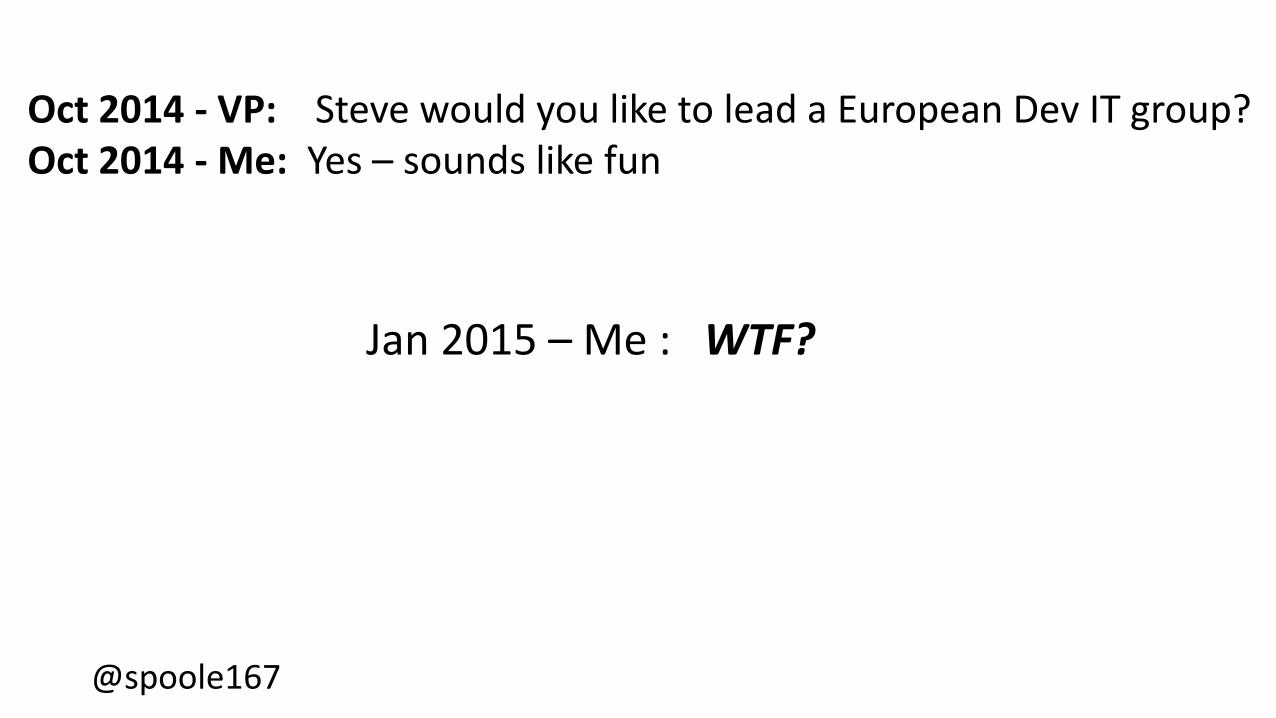
Oct 2014 - VP: Steve would you like to lead a European Dev IT group?Oct 2014 - Me: Yes – sounds like fun
Jan 2015 – Me : WTF?
@spoole167@spoole167
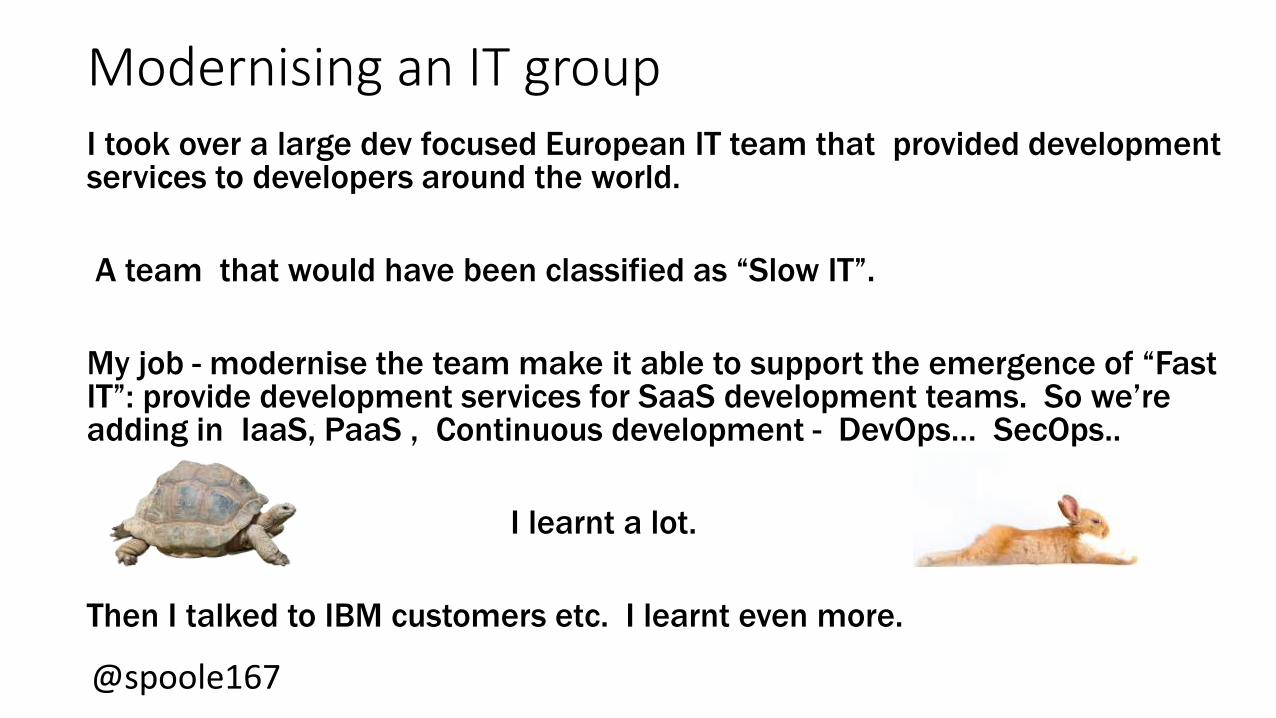
Modernising an IT groupI took over a large dev focused European IT team that provided development services to developers around the world.
A team that would have been classified as “Slow IT”.
My job - modernise the team make it able to support the emergence of “Fast IT”: provide development services for SaaS development teams. So we’re adding in IaaS, PaaS , Continuous development - DevOps… SecOps..
I learnt a lot.
Then I talked to IBM customers etc. I learnt even more.

@spoole167@spoole167
I learnt - executives are asking:
@spoole167@spoole167
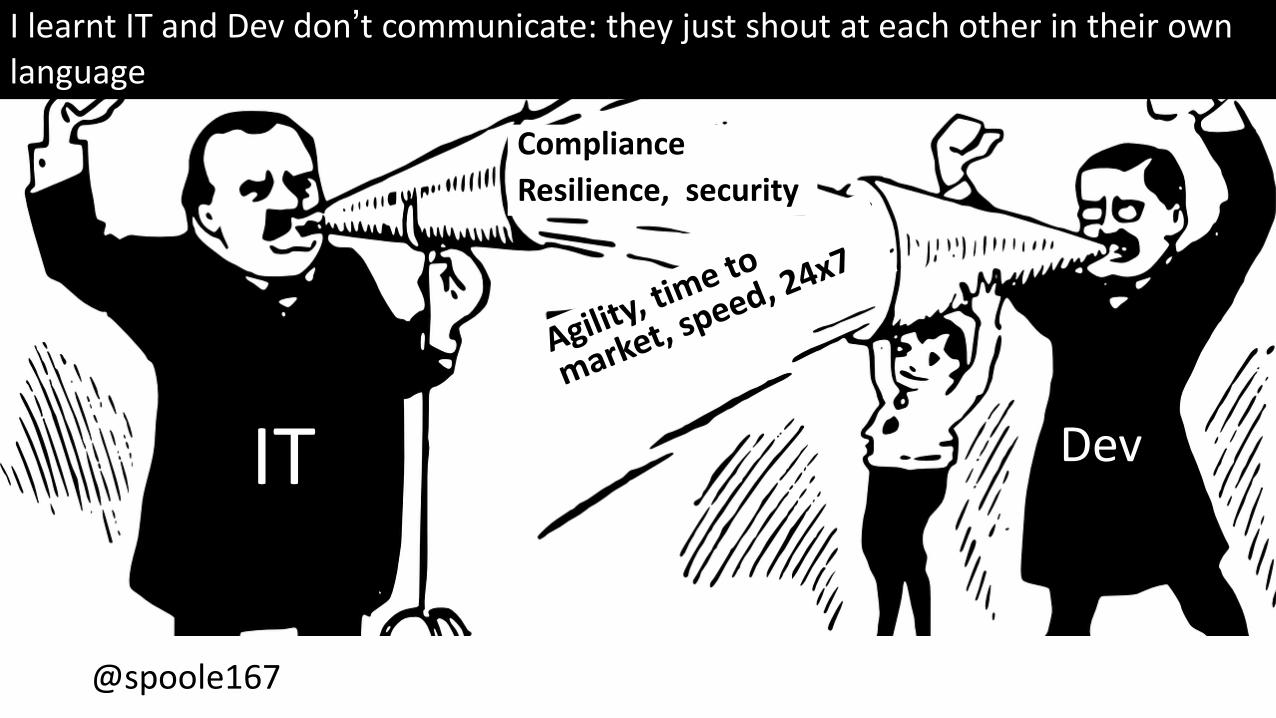
Compliance
Resilience, security
IT Dev
I learnt IT and Dev don’t communicate: they just shout at each other in their own language

@spoole167@spoole167
I understood – we just don’t share a common experience

@spoole167@spoole167
IT Dev
I learnt – making IT teams read the Phoenix Project can be counter productive
“I liked the book up and ‘til the partwhere they started to modernise”
“So you want me to putmyself out of a job?”

@spoole167@spoole167
IT
I realised – DevOps is about a new contract between Dev & Ops
A contract realised in new forms of self-service assets like PaaS or IaaS , Kubernetes, Docker etc
A contract that covers new availability requirements & speed to market
And like all good contracts it needs to be written down in a mutually agreeable language..

@spoole167@spoole167
Like a Dashboard

@spoole167@spoole167
What is a dashboard?

@spoole167@spoole167https://commons.wikimedia.org/wiki/File%3ANuclear_Ship_Savannah_-_Reactor_Control_Room_-_Center_and_Left_Panels.jpg
Reactor Control ?

@spoole167@spoole167https://www.flickr.com/photos/johnseb/ Bletchley Park,
Code Breaking ?
@spoole167@spoole167
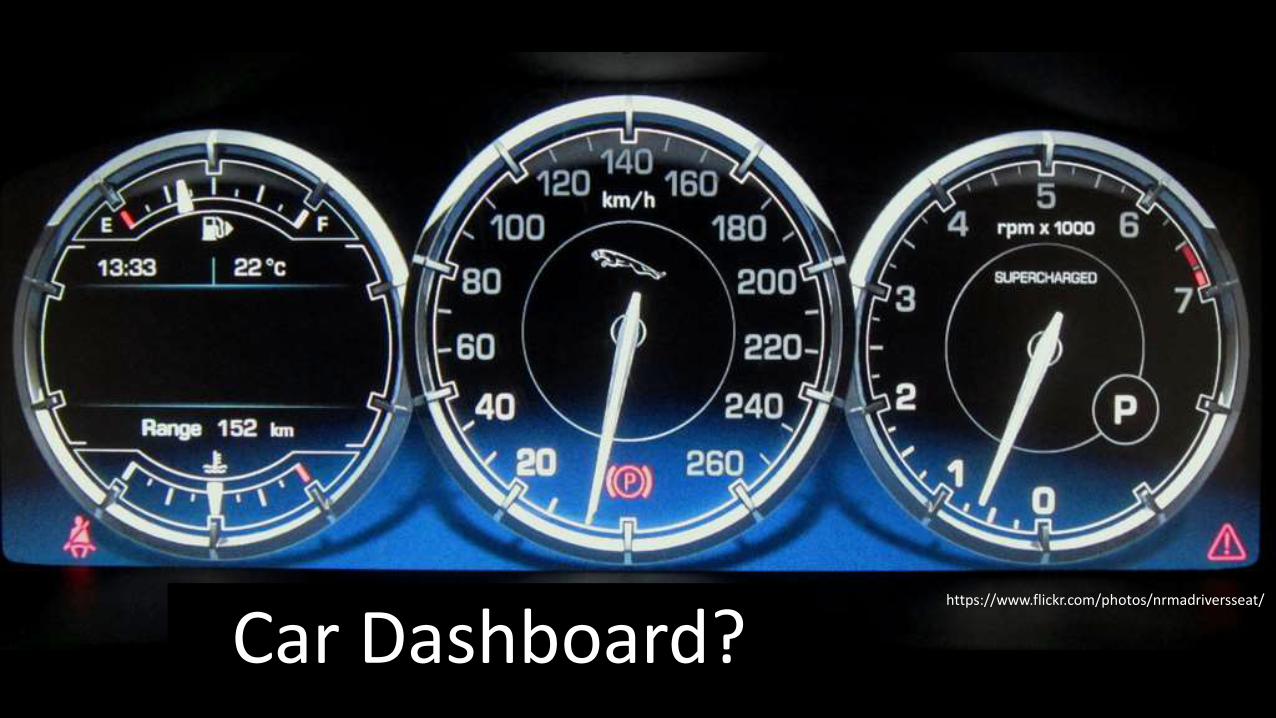
https://www.flickr.com/photos/nrmadriversseat/
Car Dashboard?
@spoole167@spoole167
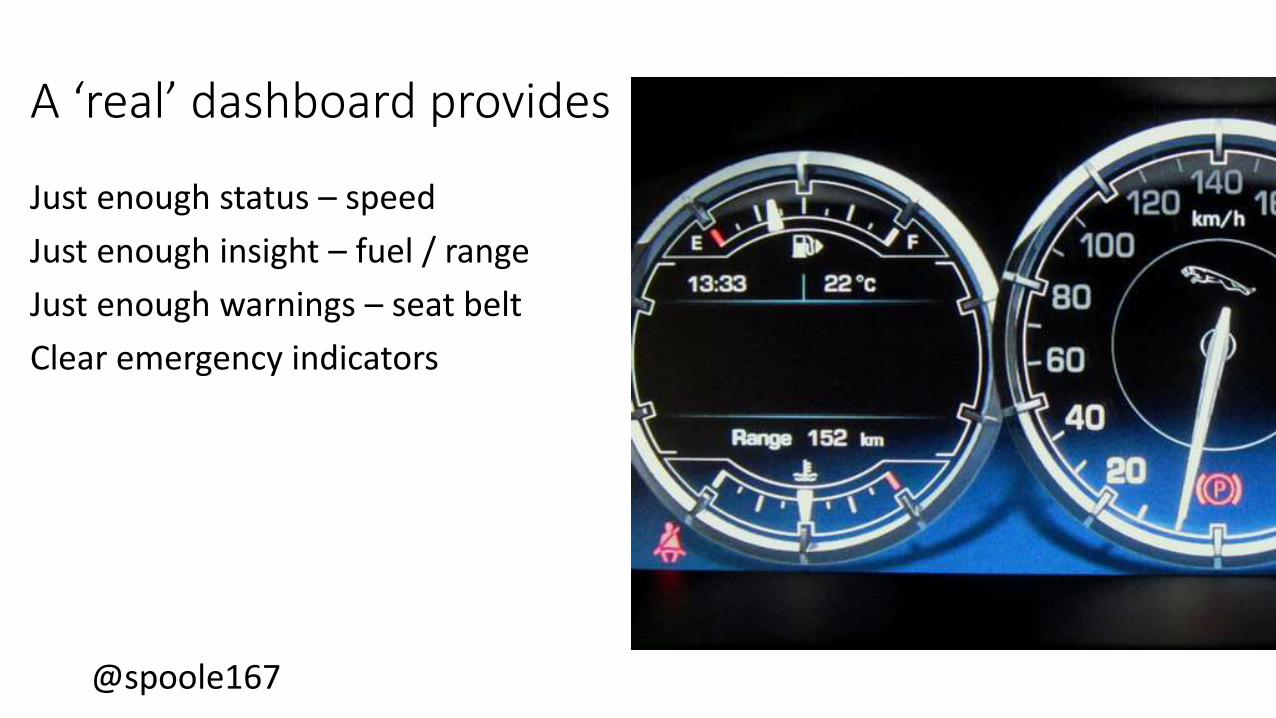
A ‘real’ dashboard provides
Just enough status – speed
Just enough insight – fuel / range
Just enough warnings – seat belt
Clear emergency indicators
@spoole167@spoole167
This talk is about why having effective dashboards improves pretty much everything.
(and why even bad dashboards can be informative)

@spoole167@spoole167
I really hate it when someone tells me I have a system that is down before I notice.

@spoole167@spoole167
I really hate it when someone tells me I have a system that is down before I notice.
Makes me feel like this

@spoole167@spoole167
How do you stop this…

@spoole167@spoole167

@spoole167@spoole167
Becoming this?

@spoole167@spoole167

@spoole167@spoole167
(especially when .. )

@spoole167@spoole167
This is fun!

@spoole167@spoole167
You start with something like this…

@spoole167@spoole167
Monitoring

@spoole167@spoole167
I challenged my monitoring team to do all that it took so that my group was always…

@spoole167@spoole167
“First to Know”
@spoole167@spoole167
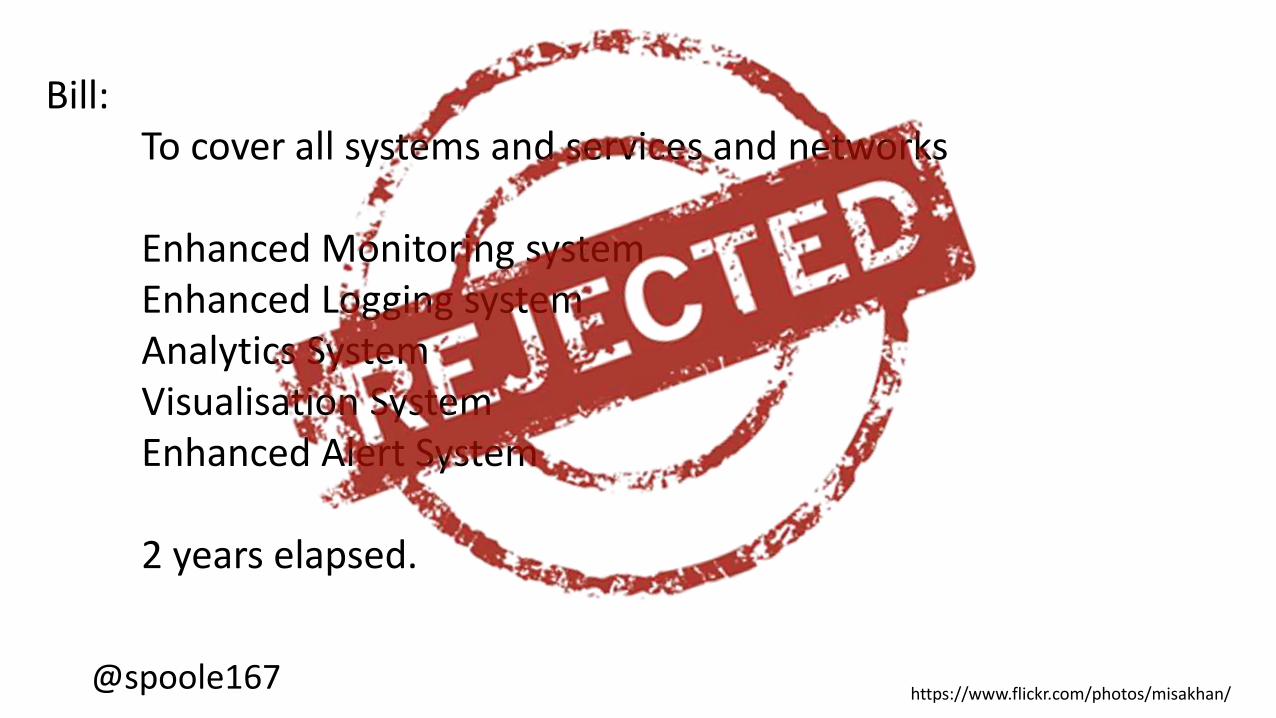
Bill:To cover all systems and services and networks
Enhanced Monitoring systemEnhanced Logging systemAnalytics SystemVisualisation SystemEnhanced Alert System
2 years elapsed.
https://www.flickr.com/photos/misakhan/
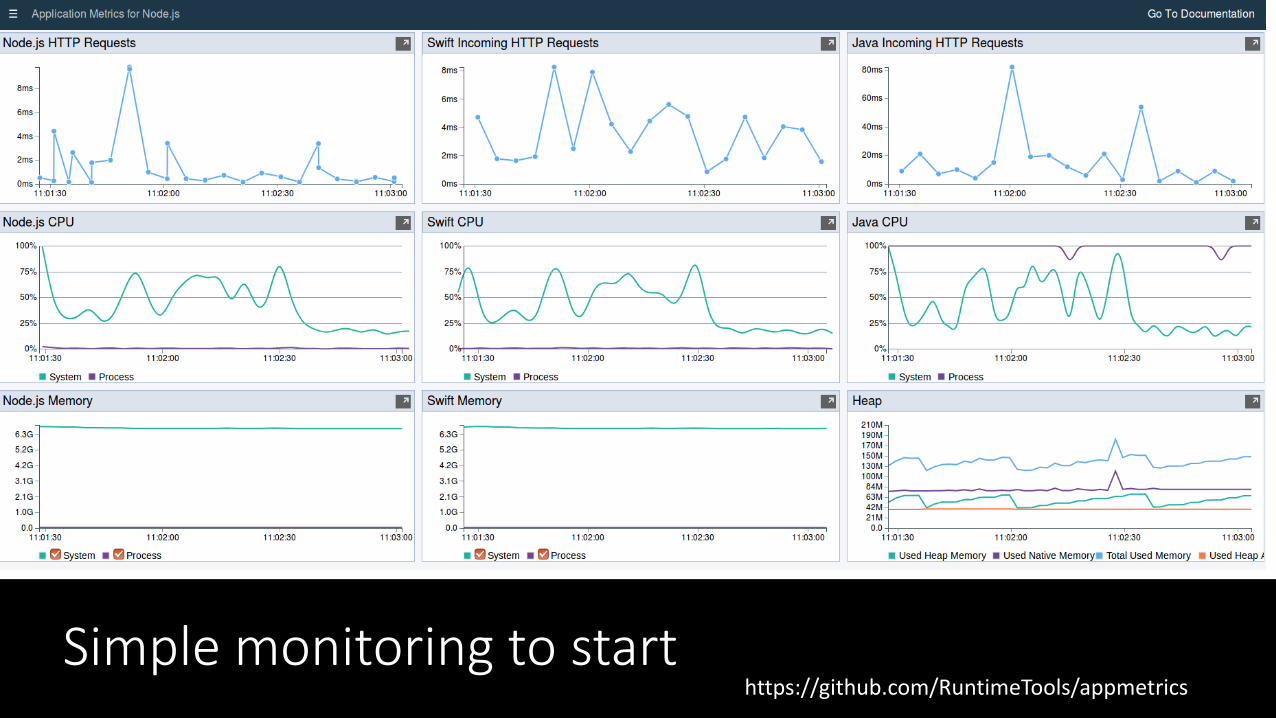
@spoole167@spoole167Simple monitoring to start
https://github.com/RuntimeTools/appmetrics

@spoole167@spoole167
@spoole167@spoole167
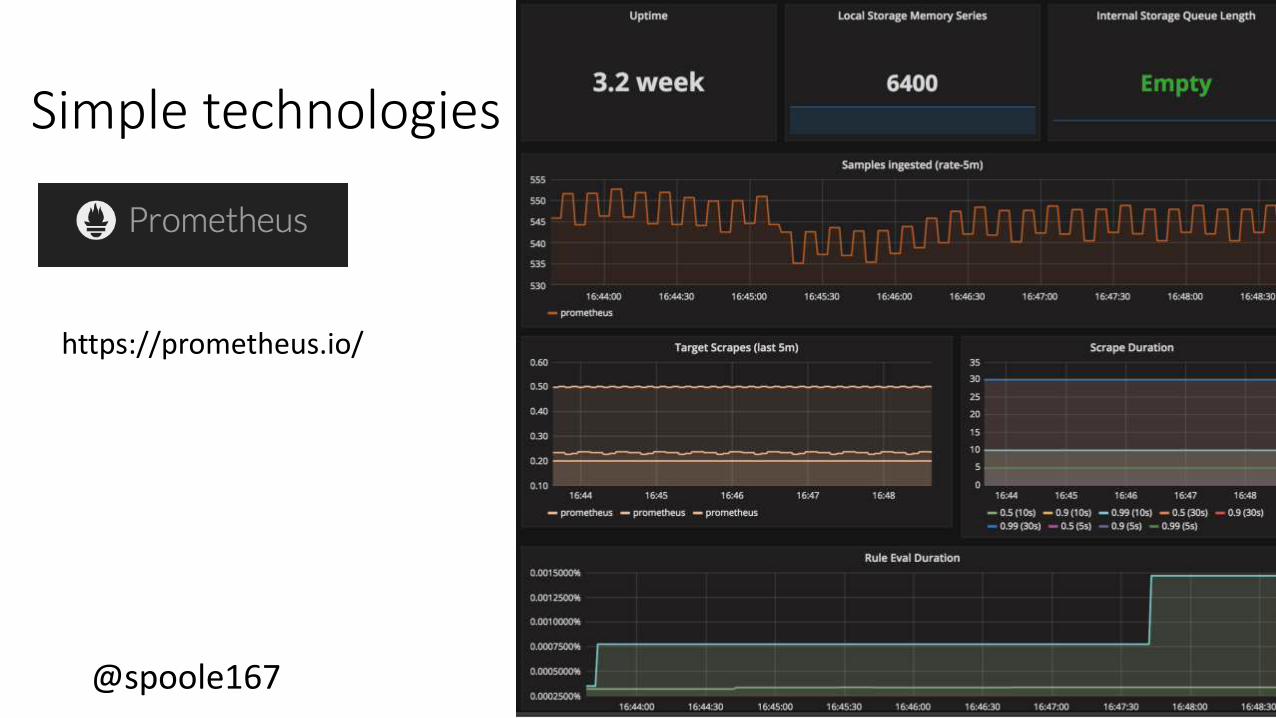
Simple technologies
https://prometheus.io/

@spoole167@spoole167
Even simpler technologies http://dashing.io/

@spoole167@spoole167
@spoole167@spoole167
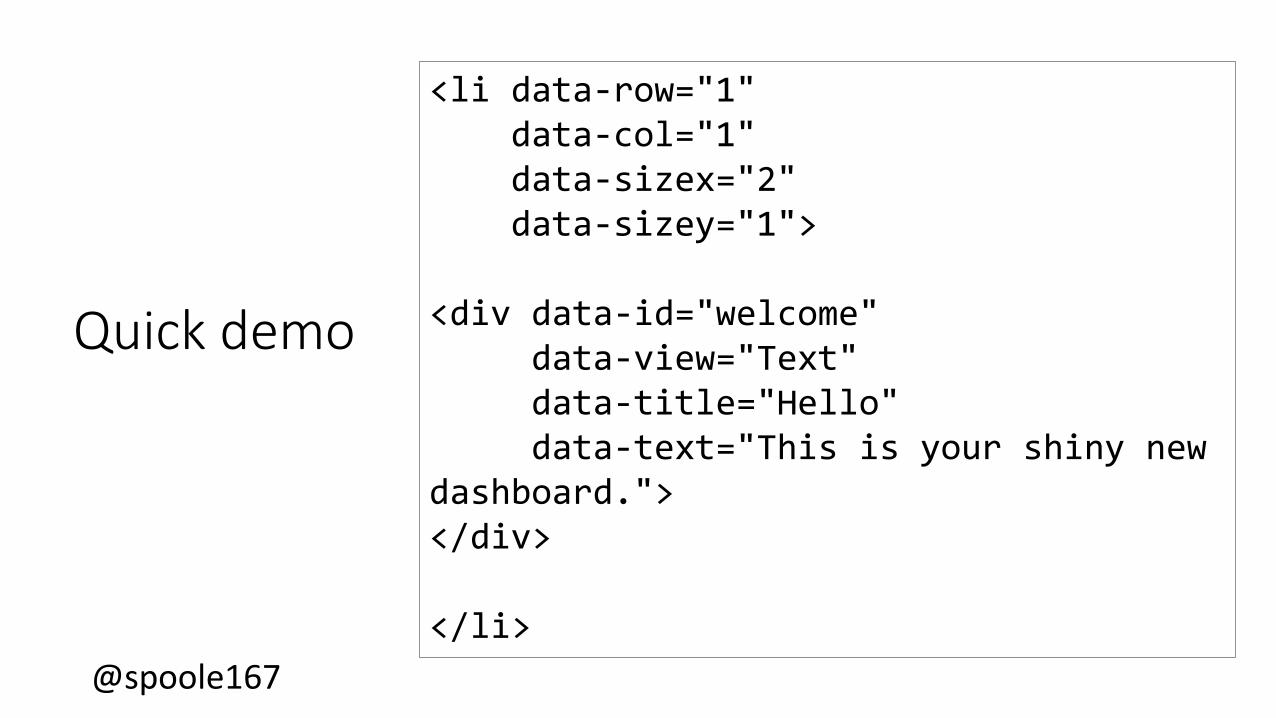
Quick demo
<li data-row="1" data-col="1" data-sizex="2" data-sizey="1">
<div data-id="welcome" data-view="Text" data-title="Hello" data-text="This is your shiny new
dashboard."></div>
</li>
@spoole167@spoole167
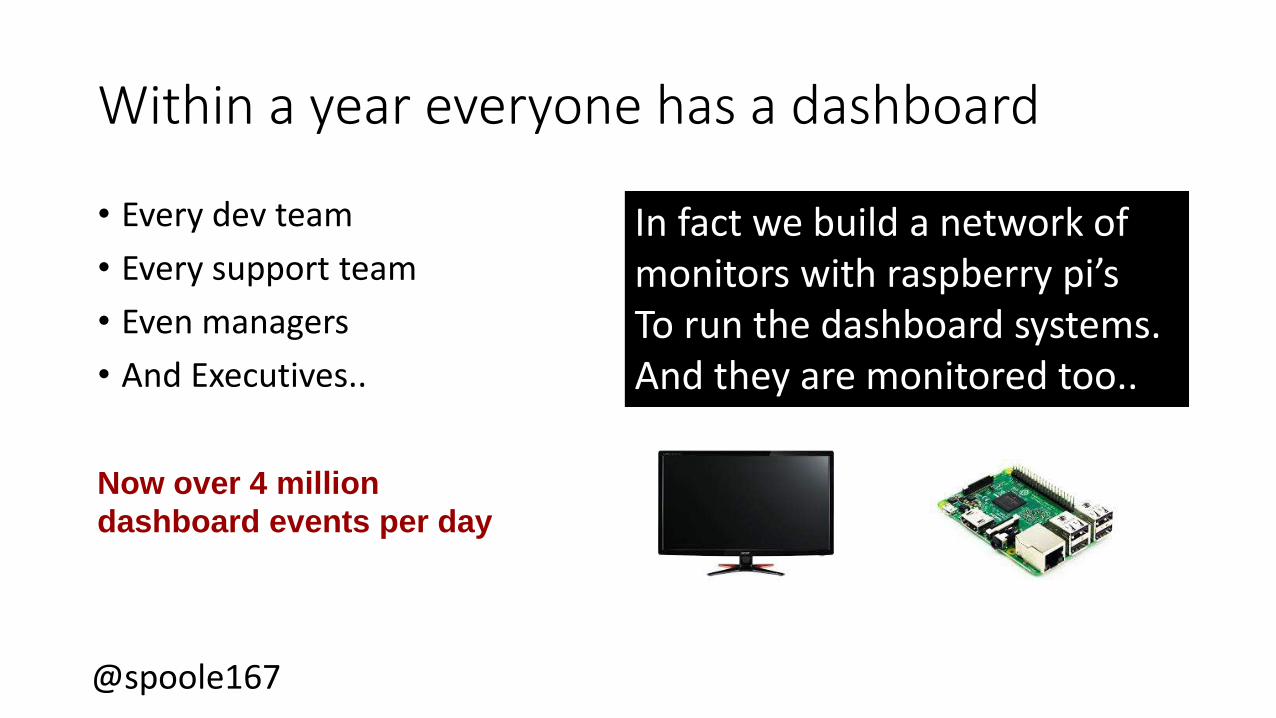
Within a year everyone has a dashboard
• Every dev team
• Every support team
• Even managers
• And Executives..
In fact we build a network of monitors with raspberry pi’sTo run the dashboard systems. And they are monitored too..
Now over 4 million
dashboard events per day

@spoole167@spoole167

@spoole167@spoole167
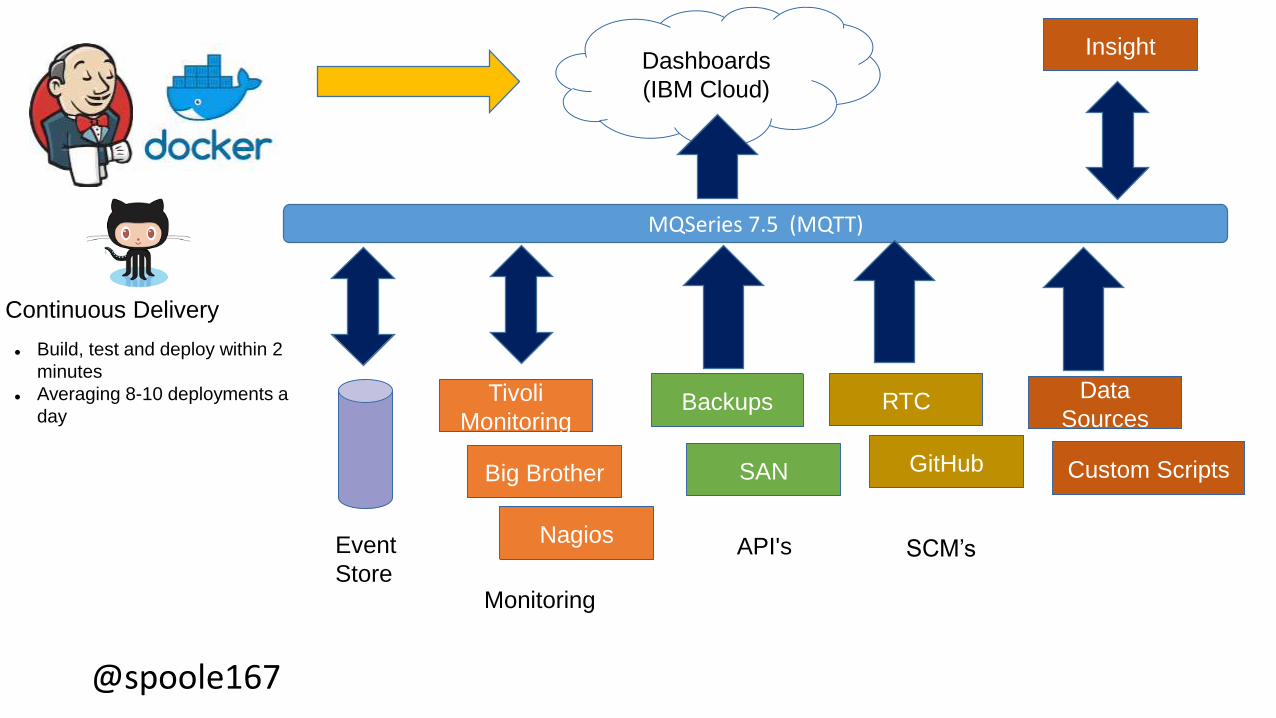
@spoole167@spoole167
MQSeries 7.5 (MQTT)
Event
Store
Tivoli
Monitoring
Nagios
Big Brother
Monitoring
Backups
SAN
API's
Custom Scripts
RTC
GitHub
SCM’s
Dashboards
(IBM Cloud)
Continuous Delivery
Build, test and deploy within 2
minutes
Averaging 8-10 deployments a
day
Data
Sources
Insight

@spoole167@spoole167
Case Studies
• Executive Dashboards
• Ticketing Dashboards
• Availability Dashboards
• Developer Dashboards
• Unusual Dashboards
• Closing the Loop…

@spoole167@spoole167
Executive Dashboards

@spoole167@spoole167 https://www.flickr.com/photos/ctsi-global/

@spoole167@spoole167
A battle ground
Executives want ’levers’ to pull
Endless reinvention as they look for new insights..
Middle management want to control the message and reduce the time spent ‘wasted’ on responding
Since (the elephant in the room) we all know the data is inaccurate, old and any predictions mostly useless
@spoole167@spoole167
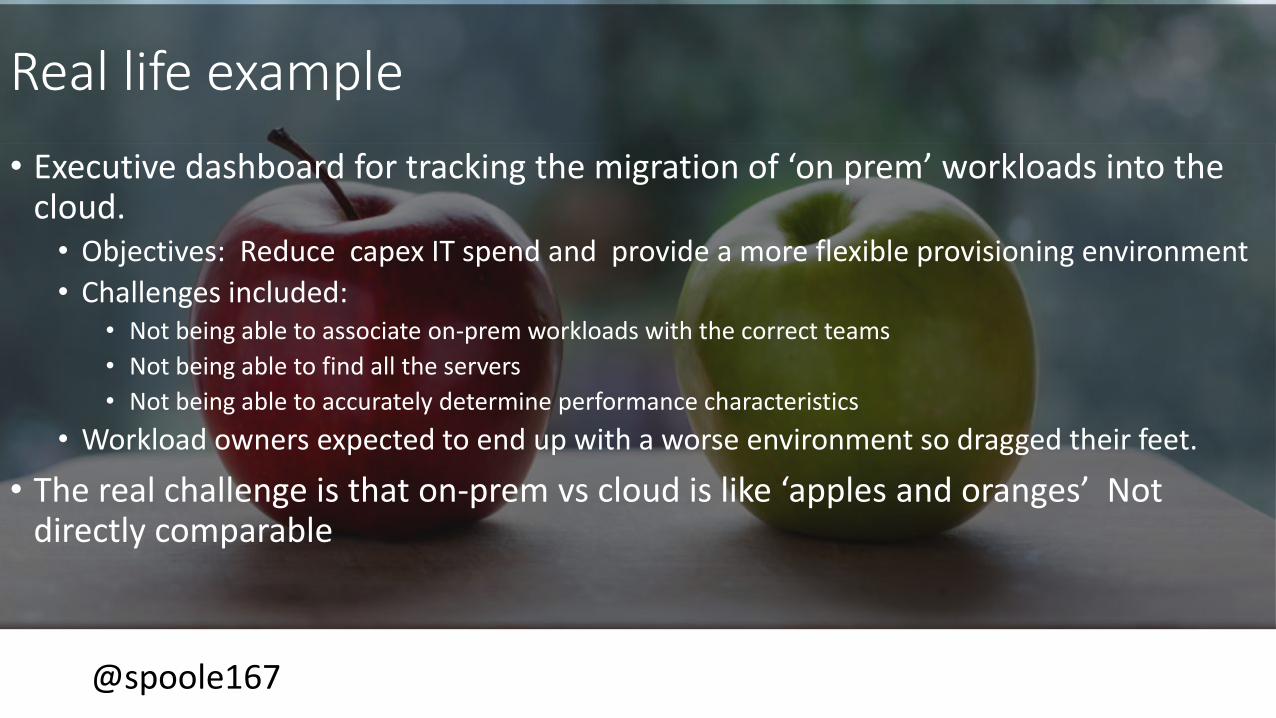
Real life example
• Executive dashboard for tracking the migration of ‘on prem’ workloads into the cloud.
• Objectives: Reduce capex IT spend and provide a more flexible provisioning environment
• Challenges included:• Not being able to associate on-prem workloads with the correct teams
• Not being able to find all the servers
• Not being able to accurately determine performance characteristics
• Workload owners expected to end up with a worse environment so dragged their feet.
• The real challenge is that on-prem vs cloud is like ‘apples and oranges’ Not directly comparable

@spoole167@spoole167
The solution• Some hard work to create the right
accounting structures
• Updates to the monitoring tools to take performance snapshots
• Classifications of the servers by type of workload
• Classification of the on prem workload in terms of cloud characteristics. CPU’s memory, multitenancy to bare metal etc
• An Executive dashboard that’s live and accurate 24x7
0
2
4
6
8
10
12
Team 1 Team 2 Team 3 Team 4
Un assessed On Prem Units Able to move moved

@spoole167@spoole167
Culture changes
• Better predictions of cost of moving workloads to cloud + classification = each team can realistically discuss the cost/benefit of moving their workloads to the cloud with Executives
• Managers can justify budget increases more effectively –they can show how there existing capacity is being used.
• And by shining a light into the use of machines the teams found workloads that were unexpected / more expensive / obsolete
• IT support now have an improved understanding of what their clients are using machines for.
• All teams now want and need the data to be accurate• Which leads to improved communications between teams and hence less shouting

@spoole167@spoole167
Ticketing Dashboards
@spoole167@spoole167
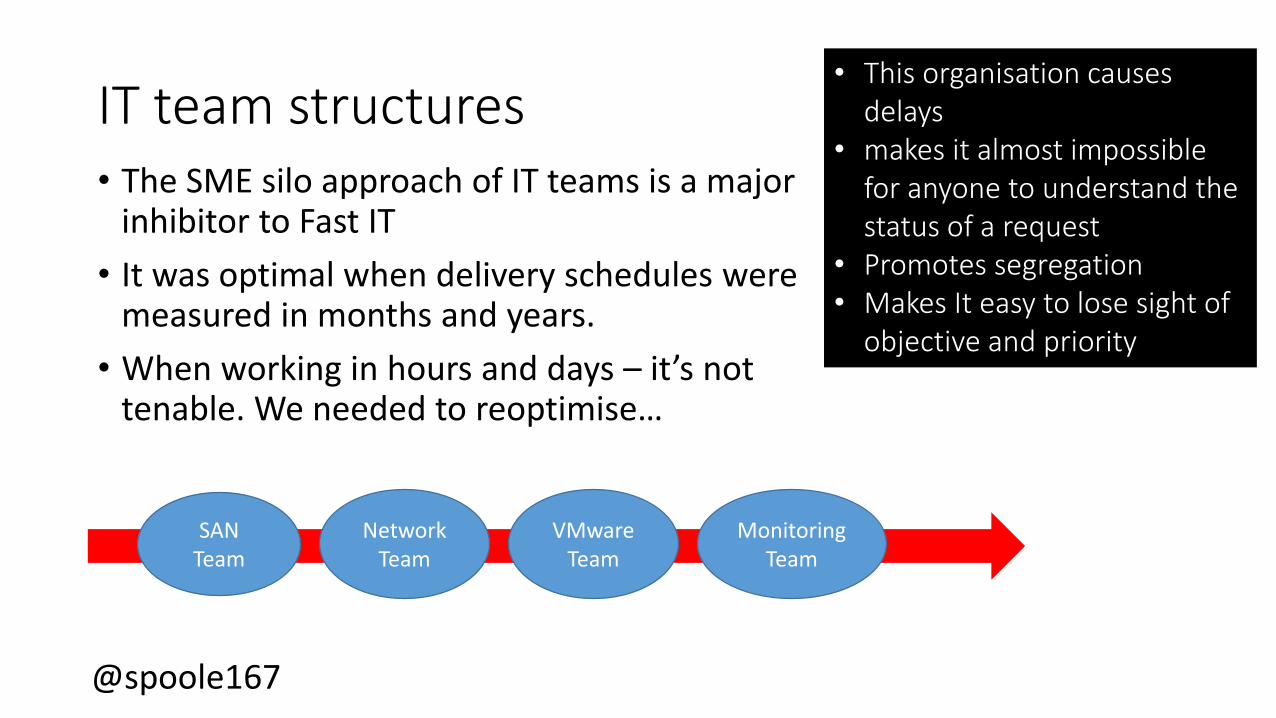
IT team structures • The SME silo approach of IT teams is a major
inhibitor to Fast IT
• It was optimal when delivery schedules were measured in months and years.
• When working in hours and days – it’s not tenable. We needed to reoptimise…
SAN Team
NetworkTeam
VMwareTeam
MonitoringTeam
• This organisation causes delays
• makes it almost impossible for anyone to understand the status of a request
• Promotes segregation• Makes It easy to lose sight of
objective and priority

@spoole167@spoole167
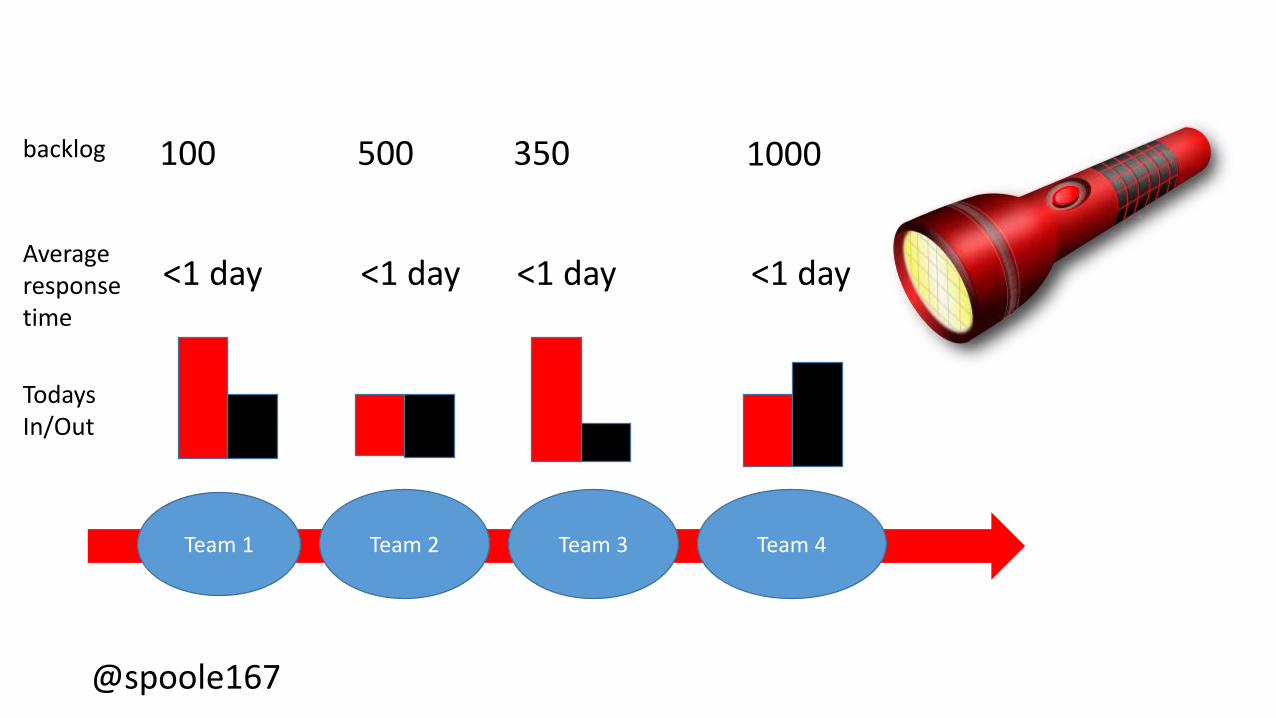
Solution – part 1• Spread a little light on the situation
• Measure what you have.
• Dashboard what you have.
• Dashboard what the teams think important
• Make the dashboards public
SAN Team
NetworkTeam
VMwareTeam
MonitoringTeam
@spoole167@spoole167
Team 1 Team 2 Team 3 Team 4
TodaysIn/Out
Average response time
<1 day <1 day <1 day <1 day
backlog 100 500 350 1000

@spoole167@spoole167
Solution – part 2 • List critical tickets
• Measure ticket end-to-end times
• How long to close 80% of the tickets
• Make the dashboards show trends & backlogs
• Highlight the different processes that each team uses
• Add in dashboards for tickets that are not owned by any of the teams
SAN Team
NetworkTeam
VMwareTeam
MonitoringTeam
Showing the real, overall picture from an end user point of view helped everyone see where the problems were

@spoole167@spoole167
-60
-40
-20
0
20
40
60
80
100
120
Jan Feb Mar Aprl
In Out Diff Backlog
@spoole167@spoole167
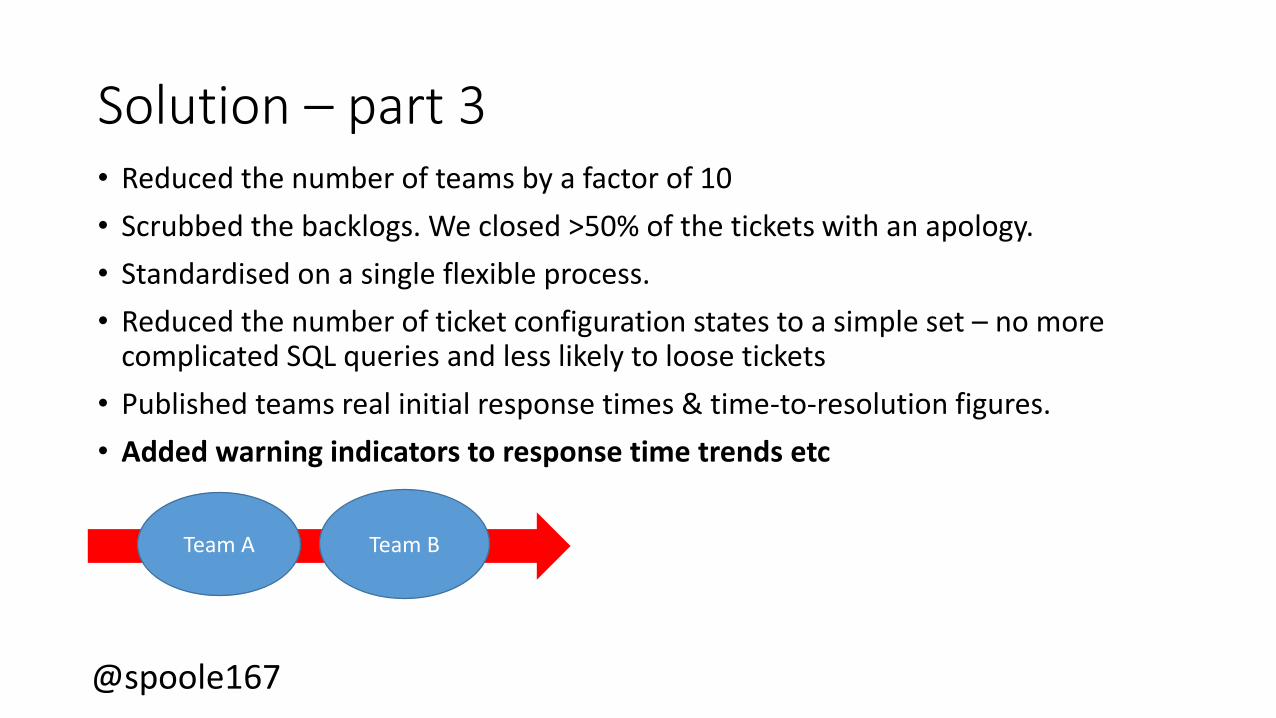
Solution – part 3 • Reduced the number of teams by a factor of 10
• Scrubbed the backlogs. We closed >50% of the tickets with an apology.
• Standardised on a single flexible process.
• Reduced the number of ticket configuration states to a simple set – no more complicated SQL queries and less likely to loose tickets
• Published teams real initial response times & time-to-resolution figures.
• Added warning indicators to response time trends etc
Team A Team B

@spoole167@spoole167
Result• End users could see reality – they knew how long it would really take to get
something done.
• They could see that the teams were prioritizing and working effectively
• And by being brutal and closing old tickets we could focus on the newest and most important ones. The Dev IT teams now felt they could tackle reducing backlogs – more happy bunnies
• Management Team can now monitor team performance and help when times slip or backlog starts to grow.
Team A Team B

@spoole167@spoole167
Availability Dashboards
@spoole167@spoole167
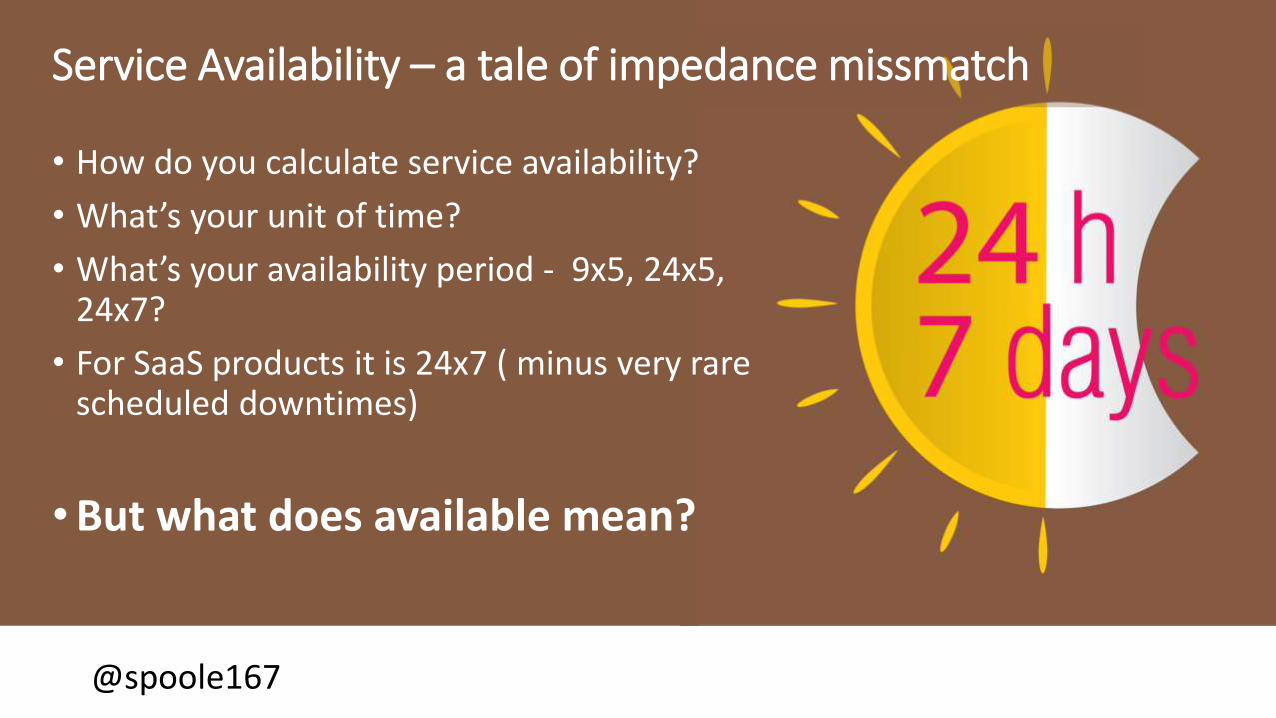
Service Availability – a tale of impedance missmatch
• How do you calculate service availability?
• What’s your unit of time?
• What’s your availability period - 9x5, 24x5, 24x7?
• For SaaS products it is 24x7 ( minus very rare scheduled downtimes)
• But what does available mean?

@spoole167@spoole167
Development IT team• Provides a critical service to developers
• Asked to provide 24x7 support
• Dev IT: “we already do that”
• Dev teams beg to differ – service has regular downtimes..
• Dev IT : “Our availability calculations don’t have to include regular scheduled downtimes”
• Dev (and me) WTF?
• what about all these other unexpected downtimes?
• Dev IT : “They are caused by events beyond our control and so are not included”
• Dev (and me) WTF?

@spoole167@spoole167
Insight - Iceberg syndrome
• Many IT groups revolve around the SME
• Items move from one to another to get completed so very few people have a vision of an IT service as perceived by the end user.
• Published data is more for the service providers use than the end user
• End users think they are dealing with an IT department – but in reality they are dealing with a small handful of people who have responsibility for a part of the service.

@spoole167@spoole167
Solution• Have the IT team understand they are responsible
for reporting the availability of their service whatever the cause of downtime.
• Have the IT team spend time with their users to see what can be done to mitigate the impact of scheduled downtimes
• Defined what available meant (hint not just pingable)
• Provided dashboards that show the current availability , scheduled downtimes and what actions are happening to recover from unexpected outages

@spoole167@spoole167

@spoole167@spoole167
@spoole167@spoole167
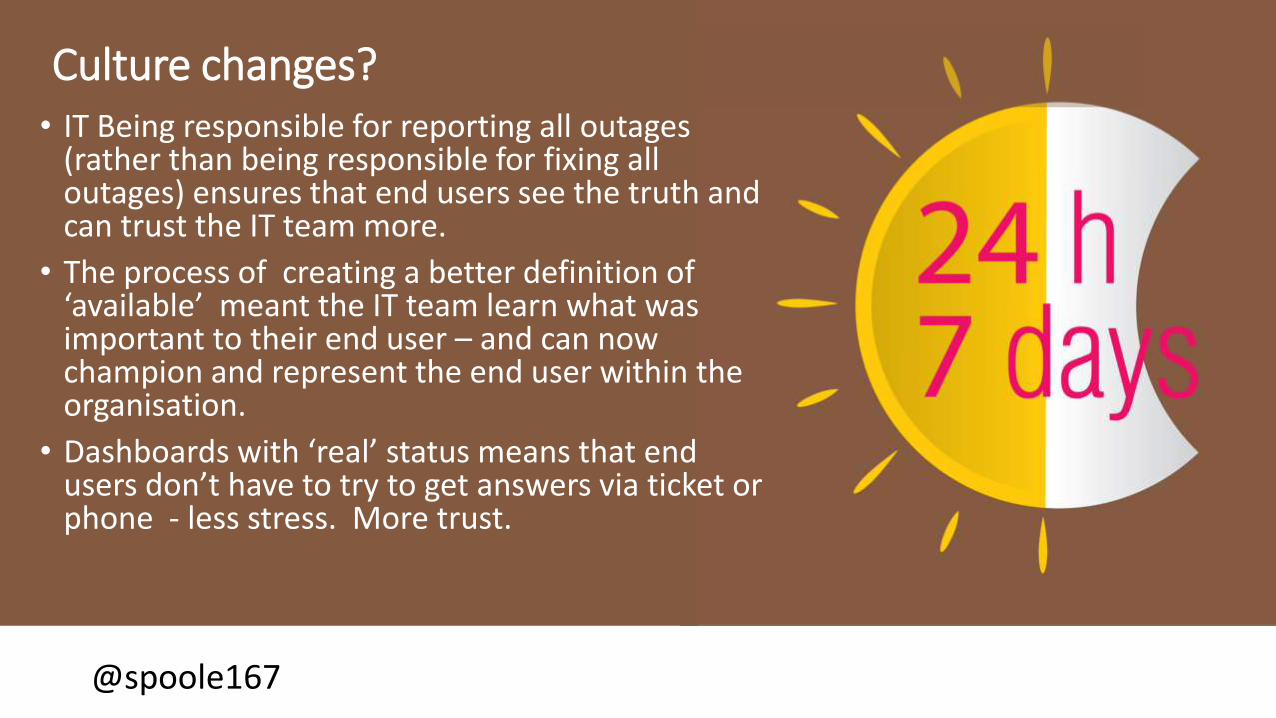
Culture changes?• IT Being responsible for reporting all outages
(rather than being responsible for fixing all outages) ensures that end users see the truth and can trust the IT team more.
• The process of creating a better definition of ‘available’ meant the IT team learn what was important to their end user – and can now champion and represent the end user within the organisation.
• Dashboards with ‘real’ status means that end users don’t have to try to get answers via ticket or phone - less stress. More trust.

@spoole167@spoole167
Developer Dashboards

@spoole167@spoole167
@spoole167@spoole167

@spoole167@spoole167
Unusual Dashboards
@spoole167@spoole167
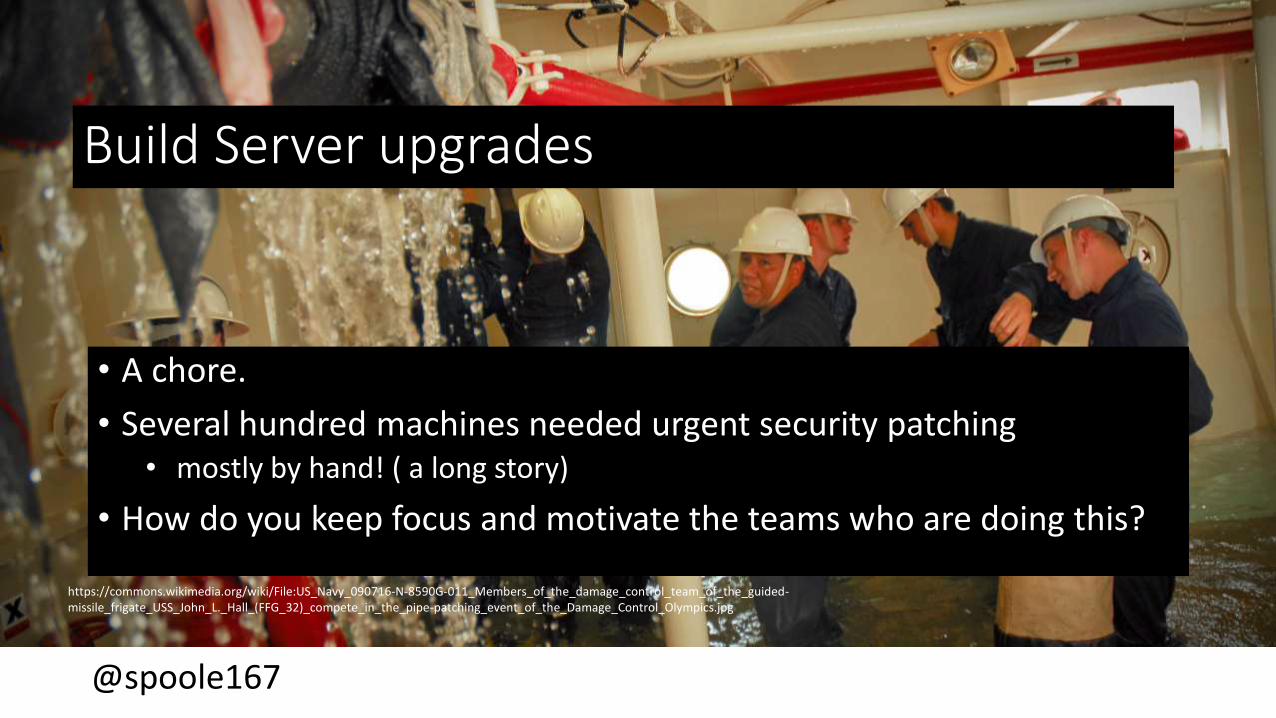
Build Server upgrades
• A chore.
• Several hundred machines needed urgent security patching• mostly by hand! ( a long story)
• How do you keep focus and motivate the teams who are doing this?
https://commons.wikimedia.org/wiki/File:US_Navy_090716-N-8590G-011_Members_of_the_damage_control_team_of_the_guided-missile_frigate_USS_John_L._Hall_(FFG_32)_compete_in_the_pipe-patching_event_of_the_Damage_Control_Olympics.jpg
Navy Pipe Patching event

@spoole167@spoole167
You make it a competition
Navy Pipe Patching event
Team A
Team B
Team C
Team D
Team E

@spoole167@spoole167
Diagnostic ’one-off’ dashboard
Jenkins build server problems..
@spoole167@spoole167
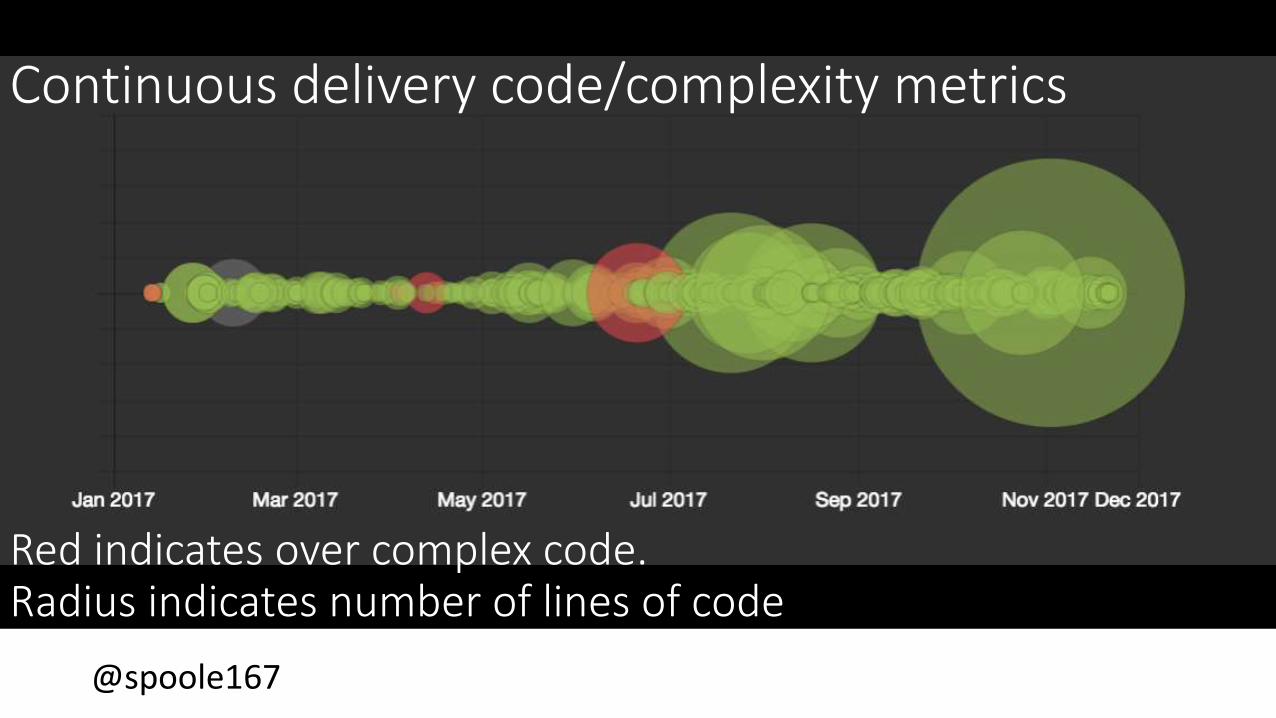
Continuous delivery code/complexity metrics
Red indicates over complex code.Radius indicates number of lines of code

@spoole167@spoole167
Closing the Loop

@spoole167@spoole167
We’re experimenting with integrated, shared dashboards
• One Dashboard shared between a SaaS customer, development teams, sales and executives.
• Customers can see exactly what’s going on and are now part of the process.
• Live playbacks (with the customer leading over webex, zoom, etc
• One Dashboard shared between development teams, sales and executives
• Customer insights: renewals, profitability status, general ‘temperature’ etc
• Allows sales teams to be fully aware of customer situation – reduces
• One Executive Dashboard giving a connected, live, view of the relationship between IBM and its customers

@spoole167@spoole167
Did I get my ”First to know”?

@spoole167@spoole167
Sort of
• Most teams now look at their dashboards instead of monitoring emails, tickets etc.
• But so do our clients
• So it’s more that we know together
• But most importantly..• Our customers know we know.• They understand how we work and they can see us working• Mutual trust through openness..
• Teams feel more empowered, more in control of their work
• Know they are doing the right thing

@spoole167@spoole167
Summary
@spoole167@spoole167
What did you originally expect to get from using a dashboard?• A quicker way to see if any of our servers go down so that we would
know before the users.
• Immediate and regular insights into metrics important to our daily operation
• To help us spot broken Jenkins builds quickly.
@spoole167@spoole167
Are you using dashboards in different ways than expected?• They also tell us if any of the servers are running slow, are busy, or are
down for scheduled maintenance
• our customers use the dashboards so they know that we know if there is a problem with their server - and so they can see more quickly when it is available after a scheduled outage.
• we are using it to give a very quick overview of our ticket backlog -something which we never expected to do.
• My squad now has a separate dashboard which we use as a quick-reference source to help us plan day-to-day to spot high-importance bugs / production bugs / new pull requests etc

@spoole167@spoole167
how has having dashboards changed your team(s) behavior?• we are in much better control of issue levels, pull requests, critical
issues etc
• Having dashboards permanently on display is less important than inspecting it together as a squad and forcing the question - what do we want to do about this?
• Reacting to build failures as a stop-the-line event, rather than not noticing for hours/day etc
• Exposing debt backlogs in an easy-to-consume way helped us recognise how much we were carrying, and decide acceptable/unacceptable limits. This helped us drive down and keep on top of tech debt

@spoole167@spoole167
Dashboards and Culture: How Openness Changes your Behavior• Creating your own Dashboards is easy - but you have to be bold.
• Start small : think about insight
• Remember the car dashboard example• Just enough status
• Just enough insight
• Just enough warnings
• Clear emergency indicators
• Drive changes in your approach to allow you to achieve clarity
• One or two ’wins’ is all you need for this approach to go viral

@spoole167@spoole167
Thank you