dark-matter results from 332 new live days of lux data
TRANSCRIPT

Dark-matter results from 332 new live days of LUX data
Aaron Manalaysay For the LUX Collaboration
Identification of Dark Matter The University of Sheffield, Sheffield, UK, 21 July, 2016
Presented at:

The LUX collaboration
Kimberly Palladino PI, Asst ProfessorShaun Alsum Graduate Student
University of Wisconsin
Frank Wolfs PI, ProfessorWojtek Skutski Senior ScientistEryk Druszkiewicz Graduate StudentDev Ashish Khaitan Graduate StudentDiktat Koyuncu Graduate StudentM. Moongweluwan Graduate StudentJun Yin Graduate Student
University of Rochester
Carter Hall PI, ProfessorJon Balajthy Graduate StudentRichard Knoche Graduate Student
University of Maryland
Chamkaur Ghag PI, LecturerJames Dobson PostdocSally Shaw Graduate Student
University College London, UK
Harry Nelson PI, ProfessorSusanne Kyre EngineerDean White EngineerCarmen Carmona PostdocScott Haselschwardt Graduate StudentCurt Nehrkorn Graduate StudentMelih Solmaz Graduate Student
UC Santa Barbara
Mani Tripathi PI, ProfessorBritt Hollbrook Senior EngineerJohn Thomson Development
EngineerDave Hemer Senior MachinistRay Gerhard Electronics EngineerAaron Manalaysay Project ScientistJacob Cutter Graduate StudentJames Morad Graduate StudentSergey Uvarov Graduate Student
UC Davis
Daniel McKinsey PI, ProfessorEthan Bernard Project ScientistScott Hertel PostdocKevin O’Sullivan PostdocElizabeth Boulton Graduate StudentEvan Pease Graduate StudentBrian Tennyson Graduate StudentLucie Tvrznikova Graduate StudentNicole Larsen Graduate Student
UC Berkeley (Yale)
James White † PI, ProfessorRobert Webb PI, ProfessorRachel Mannino Graduate StudentPaul Terman Graduate Student
Texas A&M University
Matthew Szydagis PI, ProfessorJeremy Mock PostdocSean Fallon Graduate StudentJack Genovesi Graduate StudentSteven Young Graduate Student
University at Albany
Dan Akerib PI, ProfessorThomas Shutt PI, ProfessorTomasz Biesiadzinski Research AssociateChristina Ignarra Research AssociateWing To Research AssociateRosie Bramante Graduate StudentWei Ji Graduate StudentT.J. Whitis Graduate Student
SLAC Stanford (CWRU)
Isabel Lopes PI, ProfessorJose Pinto da Cunha
Assistant ProfessorVladimir Solovov Senior ResearcherFrancisco Neves Auxiliary ResearcherAlexander Lindote PostdocClaudio Silva PostdocPaulo Bras Graduate Student
LIP Coimbra, Portugal
Adam Bernstein PI, Leader of Adv. Detectors Grp.
Kareem Kazkaz Staff PhysicistJingke Xu PostdocBrian Lenardo Graduate Student
Lawrence Livermore
Henrique Araujo PI, ReaderTim Sumner ProfessorAlastair Currie PostdocAdam Bailey Graduate StudentKhadeeja Yazdani Graduate Student
Imperial College London, UK
Alex Murphy PI, ProfessorPaolo Beltrame Research FellowTom Davison Graduate StudentMaria F. Marzioni Graduate Student
University of Edinburgh, UK
Bob Jacobsen PI, Professor
Murdock Gilchriese Senior Scientist
Kevin Lesko Senior Scientist
Michael Witherell Lab Director
Peter Sorensen Scientist
Simon Fiorucci Project Scientist
Attila Dobi Postdoc
Daniel Hogan Graduate Student
Kate Kamdin Graduate Student
Kelsey Oliver-Mallory Graduate Student
Berkeley Lab / UC Berkeley
Richard Gaitskell PI, ProfessorSamuel Chung Chan
Graduate StudentDongqing Huang Graduate StudentCasey Rhyne Graduate StudentWill Taylor Graduate StudentJames Verbus Postdoc
Brown University
Dongming Mei PI, ProfessorChao Zhang Postdoc
University of South Dakota
David Taylor Project EngineerMarkus Horn Research ScientistDana Byram Support Scientist
SDSTA / Sanford Lab
Xinhua Bai PI, ProfessorDoug Tiedt Graduate Student
SD Mines

Dark-matter results from 332 new live days of LUX data
A. Manalaysay | LUX: IDM2016
Overview
3
•LUX refresher•Original LUX results (2014) and re-
analysis (2015)•Details of internal electric fields•Grid conditioning•332 day run•Data salting•WIMP-search data

Dark-matter results from 332 new live days of LUX data
A. Manalaysay | LUX: IDM2016 4
L U XLarge Underground Xenon experiment
A direct-detection search, looking primarily (but not only) for WIMP dark matter
?
� �
Z,A Z,A

Dark-matter results from 332 new live days of LUX data
A. Manalaysay | LUX: IDM2016 5
WHY USE LIQUID XENON TO LOOK FOR WIMPS?

Dark-matter results from 332 new live days of LUX data
A. Manalaysay | LUX: IDM2016
Why use liquid xenon?
6
0 10 20 30 40 50 60Nuclear Recoil Energy [keV]
0.0
0.2
0.4
0.6
0.8
1.0
Rat
e[e
vts/
kg/d
ay/k
eV]
⇥10�4
Mc
= 50 GeV, snucleon = 10�45 cm2
XenonGermaniumArgon
• Scalar WIMP-nucleus interactions lead to an A2 enhancement in the differential rate relative to other commonly used detection media.
• Natural xenon contains ~50% odd isotopes, giving high sensitivity to spin-dependent interactions.
Large signal

Dark-matter results from 332 new live days of LUX data
A. Manalaysay | LUX: IDM2016
Why use liquid xenon?
7
• Liquid detectors are scalable up to large size.
• Dual-phase time projection chambers feature 3-D localization of events.
• The combination of these two features permits an ultra-low-background inner region to be defined. We are sensitive to signals that would cause as little as a few events per century in a kilogram of xenon.
Alexandre Lindote!! ! ! ! ! Astroparticle Physics 2014
Xenon as a WIMP target
3
It’s quiet in the middle
log10DRU
Fiducial
Active Xe
✤ Relatively high density (2.9 g/cm3) !
✤ High atomic mass (A=131 g/mol)!
✤ Spin-dependent sensitive isotopes (129Xe, 131Xe)!
✤ Large light output and fast response!
✤ Long electron drift lengths (~1 m) !
✤ Excellent ionisation threshold!
✤ No intrinsic backgrounds!
✤ Self-shielding (using 3D pos. recons.)!
✤ Scalable to multi-ton size
Low backgroundEvent rate (DRU)*
* “DRU” = evt/kg/day/keV

Dark-matter results from 332 new live days of LUX data
A. Manalaysay | LUX: IDM2016
Detection technique
8
• LUX is a dual-phase time projection chamber (like most other liquid-noble DM experiments); essentially a cylinder of LXe.
• Primary scintillation light (“S1”) is emitted from the interaction vertex, and recorded by an array of PMTs on top and bottom.
• Electrons emitted from the interaction are drifted by an applied field to the surface and into the gas, where they emit proportional scintillation light (“S2”), also recorded by the PMTs.
• This design permits:‣ 3-D localization of each vertex.‣ Identification of multiple scatters (via
S2 count).‣ ER/NR discrimination (via S2/S1)‣ Sensitivity to single ionization
electrons.

Dark-matter results from 332 new live days of LUX data
A. Manalaysay | LUX: IDM2016 9
LUX DETECTOR•48cm diameter by 48 cm
height dodecagonal “cylinder”.
•250.9 kg LXe in active region•61 PMTs on top, 61 on
bottom, specially produced for low radiogenic BGs and VUV sensitivity.
•Xenon was pre-purified via chromatographic separation, reducing residual krypton.
•Liquid is continuously recirculated (¼ tonne per day) to maintain chemical purity.
•Ultra-low BG titanium cryostat.

Dark-matter results from 332 new live days of LUX data
A. Manalaysay | LUX: IDM2016
Sanford Underground Research Facility
10
LUX, located on the 4850 level (~1.5 km underground) in Lead, South Dakota. ~107 reduction in cosmic muon rate.

Dark-matter results from 332 new live days of LUX data
A. Manalaysay | LUX: IDM2016
Calibrations
11
LUX has taken calibrations very seriously. We make heavy use of:
•83mKr: 1.8hr half life, monoenergetic, injected ~weekly. Spatially uniform!
•CH3T (tritiated methane): Removed on a ~8 hr timescale by our purification system. Injected 2-3 times per year. Spatially uniform! Used to define our ER band.
•Deuterium-Deuterium neutron generator: 2.45MeV monoenergetic, collimated neutron beam, incident at any desired height. Used to define our NR band.
See talks by Sally Shaw and Rick Gaitskell

Dark-matter results from 332 new live days of LUX data
A. Manalaysay | LUX: IDM2016
WIMP masses, from 2.4 to 5.3. A variation of one standarddeviation in detection efficiency shifts the limit by anaverage of only 5%. The systematic uncertainty in theposition of the NR band was estimated by averaging thedifference between the centroids of simulated and observedAmBe data in logðS2b=S1Þ. This yielded an uncertainty of0.044 in the centroid, which propagates to a maximumuncertainty of 25% in the high mass limit.The 90% upper C.L. cross sections for spin-independent
WIMP models are thus shown in Fig. 5 with a minimumcross section of 7.6 × 10−46 cm2 for a WIMP mass of33 GeV=c2. This represents a significant improvement overthe sensitivities of earlier searches [46,47,50,51]. The lowenergy threshold of LUX permits direct testing of lowmass WIMP hypotheses where there are potentialhints of signal [46,51,54,55]. These results do notsupport such hypotheses based on spin-independent iso-spin-invariant WIMP-nucleon couplings and conventionalastrophysical assumptions for the WIMP halo, evenwhen using a conservative interpretation of the existinglow-energy nuclear recoil calibration data for xenondetectors.
LUX will continue operations at SURF during 2014and 2015. Further engineering and calibration studies willestablish the optimal parameters for detector operations,with potential improvements in applied electric fields,increased calibration statistics, decaying backgroundsand an instrumented water tank veto further enhancingthe sensitivity of the experiment. Subsequently, we willcomplete the ultimate goal of conducting a blinded 300live-day WIMP search further improving sensitivity toexplore significant new regions of WIMP parameterspace.
This work was partially supported by the U.S.Department of Energy (DOE) under Awards No. DE-FG02-08ER41549, No. DE-FG02-91ER40688, No. DE-FG02-95ER40917, No. DE-FG02-91ER40674,No. DE-NA0000979, No. DE-FG02-11ER41738, No. DE-SC0006605, No. DE-AC02-05CH11231, No. DE-AC52-07NA27344, and No. DE-FG01-91ER40618; the U.S.National Science Foundation under Awards No.PHYS-0750671, No. PHY-0801536, No. PHY-1004661,No. PHY-1102470, No. PHY-1003660, No. PHY-1312561,No. PHY-1347449; the Research Corporation GrantNo. RA0350; the Center for Ultra-low BackgroundExperiments in the Dakotas (CUBED); and the SouthDakota School of Mines and Technology (SDSMT).LIP-Coimbra acknowledges funding from Fundação paraa Ciência e Tecnologia (FCT) through the Project-GrantNo. CERN/FP/123610/2011. Imperial College and BrownUniversity thank the UK Royal Society for travel fundsunder the International Exchange Scheme (IE120804). TheUK groups acknowledge institutional support fromImperial College London, University College London,and Edinburgh University, and from the Science &Technology Facilities Council for Ph. D. studentshipNo. ST/K502042/1 (AB). The University of Edinburghis a charitable body, registered in Scotland, with registrationNo. SC005336. This research was conducted using com-putational resources and services at the Center forComputation and Visualization, Brown University. Weacknowledge the work of the following engineers whoplayed important roles during the design, construction,commissioning, and operation phases of LUX: S. Dardinfrom Berkeley, B. Holbrook, R. Gerhard, and J. Thomsonfrom University of California, Davis; and G. Mok, J. Bauer,and D. Carr from Lawrence Livermore NationalLaboratory. We gratefully acknowledge the logistical andtechnical support and the access to laboratory infrastructureprovided to us by the Sanford Underground ResearchFacility (SURF) and its personnel at Lead, SouthDakota. SURF was developed by the South DakotaScience and Technology authority, with an importantphilanthropic donation from T. Denny Sanford, and isoperated by Lawrence Berkeley National Laboratory forthe Department of Energy, Office of High EnergyPhysics.
mWIMP
(GeV/c2)
WIM
P−n
ucle
on c
ross
sec
tion
(cm
2 )
101
102
103
10−45
10−44
6 8 10 12
10−44
10−42
10−40
FIG. 5 (color online). The LUX 90% confidence limit on thespin-independent elastic WIMP-nucleon cross section (blue),together with the #1σ variation from repeated trials, where trialsfluctuating below the expected number of events for zero BG areforced to 2.3 (blue shaded). We also show Edelweiss II [45] (darkyellow line), CDMS II [46] (green line), ZEPLIN-III [47](magenta line), CDMSlite [48] (dark green line), XENON10S2-only [20] (brown line), SIMPLE [49] (light blue line), andXENON100 225 live-day [50] (red line) results. The inset (sameaxis units) also shows the regions measured from annualmodulation in CoGeNT [51] (light red, shaded), along withexclusion limits from low threshold re-analysis of CDMS II data[52] (upper green line), 95% allowed region from CDMS IIsilicon detectors [53] (green shaded) and centroid (green x), 90%allowed region from CRESST II [54] (yellow shaded) andDAMA/LIBRA allowed region [55] interpreted by [56] (greyshaded). (results sourced from DMTools [57]).
PRL 112, 091303 (2014) P HY S I CA L R EV I EW LE T T ER Sweek ending
7 MARCH 2014
091303-6
Letter but are reviewed in, e.g., [38]. Limits on spin-dependent cross sections are presented elsewhere [39].In conclusion, reanalysis of the 2013 LUX data has
excluded new WIMP parameter space. The added fiducialmass and live time, and better resolution of light and chargeyield a 23% improvement in sensitivity at high WIMPmasses over the first LUX result. The reduced, 1.1 keVcutoff in the signal model improves sensitivity by 2% athigh masses but is the dominant effect below 20 GeV c−2,and the range 5.2 to 3.3 GeV c−2 is newly demonstrated tobe detectable in xenon. These techniques further enhancethe prospects for discovery in the ongoing 300-day LUXsearch and the future LUX-ZEPLIN [46] experiment.
This work was partially supported by the U.S. Departmentof Energy (DOE) under Awards No. DE-FG02-08ER41549,No. DE-FG02-91ER40688, No. DE-FG02-95ER40917,No. DE-FG02-91ER40674, No. DE-NA0000979, No. DE-FG02-11ER41738, No. DE-SC0006605, No. DE-AC02-05CH11231, No. DE-AC52-07NA27344, and No. DE-FG01-91ER40618; the U.S. National Science Foundationunder Grant No. PHYS-0750671, No. PHY-0801536,No. PHY-1004661, No. PHY-1102470, No. PHY-1003660,No. PHY-1312561, No. PHY-1347449; the ResearchCorporation Grant No. RA0350; the Center for Ultra-lowBackground Experiments in the Dakotas (CUBED); and theSouth Dakota School of Mines and Technology (SDSMT).LIP-Coimbra acknowledges funding from Fundação para aCiência e a Tecnologia (FCT) through the Project-GrantNo. PTDC/FIS-NUC/1525/2014. Imperial College and
Brown University thank the UK Royal Society for travelfunds under the International Exchange Scheme (IE120804).The UK groups acknowledge institutional support fromImperial College London, University College London andEdinburgh University, and from the Science and TechnologyFacilities Council for PhD Studentships No. ST/K502042/1(AB), No. ST/K502406/1 (SS), and No. ST/M503538/1(KY). The University of Edinburgh is a charitable body,registered in Scotland,with RegistrationNo. SC005336. Thisresearch was conducted using computational resources andservices at the Center for Computation and Visualization,Brown University. We gratefully acknowledge the logisticaland technical support and the access to laboratory infra-structure provided to us by the Sanford UndergroundResearch Facility (SURF) and its personnel at Lead,South Dakota. SURF was developed by the South DakotaScience and Technology Authority, with an importantphilanthropic donation from T. Denny Sanford, and isoperated by Lawrence Berkeley National Laboratory forthe Department of Energy, Office of High Energy Physics.We thank Felix Kahlhoefer and Sebastien Wild for uncov-ering a mistake in a preprint of this work.
*Corresponding [email protected]
[1] J. I. Read, The local dark matter density, J. Phys. G 41,063101 (2014).
[2] D. Harvey, R. Massey, T. Kitching, A. Taylor, and E. Tittley,The nongravitational interactions of dark matter in collidinggalaxy clusters, Science 347, 1462 (2015).
[3] Ade et al. (Planck Collaboration), Planck 2015 results. XIII.Cosmological parameters, arXiv:1502.01589v2.
[4] M.W. Goodman and E. Witten, Detectability of certaindark-matter candidates, Phys. Rev. D 31, 3059 (1985).
[5] J. L. Feng, Dark matter candidates from particle physics andmethods of detection, Annu. Rev. Astron. Astrophys. 48,495 (2010).
[6] D. S. Akerib et al. (LUX Collaboration), First Results fromthe LUX Dark Matter Experiment at the Sanford Under-ground Research Facility, Phys. Rev. Lett. 112, 091303(2014).
[7] D. S. Akerib et al. (LUX Collaboration), The large under-ground xenon (LUX) experiment, Nucl. Instrum. MethodsPhys. Res., Sect. A 704, 111 (2013).
[8] C. H. Faham, V. M. Gehman, A. Currie, A. Dobi, P.Sorensen, and R. J. Gaitskell, Measurements of wave-length-dependent double photoelectron emission fromsingle photons in VUV-sensitive photomultiplier tubes,J. Instrum. 10, P09010 (2015).
[9] C. H. Faham, Ph.D. thesis, Brown University, 2014.[10] V. Solovov et al. (ZEPLIN-III Collaboration), Position
reconstruction in a dual phase xenon scintillation detector,IEEE Trans. Nucl. Sci. 59, 3286 (2012).
[11] Y. Mei, Ph.D. thesis, Rice University, 2011.[12] D. S. Akerib et al. (LUX Collaboration), Calibration, event
reconstruction, data analysis and limits calculation for theLUX dark matter experiment (to be published).
101 102 10310−1
100
101
102
103
104
105
8B
SuperCDMS 2014
CDMSlite 2015
PandaX 2015
DarkSide−50 2015
XENON100 2012
LUX 2014
This Result
mWIMP
(GeV/c 2 )
WIM
P−nu
cleo
n cr
oss
sect
ion
(zb)
10−45
10−44
10−43
10−42
10−41
10−40
WIM
P−nu
cleo
n cr
oss
sect
ion
(cm
2 )
FIG. 3. Upper limits on the spin-independent elastic WIMP-nucleon cross section at 90% C.L. Observed limit in black, withthe 1- and 2-σ ranges of background-only trials shaded green andyellow. Also shown are limits from the first LUX analysis [6](gray), SuperCDMS [40] (green), CDMSlite [41] (light blue),XENON100 [42] (red), DarkSide-50 [43] (orange), and PandaX[44] (purple). The expected spectrum of coherent neutrino-nucleus scattering by 8B solar neutrinos can be fit by a WIMPmodel as in [45], plotted here as a black dot.
PRL 116, 161301 (2016) P HY S I CA L R EV I EW LE T T ER Sweek ending
22 APRIL 2016
161301-6
LUX timeline
12
2008: LUX funded (DOE+NSF)
2012 (Jul): Underground lab complete, LUX moves UG
2013 (Apr): Commissioning complete
2014 (Mar): First results (3 months) reported
2014 (Sep): 332-day run started!
2015 (Dec.) 3-month run reanalysis posted. Published 2016 (Apr).
2016 (May): Run finished
2016 (July): 332 days DM results presented

Dark-matter results from 332 new live days of LUX data
A. Manalaysay | LUX: IDM2016
LUX2014/2015 — 95 live days
13
was tuned to the S1-S2 distribution of 1.8 × 10⁵ fiducial-volume electron recoils from the internal tritium source.Good agreement was obtained from threshold to the18.6 keV end point, well above the WIMP signal in bothlight and charge, and the reconstructed β spectrum validatesthe g1 and g2 values measured with line sources [16].Simulated waveforms, processed with the same data-reduction software and event selection as applied to thesearch data, are used to model the ER backgrounds in S1and S2.Events due to detector component radioactivity, both
within and above the energy region of interest, weresimulated with LUXSim. The high-energy spectral agree-ment between data and simulation based on γ screening isgenerally good [20,28]; however, we observe an excess ofER events with 500–1500 keV energy concentrated in thelowest 10 cm of the active region. Its precise origin isunknown but the spectrum can be reproduced by simulatingadditional, heavily downscattered 238U chain, 232Th chain,and 60Co γ rays in the center of a large copper block belowthe PMTs. This implies an extra 105 low-energy Compton-scatter events, included in the background model. The γ-raypopulation is subdivided into two spatial distributions withfloating normalization: one generated by the bottom PMTarray, its support structure, and the bottom γ-ray shield; andone from the rest of the detector.A final source of background, newly modeled here, is the
tail in reconstructed r of events on the PTFE sidewalls. TheS1-S2 distribution of background events on the wallsdiffers from that in the liquid bulk. Charge collection isincomplete, so the ER population extends to lower valuesof S2. There are, in addition, true nuclear recoils from thedaughter 206Pb nuclei of α decay by 210Po plated on thewall. The leakage of wall events towards smaller r dependsstrongly, via position resolution, on S2 size. The wallpopulation in the fiducial volume thus appears close to theS2 threshold, largely below the signal population in S2at given S1. It is modeled empirically using high-r andlow-S2 sidebands in the search data [33].Systematic uncertainties in background rates are treated
via nuisance parameters in the likelihood: their constraintsare listed with other fit parameters in Table I. S1, S2, z, andr are each useful discriminants against backgrounds, andcross sections are tested via the likelihood of the searchevents in these four observables.Search data were acquired between April 24th and
September 1st, 2013. Two classes of cuts based onprevailing detector conditions assure well-measured eventsin both low-energy calibration and WIMP-search samples.Firstly, data taken during excursions in macroscopicdetector properties, such as xenon circulation outages orinstability of applied high voltage, are removed, constitut-ing 0.8% of gross live time. Secondly, an upper threshold isimposed on summed pulse area during the event windowbut outside S1 and S2. It removes triggers during the
aftermath of photoionization and delayed electron emissionfollowing large S2s. The threshold is set for >99% tritiumacceptance and removes 1% of gross live time [34]. Wereport on 95.0 live days. Figure 2 shows the measured lightand charge of the 591 surviving events in the fiducialvolume.A double-sided, profile-likelihood-ratio (PLR) statistic
[35] is employed to test signal hypotheses. For each WIMPmass, we scan over cross section to construct a 90% con-fidence interval, with test statistic distributions evaluated byMonte Carlo sampling using the RooStats package [36]. Atall masses, the maximum-likelihood value of σn is found tobe zero. The background-only model gives a good fit to thedata, with KS test p values of 0.05, 0.07, 0.34, and 0.64 forthe projected distributions in S1, S2, r, and z respectively.Upper limits on cross section for WIMP masses from4 to 1000 GeV c−2 are shown in Fig. 3; above, the limitincreases in proportion to mass until≳108GeV c−2, 106 zb,where the Earth begins to attenuate the WIMP flux. Theraw PLR result lies between one and two Gaussian σ belowthe expected limit from background trials. We apply apower constraint [37] at the median so as not to excludecross sections for which sensitivity is low through chancebackground fluctuation. We include systematic uncertain-ties in the nuclear recoil response in the PLR, which has amodest effect on the limit with respect to assuming the best-fit model exactly: less than 20% at all masses. Limitscalculated with the alternate, Bezrukov parametrizationwould be 0.48, 1.02, and 1.05 times the reported ones at 4,33, and 1000 GeV c−2, respectively. Uncertainties in theassumed dark matter halo are beyond the scope of this
S1 (phd)0 5 10 15 20 25 30 35 40 45 50
[S2(
phd)
]10
log
2
2.5
3
3.5
4
3 9
1.7
15
2.9
21
4.2
27
5.4
33 keVnr
6.67.8 9.0
10.2 keVee
FIG. 2. Observed events in the 2013 LUX exposure of 95 livedays and 145 kg fiducial mass. Points at<18 cm radius are black;those at 18–20 cm are gray. Distributions of uniform-in-energyelectron recoils (blue) and an example 50 GeV c−2 WIMP signal(red) are indicated by 50th (solid), 10th, and 90th (dashed)percentiles of S2 at given S1. Gray lines, with ER scale of keVeeat top and Lindhard-model NR scale of keVnr at bottom, arecontours of the linear combined S1-and-S2 energy estimator [19].
PRL 116, 161301 (2016) P HY S I CA L R EV I EW LE T T ER Sweek ending
22 APRIL 2016
161301-5
Letter but are reviewed in, e.g., [38]. Limits on spin-dependent cross sections are presented elsewhere [39].In conclusion, reanalysis of the 2013 LUX data has
excluded new WIMP parameter space. The added fiducialmass and live time, and better resolution of light and chargeyield a 23% improvement in sensitivity at high WIMPmasses over the first LUX result. The reduced, 1.1 keVcutoff in the signal model improves sensitivity by 2% athigh masses but is the dominant effect below 20 GeV c−2,and the range 5.2 to 3.3 GeV c−2 is newly demonstrated tobe detectable in xenon. These techniques further enhancethe prospects for discovery in the ongoing 300-day LUXsearch and the future LUX-ZEPLIN [46] experiment.
This work was partially supported by the U.S. Departmentof Energy (DOE) under Awards No. DE-FG02-08ER41549,No. DE-FG02-91ER40688, No. DE-FG02-95ER40917,No. DE-FG02-91ER40674, No. DE-NA0000979, No. DE-FG02-11ER41738, No. DE-SC0006605, No. DE-AC02-05CH11231, No. DE-AC52-07NA27344, and No. DE-FG01-91ER40618; the U.S. National Science Foundationunder Grant No. PHYS-0750671, No. PHY-0801536,No. PHY-1004661, No. PHY-1102470, No. PHY-1003660,No. PHY-1312561, No. PHY-1347449; the ResearchCorporation Grant No. RA0350; the Center for Ultra-lowBackground Experiments in the Dakotas (CUBED); and theSouth Dakota School of Mines and Technology (SDSMT).LIP-Coimbra acknowledges funding from Fundação para aCiência e a Tecnologia (FCT) through the Project-GrantNo. PTDC/FIS-NUC/1525/2014. Imperial College and
Brown University thank the UK Royal Society for travelfunds under the International Exchange Scheme (IE120804).The UK groups acknowledge institutional support fromImperial College London, University College London andEdinburgh University, and from the Science and TechnologyFacilities Council for PhD Studentships No. ST/K502042/1(AB), No. ST/K502406/1 (SS), and No. ST/M503538/1(KY). The University of Edinburgh is a charitable body,registered in Scotland,with RegistrationNo. SC005336. Thisresearch was conducted using computational resources andservices at the Center for Computation and Visualization,Brown University. We gratefully acknowledge the logisticaland technical support and the access to laboratory infra-structure provided to us by the Sanford UndergroundResearch Facility (SURF) and its personnel at Lead,South Dakota. SURF was developed by the South DakotaScience and Technology Authority, with an importantphilanthropic donation from T. Denny Sanford, and isoperated by Lawrence Berkeley National Laboratory forthe Department of Energy, Office of High Energy Physics.We thank Felix Kahlhoefer and Sebastien Wild for uncov-ering a mistake in a preprint of this work.
*Corresponding [email protected]
[1] J. I. Read, The local dark matter density, J. Phys. G 41,063101 (2014).
[2] D. Harvey, R. Massey, T. Kitching, A. Taylor, and E. Tittley,The nongravitational interactions of dark matter in collidinggalaxy clusters, Science 347, 1462 (2015).
[3] Ade et al. (Planck Collaboration), Planck 2015 results. XIII.Cosmological parameters, arXiv:1502.01589v2.
[4] M.W. Goodman and E. Witten, Detectability of certaindark-matter candidates, Phys. Rev. D 31, 3059 (1985).
[5] J. L. Feng, Dark matter candidates from particle physics andmethods of detection, Annu. Rev. Astron. Astrophys. 48,495 (2010).
[6] D. S. Akerib et al. (LUX Collaboration), First Results fromthe LUX Dark Matter Experiment at the Sanford Under-ground Research Facility, Phys. Rev. Lett. 112, 091303(2014).
[7] D. S. Akerib et al. (LUX Collaboration), The large under-ground xenon (LUX) experiment, Nucl. Instrum. MethodsPhys. Res., Sect. A 704, 111 (2013).
[8] C. H. Faham, V. M. Gehman, A. Currie, A. Dobi, P.Sorensen, and R. J. Gaitskell, Measurements of wave-length-dependent double photoelectron emission fromsingle photons in VUV-sensitive photomultiplier tubes,J. Instrum. 10, P09010 (2015).
[9] C. H. Faham, Ph.D. thesis, Brown University, 2014.[10] V. Solovov et al. (ZEPLIN-III Collaboration), Position
reconstruction in a dual phase xenon scintillation detector,IEEE Trans. Nucl. Sci. 59, 3286 (2012).
[11] Y. Mei, Ph.D. thesis, Rice University, 2011.[12] D. S. Akerib et al. (LUX Collaboration), Calibration, event
reconstruction, data analysis and limits calculation for theLUX dark matter experiment (to be published).
101 102 10310−1
100
101
102
103
104
105
8B
SuperCDMS 2014
CDMSlite 2015
PandaX 2015
DarkSide−50 2015
XENON100 2012
LUX 2014
This Result
mWIMP
(GeV/c 2 )
WIM
P−nu
cleo
n cr
oss
sect
ion
(zb)
10−45
10−44
10−43
10−42
10−41
10−40
WIM
P−nu
cleo
n cr
oss
sect
ion
(cm
2 )
FIG. 3. Upper limits on the spin-independent elastic WIMP-nucleon cross section at 90% C.L. Observed limit in black, withthe 1- and 2-σ ranges of background-only trials shaded green andyellow. Also shown are limits from the first LUX analysis [6](gray), SuperCDMS [40] (green), CDMSlite [41] (light blue),XENON100 [42] (red), DarkSide-50 [43] (orange), and PandaX[44] (purple). The expected spectrum of coherent neutrino-nucleus scattering by 8B solar neutrinos can be fit by a WIMPmodel as in [45], plotted here as a black dot.
PRL 116, 161301 (2016) P HY S I CA L R EV I EW LE T T ER Sweek ending
22 APRIL 2016
161301-6
PRL 116, 161301 (2016)
effects of two-body currents in the δ term (most previousanalyses have not included 2-body currents, which sim-plifies this equation), which represent couplings between aWIMP and two nucleons [18]. In this zero-momentumtransfer limit, we can separate the two cases of “proton-only” (a0 ¼ a1 ¼ 1) or “neutron-only” (a0 ¼ −a1 ¼ 1)couplings and write:
σp;n ¼3μ2p;nð2J þ 1Þ
4πμ2N
σ0SAð0Þ
: ð3Þ
SAðqÞ can be obtained from detailed nuclear shell modelcalculations. The result depends on which nuclear states areincluded and the allowed configurations of nucleons withinthose states. There are also differences in the nuclearinteractions accounted for. The calculation used here isfrom Klos et al. [17]. It includes the largest number of statesand allowed configurations compared to previous theoreti-cal treatments in the literature. The order of the exper-imentally measured nuclear energy levels in xenon isreproduced well. In addition, the Klos et al. result uses achiral effective field theory treatment of the nuclearinteractions including two-body currents. These structurefunctions are an update of those in Ref. [19]. Within therecoil energy range of interest, changes to the neutron-onlystructure function are small: at most 5% for 129Xe and amaximum 20% increase for 131Xe. For proton-only, thestructure function is smaller than previously: as the recoilenergy increases the difference in 129Xe rises to 30% and in131Xe to 50%. We also compare to the structure functioncalculation of Ressell and Dean with the Bonn A nucleon-nucleon potential [20], which has been extensively used inprevious SD results. This includes the same states asRef. [17], but has more truncations in the allowed con-figurations of nucleons and only includes interactions withone nucleon.There are two naturally occurring xenon isotopes with an
odd number of neutrons, 129Xe and 131Xe (abundances29.5% and 23.7%, respectively). Therefore, the “neutron-only” sensitivity is much higher than “proton-only”, as themajority of the nuclear spin is carried by the unpairedneutron. When only WIMP interactions with one nucleonare considered, the choice of ap;n above corresponds toWIMPs either coupling to only protons or neutrons.However, once two-body currents are included, an inter-action between a WIMP, a proton, and the unpaired neutroncan occur even in the “proton-only” case. Therefore, thisgives a significant enhancement to the structure function for“proton-only” coupling, while only slightly reducing the“neutron-only”.Single scatter events (one S1 followed by one S2) within
the fiducial volume (radius < 20 cm, 38–205 μs drift time,or 48.6–8.5 cm above bottom PMT faces in z) are selectedfor the analysis. A total of 591 events are observed in theregion of interest (cf. Fig. 2 in Ref. [10]) during an exposure
of 1.4 × 10⁴ kg day. The background rate originating fromNR events is negligible [10] but ER events produce asignificant background. The ER backgrounds includeexternal gamma rays from detector materials, 127Xe x rays,and contaminants in the xenon (85Kr, Rn) [21]. The tritiumdata set allows Monte Carlo simulations [22] to be tuned toER calibration data, which is then used to generate PDFs(in S1 vs S2) for these ER backgrounds. Another importantbackground comes from radon daughter decays on thePTFE walls of the TPC, with the tail of the distribution inreconstructed radius extending into the fiducial volume[23]. In these “wall events” some electrons are lost,resulting in a reduced S2 signal, so that many events liebelow the signal band in S2/S1. Part of this background isERs, which can mimic NRs due to their reduced S2 signal.
)2WIMP Mass (GeV/c1 10 210 310 410 510
)2S
D W
IMP
-neu
tron
cro
ss-s
ectio
n (c
m
-4310
-4210
-4110
-4010
-3910
-3810
-3710
-3610
-3510
-3410
DAMA
ZEPLIN-IIICDMS
KIMS
MSDM g=0.25
MSDM g=1.45
PICASSO
XENON100
XENON10
LZ Projected
LUX 90% C.L.
)2WIMP Mass (GeV/c1 10 210 310 410 510
)2S
D W
IMP
-pro
ton
cros
s-se
ctio
n (c
m
-4310
-4210
-4110
-4010
-3910
-3810
-3710
-3610
-3510
-3410
DAMA
ZEPLIN-IIICDMS
KIMSPICASSO
)bSuperK (b
)-W+SuperK (W)-τ+τSuperK (
PICO-2L PICO-60
XENON100
XENON10
LZ Projected
)b
IceCube (b
)-W+
IceCube (W
)-τ+τIceCube (
LUX 90% C.L.
FIG. 1. LUX upper limits on the WIMP-neutron (top) and -proton (bottom) elastic SD cross sections at 90% C.L. Theobserved limit is shown in black with the %1σ (%2σ) band fromsimulated background-only trials in green (yellow). Also shownare the 90% C.L. from: CDMS [29], KIMS [30,31], PICASSO[32], PICO-2L [26], PICO-60 [27], XENON10 [33], XENON100[34], and ZEPLIN-III [35,36]. The DAMA allowed region at 3σas interpreted in [28] without ion channeling is the shaded areas.Three indirect limits from IceCube [37] and SuperK [38] areshown. Collider limits from CMS monojet searches are included,assuming the MSDM model with two coupling scenarios [39].The projected sensitivity for the LZ experiment is shown for anexposure of 5.6 × 10⁵ kg day [40].
PRL 116, 161302 (2016) P HY S I CA L R EV I EW LE T T ER Sweek ending
22 APRIL 2016
161302-3
PRL 116, 161302 (2016)
Spin-dependent sensitivity•Back-to-back Phys.Rev.Letters on spin independent and dependent WIMP-nucleon couplings from the LUX2014 data (Presented in 2015).
LUX2015
Also see talks by M.F. Marzioni and N. Larsen

Dark-matter results from 332 new live days of LUX data
A. Manalaysay | LUX: IDM2016
Electric-field uniformity
14r [cm]
z [c
m]
-10 kV
-8 kV
-6 kV
-4 kV
-2 kV e-
• Field-shaping rings help to ensure a uniform field magnitude throughout the ~90 liters, though a residual radial component does creep into the active region.
• Electrons therefore exit the liquid surface (where they are detected) at a radius smaller than that of the interaction vertex.
• The shape of the detector wall, as measured, is therefore not a vertical line.
• Measured coordinates (“S2 space”) are squeezed relative to physical coordinates (“real space”), though they represent the same actual volume. Fiducial volume is not decreased.
LUX2015
Measured position of wall

Dark-matter results from 332 new live days of LUX data
A. Manalaysay | LUX: IDM2016
Grid conditioning
15
Ed
Gate
Anode
Cathode
LXe
GXe Eextre-
e-
e-e-
e-e-e-
P M T
P TM
The LUX2015 results featured:• 50% electron extraction efficiency
In order to improve these values, after LUX2014 (and following calibrations), the LUX electrodes were “conditioned”. The voltage is raised for an extended period of time until significant current is drawn, in the middle of the threshold for sparking.
The result of the conditioning is:• 75% electron extraction efficiency.

Dark-matter results from 332 new live days of LUX data
A. Manalaysay | LUX: IDM2016
r [cm] z
[cm
]
-10 kV
-8 kV
-6 kV
-4 kV
-2 kV e-
Grid-conditioning side effects
16
LUX2015
Measured position of wall (before grid conditioning)

Dark-matter results from 332 new live days of LUX data
A. Manalaysay | LUX: IDM2016
Grid-conditioning side effects
17
LUX2016
•After grid conditioning, the radial field component increased significantly.
Measured position of wall (after grid conditioning)
r [cm] z
[cm
]
-10 kV
-8 kV
-6 kV
-4 kV
-2 kV e-
still 250 kg in here

Dark-matter results from 332 new live days of LUX data
A. Manalaysay | LUX: IDM2016
Grid-conditioning side effects
18
LUX2014-2016
• After grid conditioning, the radial field component increased significantly.
• The physical position of the wall of course has not changed (i.e. our active volume is unchanged), but the measured wall radius depends on the depth of the event.
• The measured wall radius is not axially symmetric.
• The measured wall radius varies slowly in time.
Measured position of wall
still 250 kg in here

Dark-matter results from 332 new live days of LUX data
A. Manalaysay | LUX: IDM2016
Modeling the E-field
19
• The effect is consistent with a buildup of negative charge on the PTFE walls of the TPC.
LUX2016Measured position of wall
still 250 kg in here
• We have built a fully 3D electrostatic field model which traces the evolution of this effect in time.
• Calibration data allows for robust calculation of fiducial volume.

Dark-matter results from 332 new live days of LUX data
A. Manalaysay | LUX: IDM2016
Modeling the E-field
20
MODELING LUX IN 3D
2016-04-16 Lucie Tvrznikova 3
Creating a 3D model of the LUX detector using COMSOL Multiphysics
• Fully 3-D model is constructed in the COMSOL Multiphysics® FEM simulation software.
• Charges are added (non-uniformly) to the walls and the 3-D field is calculated.
• The 3D field map is combined with the known field dependence on the electron drift speed to obtain a mapping between “real space” and “S2 space” coordinates.
• Results are compared to the observed distribution of 83mKr decays, and the charge densities are iterated until a best-fit is obtained.

Dark-matter results from 332 new live days of LUX data
A. Manalaysay | LUX: IDM2016
Modeling the E-field
21
• Fully 3-D model is constructed in the COMSOL Multiphysics® FEM simulation software.
• Charges are added (non-uniformly) to the walls and the 3-D field is calculated.
• The 3D field map is combined with the known field dependence on the electron drift speed to obtain a mapping between “real space” and “S2 space” coordinates.
• Results are compared to the observed distribution of 83mKr decays, and the charge densities are iterated until a best-fit is obtained.
• 10x variation in field magnitude
Cat
hode
Gat
e
Physical Radius [cm]
Phys
ical
Hei
ght [
cm]

Dark-matter results from 332 new live days of LUX data
A. Manalaysay | LUX: IDM2016
Variation in time of wall charge
22
•Average wall charge is observed to increase in magnitude over time.
•Wall charge is concentrated in the upper portion of the PTFE walls.

Dark-matter results from 332 new live days of LUX data
A. Manalaysay | LUX: IDM2016
Determination of fiducial volume
23
• Calibrations with 83mKr are performed every week.
• The injected Kr mixes uniformly in the active volume within ~10 min timescale.
• The mass surviving any fiducial cut can be found by:
83mKr calibrationHow does one determine fiducial
mass in such a situation?
Fiducial Mass = 251 kg ⇥ Num. evts. passing fiducial cut
Num. evts. total
• CH3T calibrations (smaller S2) are used to determine systematic uncertainty.

Dark-matter results from 332 new live days of LUX data
A. Manalaysay | LUX: IDM2016
Position corrections
24
Gate
Anode
Cathode
P M T
P TM
S1 larger for events lower in
the detector
S2 larger for events higher in
the detector
added complication of possible electron multiplicationnear the anode wires. Typical values were 19 pe=e! at4:6 kV=cm drift field (Case) and 8:4 pe=e! at2:0 kV=cm (Columbia).
The relative light and charge yields as a function of driftfield for different particles in LXe are summarized inFig. 3: 122 keV gamma rays from this work, 56.5 keVXe nuclear recoils from [14] and this Letter, and 5.5 and5.3 MeV alphas from [19] and the Case detector. Therelative charge yield, Q"E#=Q0, is the ratio of chargecollected at a given field, E, to that at infinite field (i.e.,with no recombination). For gammas and alpha particles,Q0 $ Ee=We, where Ee is the energy, and We $ 15:6 eV[20] is the average energy required to produce an electron-ion pair in LXe. For nuclear recoils, we modify this toaccount for the suppression of ionization predicted byLindhard [13], so that Q0 $ ErL=We, where L is theLindhard factor and Er is the recoil energy.
The energy dependence of the ionization yield (numberof electrons escaping recombination per unit recoil energy)for nuclear recoils is shown in Fig. 4 for several drift fields.The uncertainty on the yield is dominated by the systematicerror from the S2 calibration based on 57Co. Uncertainty inthe S1-based nuclear recoil energy scale from previousmeasurements [14–18] is not shown.
The important characteristics of the nuclear recoil ion-ization yield are its field-dependent value relative to otherparticles (Fig. 3), and its energy dependence (Fig. 4).Lindhard theory, which describes the suppression of ion-ization production relative to electron recoils during theinitial interaction of the recoil nuclei with other atoms, isindependent of field. Lindhard does predict a slight de-crease in charge yield with decreasing energy, but this isthe opposite of what is observed. The electric field andenergy dependencies of nuclear recoils must therefore bedue to recombination.
Recombination depends on the electric field and thetrack’s ionization density and geometry, with strongerrecombination at low fields and in denser tracks. A roughmeasure of the ionization density is the electronic stoppingpower, plotted in Fig. 5 for alphas, electrons, and Xenuclei, as given by ASTAR, ESTAR, and SRIM [21],respectively. Also shown is a recent calculation byHitachi [22] of the total energy lost to electronic excitationper path length for Xe nuclei, which differs from theelectronic stopping power in that it includes energy lostvia electronic stopping of secondary recoils.
The drop in electronic stopping power at low energy fornuclear recoils in Fig. 5 should result in a decrease inrecombination, providing an explanation for the prominent
FIG. 4. Energy dependence of nuclear recoil ionization yield inLXe at different drift fields.
0 1 2 3 4 50
0.1
0.2
0.3
0.4
0.5
0.6
0.7
0.8
0.9
1
Drift Field (kV/cm)
S(E
)/S0 o
r Q
(E)/Q
0
alpha, charge
alpha, light
ER, light
ER, charge
NR, light
NR, charge
FIG. 3 (color online). Field dependence of scintillation andionization yield in LXe for 122 keV electron recoils (ER),56.5 keVr nuclear recoils (NR) and alphas.
FIG. 2 (color). Case detector response to 252Cf neutron and 133Ba gamma sources at 1:0 kV=cm drift field.
PRL 97, 081302 (2006) P H Y S I C A L R E V I E W L E T T E R S week ending25 AUGUST 2006
081302-3
E. Aprile et al. PRL 97 (2006) 081302, astro-ph/0601552
• Size of the S1 depends on the location of the event (due to geometrical light collection), and S2 (due to electronegative impurities)
• Normally, one develops a geometrical correction factor by flat fielding a mono-energetic source.
• However, a spatially varying E-field ALSO affects S1 and S2 sizes, but differently for every particle type and energy.
(122 keV)
(122 keV)

Dark-matter results from 332 new live days of LUX data
A. Manalaysay | LUX: IDM2016
Position corrections
25
• Our strategy is:‣ Disentangle position effects from field
effects.‣ Apply a correction to account for position
effects only.• 83mKr has two decays close in time. The
ratio of the first-to-second S1 pulse area depends on field alone. This allows us to measure the component of variation due to applied field alone.
with the two signals exhibiting anticorrelation. It is then cru-cial that the scintillation dependence on the applied field,called field quenching, be known quantitatively for any cali-bration sources. Figure 7 shows the LY as a function of theapplied field, normalized to the zero field value, of the two83mKr transitions and the 57Co line. The uncertainty in theLY is dominated by a 2% systematic uncertainty taken fromthe measured fluctuations in the PMT gain over the durationof the run. The horizontal positions are determined by elec-trostatic field simulations of the detector in each voltage con-figuration used; horizontal uncertainties are the 1−! varia-tion in the field over the active volume. The simulations werecarried out using the COMSOL simulation package !commer-cially available",29 and verified with software written inhouse.
The time scale of the ionization signal 1–2 "s does notpermit the two 83mKr transitions to be resolved separately,and instead the S2 signal contains the combination of chargeemitted from both decays. This 41.5 keV summed-signal ion-ization yield is also shown in Fig. 7 normalized to Q0, thetheoretical total amount of initial charge produced prior toelectron-ion recombination. This value is determined by plot-
ting the S1 peak positions versus the S2 peak positions fromdata taken at various applied fields, shown in Fig. 8. As S1and S2 are anticorrelated, these data lie along a line havingnegative slope, with the line’s intercepts representing the to-tal number of quanta, ions plus excitons !Nion+Nex". Forelectronic recoils, the ratio of excitons to ions, Nex /Nion, istaken to be 0.06,30 and hence Q0 is 94.3% the value of the S2intercept. The horizontal positions and error bars are deter-mined in the same manner as those of the scintillation yieldmeasurements, while the vertical error bars are instead domi-nated by the statistical errors in the peak fits and the uncer-tainty in Q0.
The data are fit with a three-parameter function based onthe Thomas–Imel box model for electron-ionrecombination,32 given by
S!E"S!0"
,Q!E"Q0
= a1a2E ln#1 +1
a2E$ + a3, !1"
where E is the electric field strength, and S and Q are thescintillation and ionization yields, respectively. This model isused only to provide a convenient parametrization of thedata, and not to infer fundamental LXe physical propertiesfrom the results of the fits. The ai are the parameters of the
TABLE I. The measured zero-field LY, peak resolution !Res.", and field dependence fit parameters !ai". The rowfollowing 41.5 keV gives the charge collection of the summed signal. Uncertainties shown in LY are statisticalonly because these two peaks are taken from identical events, their systematic uncertainties are highly corre-lated, and hence do not affect the significance of the relative rise in LY.
E!keV"
LY!pe/keV"
Res.!! /"" a1
a2
!10−4 cm /V" a3
9.4 6.74#0.06 20.0% −0.35#0.06 6.3#3.0 132.1 6.43#0.04 14.4% −0.55#0.03 8.9#1.6 141.5 ¯ ¯ 0.406#0.006 17#2 0.074#0.012
123.6 6.38#0.05 11.5% −0.679#0.007 12.6#0.5 1
Applied Field [V/cm]
S(E
)/S(
0),Q
(E)/
Q0
83mKr (9.4 keV)
83mKr (32 keV)57Co
83mKr (41.5 keV, Charge)
0 500 1000 1500 20000
0.2
0.4
0.6
0.8
1
FIG. 7. !Color online" Field quenching, defined as the LY of a spectral linedivided by the LY obtained at zero field, or S!E" /S!0". Data collected from57Co !open black squares" are consistent with those reported in Ref. 31!solid gray diamonds". Dashed lines correspond to a fit parametrization de-scribed in the text. Also shown is the field-dependent charge collection ofthe combination of both 83mKr transitions, Q!E" /Q0; the two transitionsoccur too close in time for their ionization signals to be individually re-solved.
S1 [p.e.]
S2[p
.e.]
IS2
IS1
HigherField
FieldLower
0 50 100 150 200 250 300 350 4000
1
2
3
4
5x 10
4
FIG. 8. !Color online" The peak position in S2 vs S1 space for the 41.5 keVemission of 83mKr. The data are taken from applied fields ranging from 100V/cm to 1 kV/cm. The line is fit to the data having vertical and horizontalintercepts IS2 and IS1, respectively; these intercepts indicate the location ofNion+Nex.
073303-5 Manalaysay et al. Rev. Sci. Instrum. 81, 073303 !2010"
Author complimentary copy. Redistribution subject to AIP license or copyright, see http://rsi.aip.org/rsi/copyright.jsp
A.Manalaysay et al., Rev.Sci.Instrum. 81 (2010) 073303, 0908.0616
83Rb introduced in the system are discussed in Secs. III andIV.
III. ANALYSIS AND RESULTS
Once the 83mKr has entered the LXe, a 32.1 keV transi-tion might occur in the active region, which will then befollowed by the 9.4 keV transition. A 83mKr decay is, there-fore, indicated by two S1 pulses whose separation in time ischaracterized by a decaying exponential with t1/2=154 ns.Some of these transitions will occur too close in time to beresolved separately, giving a single 41.5 keV pulse; however,the strength of this signal is well below the background levelin the Xürich detector. On the other hand, many of the 83mKrdecays have a double S1 structure, while only a small frac-tion of non-83mKr decay events share this feature. An ex-ample of the PMT response from a 83mKr decay is seen inFig. 5 !top".
The events with such a double S1 structure are shownfrom one data set in Fig. 5 !bottom", with the area of the firstpulse plotted versus the area of the second pulse. In thisspace, it is evident that the 83mKr decays form a populationof events that is clearly separated from background. The boxindicates the energy cuts for first and second S1 pulses usedto identify 83mKr decays; before opening the Rb valve, back-ground data show no events within this box. After the Rbvalve has been opened, the rate of 83mKr decays in the totalLXe volume increases to the 20 Bq level in roughly 10 h. Inorder to further check that these are indeed 83mKr decays, thedistribution of S1 delay times !i.e., the time between the firstand second S1 pulses", !tS1, of events within the box of Fig.5 !bottom" is fit with a decaying exponential. The result ofthe fit, shown in Fig. 6 !top", gives t1/2=156"5 ns, consis-
tent with the published value of 154.4"1.1 ns.21 This excel-lent agreement validates the claim that these events are in-deed caused by 83mKr decays.
Due to the shaping of the PMT signals by the variousdata acquisition !DAQ" components, multiple S1 pulses thatare delayed by less than #100 ns cannot be separately re-solved. Additionally, the signal is required to be “clean” !i.e.,flat baseline" two samples before and after the pulse, in orderto register as a positive S1 identification during the offlineprocessing of the data. This makes the efficiency for detect-ing multiple S1 pulses less than unity for !tS1#250 ns, as isobvious from Fig. 6 !top". Therefore, the double S1 selectioncut detects 83mKr decays with an efficiency of approximately32% under these conditions.
The spectra, in pe, obtained at zero field from the twotransitions of 83mKr are displayed in Fig. 6 !bottom". AGaussian function is fit to each spectrum that is used to de-termine the LY and energy resolution, shown in Table I. Asmentioned in Sec. I, 57Co emits primarily 122 keV $ rays.However, there is a small additional contribution from 136keV. The two lines, however, are not distinguishable fromone another due to the detector’s energy resolution and in-stead give a single peak, whose weighted average energy is123.6 keV. The measurements suggest a rise in the LY atlower energies, consistent with behavior previously observedin LXe !Ref. 27" and also in the XENON10 detector.28 Thepeak resolutions !% /&" are also shown at zero field.
As mentioned in Sec. II, most LXe detectors use an ap-plied external electric field in order to collect electrons emit-ted from the interaction site. As the applied field is increased,more and more electrons leave the interaction, suppressingthe recombination process that contributes photons to thescintillation signal. The result is that both the scintillationand ionization responses vary strongly with applied field,
t [ns]
p.e.
/sam
ple
0 500 1000 1500 20000
20
40
60
83mKr
0 100 200 300 400First S1 [p.e.]
Seco
ndS1
[p.e
.]
Background
0 100 200 300 4000
20
40
60
80
100
120
FIG. 5. !Top" PMT output from a 83mKr decay. In this double pulse ofprimary scintillation light !S1", the first pulse corresponds to the 32.1 keVtransition with the second pulse resulting from the 9.4 keV transition. !Bot-tom" The area of the first S1 pulse vs the area of the second, for eventsshowing this characteristic two-pulse structure. Shown are distributionstaken before Rb exposure !“background”" and during Rb exposure !83mKr",demonstrating that the population of 83mKr decays is clearly separated frombackground events. The box represents the energy cuts used as the 83mKracceptance window.
∆tS1
[ns]
Cou
nts
0 200 400 600 800 1000 1200 1400 16000
50
100
S1 [p.e.]
Cou
nts
1st S12nd S1
0 50 100 150 200 250 30010
1
102
FIG. 6. !Color online" !Top" The distribution of delay times between firstand second S1 pulses for events in the 83mKr acceptance window. An expo-nential fit to the distribution gives a half-life of 156"5 ns, consistent withthe published value of 154 ns. !Bottom" Spectra from the two 83mKr transi-tions, summed over all runs taken at zero field.
073303-4 Manalaysay et al. Rev. Sci. Instrum. 81, 073303 !2010"
Author complimentary copy. Redistribution subject to AIP license or copyright, see http://rsi.aip.org/rsi/copyright.jsp

Dark-matter results from 332 new live days of LUX data
A. Manalaysay | LUX: IDM2016
Dealing with a varying/changing field
26
How to deal with a field that is varying in space and varying in time?
—> Break the Run up into M time bins—> Break the detector volume up into N voxelsIn each of the MxN segments, treat that segment as having a uniform detector model for ER and NR response (i.e. constant applied field and other detector parameters).
Too few segments —> Field variation not adequately accounted for.Too many segments —> Calibration data too sparse; computational resources become strained.
4x4 segments adequately captures the field variation. —>We effectively have 16 independent detectors

Dark-matter results from 332 new live days of LUX data
A. Manalaysay | LUX: IDM2016
Data parameter space
27
3
1.7
9
2.9
15
4
21
5.2
27
6.3
33 keVnr
7.58.7 9.8 keVee
S1 (phd)
log 10
[S2
(phd
)]
0 10 20 30 40 502.2
2.4
2.6
2.8
3
3.2
3.4
3.6
3.8
4 ER band
NR band
Energy contours
(constant number of quanta)
•Likelihood analysis performed in observed quantities (data not converted to energy: model converted to S1, S2)
•Dashed curves are 10-90%-iles.

Dark-matter results from 332 new live days of LUX data
A. Manalaysay | LUX: IDM2016
2
3
4
5
6
7
89
10
20
1 10 100
0 V/cm1802903650
0 V
/cm
keV
2
3
4
5
6
7
89
10
20
1 10 1002
3
4
5
6
7
89
10
20
1 10 100
light
yie
ld [p
hoto
ns/k
eV]
nuclear recoil energy [keV]
2
3
4
5
6
7
89
10
20
1 10 100
Framework for modeling ER and NR response
28
• We use the Noble Element Simulation Technique (NEST) as a framework for modeling the S1 and S2 response of LXe due to a variety of particles, energies, and applied fields. Developed and based on world’s data.
• The NEST model is “tuned” to each of the 16 detectors by varying the applied field until we see a match between model and calibration data.http://nest.physics.ucdavis.edu

Dark-matter results from 332 new live days of LUX data
A. Manalaysay | LUX: IDM2016
Periodic calibrations
29
Sep.2014 May 2016
Botto
mTo
p Gray density: CH3T calibration (ER)
Orange density: DD calibration(NR)
Solid lines: NEST model, band mean.
Dashed lines: NEST model, 10-90 percentile.

Dark-matter results from 332 new live days of LUX data
A. Manalaysay | LUX: IDM2016
Periodic calibrations
30
Sep.2014 May 2016
Botto
mTo
p Gray density: CH3T calibration (ER)
Orange density: DD calibration(NR)
Solid lines: NEST model, band mean.
Dashed lines: NEST model, 10-90 percentile.
The detector is thoroughly calibrated (out of necessity).
Our NEST models are tuned on these empirical results.
NEST models are tuned to data by adjusting E-field and the r
Fano factor.
Dark-matter results from 332 new live days of LUX data
A. Manalaysay | LUX: IDM2016
Radiogenic backgrounds
31
500 1000 1500 2000 2500 300010−3
10−2
10−1
100127Xe 214Pb (238U)
214Bi (238U)228Ac (232Th)
60Co 40K214Bi (238U)
208Tl (232Th) + 60Co
Energy deposited [keVee]
cts
/ keV
ee /
kg /
day
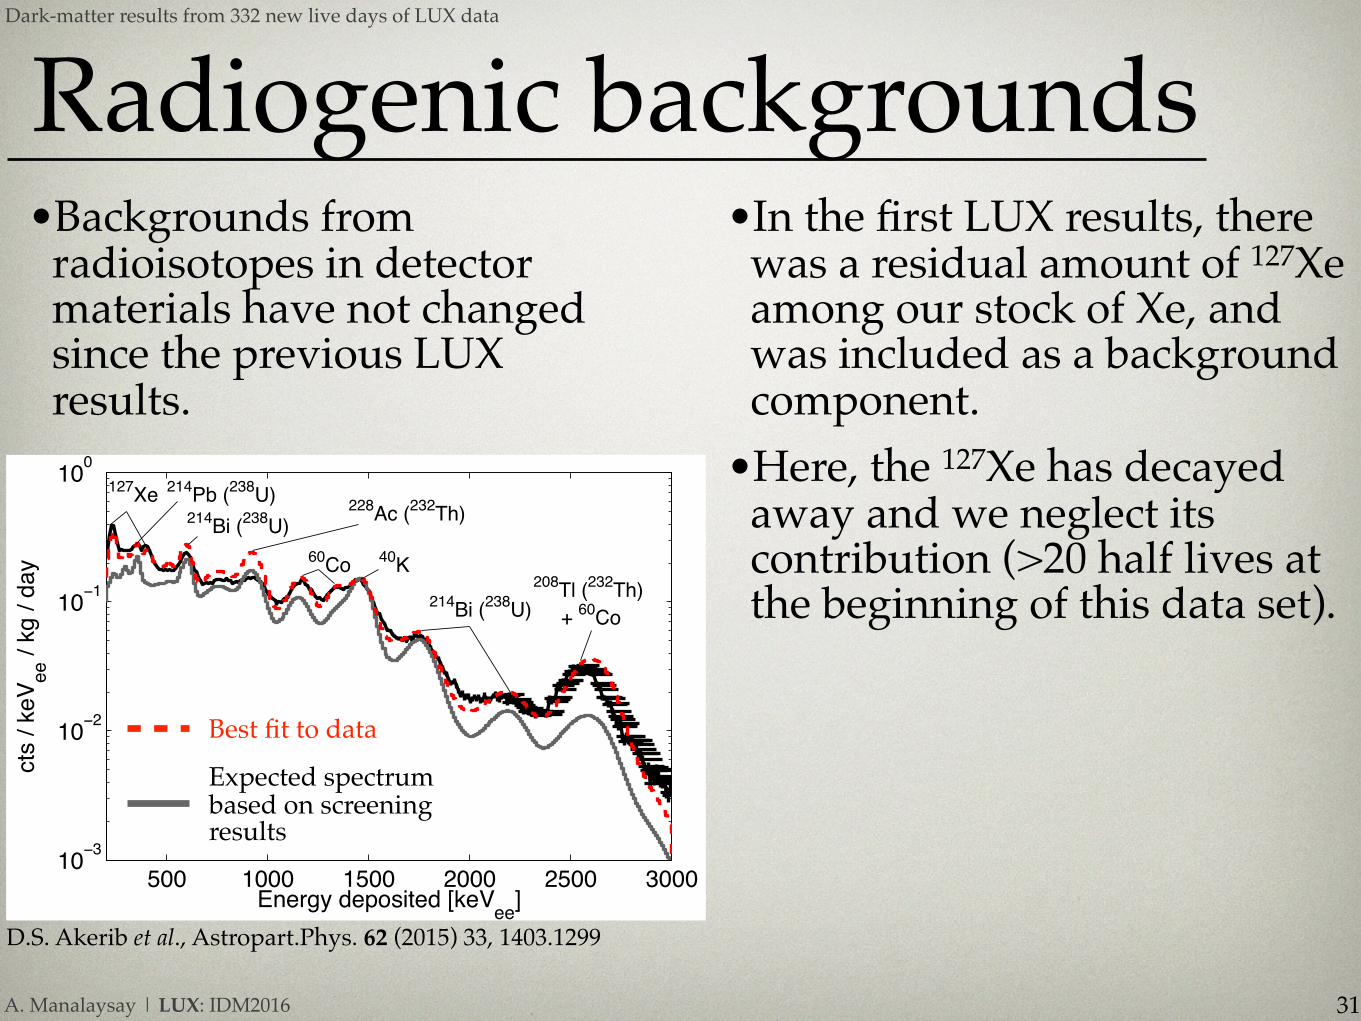
Figure 2: Measured � ray spectrum in the LUX drift re-gion (black), with peak identification labels. A 225 kgfiducial volume is used for the analysis, removing the topand bottom 2 cm of the drift region, and using no radialcut. Data includes both SS and MS events. Event en-ergies are reconstructed from the combination of S1 andS2 signals. Horizontal error bars are shown, represent-ing systematic uncertainties in energy reconstruction forhigh-energy events. Two simulation spectra are shown forcomparison. A spectrum based on positive counting mea-surements alone is shown in gray solid. The spectrum withbest-fit scaling for 238U, 232Th, 40K, and 60Co decays, withindependent rates in top, bottom, and side regions of thedetector, is shown as gray dashed (red, in color). Fittingwas performed for energies above 500 keVee. Energies be-low 500 keVee are shown to illustrate the continued agree-ment between � ray spectra and measured data below thefitting threshold. The spectrum shown has a lower boundat 200 keVee. Best-fit decay rates are listed in Table 3.
Figure 3: LUX � ray ER background density in the range0.9–5.3 keVee as a function of position, extrapolated fromhigh-energy measurements based on Monte Carlo spectra.Rates are in units of log10 (DRUee). The 118 kg fiducialvolume used in the 85.3 day WIMP search run is overlaidas the black dashed contour.
2.3. Cosmogenic Xenon Radioisotopes2.3.1. Production Models
The rate of production of noble element radioisotopesin Xe due to cosmic ray exposure was assessed using theACTIVIA simulation package [11]. The ACTIVIA codemodeled isotope production in natural Xe after a 150 dayexposure at sea level. Only noble elements were consid-ered, as the LUX purification system is presumed to sup-press the concentration of non-noble radioisotopes belowsignificance [14, 15].
The short-term exposure history of the LUX Xe is wellknown. From April 2012 to December 2012, the Xe was lo-cated at Case Western Reserve University (altitude 200 m)in a basement laboratory, where it was processed for Krremoval as discussed in Sec. 2.5. The Xe was shipped byground to Sanford in separate batches and stored aboveground (altitude 1.6 km), before being brought under-ground on January 30, 2013. This adds up to roughly halfthe total Xe load in LUX having spent 49 days at SanfordAboveground Laboratory altitude, and the other half hav-ing spent 7 days at that altitude. Reference [13] providessome guidance for how to scale the muon-induced neutronflux and spectrum with altitude, which can be input intoactivation simulations. However, the effect of immediatesurroundings in the lab can introduce an important sys-tematic error in particular on the flux of thermal neutronsincident on the Xe. LUX does not have measurementsof the thermal neutron flux at the various relevant loca-tions. In the calculations below, the sea-level activationresults from ACTIVIA were used as a starting point. Sep-
7
D.S. Akerib et al., Astropart.Phys. 62 (2015) 33, 1403.1299
•Backgrounds from radioisotopes in detector materials have not changed since the previous LUX results.
•In the first LUX results, there was a residual amount of 127Xe among our stock of Xe, and was included as a background component.
•Here, the 127Xe has decayed away and we neglect its contribution (>20 half lives at the beginning of this data set).
Expected spectrum based on screening results
Best fit to data

Dark-matter results from 332 new live days of LUX data
A. Manalaysay | LUX: IDM2016
Wall-surface backgrounds
32
210Po 𝛼
• Radon plate-out on PTFE surfaces survives as 210Pb and its daughters (mainly 210Bi and 210Po).
• Betas and 206Pb recoils into the LXe travel negligible distance, but they can be reconstructed some distance from the wall as a result of position resolution (especially for small S2 sizes).
• These sources can be used to define the radius of the wall in measured coordinates, for any combination of drift-time and 𝜙
Measured

Dark-matter results from 332 new live days of LUX data
A. Manalaysay | LUX: IDM2016
Wall-surface backgrounds
33
210Po 𝛼
• Radon plate-out on PTFE surfaces survives as 210Pb and its daughters (mainly 210Bi and 210Po).
• Betas and 206Pb recoils into the LXe travel negligible distance, but they can be reconstructed some distance from the wall as a result of position resolution (especially for small S2 sizes).
•We define our fiducial volume as 3cm inwards from the measured wall.
110
1001000
Even
ts S2 ∈ [200, 500] phd S1 ∈ [ 55, 500] phd
Data Wall Model
110
1001000
Even
ts S2 ∈ [500, 900] phd S1 ∈ [ 55, 500] phd
110
1001000
Even
ts S2 ∈ [900, 1300] phd S1 ∈ [ 55, 500] phd
110
1001000
Even
ts S2 ∈ [1300, 1800] phd S1 ∈ [ 55, 500] phd
−5 −4 −3 −2 −1 0 1 2 3 4 51
10100
1000
Distance to the wall (cm)
Even
ts S2 ∈ [1800, 3000] phd S1 ∈ [ 55, 500] phd
Fiducial boundary
Into detector
Out of detector
Increasing S2

Dark-matter results from 332 new live days of LUX data
A. Manalaysay | LUX: IDM2016
110
1001000
Even
ts S2 ∈ [200, 500] phd S1 ∈ [ 55, 500] phd
Data Wall Model
110
1001000
Even
ts S2 ∈ [500, 900] phd S1 ∈ [ 55, 500] phd
110
1001000
Even
ts S2 ∈ [900, 1300] phd S1 ∈ [ 55, 500] phd
110
1001000
Even
ts S2 ∈ [1300, 1800] phd S1 ∈ [ 55, 500] phd
−5 −4 −3 −2 −1 0 1 2 3 4 51
10100
1000
Distance to the wall (cm)
Even
ts S2 ∈ [1800, 3000] phd S1 ∈ [ 55, 500] phd
Fiducial definition
34
C. Silva
• We define our fiducial boundary as 3cm inwards from the observed wall in S2 space (done in 3D).
Into detector
Out of detector
Mea
sure
d w
all p
ositi
onFiducial volume

Dark-matter results from 332 new live days of LUX data
A. Manalaysay | LUX: IDM2016 35
Background estimatesBackground
sourceExpected
number below NR median
External gamma rays 1.51 ± 0.19
Internal betas 1.2 ± 0.06
Rn plate out(wall background) 8.7 ± 3.5
Accidental S1-S2 coincidences 0.34 ± 0.10
Solar 8B neutrinos (CNNS) 0.15 ± 0.02
Neutrons 0.3 ± 0.03
Bulk volume, but leakage at all energies
}}
} In the bulk volume, low-energy, in the NR band
Low-energy, but confined to the edge of our fid. volume[*]
[*] Our likelihood analysis includes position information, so these events have low 𝓛(signal)
Figure of merit only (we do a likelihood analysis)
3
1.7
9
2.9
15
4
21
5.2
27
6.3
33 keVnr
7.58.7 9.8 keVee
S1 (phd)
log 10
[S2
(phd
)]
0 10 20 30 40 502.2
2.4
2.6
2.8
3
3.2
3.4
3.6
3.8
4

Dark-matter results from 332 new live days of LUX data
A. Manalaysay | LUX: IDM2016
(phd)cS15 10 15 20 25 30 35 40 45 50
Eve
nts
05
1015202530
)clog(S22 2.2 2.4 2.6 2.8 3 3.2 3.4 3.6 3.8 4
Eve
nts
020406080
100
r (cm)0 2 4 6 8 10 12 14 16 18 20
Eve
nts
020406080
100
s)µdrift time (50 100 150 200 250 300
Eve
nts
020406080
100120140
phi (radian)3− 2− 1− 0 1 2 3
Eve
nts
050
100150200250
Profile Likelihood Analysis
36
•Data are compared to models in an un-binned, 2-sided profile-likelihood-ratio (PLR) test.
•5 un-binned PLR dimensions:‣Spatial: r, 𝜙, drift-time (raw-
measured coordinates)‣Energy: S1 and log10(S2)
•1 binned PLR dimension:‣Event date
•The data in the upper-half of the ER band were compared to the model (plot at right) to assess goodness of fit.

Dark-matter results from 332 new live days of LUX data
A. Manalaysay | LUX: IDM2016
Cut efficiencies
37
•Cuts on the S2 topology are applied, targeting:
‣ S2 waveform (“Gas-event” and “Merged S2”)
‣ S2 PMT hit pattern “S2 hit-pattern cut”
•Flat signal acceptance at high S2, falling to 60% acceptance at S2 threshold.
Gas-event cutMerged S2 cut
200 400 4x10³
S2 hit-pattern cut

Dark-matter results from 332 new live days of LUX data
A. Manalaysay | LUX: IDM2016
Details of the WIMP search
38
•11 September 2014 — 3 May 2016•Live time (332.0 days)
๏ Time-bin 1 (2014.09.09-2014.12.31): 46.8 live-d (31.8 d not salted)๏ Time-bin 2 (2015.01.01-2015.03.31): 46.7๏ Time-bin 3 (2015.04.01-2015.09.30): 91.6๏ Time-bin 4 (2015.10.01-2016.05.03): 146.9
•Fiducial mass:๏ Time-bin 1: 105.4 ± 5.3 kg๏ Time-bin 2: 107.2 ± 5.4๏ Time-bin 3: 99.2 ± 5.0๏ Time-bin 4: 98.4 ± 4.9 (33500 ± 1700) kg days

Dark-matter results from 332 new live days of LUX data
A. Manalaysay | LUX: IDM2016
WIMP-search data
39
3
1.7
9
2.9
15
4
21
5.2
27
6.3
33 keVnr
7.58.7 9.8 keVee
S1 (phd)
log 10
[S2
(phd
)]
0 10 20 30 40 502.2
2.4
2.6
2.8
3
3.2
3.4
3.6
3.8
4
3
1.7
9
2.9
15
4
21
5.2
27
6.3
33 keVnr
7.58.7 9.8 keVee
S1 (phd)
log 10
[S2
(phd
)]
0 10 20 30 40 502.2
2.4
2.6
2.8
3
3.2
3.4
3.6
3.8
4•Traditional blinding
(example seen here) masks the signal region completely.
•Challenge (seen very often in this community):
‣One is also blind to rare backgrounds and pathologies.
•One need not go to this extreme in order to mitigate bias.

Dark-matter results from 332 new live days of LUX data
A. Manalaysay | LUX: IDM2016
WIMP-search data
40
•Traditional blinding (example seen here) masks the signal region completely.
•Challenge (seen very often in this community):
‣One is also blind to rare backgrounds and pathologies.
•One need not go to this extreme in order to mitigate bias.
Salt is included!
3
1.7
9
2.9
15
4
21
5.2
27
6.3
33 keVnr
7.58.7 9.8 keVee
S1 (phd)
log 10
[S2
(phd
)]
0 10 20 30 40 502.2
2.4
2.6
2.8
3
3.2
3.4
3.6
3.8
4

Dark-matter results from 332 new live days of LUX data
A. Manalaysay | LUX: IDM2016
WIMP-search data
41
Salt is included!
•Instead of traditional blinding, we employ a technique where fake signal events (“salt”) are injected into the data stream.
•Fake events are injected at the level of raw waveforms, and are built from calibration data (not simulation).
•Mitigates bias while allowing for scrutinization of individual events.
•Used already in neutrino experiments and searches for fractional charge. 3
1.7
9
2.9
15
4
21
5.2
27
6.3
33 keVnr
7.58.7 9.8 keVee
S1 (phd)
log 10
[S2
(phd
)]
0 10 20 30 40 502.2
2.4
2.6
2.8
3
3.2
3.4
3.6
3.8
4

Dark-matter results from 332 new live days of LUX data
A. Manalaysay | LUX: IDM2016
WIMP-search data
42
•This plot shows the data from our 16 “detectors” stacked on top of each other.
•Dots are events:
‣Gray: within 1cm of our fiducial boundary
‣Black: bulk events
•Salt is not yet identified here.Salt is included!
3
1.7
9
2.9
15
4
21
5.2
27
6.3
33 keVnr
7.58.7 9.8 keVee
S1 (phd)
log 10
[S2
(phd
)]
0 10 20 30 40 502.2
2.4
2.6
2.8
3
3.2
3.4
3.6
3.8
4

Dark-matter results from 332 new live days of LUX data
A. Manalaysay | LUX: IDM2016
3
1.7
9
2.9
15
4
21
5.2
27
6.3
33 keVnr
7.58.7 9.8 keVee
S1 (phd)
log 10
[S2
(phd
)]
0 10 20 30 40 502.2
2.4
2.6
2.8
3
3.2
3.4
3.6
3.8
4
WIMP-search data
43
•This plot shows the data from our 16 “detectors” stacked on top of each other.
•Dots are events:
‣Gray: within 1cm of our fiducial boundary
‣Black: bulk events
•Red and blue curves are the ER and NR bands, respectively.
•With salt removed.

Dark-matter results from 332 new live days of LUX data
A. Manalaysay | LUX: IDM2016
WIMP-search data
44
•After salting, events outside the ER band were scrutinized again.
•Two populations of rare pathological events were identified, that had contributed three particularly dangerous events. A
BC
3
1.7
9
2.9
15
4
21
5.2
27
6.3
33 keVnr
7.58.7 9.8 keVee
S1 (phd)
log 10
[S2
(phd
)]
0 10 20 30 40 502.2
2.4
2.6
2.8
3
3.2
3.4
3.6
3.8
4

Dark-matter results from 332 new live days of LUX data
A. Manalaysay | LUX: IDM2016
Three pathological events
45
•Events A and B have ~80% of the light in a single top-edge PMT. Consistent with energy deposited outside the TPC, and light leaking through a gap near the edge of the PMT array. p of O(10-9) and O(10-10) for A and B, respectively.
•Event C is highly concentrated under a few top PMTs and has a time structure consistent with gas scintillation emission. Event came after high rate in preceding 1 second.
•Since these events do not correspond to interactions in the TPC, we develop cuts [post-un-salting] to target them.
S1 pulses(S2 for these
events are fine)

Dark-matter results from 332 new live days of LUX data
A. Manalaysay | LUX: IDM2016
Three pathological events
46
•Post-un-salting cuts:‣Loose cuts (high signal acceptance), defined on calibration data.‣ Flat signal acceptance.
AB
C
A
B
C

Dark-matter results from 332 new live days of LUX data
A. Manalaysay | LUX: IDM2016
WIMP-search data
47
•This plot shows the data from our 16 “detectors” stacked on top of each other.
•Dots are events:
‣Gray: within 1cm of the radial fiducial boundary
‣Black: bulk events
•Red and blue curves are the ER and NR bands, respectively.
•Salt is removed.
•red events: removed by post-unsalting cuts.
3
1.7
9
2.9
15
4
21
5.2
27
6.3
33 keVnr
7.58.7 9.8 keVee
S1 (phd)
log 10
[S2
(phd
)]
0 10 20 30 40 502.2
2.4
2.6
2.8
3
3.2
3.4
3.6
3.8
4

Dark-matter results from 332 new live days of LUX data
A. Manalaysay | LUX: IDM2016
WIMP-search data
48
•This plot shows the data from our 16 “detectors” stacked on top of each other.
•Dots are events:
‣Gray: within 1cm of the radial fiducial boundary
‣Black: bulk events
•Red and blue curves are the ER and NR bands, respectively.
•Salt is removed.
•Post-un-salting cuts applied.
•p-value = 40% consistent with background-only hypothesis.
3
1.7
9
2.9
15
4
21
5.2
27
6.3
33 keVnr
7.58.7 9.8 keVee
S1 (phd)
log 10
[S2
(phd
)]
0 10 20 30 40 502.2
2.4
2.6
2.8
3
3.2
3.4
3.6
3.8
4

Dark-matter results from 332 new live days of LUX data
A. Manalaysay | LUX: IDM2016
SI WIMP-nucleon exclusion
49
•Brazil bands show the 1- and 2-sigma range of expected sensitivities, based on random BG-only experiments.
•Factor of 4 improvement over the previous LUX result in the high WIMP masses
•Minimum exclusion of 2.2 x 10-46 cm2 at 50 GeV
8B
PandaX 2015
DarkSide−5
0 2015
XENON100 2012
LUX 2014
LUX 2015
This Resu
lt
mWIMP ( GeV/c2 )
WIM
P−nu
cleo
n cr
oss s
ectio
n ( z
b )
101 102 103 104 105
10−1
100
101
102
103
WIM
P−nu
cleo
n cr
oss s
ectio
n ( c
m 2 )
10−45
10−44
10−43
10−42

Dark-matter results from 332 new live days of LUX data
A. Manalaysay | LUX: IDM2016
SI WIMP-nucleon exclusion
50
•Brazil bands show the 1- and 2-sigma range of expected sensitivities, based on random BG-only experiments.
•Factor of 4 improvement over the previous LUX result in the high WIMP masses
•Minimum exclusion of 2.2 x 10-46 cm2 at 50 GeV
8B
PandaX 2015
DarkSide−5
0 2015
XENON100 2012
LUX 2014
LUX 2015
This Resu
lt
mWIMP ( GeV/c2 )
WIM
P−nu
cleo
n cr
oss s
ectio
n ( z
b )
101 102 103 104 105
10−1
100
101
102
103
WIM
P−nu
cleo
n cr
oss s
ectio
n ( c
m 2 )
10−45
10−44
10−43
10−42
4x

Dark-matter results from 332 new live days of LUX data
A. Manalaysay | LUX: IDM2016
Summary and next steps
51
•New world-leading result from LUX’s 332 live-day search, cutting into un-probed parameter space. Excluding SI WIMPs down to 0.22 zepto barns
•Publication to be submitted soon; more details on this analysis available today at luxdarkmatter.org
•More analyses forthcoming (SD, axion, ALPs, etc.)•LUX is currently performing a series of end-of-run
calibration campaigns.•Onwards and downwards: LUX-ZEPLIN (LZ)
experiment under construction, 7 tonne active mass (2020).