danygraig primary school - swansea edunet · web viewmr cummins caretaker and miss e raven ta...
TRANSCRIPT
October 2015
Annual Report of the Governing Body for Danygraig Primary School Group S33
Under the Provision of the School Standards and Organisation (Wales) Act 2013.Governing bodies will provide parents of registered pupils with an annual report.
It will no longer be necessary for Governing bodies to hold an Annual meeting with parents.
Parents have the right to petition a meeting with Governors up to 3 times a year, signed by either 10% of parents of registered pupils or 30 parents whichever is the lower. Discussion will be on issues relating to the school and not individual pupils.
Dear Parents/Guardians,
We the Governors of Danygraig Primary take this opportunity to outline a summary of the responsibilities of the Governing body in the discharge of their duties.
Much of the life of the school, its statistics and achievements, of which there are many are listed in this report. I as chairperson wish to thank my colleagues for their support and commitment throughout the past year.
I also wish to thank the Headteacher and the whole school staff for their unfailing dedication to the education and wellbeing of our children. Most sincerely, I thank you our parents. Your co-operation and continued support in all aspects of school life is greatly appreciated.
Danygraig is making every effort to address the needs and demands of education in the 21st century. It is our aim to ensure that all pupils achieve their full potential.
Working together staff, parents, governors and pupils we can face the challenges ahead.
Cllr Clive Lloyd (Chairperson).
Governing Body Members Category End of term of Office
Mr N P Morgan Headteacher
Mrs S Driscoll Clerk
Cllr C Lloyd (Chairperson) LA Governor August 2016
GD 1

Cllr J Hale LA Governor August 2016
Mr G Wheel Community February 2016
Mrs P Thomas Community October 2019
Mrs M Renzi-Davies Community December 201 8
Mrs N Jackson Parent January 2019
Mrs S Hyett Parent December 2018
Mrs M Fairhead Parent November 2015
Mr Khandaker El-Wahid Parent November 2015
Mrs S Stokes Staff July 2017
Mrs V Harris Support Staff June 2019
There is currently a vacancy for 1 LA governor.
Appropriate ballots are held when the term of office ends apart from LA governors. Vacancies will arise for parent governors in November 2015 .The School will advise nearer to that date of procedures for application.
The School was inspected through Estyn, the Welsh Assembly Government Inspectorate in the Summer Term 2015. A full report is online or on request from the office.
Governing Body Meetings
In discharging its duties, the Governing body meets regularly. Topics discussed have included staffing, school organisation, curriculum, finance, premises and future development.
As governors we are always available for consultation.
During the past year governors have:
: Received and considered reports from the Head teacher on school organisation, curriculum, training, educational visits and pupil achievements.
GD 2
: Ensured that resources have been properly managed and finances have been correctly accounted for in accordance with the authority’s regulations.
: Monitored the employment of teaching and non teaching staff.
: Received reports on SEN/ALN and Child Protection issues.
: Monitored the implementation of the Wales Curriculum.
: Approved and received school policies and service level agreements.
: Implemented and discussed Welsh Assembly initiatives.
: Ensured premises are well maintained and safe.
The School Prospectus is available on Swansea Edunet Portal. Content remains as at publication date 2014.
Term Dates for 2015-2016
Term Term HalfTerm
HalfTerm
Term
Autumn2015
September 1st
October23rd
October26th
October30th
November2nd
Dec18th
74
Spring 2016
January 4th
February12th
February15th
February 19th
February22nd
Mar24th
54
Summer2016
April 11th
May27th
May30th
June 3rd
June 6th
July20th
67
Total Days 195BankHolidays
GoodFriday
EasterMonday
MayDay
SpringHoliday
InsetDay
March 25th
March 28th
May 2nd May30th
Session Times
Morning Nursery 8:50am -11:20am
Afternoon Nursery 12: 50pm -15:20pm
Specialist Teaching 8:50am -15:00pm GD 3

Foundation –Year 6 8:50am - 15:20pm
Lunchtime 11:55am - 12: 55pm
Staffing and Pupils: Pupil Numbers. At present the pupil numbers stand at FTE :235 Junior :128 Foundation:99 Nursery:29 PT:29 FSTF :7 JSTF :8
Teaching Staff
Mr NP Morgan Headteacher
Mr AP Byrne Deputy Head/Head of KS2 Year 4
Mrs B Currenti Asst Head/SENCO/LNF Manager FSTF
Mrs S Stokes Asst Head/Head Foundation Reception/Year 1
Mrs Z Morelli Nursery/Reception
Mrs H Morgan Year1
Mrs R Williams Year2
Mr D Field Year3
Miss S Flower Year3/4
Mrs S Jeremiah ALN/Boys Learning Year 5
Mrs A Thomas Year 5
Mr P Hobbs JSTF
Mrs L Smedley PPA Cover
Teaching Assistants
Mrs V Harris HLTA Mrs H Phillips Mrs A Stevens
Mrs S Dicataldo Mrs S Lewis Miss T Thomas
Mrs C Boat Mrs K Rees Mr J Hopkins
Mrs S Driscoll Miss L Stephens Mr D Nevis
Mrs D Llewellyn Miss G Coates Mrs D Davies Mrs C Merriman Mrs L Harriss
Pastoral Support Officer
GD 4

Mrs K Jones
Literacy/Numeracy Support
Mrs H Lawrence, Mrs Q D’Silva
Lunchtime Supervisors
Ms J Martin, Mrs G Woods, Mrs B Thomas, Mrs M Norris, Miss C Evans, Miss N Jones
Administration/Clerical
Mrs G Pennock, Mrs D Lancey.
Cleaning Staff
Mrs K Rees, Mrs B Thomas, Mrs P Betty
Canteen/Catering
Mrs K Bevan, Mrs P Richards, Mrs S Mages
Breakfast Club
Mrs K Bevan, Mrs B Thomas, Mrs M Norris, Mrs S Moore
Caretaker
Mr S Davies
Community Links
The School is involved in a variety of community/School projects.
Police and community (PACT).
Recycling- Eco Schools.
Healthy Eating
Art in the Community
Waterfront Community Church
Fabian Bay Congregational Church
St Stephens Church
Design to Smile
GD 5

The school has good links with our local churches, police and Library. We are involved in Sports projects with the Ospreys, Swansea City FC, WRU, and the tennis centre. Business Links include Tesco, Sainsbury, Amazon, Admiral, Rees Davies Funeral Directors, East Side Printers, Leyland Paints and Lovells. We have continued our links with Swansea University, Swansea Metropolitan University and Gower College.
The Friends Association continue to support the school in a range of activities. The Governing body would like to express its gratitude and appreciation to those members.
The local Brownie Group have use of the school hall one evening per week.
We now take part in the Welsh Assembly free breakfast initiative. The facility operates daily and is well attended.
Extra -curricular activities
A school choir, instrumental group, science club, techno troop, and gardening club are held during lunchtimes. After school clubs include rugby, football, athletics, netball, rounders, cricket, badminton, tennis, author club, film club and gymnastics.
PE and Games Skills are included for all pupils with curriculum provision. We also provide a programme of school and inter school sports activities and competitive matches, enabling pupils to develop sports and social skills, together with a positive attitude towards a health regime .As well as the sports above pupils are involved with cycling in the summer and swimming. The WRU and Swansea City continue to hold training sessions on a weekly basis.
Achievements:
Basic Skills Quality Mark (Twice)
Eco Green Flag
Recycling Silver and Gold Awards
Dyslexia Friendly School Award
Health Promoting School
Internet: Internet, e-mail is now established throughout the school. The school adheres to a policy for safe use of the internet.
School uniform: We believe the wearing of school uniform helps bring a sense of pride and belonging to the school and community.
GD 6

School Council: The school council has elected representatives from Yr2-Yr6 they are encouraged to contribute positively. Their opinions and views are invaluable to school evaluation and development
School Assembly: A multi-cultural assembly is held every morning. These are taken by the Head teacher, teaching staff and occasionally local clergy. Pupil achievements and attendance are recognised and celebrated during a weekly awards assembly.
Health and Safety/Wellbeing: All policies are updated regularly, these include medical and health care plans, discrimination and equal opportunities, educational visits, risk assessments, security and internet safety .A full emergency evacuation plan is in place and fire safety training has been completed by all staff. Regular fire drills are carried out and a full business continuity plan is in place. Twelve members of staff have been trained in First Aid. Each classroom now has a designated first aider and provision of first aid boxes has been increased for adequate coverage.
Premises: The school is monitored annually for asbestos, we are graded as black which is very low risk. Staff and contractors are informed of the location and the current plan includes risk assessments and control measures. The boiler house roof has water ingress presenting a danger to the boiler and electric, quotes are being obtained for the completion of safety work. Installation of a poly-tunnel has now been completed enabling the children to grow and sell their own vegetables.
Finger guards have been replaced on all doors to comply with safety policies, and fire safety doors are to be installed in the computer suite. An emergency lighting system has been installed. Negotiations are ongoing with the LA regarding repairs to the playground. The school continues to use an access intercom system and CCTV. A current accessibility plan is in operation with all gates closed during the school day as per Estyn recommendations. The policy is situated in the main office.
Restorative Practise/Safeguarding
All staff and Governors have undertaken training on Restorative Practise procedures and use them appropriately on a daily basis. The safeguarding policy is adhered to by all staff.
Accessibility Plan and Policy: Under the schools accessibility plan a ramped access has been installed. The main office is situated on the ground floor along with a physiotherapy medical room. Disabled changing and toilet facilities are also available. All toilet facilities are on the ground floor, have hand dryers and are cleaned and replenished daily.
Inset (In Service Training): Members of staff are continuing to attend local authority organised and school based training activities in accordance with the schools policy on CPD .(Continuing Professional Development).GD 7
Attendance/Exclusions: Attendance has improved from 91% with an average attendance of 94%. A pastoral support officer is employed to deal with emotional welfare, attendance, social services, admissions, looked after children, and liaison with asylum families and the community. The school is pleased that there have been no exclusions.
Bi-lingual Policy: Danygraig fully promotes bi-lingual policy and practise. Welsh is encouraged in all aspects of school life, activities, subject lessons and displays .It is our aim to also promote the use of welsh in less formal situations ie: breakfast club, canteen and playground.
ALN/SEN: (Additional and Special Learning Needs) Mrs Currenti Assistant Head is the ALN/SEN manager. The school operates two specialist teaching facilities and also provides for the needs of several other children with statements of SEN within mainstream. School action plus entails support from outside agencies such as speech and language therapy, physiotherapy and local health centres. Danygraig also works with EMLAS to provide support for pupils with English as an additional language. A MAT (more able and talented) register is kept and constantly reviewed in order to focus on specific talents and skills. New schemes of work have also been implemented to improve boys learning.
Development Plan and Strategies: The school has an on-going SDP (School Development Plan) with the main aim of raising standards in key skills, pupil performance and attainment. It also addresses Post inspection issues and ongoing challenges. The school uses standardised NFER tests in Maths and English from reception – Year 6 to obtain benchmark data. INCERTS are also used to produce an acceptable format for recording individual progress and reporting LNF (Literacy and Numeracy tests) results to parents.
Monitoring of Standards: The monitoring and evaluation of standards is carried out by the Headteacher and Senior Management Team, curriculum leaders, class teachers and Governors. We have developed a culture of self evaluation for staff and governors. A full programme of subject leader monitoring is in place there is a one year cycle for core subjects and two year cycle for others. Classroom observations take place taking particular notice of the development of Literacy and Numeracy skills within subjects.
Data/Targets: Teacher assessments of learner standards are completed in Year 2 and Year 6.The information is fed into the all Wales Core Data. The school is ranked in a quartile table system along with other similar schools across Wales It is necessary for the school to disaggregate STF(Specialist Teaching Facility) learners from the data to present an accurate picture. A recent report from the ERW places Danygraig in the top quartile the overall judgement being: Learner Outcome and Capacity to improve both GOOD.
GD 8

However the recent Estyn report disagreed and rated the school’s current performance and prospects for improvement to be ADEQUATE. A post inspection action plan is currently being implemented to meet all recommendations.
Primary /Secondary School Liason: Danygraig works closely with our secondary school partner Cefn Hengoed. Staff from partner schools provide curriculum links, transition, meet to discuss pupil information and attend open evenings. Pupils from Danygraig visit on induction and selected activity days. Most Year 6 leavers go on to attend Cefn Hengoed, some however choose to attend other comprehensive schools. Sports tournaments for partner schools have featured strongly.
Finance: The main expenditure in providing an educational establishment has been met by the schools delegated budget. Unfortunately due to Local authority budget cuts the governing body had to recommend staff cuts in order to set a budget.
The budget includes grants for PDG (Pupil Deprivation Grant) and SEG(Strategic Education Grant). Income has been generated from the schools training partnership with Swansea Metropolitan University together with a nominal amount from school lettings. Fundraising and donations from the Friends Association have assisted in school resourcing. The above are in addition to the school budget.
A recent quote from the ERW report states:
Danygraig is a Good to Outstanding School, with
. Good outcomes and Good capacity to improve.
GD 9
DANYGRAIG PRIMARY SCHOOL
Headteacher:
Mr. N. Morgan B.A. Hons.
Tel: Swansea (01792) 650946
Fax: Swansea (01792) 641704
E-mail: [email protected]
https://swansea-edunet.gov.uk
Ysgol Street,
Port Tennant,
SWANSEA
SA1 8LE
Portal: www.danygraig.swansea.sch.uk
Headteacher’s Annual Report 2015
Dear Parents,
The report covering the period September/Medi 2014 to July/Gorffennaf 2015 is as follows:
Changes to staffing since Summer 2015: -
Mr Hobbs elected to work on a part-time basis – 0.8 (four days a week) in the Junior STF. Mrs Jones and Mrs D’Silva have both returned from maternity leave.
Mr Cummins caretaker and Miss E Raven TA resigned.
Mrs Sian Stark Year1 Teacher and Mrs Jan Griffiths Admin Manager took well-deserved early retirement at the end of the summer term 2015. I’m sure you’d like to join me in wishing them both good health and every happiness for the future.
Mrs Dicataldo TA and Mrs Lancey Admin are both currently on long term sickness until October 2015.
Standards and Performance:
The following is from a report from ERW and the school’s System Leader - December 2013 Dear Head and Chair of Governors of Danygraig Primary School, I’m sure that you are aware that, as part of a regional approach to school improvement, Swansea LA has been working closely with all schools to help them improve: Main Strengths – Danygraig Primary School
GD 10
Upward trend in Foundation Phase across all areas of learning and performance above the family average after disaggregation of the pupils attending the STF
In Foundation Phase, the attainment of FSM (Free School Meal) pupils is comparable and in some cases exceeds that of the non-FSM pupils At Key Stage 2, after disaggregating the results of pupils attending the STF results are above the family average (NB The school will, however, aim to ensure the gap is narrowed, and that FSM learners can attain at a favourable rate to non FSM learners)A focus on utilising approaches to improve the performance of boys at higher levels has impacted positively Extent and impact of strategic partnerships is a strength of the school Self-evaluation practices are utilised very effectively to plan for school improvement
Areas for development (All addressed in the School Development Plan)Improve the performance of pupils in Foundation Phase at the higher levels especially in PSD to be in line with the family average.NB – End of Foundation Phase Outcomes for 2014 is showing significant improvement in this area of learning. Improve pupil performance in extended writing especially boys to be in line with the family average - 2014 shows an improvement, but Writing in both Foundation Phase and KS2 will remain a main priority for Improvement in the 2014-15 School Development Plan.Improve pupil performance in Mathematics at Key Stage 2 to above the median for ‘Family Group’ Benchmarking. Implementation of the LNF to be led by the appointment of an Assistant Headteacher… NB Mrs Currenti has been appointed as Assistant Headteacher with responsibility for leading the implementation of the National Literacy and Numeracy Framework.Increase attainment of FSM pupils at expected level plus one in Key Stage 2 Utilise FFT to its full potential as part of the school’s data analysis processes
Our overall judgement on your school is as follows :Learner Outcomes - Good Capacity to improve - Good
As a result we have placed your school in the following category:
Good to outstanding
Estyn Inspection 2015
The school underwent a recent Estyn inspection in June 2015. The full report is on line or on request from the school office. The outcome was Adequate in Performance and Prospect for Improvement. The School is deemed to be in need of significant improvement .A post inspection plan has been completed and Estyn will re-inspect the school in one years time.
Safeguarding – Child Protection:
The school’s Safeguarding and child Protection Policies are reviewed regularly. The named person for reporting all matters of Child Protection is Mr. N Morgan, Headteacher. The Governor responsible for overseeing child Protection is the Chair of Governors. There has been one referral to Social Services (CCARAT) of a Child Protection nature up to September 2015. The referral did not relate to incidents on school premises or involving school staff. There are two children currently on the Child Protection Register, and four children on the ‘Child in Need’ category. All are monitored by the school.
GD 11

Full staff Child protection training was undertaken in the Summer Term.
Pastoral Support Officer, Mrs Katie Jones attends most Child Protection conferences and reviews.
DBS (CRB) checks are updated and checked regularly. Members of Staff are updated regularly on Child Protection procedures.
Safe recruitment continues to be a main priority – Pre-employment process (Evaluated under Safeguarding Evaluation) Apart from DBS checks on potential employees; the school has complied with regulations and has obtained at least two references for each candidate during recruitment.
Governors of the school do not have to be DBS checked – it will depend on whether Governors work with children.
The Governing Body has taken part in full Child Protection Training during September 2014.
A full system of CCTV, with recording facilities is in operation around the school.
Safeguarding Evaluation has been completed for academic Year 2014-15
Health, Safety and Wellbeing:
All policies are updated regularly. Safeguarding, together with strategies to support Health, Safety and Wellbeing, helps cover all aspects of health and safety. The school’s policies include Anti-bullying, Racist Abuse, Medical provision (including sun protection) and Health Care Plans, Discrimination and Equal Opportunities (A full Strategic Equality Plan is in place) First Aid, substance Misuse, Educational visits and risk assessment, School security and Internet Safety.
The school carried out a full Fire Safety inspection (with Mid and West Wales Fire and Rescue Service) in October 2015. A full Emergency Evacuation Plan (EAP) is in place, along with the NOP –
Normal Operating Procedures for dealing with Fire Safety. Full Fire safety training was carried out with staff in November 2014 and all emergency signage has been updated.
The Headteacher and Deputy Headteacher have attended the full Fire Safety training courses.
A Fire Safety Action Plan is in place. The school has successfully upgraded the detection and alarm system and the emergency lighting system.
Evacuation drills and training are carried out regularly and an evacuation log is kept.
Finger Safety guards on the doors – A programme to replace finger guards has recently been completed with all priority doors upgraded. Some doors still remain un-guarded; these will be addressed in phase two of the project.
The Fire Risk Assessment confirms that the school complies with all requirements. All policies and plans can be found on the school’s Portal Web-site – www.danygraig.swansea.sch.uk
GD 12

Premises: The school operates a current accessibility plan. Asbestos – The school is monitored for Asbestos risk. The school is currently graded as Black Grade – Very low risk. The school is monitored annually. An Asbestos Plan is in place. Staff are informed of the location of Asbestos, and of the risks. Contractors working on site are informed of the location of asbestos and of the levels of risk. The Asbestos Plan includes Risk assessments and control measures.
Health and Safety Estyn Inspection 2015 .The Lay inspector found a number of aspects concerned with premises. Most were dealt with immediately costing £10,000.Two jobs are still outstanding due to negotiations with the council. They also complained that classrooms were too small! The school is however 140 years old.
Poly Tunnel and Garden improvements – work has been completed on the school’s Poly Tunnel which has enabled the children to grow and sell fresh produce. Work has commenced in clearing the garden area adjacent to the boiler house and Ysgol Street.
Work on an outdoor area for Year 1 and 2 will commence in the Autumn term, this will provide many learning opportunities for our children.
A Business Continuity Plan has been updated for 2014-16. This plan covers procedures for continuing the service, should the premises suffer disaster. Copies, paper and electronic are with the Headteacher, Deputy Headteacher and SLMT, Caretaker, Chair of Governors and Administration Manager. Copies are available on the school’s Portal website.
School Budget and Finance: The School Budget for 2014-15 was set by the Headteacher and Primary Support Officer. It was formally accepted by the Governors’ Finance Committee The level of ‘Reserve’ forecast for the Financial Year 2014-15 is below 5% of delegated budget, at £1O,532.In order to set a budget the governing body recommended staff cuts.
The budget includes a grant for PDG (Pupil Deprivation Grant) of – £76,650 in addition, the budget includes a grant for £89,839 (EIG – Education improvement Grant) – See School Development Plan Priorities, below.
Looked After Children (LAC):
Children cared for by the local Authority, and most often in foster care. Currently there is one ‘Looked After’ child at Danygraig. The Headteacher is the Named Person with overall responsibility for LAC.The Governor with responsibility for LAC is Cllr J Hale. There are expectations for staff and Governors with responsibility for LAC to undertake regular and appropriate training. Representatives from the school attend LAC reviews or submit information on the children’s development within education.
Additional Learning Needs (ALN):
Mrs Currenti, Assistant Headteacher, is the ALN manager.
The school operates two Specialist teaching facilities (STF). In addition, we provide for the needs of several other children with Statements of Special Educational Needs. We have a programme of ‘School Action’ (School provision for additional needs) and ‘School Action Plus’ (The school is supported by outside agencies, for example, speech and language therapy, physiotherapy etc.) Danygraig works with the EMLAS GD 13
service in providing support for children with ‘English as an additional language’ (EAL) . As part of our ‘Wellbeing’ provision, the school works with the Health Authority in devising and implementing Health Care Plans.
A very important aspect of ALN is provision for More Able and Talented children. A MAT register is kept, and is constantly revised in order for us to focus on very specific talents and skills.
Funding is delegated to the school to cover staffing required for complex needs. This budget is managed by the Headteacher and ALN manager (subject to audit from LA) .During the recent Estyn Inspection ALN (additional Learning Needs) was judged as being GOOD with all children making progress.
For academic year 2015-16, the school will have 8 children in the Foundation STF (One child is of Nursery age, and will attend for a half day session each day) The numbers in the FSTF, therefore are 8.5 children FTE (Full Time Equivalent)
Danygraig also provides education for children with Statements for Educational Needs who are not placed in STF. In two cases, the severity of the children’s needs are such that they are awaiting placements in other schools (including Special Schools) However, the LA are holding long waiting lists for other such children across the authority. Danygraig will meet the challenge by setting up a designated room for children with severe needs and challenges. Staff will be paid for from the school’s delegated budget (Some from the Severe and Complex Needs allocation and some from the main delegated budget) The Room will operate as an area designated to catering for the needs of children on the autistic spectrum, physical disabilities and for children displaying particularly challenging behaviour. With adequate support and enthusiasm, the project could be seen as ‘Sector Leading Practice’
Performance Management (PM) – Continuous Professional Development (CPD) and Pay Policy:
A full Performance Management programme is ongoing. Professional Development requirements are addressed as part of PM. In addition, the school supports professional development through the School Development Plan (SDP) and through the ‘Early Professional Development’ Programme for teachers at the early stages of their professional careers.
Performance Management will include Performance Related Pay recommendations. A Pay Policy has been adopted by the Governing Body, which will include Performance Related Pay, with recommendations coming from the Performance Management process and outcomes.
Performance management and work/career appraisal programmes include ‘support-staff’. The team leaders for PM are the Senior Management Team (Headteacher,Deputy Headteacher, and Assistant Headteachers). The appraisers for the Headteacher’s Performance Management include two Governors and a representative from the Local/Regional Authority.
Staff Training – All Classroom-based support staff have undergone Training for the LNF – Literacy and Numeracy Frameworks. PDG and SEG Grants have enabled the school to support 4 Support Staff and 4 Teaching colleagues in Literacy and Numeracy Training.
Five Teachers have attended training in Welsh Language, and one Teaching Assistant has undertaken a long term (2 month) Secondment training in the Welsh language.
GD 14

Headteacher and Deputy Headteacher have undertaken Training in ‘Premises Management’ Fire Risk assessment, Supporting Colleagues’ Well-Being at Work and Managing Accidents at work.
In Addition, all staff have undergone training in Fire Safety (With Fire Safety Direct)
3 Teachers and 5 Teaching Assistants have undertaken CPI Training (Acceptable physical intervention)
Pastoral Support Officer and all staff (along with older children) have trained in Restorative Practice.
All support staff have undertaken first aid training.
Partnerships and PLC – Professional Learning Communities
Danygraig Primary works in partnership with Cefn Hengoed Community Comprehensive School, and five other Primary schools. Headteachers meet every half term to plan and prioritise development, including the implementation of LNF.
Core subject Leaders work on a process of Standardising and moderating samples of Learners’ work. The impact is that all schools in the cluster have a clear understanding of levels of attainment, and also the specific needs for improvement.
The cluster schools work together in setting common priorities, and work together in formulating bids for PDG and SEG funding. Colleagues meet in professional discussion groups to evaluate outcomes and further needs.
The Cluster Partnership enables partner schools to share expertise, facilities and good practice. The Impact - All contribute to the maintaining and raising of Standards in Core subjects, and also in areas such as sport and music.
The school also works in partnership with ‘The City Consortium’. Priorities are identified, as above, and expertise, facilities and resources are shared. The impact is ‘value for money’, with expertise, ideas and resources shared, as well as clear benchmarks for the raising of standards.
Danygraig works in partnership with Trinity St David’s University (Teacher Training) Swansea University and Gower College, in providing training for many young people (including medical and child-care training). We also provide placements for work experience to young people from Cefn Hengoed and other Comprehensive schools.
The school works closely with the Health Authority, Social Services and Emergency Services professionals. Danygraig’s Pastoral Support and Emotional Welfare Officer provides strong links between the school, the Educational Welfare Service and families in the school community. One of the positive outcomes (Impact) is that we have a significantly upward trend in attendance. By the start of the summer term, Danygraig was showing attendance of 94%, putting the school in the top quartile (Top 25% of similar schools across Wales) Another positive impact is the improvement in attainment of children in receipt of Free School Meals (FSM)
The EMLS service (LA) provides support and guidance with children and families who have English as an additional language.
GD 15

Other partnerships include professional sports clubs – Swansea City FC and The Ospreys. Apart from supplying resources to our school, we are able to access the expertise of sports coaches.
The school undertakes many visits as part of our programmes of study – these include shops, supermarkets and other places of work. The impact is that children are able to gain a much wider understanding of Literacy and Numeracy in the ‘real world’, and also insight into some of the transferable and specific skills required in the world of employment.
Equality – Strategic Equality Plan (SEP)
The school continues to promote Inclusion, Racial, religious, gender, age, employment and all other forms of equality in policy and in practice. Prejudicial and discriminatory behaviour of any form is not tolerated at Danygraig.
The SEP has been in place for two years, and has recently been reviewed. Part of the plan includes sending questionnaires to all members of the school and local community. This practice will continue during 2014/2015.
A full analysis of the replies will be published by the end of autumn term.
So far, responses are overwhelmingly in favour of what the school is doing in terms of promoting equality.
School Development Plan and Priorities
i) Literacy features as a priority – Writing at KS2 for Level 4 and above and at Foundation Phase, for Outcome 5 and above. Catch-up Programmes and support for More Able and Talented children are in place. We also use the ‘Language Link’ programme and assessments to support Learning. – The positive impact of the Language Link Programme is that nearly all the children participating improved their Reading Age significantly (measurable success)
The National Literacy Framework (LNF) has been implemented. Testing was carried out and we are developing reporting procedures. This year’s annual reports to parents/guardians will include narrative comments relating to each child’s skill progress in relation to the LNF. The reports will also include National Literacy and Numeracy Test results (Children from Year 2 to Year 6)
We are also working with the INCERTS organisation to produce an acceptable format for reporting LNF (within every subject) to parents/carers for summer 2015.
ii) Numeracy – Numerical Reasoning and iii) Mathematics MAT (More Able and Talented) will be school development priorities for academic year 2014-15. The Cefn Hengoed Cluster of schools will work together on these priorities for all our children.
GD 16

Catch-up programmes are in place (NFER and National Numeracy Framework testing are being used to determine children to be targeted for improvement) More Able and Talented learners are included in programmes.A new maths scheme Abacus has also been introduced.
Boys’ Learning will remain an area for improvement, as will the focus on the performance and attainment (particularly in Literacy and Numeracy) of children in receipt of Free School Meals By visiting the school, Governors would be able to see some of the strategies for improving Boys’ Learning in action.
Cornerstones – The school introduced a new, thematic scheme of work in September 2013. The Cornerstones Curriculum offers exciting learning experiences along with different levels of challenge, development and reinforcement in learning. Some areas of learning, particularly in Literacy and Numeracy are still taught discreetly. The Cornerstones scheme has been used as a vehicle to deliver teaching and learning; the skill programme of the Literacy and Numeracy Framework has been and will continue to be the driver of all teaching and learning. A new guided reading scheme Project X has also been introduced.
Safeguarding and Wellbeing always feature in school improvement, as does the aim to improve attendance.
The full school development/improvement plan can be accessed on the school’s Portal Website.
Attendance – Attendance is showing .a significant upward trend (as mentioned above) – the impact of having employed a Pastoral Support Officer to deal with all matters of attendance, emotional welfare, liaison with families and the community, and Restorative Practice has been measurably positive. By Easter 2014, the school was ahead of target with an average attendance of 93.8%. This puts the school in the top quartile (top 25% of similar schools across the country) Holidays taken during school time can pull the figures down, but we are confident that the upward trend can continue.
Free School Meals (FSM) – As of July 2014, 93 children are entitled to free school meals, representing 36% of the school roll. The PDG grant, of £76,650, will be used to help improve attendance, and with it the attainment and performance of children in receipt of free school meals. Strategies include continuing with a Pastoral Support Officer, Intervention Groups in Literacy and Numeracy, and the use of core-subject leaders to train other colleagues, to monitor planning and classroom practice and to scrutinize samples of children’s work.
Strategic Education Grant (SEG) - £11,000 will be used to enable Subject Leaders to be released for training, to train others and for further Intervention strategies in Writing, Reading, Numerical Reasoning and Maths MAT.
Bi-lingualism:
Danygraig fully promotes bi-lingual policy and practice. Bi-lingualism is encouraged in all aspects of school life and in all subjects, lessons/ activities and displays. It is our aim to promote the use of Welsh language in less formal situations (Playground, Breakfast Club etc.) as well as in formal settings.
GD 17

Reported Incidents of Racial Abuse – I am pleased to say that there have been no reported incidents of racial abuse or other racist incidents. Danygraig Primary School will not tolerate any incidents of prejudice and/or discrimination
Performance and Attainment assessment
Teacher assessments of learners’ standards are carried out at Year2 and Year 6. The information is fed into the All Wales Core Data Set. The school is ranked in a quartile table system along with other, similar (Free School Meal percentages) schools across Wales. It is necessary for the school to disaggregate STF learners from the data in order to present an accurate picture.
National Literacy and Numeracy Tests (Year 2 to Year 6) Reading tests, and Numeracy Procedural and Reasoning tests – Data is analysed and used for School planning – addressing strengths and needs. During autumn 2014, a full analysis will be carried out for the outcomes of tests taken during this summer term.
The school continues to use NFER tests (English/Literacy and Maths) in every class from Reception to Year 6 as a means of bench-marking individual progress – (Individual ‘value added’ progress is very important to the assessment of learning needs)
The school uses a sophisticated system of recording individual (and class) progress in all subjects. The electronic tool is called INCERTS
All data contributes to the School SER – School Evaluation Report. (An update of the SER takes place every autumn term)
Monitoring of Standards, Observations and Educational Consultancy
Monitoring of standards is carried out by The SLMT – Senior Leadership and Management Team, The Headteacher, and subject leaders. The school has also bought the services of educational consultant, Mr Mike Thomas. Mr Thomas is an Estyn Inspector; he carries out regular classroom observations, scrutinises children’s work and will observe the standard of teaching, planning and assessment. He has also given regular and constructive advice on all matters of teaching and learning. Over the last year he has worked with staff and Governors.
A full programme of Subject-Leader monitoring is in place – Each subject leader will work to a timetable of monitoring (a one-year cycle for the core subjects, and a two year cycle for other subjects)
Subject leaders will carry out classroom observations (of their subject), will scrutinize samples of children’s work, listen to learners, and monitor the plans of colleagues, displays and resources. They will take particular note of the development of Literacy and Numeracy Skills (The Literacy and Numeracy Framework) within their subjects, (For example, the skills of Literacy and Numeracy within Science, Geography, Art, etc.)
GD 18

Breakfast Club
A Local Authority partially sponsored breakfast club continues to operate. Pupil Numbers attending are currently, on average, around forty children per day. However due to a reduction in funding the school will look at financial implications.
Lettings: Danygraig Brownies – every Thursday, 6.30 pm to 8.30 pm
School’s Council – Voice of the Child. The school continues to operate a successful and vociferous school council. In addition, we have a system of prefects, together with and elected Head Girl and Head Boy and deputies. Representatives from all classes from Year 2 (including STF) are elected and sit on the School Council. They contribute to many areas of school life and development. The council, with their elected President and Secretary, members meet to discuss facilities – needs and plans, Restorative Practice, Buddy Systems, Fruit Tuck Shop and school uniform amongst many other items. The councillors have been involved in the Poly-Tunnel project and the development of our Memorial Garden. Their Voice is very much heard and contributes to the development of Danygraig Primary School.
Events:
Children continue to attend the annual remembrance service at Danygraig Cemetery and have raised over £300 for the Poppy Appeal. Last December we enjoyed very successful Christmas celebrations. The school also visited The Waterfront Church for an Easter service and St Stephens Church for Harvest Festival. Several educational trips and residential courses have been undertaken and will continue to be used to support the curriculum.
Post Inspection Action Plan
The PIAP has been completed showing the actions the school has taken to improve standards. It has been sent to Estyn. All recommendations are being addressed, Governor monitoring takes place on a fortnightly basis.
Challenge: – Governors are expected (By Estyn and the Regional Authority, ERW) to have a good knowledge of the performance and procedures of the school, and are expected to challenge the school. Governors are busy (on a collective and individual basis) in promoting good standards, and engaging with the community, local authority and other agencies in the promotion of school policy and procedures. Everyone should be challenged to perform more effectively. We need challenge, but we have to ensure that a good level of positive support accompanies the challenge.
NP Morgan,
GD 19

Headteacher,
October/Hydref 2015.
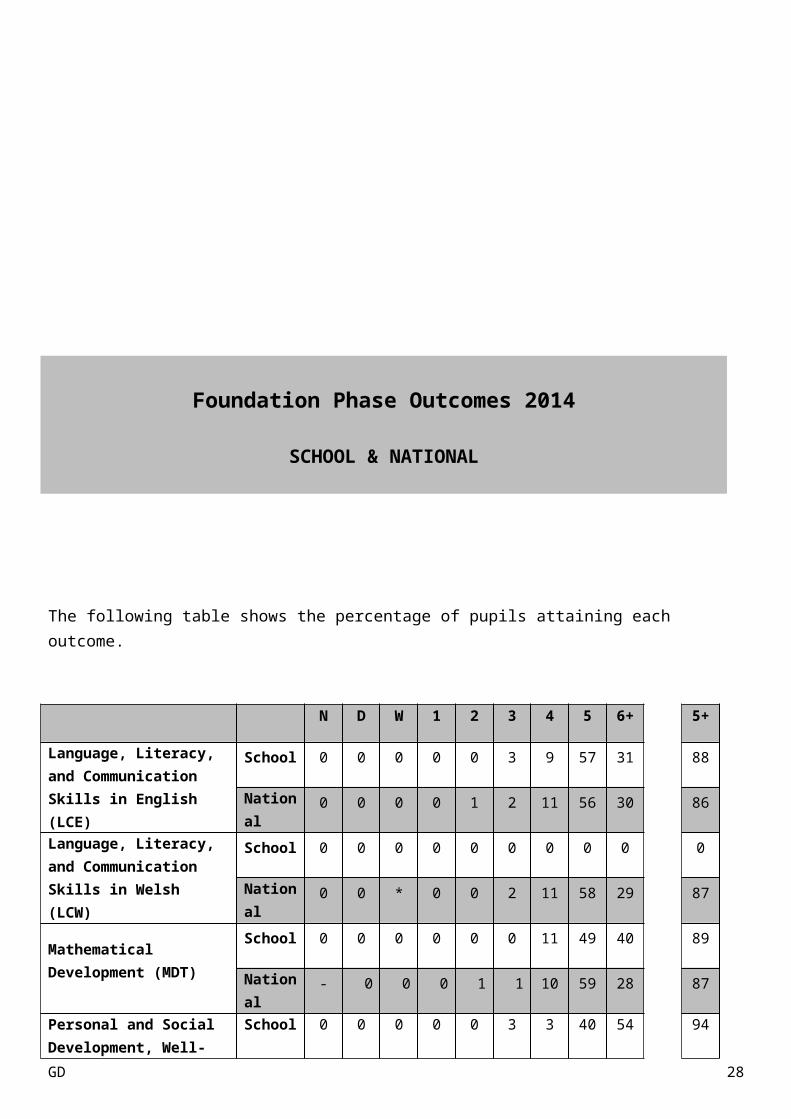
Foundation Phase Outcomes 2014SCHOOL & NATIONAL
The following table shows the percentage of pupils attaining each outcome.
N D W 1 2 3 4 5 6+ 5+
Language, Literacy, and Communication Skills in English (LCE)
School 0 0 0 0 0 3 9 57 31 88
National 0 0 0 0 1 2 11 56 30 86
Language, Literacy, and Communication Skills in
School 0 0 0 0 0 0 0 0 0 0
GD 20
Welsh (LCW) National 0 0 * 0 0 2 11 58 29 87
Mathematical Development (MDT)
School 0 0 0 0 0 0 11 49 40 89
National - 0 0 0 1 1 10 59 28 87
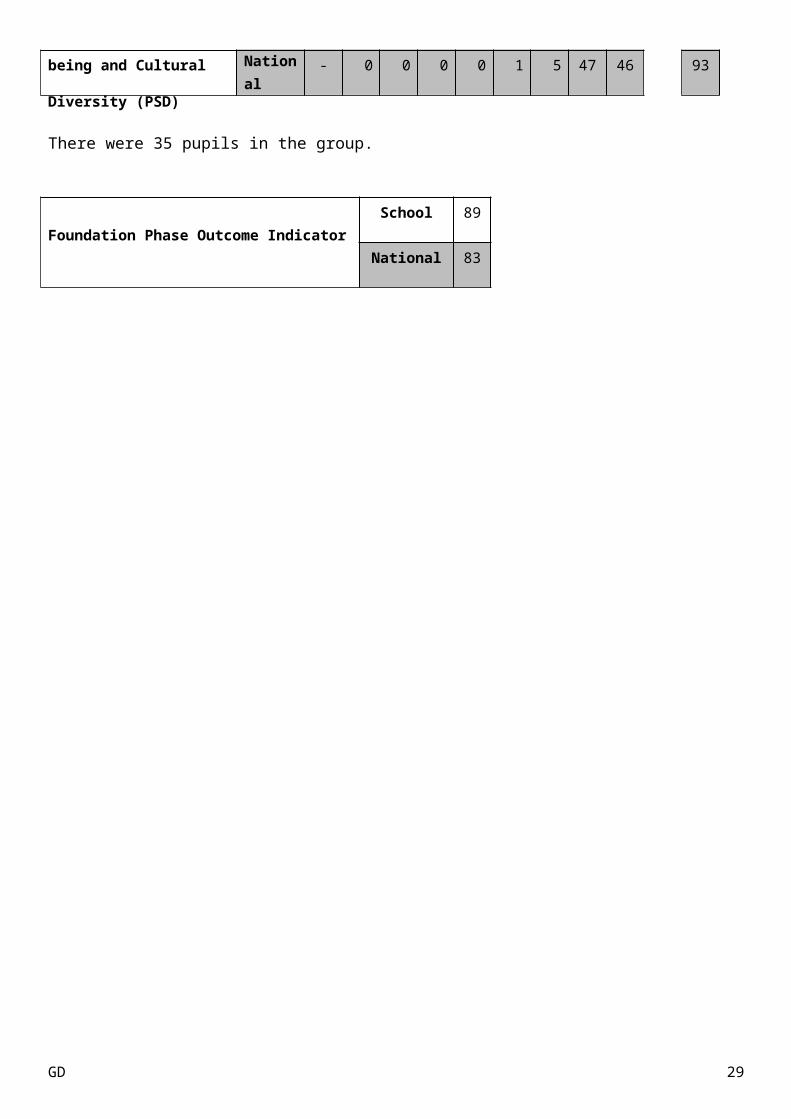
Personal and Social Development, Well-being and Cultural Diversity (PSD)
School 0 0 0 0 0 3 3 40 54 94
National - 0 0 0 0 1 5 47 46 93
There were 35 pupils in the group.
Foundation Phase Outcome IndicatorSchool 89
National 83
GD 21
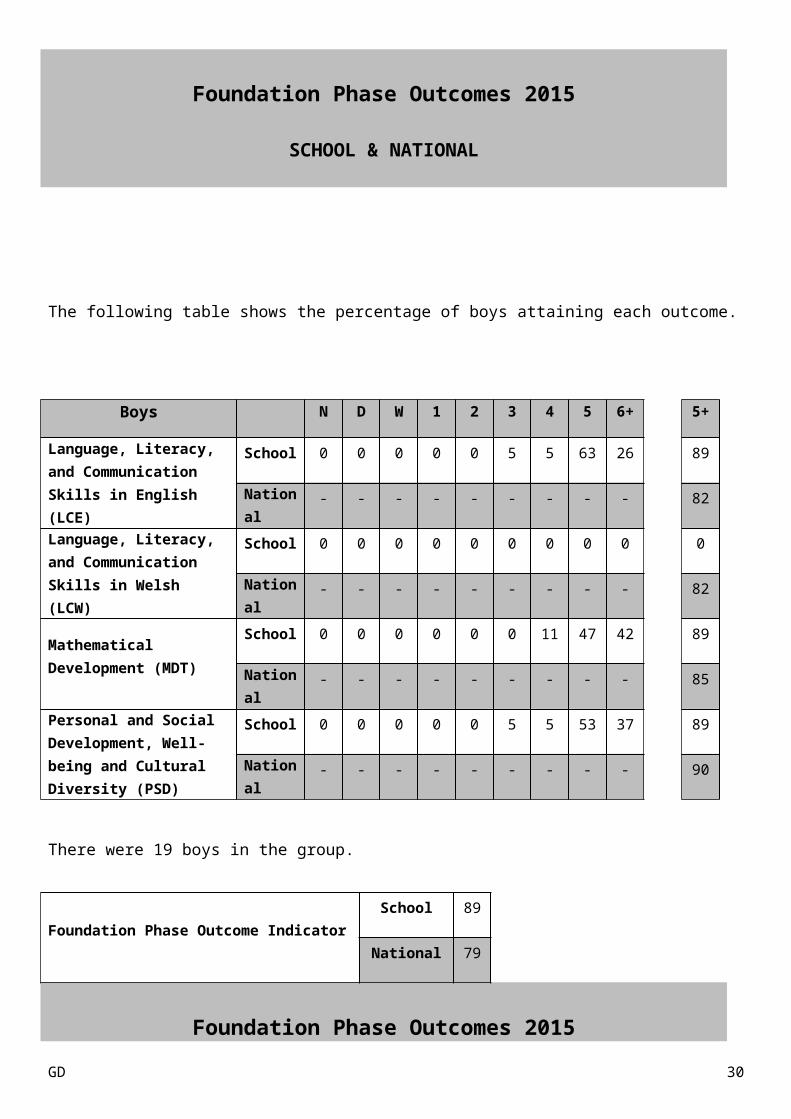
Foundation Phase Outcomes 2015SCHOOL & NATIONAL
The following table shows the percentage of boys attaining each outcome.
Boys N D W 1 2 3 4 5 6+ 5+
Language, Literacy, and Communication Skills in English (LCE)
School 0 0 0 0 0 5 5 63 26 89
National - - - - - - - - - 82
Language, Literacy, and Communication Skills in Welsh (LCW)
School 0 0 0 0 0 0 0 0 0 0
National - - - - - - - - - 82
Mathematical Development (MDT)
School 0 0 0 0 0 0 11 47 42 89
National - - - - - - - - - 85
Personal and Social Development, Well-being and Cultural Diversity (PSD)
School 0 0 0 0 0 5 5 53 37 89
National - - - - - - - - - 90
There were 19 boys in the group.
Foundation Phase Outcome IndicatorSchool 89
National 79
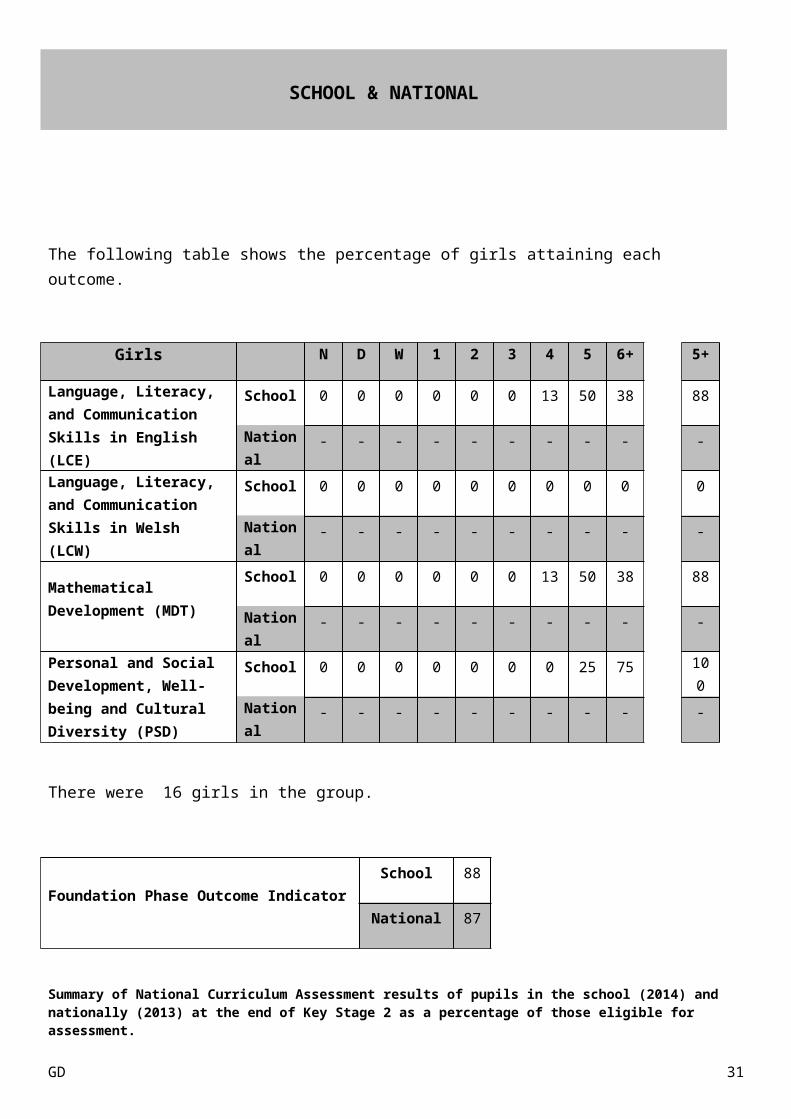
Foundation Phase Outcomes 2015SCHOOL & NATIONAL
GD 22
The following table shows the percentage of girls attaining each outcome.
Girls N D W 1 2 3 4 5 6+ 5+
Language, Literacy, and Communication Skills in English (LCE)
School 0 0 0 0 0 0 13 50 38 88
National - - - - - - - - - -
Language, Literacy, and Communication Skills in Welsh (LCW)
School 0 0 0 0 0 0 0 0 0 0
National - - - - - - - - - -
Mathematical Development (MDT)
School 0 0 0 0 0 0 13 50 38 88
National - - - - - - - - - -
Personal and Social Development, Well-being and Cultural Diversity (PSD)
School 0 0 0 0 0 0 0 25 75 100
National - - - - - - - - - -
There were 16 girls in the group.
Foundation Phase Outcome IndicatorSchool 88
National 87
Summary of National Curriculum Assessment results of pupils in the school (2014) and nationally (2013) at the end of Key Stage 2 as a percentage of those eligible for assessment.
N DNCO
1, 2, & 31 2 3 4 5 6+ 4+
English School 0 4 0 0 0 17 50 29 0 79
National 0 0 0 1 2 10 51 35 1 87
Oracy School 0 4 0 0 0 8 46 42 0 88
National 0 0 0 1 2 9 50 36 1 88
Reading School 0 4 0 0 0 17 38 42 0 79
GD 23
National 0 0 0 1 2 10 48 38 1 87
Writing School 0 4 0 0 0 33 50 13 0 63
National 0 0 0 1 3 15 53 27 1 81
Cymraeg School 0 0 0 0 0 0 0 0 0 0
National 0 0 * 0 2 11 56 30 1 87
Oracy School 0 0 0 0 0 0 0 0 0 0
National * 0 0 0 2 9 55 33 1 89
Reading School 0 0 0 0 0 0 0 0 0 0
National 0 0 * 0 2 11 53 33 1 86
Writing School 0 0 0 0 0 0 0 0 0 0
National 0 0 * 0 3 17 57 22 0 79
Mathematics School 0 4 0 0 0 13 54 29 0 83
National 0 0 0 0 2 9 52 35 1 88
ScienceSchool 0 4 0 0 0 13 54 29 0 83
National 0 0 0 0 1 8 54 36 0 90
Core Subject Indicator
School 75
National 84
GD 24
% boys at each level
N DNCO
1, 2, & 31 2 3 4 5 6+ 4+
English School 0 8 0 0 0 23 46 23 0 69
National - - - - - - - - - 84
Cymraeg School 0 0 0 0 0 0 0 0 0 0
National - - - - - - - - - 83
Mathematics School 0 8 0 0 0 23 46 23 0 69
National - - - - - - - - - 86
ScienceSchool 0 8 0 0 0 23 46 23 0 69
National - - - - - - - - - 88
Core Subject Indicator
School 61.54
National 81
% girls at each level
N DNCO
1, 2, & 31 2 3 4 5 6+ 4+
English School 0 0 0 0 0 9 55 36 0 91
National - - - - - - - - - 91
Cymraeg School 0 0 0 0 0 0 0 0 0 0
National - - - - - - - - - 91
Mathematics School 0 0 0 0 0 0 64 36 0 100
National - - - - - - - - - 89
ScienceSchool 0 0 0 0 0 0 64 36 0 100
National - - - - - - - - - 92
GD 25

Core Subject Indicator
School 90.91
National 88
Pack 1 – Autumn 2015
2014/15 performance data
GD 26

Danygraig Primary School
Publication date: 03/09/2015
GD 27
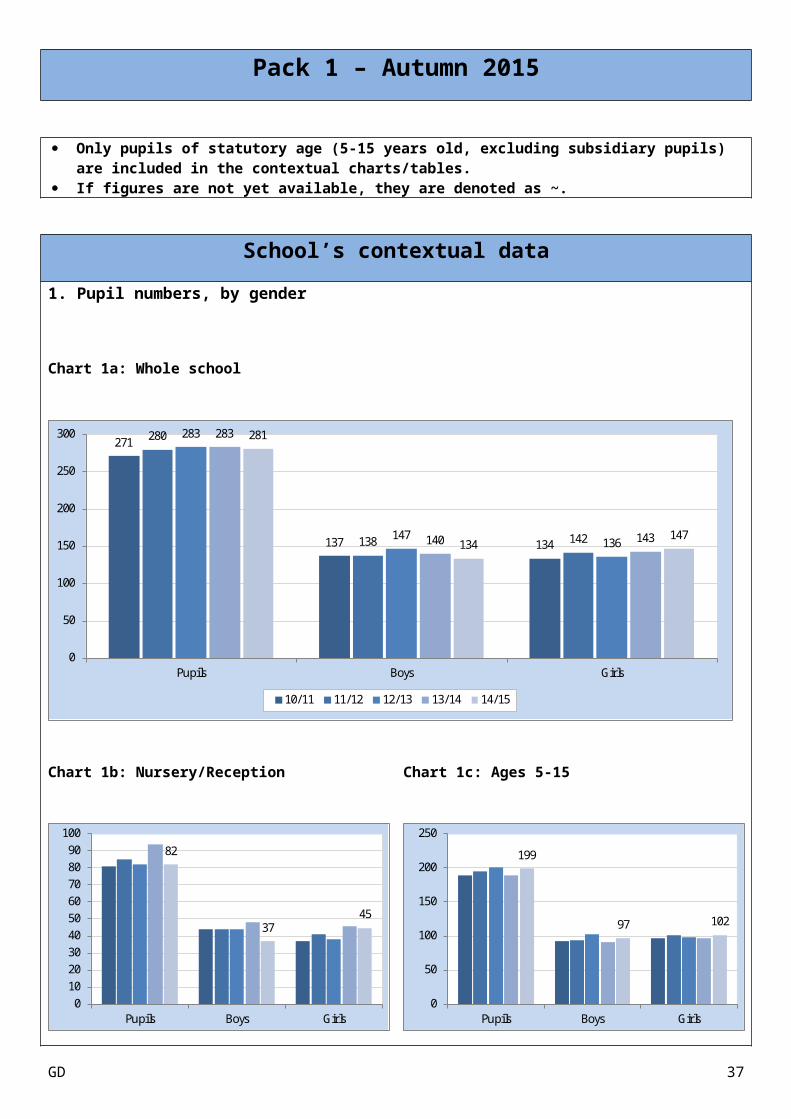
Pack 1 – Autumn 2015
Only pupils of statutory age (5-15 years old, excluding subsidiary pupils) are included in the contextual charts/tables.
If figures are not yet available, they are denoted as ~.
School’s contextual data
1. Pupil numbers, by gender
Chart 1a: Whole school
271
137 134
280
138 142
283
147136
283
140 143
281
134147
0
50
100
150
200
250
300
Pupils Boys Girls
10/11 11/12 12/13 13/14 14/15
Chart 1b: Nursery/Reception
82
3745
0102030405060708090
100
Pupils Boys Girls
Chart 1c: Ages 5-15
199
97 102
0
50
100
150
200
250
Pupils Boys Girls
1.1a – Contextual – FP/KS2
2. School’s language categoryGD 28
Wels h Medium Dual Strea m Engl i sh Medium
3. Pupils’ language context
Table 1: Percentage of pupils speaking Welsh at home: 2014/15
Speak Wels h at home
Don't s peak Welsh at home Can't s peak Wels h
Percentage 0.0 0.0 100.0
GD 29
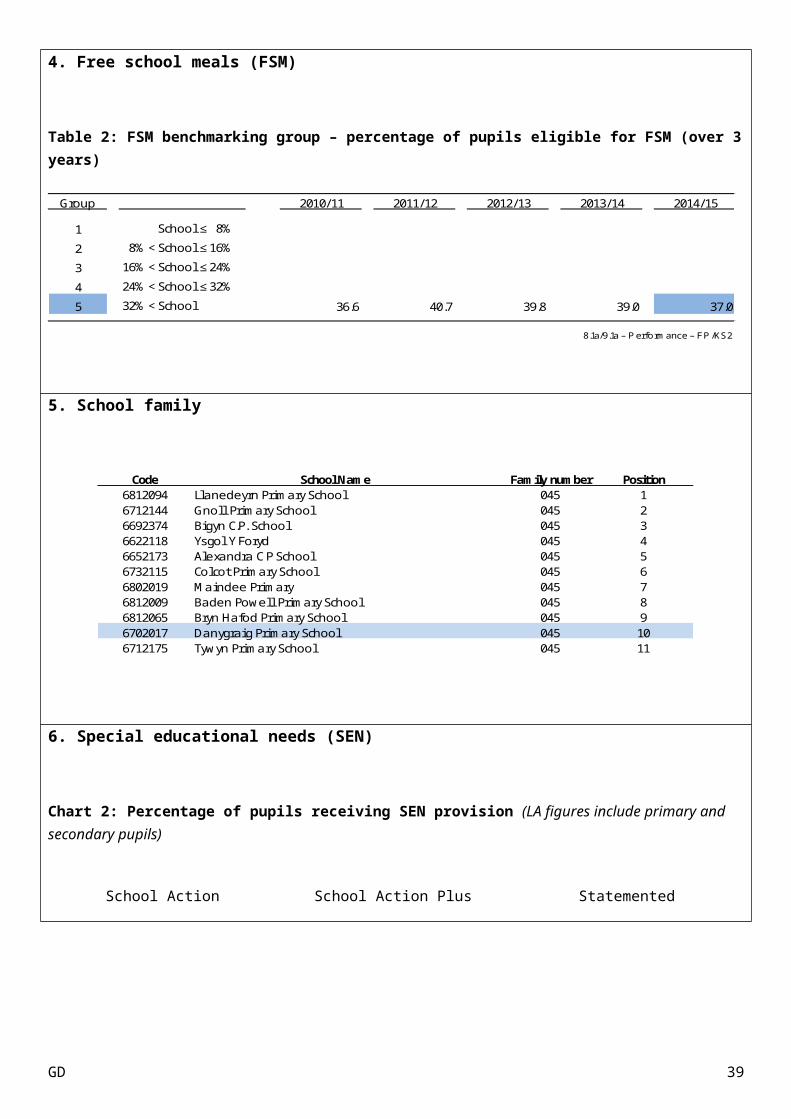
4. Free school meals (FSM)
Table 2: FSM benchmarking group – percentage of pupils eligible for FSM (over 3 years)
Group 2010/11 2011/12 2012/13 2013/14 2014/15
1 School ≤ 8%
2 8% < School ≤ 16%
3 16% < School ≤ 24%
4 24% < School ≤ 32%
5 32% < School 36.6 40.7 39.8 39.0 37.0
8.1a/9.1a – P erformance – FP /KS2
5. School family
Code School Name Family number Position6812094 Llanedeyrn Primary School 045 16712144 Gnol l Primary School 045 26692374 Bigyn C.P. School 045 36622118 Ys gol Y Foryd 045 46652173 Alexandra C P School 045 56732115 Colcot Primary School 045 66802019 Ma indee Pri mary 045 76812009 Baden Powel l Primary School 045 86812065 Bryn Hafod Primary School 045 96702017 Danygraig Primary School 045 106712175 Tywyn Pri ma ry School 045 11
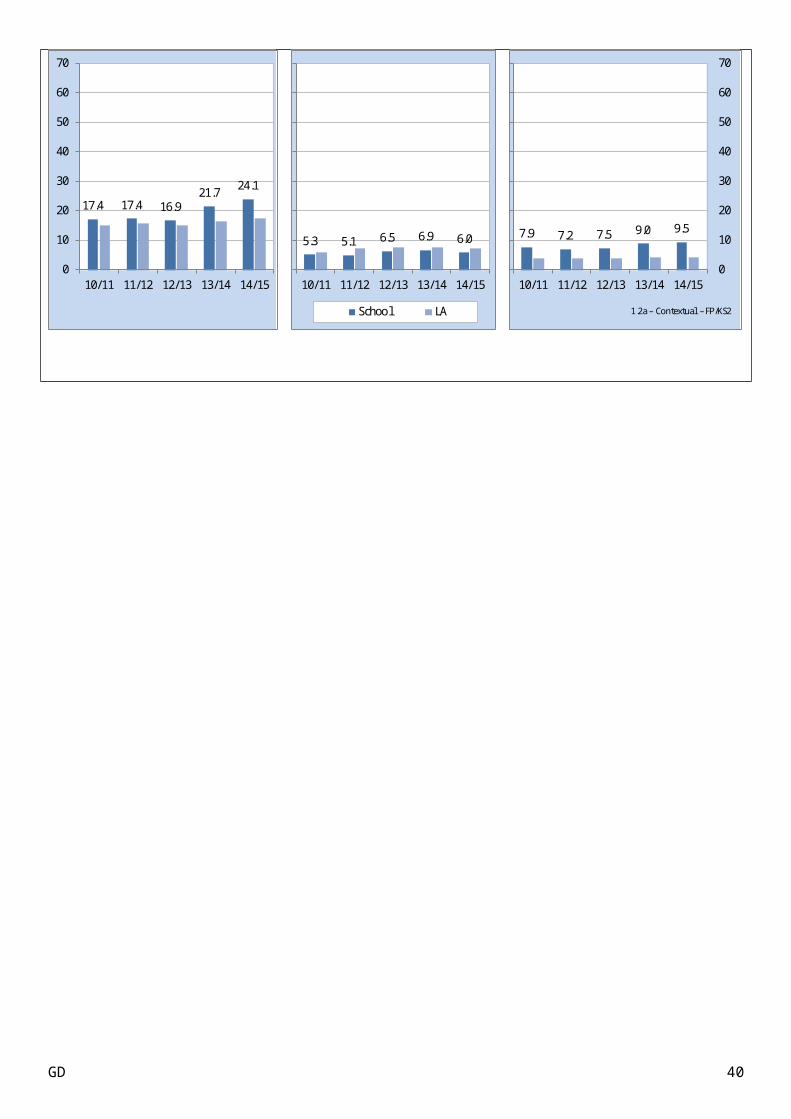
6. Special educational needs (SEN)
Chart 2: Percentage of pupils receiving SEN provision (LA figures include primary and secondary pupils)
School Action School Action Plus Statemented
GD 30
17.4 17.4 16.921.7 24.1
0
10
20
30
40
50
60
70
10/11 11/12 12/13 13/14 14/15
5.3 5.1 6.5 6.9 6.0
10/11 11/12 12/13 13/14 14/15
School LA
7.9 7.2 7.5 9.0 9.5
0
10
20
30
40
50
60
70
10/11 11/12 12/13 13/14 14/15
1.2a – Contextual – FP/KS2
GD 31

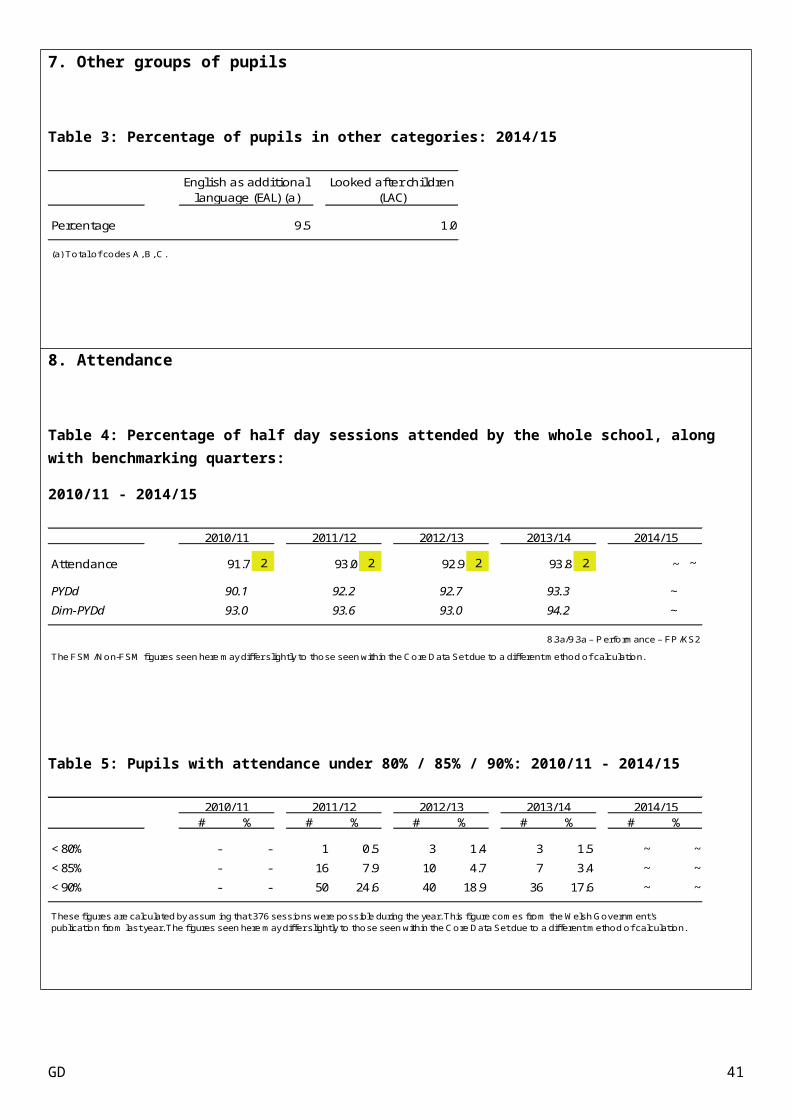
7. Other groups of pupils
Table 3: Percentage of pupils in other categories: 2014/15
Engl is h as addi tional langua ge (EAL) (a)
Looked after chi ldren (LAC)
Percentage 9.5 1.0
(a) Total of codes A, B, C.
8. Attendance
Table 4: Percentage of half day sessions attended by the whole school, along with benchmarking quarters:
2010/11 - 2014/15
Attendance 91.7 2 93.0 2 92.9 2 93.8 2 ~ ~
PYDd 90.1 92.2 92.7 93.3 ~
Dim-PYDd 93.0 93.6 93.0 94.2 ~
8.3a/9.3a – P erformance – FP /KS2The FSM/Non-FSM figures seen here may differ slightly to those seen within the Core Data Set due to a different method of calculation.
2010/11 2011/12 2012/13 2013/14 2014/15
Table 5: Pupils with attendance under 80% / 85% / 90%: 2010/11 - 2014/15
# % # % # % # % # %
< 80% - - 1 0.5 3 1.4 3 1.5 ~ ~
< 85% - - 16 7.9 10 4.7 7 3.4 ~ ~
< 90% - - 50 24.6 40 18.9 36 17.6 ~ ~
These figures are calculated by assuming that 376 sessions were possible during the year. This figure comes from the Welsh Government's publication from last year. The figures seen here may differ slightly to those seen within the Core Data Set due to a different method of calculation.
2010/11 2011/12 2012/13 2013/14 2014/15
GD 32

How well does the school perform at Foundation Phase?
1. Latest school, family and authority performance
Number of pupils in year 2 at the school
10/11 11/12 12/13 13/14 14/15
Boys - 10 19 19 14Gi rls - 21 17 16 15
Pupi ls - 31 36 35 29
1.3a – Contextual – FP
Chart 3: Percentage of pupils achieving the expected outcome (Outcome 5+), by gender: 2014/15
Boys
#N/A
71.4 71.4
85.7
71.4
0
10
20
30
40
50
60
70
80
90
100
LCW LCE MDT PSD FPI
Girls
#N/A
93.3 93.3 100.0 93.3
LCW LCE MDT PSD FPI
School Family LA
Pupils
#N/A
82.8 82.8
93.1
82.8
0
10
20
30
40
50
60
70
80
90
100
LCW LCE MDT PSD FPI
The Foundation Phase’s mandatory areas of learning (reporting-wise) are:
Language, literacy and communication skills in Welsh (LCW) OR Language, literacy and communication skills in English (LCE)
Mathematical development (MDT) Personal and social development, well-being and cultural diversity (PSD)
The Foundation Phase Indicator (FPI) is achieved by a pupil if Outcome 5 or greater is achieved in LCW/LCE, MDT and PSD in combination.
GD 33

2. School performance over time
Chart 4: Percentage of pupils achieving the expected outcome (Outcome 5+), by area of learning: 2011/12 - 2014/15
LCW
0
10
20
30
40
50
60
70
80
90
100
LCE MDT PSD FPI
0
10
20
30
40
50
60
70
80
90
100
3. Subjects in combination
Foundation Phase Outcome (FPI)
Chart 5: Percentage of pupils achieving the FPI: 2011/12 - 2014/15
0
10
20
30
40
50
60
70
80
90
100
10/11 11/12 12/13 13/14 14/15
LA Family School 1.1a – Performance – FP
GD 34

GD 35

4. Individual areas of learning
Language, literacy and communication skills in Welsh (LCW)
Chart 6: Percentage of pupils achieving the expected outcome (Outcome 5+) in LCW: 2011/12 - 2014/15
0
10
20
30
40
50
60
70
80
90
100
10/11 11/12 12/13 13/14 14/15
LA Family School 3.1a – Performance – FP
Chart 7: Percentage of pupils achieving the expected outcome (Outcome 6+) in LCW: 2011/12 - 2014/15
0
10
20
30
40
50
60
70
80
90
100
10/11 11/12 12/13 13/14 14/15
LA Family School 3.2a – Performance – FP
GD 36
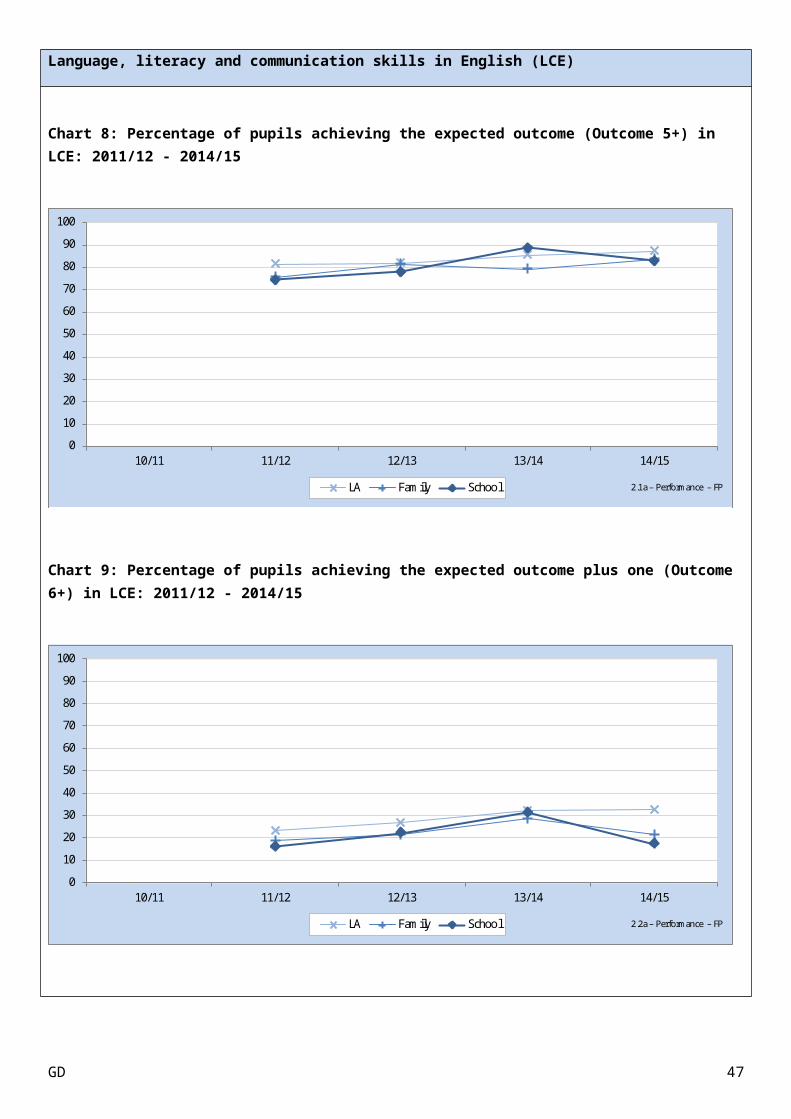
Language, literacy and communication skills in English (LCE)
Chart 8: Percentage of pupils achieving the expected outcome (Outcome 5+) in LCE: 2011/12 - 2014/15
0
10
20
30
40
50
60
70
80
90
100
10/11 11/12 12/13 13/14 14/15
LA Family School 2.1a – Performance – FP
Chart 9: Percentage of pupils achieving the expected outcome plus one (Outcome 6+) in LCE: 2011/12 - 2014/15
0
10
20
30
40
50
60
70
80
90
100
10/11 11/12 12/13 13/14 14/15
LA Family School 2.2a – Performance – FP
GD 37

Mathematical development (MDT)
Chart 10: Percentage of pupils achieving the expected outcome (Outcome 5+) in MDT: 2011/12 - 2014/15
0
10
20
30
40
50
60
70
80
90
100
10/11 11/12 12/13 13/14 14/15
LA Family School 4.1a – Performance – FP
Chart 11: Percentage of pupils achieving the expected outcome plus one (Outcome 6+) in MDT: 2011/12 - 2014/15
0
10
20
30
40
50
60
70
80
90
100
10/11 11/12 12/13 13/14 14/15
LA Family School 4.2a – Performance – FP
GD 38
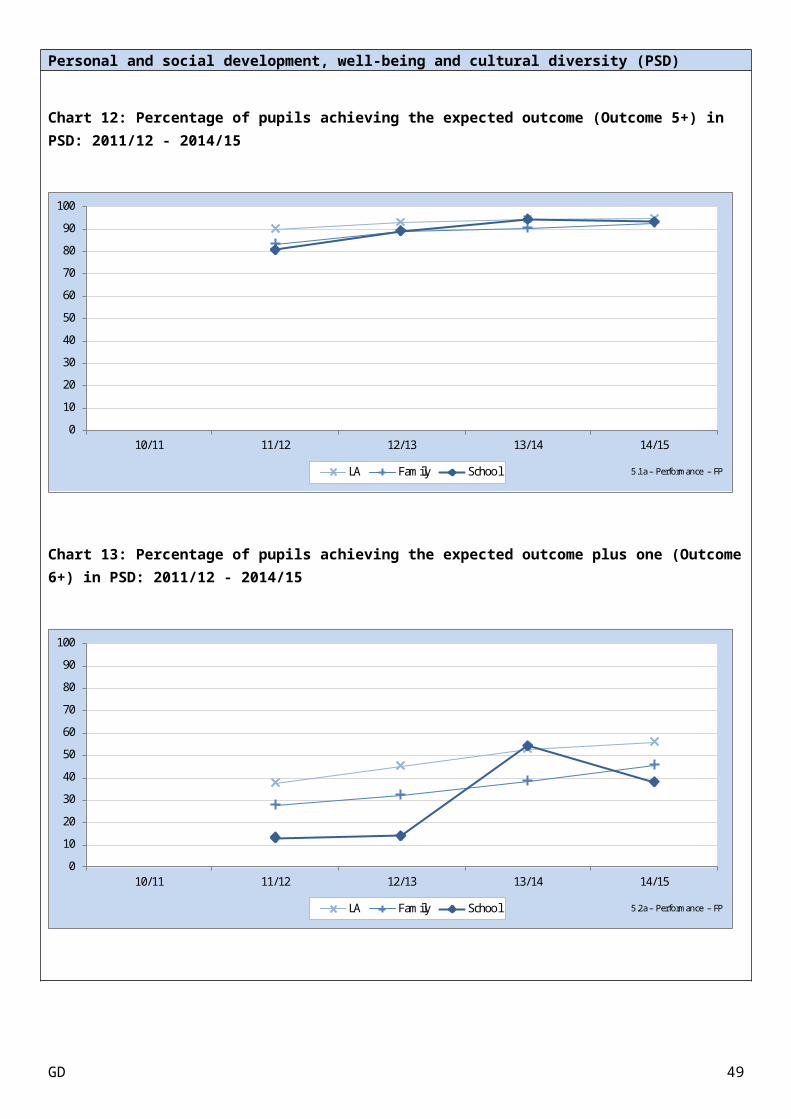
Personal and social development, well-being and cultural diversity (PSD)
Chart 12: Percentage of pupils achieving the expected outcome (Outcome 5+) in PSD: 2011/12 - 2014/15
0
10
20
30
40
50
60
70
80
90
100
10/11 11/12 12/13 13/14 14/15
LA Family School 5.1a – Performance – FP
Chart 13: Percentage of pupils achieving the expected outcome plus one (Outcome 6+) in PSD: 2011/12 - 2014/15
0
10
20
30
40
50
60
70
80
90
100
10/11 11/12 12/13 13/14 14/15
LA Family School 5.2a – Performance – FP
GD 39
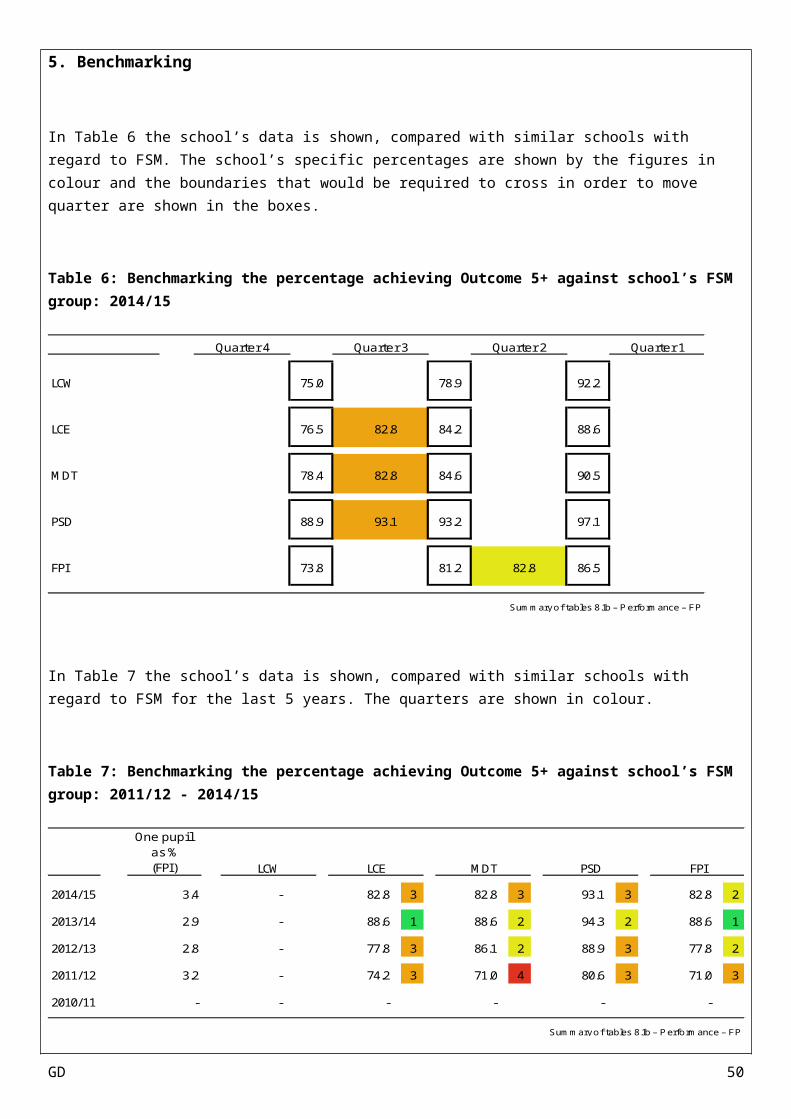
5. Benchmarking
In Table 6 the school’s data is shown, compared with similar schools with regard to FSM. The school’s specific percentages are shown by the figures in colour and the boundaries that would be required to cross in order to move quarter are shown in the boxes.
Table 6: Benchmarking the percentage achieving Outcome 5+ against school’s FSM group: 2014/15
Quarter 4 Quarter 3 Quarter 2 Quarter 1
LCW 75.0 78.9 92.2
LCE 76.5 82.8 84.2 88.6
MDT 78.4 82.8 84.6 90.5
PSD 88.9 93.1 93.2 97.1
FPI 73.8 81.2 82.8 86.5
Summary of tables 8.1b – P erformance – FP
In Table 7 the school’s data is shown, compared with similar schools with regard to FSM for the last 5 years. The quarters are shown in colour.
Table 7: Benchmarking the percentage achieving Outcome 5+ against school’s FSM group: 2011/12 - 2014/15
One pupi l as %(FPI)
2014/15 3.4 - 82.8 3 82.8 3 93.1 3 82.8 2
2013/14 2.9 - 88.6 1 88.6 2 94.3 2 88.6 1
2012/13 2.8 - 77.8 3 86.1 2 88.9 3 77.8 2
2011/12 3.2 - 74.2 3 71.0 4 80.6 3 71.0 3
2010/11 - - - - - -
Summary of tables 8.1b – P erformance – FP
LCW LCE MDT PSD FPI
GD 40
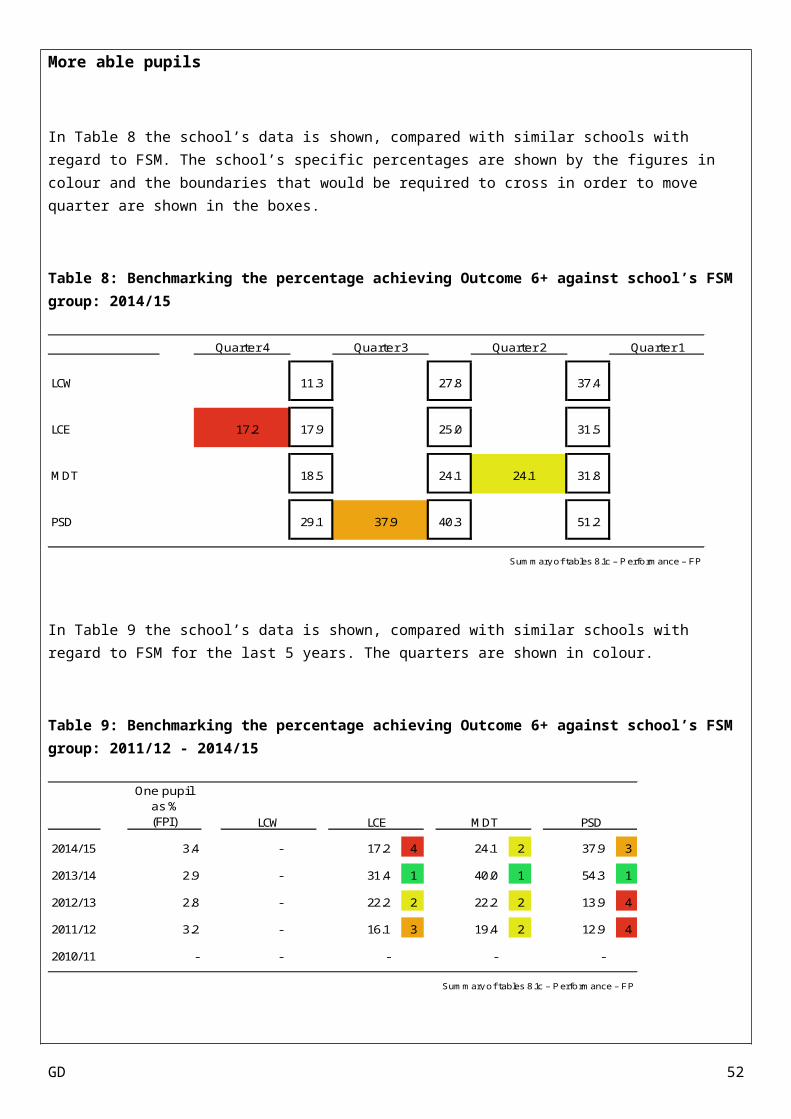
More able pupils
In Table 8 the school’s data is shown, compared with similar schools with regard to FSM. The school’s specific percentages are shown by the figures in colour and the boundaries that would be required to cross in order to move quarter are shown in the boxes.
Table 8: Benchmarking the percentage achieving Outcome 6+ against school’s FSM group: 2014/15
Quarter 4 Quarter 3 Quarter 2 Quarter 1
LCW 11.3 27.8 37.4
LCE 17.2 17.9 25.0 31.5
MDT 18.5 24.1 24.1 31.8
PSD 29.1 37.9 40.3 51.2
Summary of tables 8.1c – P erformance – FP
In Table 9 the school’s data is shown, compared with similar schools with regard to FSM for the last 5 years. The quarters are shown in colour.
Table 9: Benchmarking the percentage achieving Outcome 6+ against school’s FSM group: 2011/12 - 2014/15
One pupi l as %(FPI)
2014/15 3.4 - 17.2 4 24.1 2 37.9 3
2013/14 2.9 - 31.4 1 40.0 1 54.3 1
2012/13 2.8 - 22.2 2 22.2 2 13.9 4
2011/12 3.2 - 16.1 3 19.4 2 12.9 4
2010/11 - - - - -
Summary of tables 8.1c – P erformance – FP
LCW LCE MDT PSD
GD 41

6. Boys vs Girls
Chart 14: Percentage point difference between boys’ and girls’ Outcome 5+ achievement (boys - girls), by area of learning: 2011/12 - 2014/15
#N/A
-21.9 -21.9-14.3
-21.9
-100
-80
-60
-40
-20
0
20
40
60
80
100
LCW LCE MDT PSD FPI
10/11 11/12 12/13 13/14 14/15 6.2b – Performance – FP
Chart 15: Percentage point difference between boys’ and girls’ Outcome 6+ achievement (boys - girls), by area of learning: 2011/12 - 2014/15
#N/A
-5.7-19.0
-4.3
-100
-80
-60
-40
-20
0
20
40
60
80
100
LCW LCE MDT PSD
10/11 11/12 12/13 13/14 14/15 6.2a – Performance – FP
GD 42

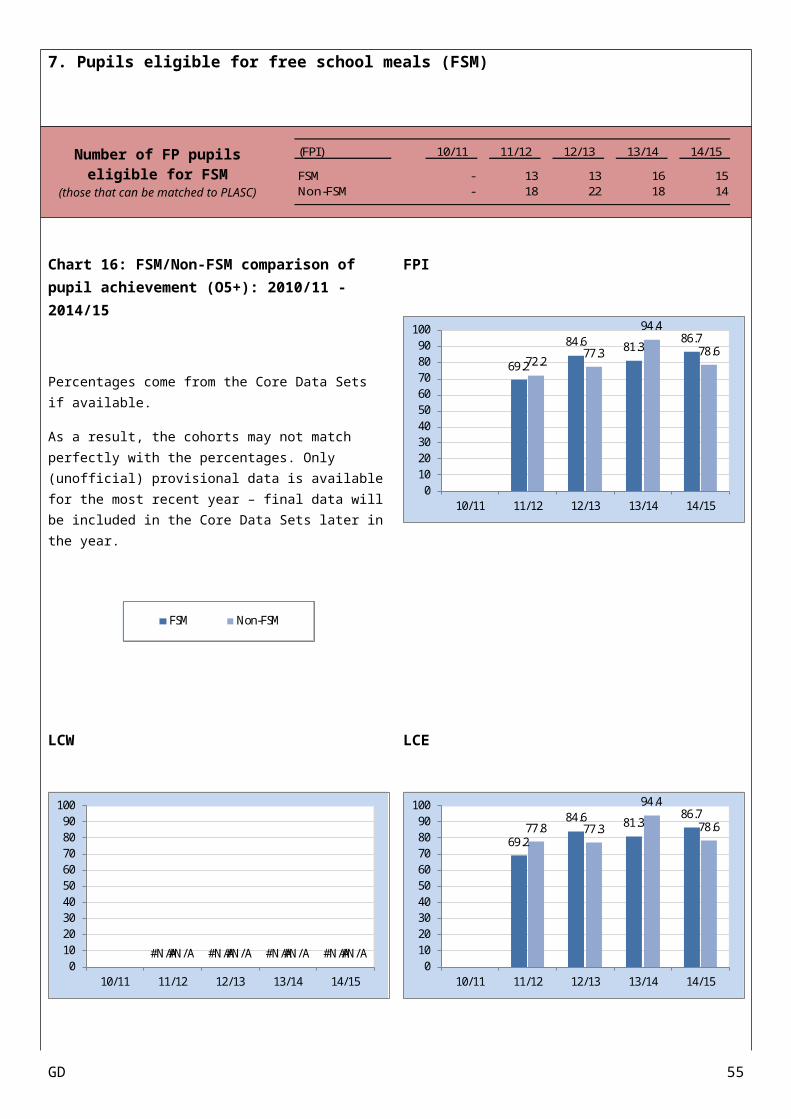
7. Pupils eligible for free school meals (FSM)
Number of FP pupils eligible for FSM
(those that can be matched to PLASC)
(FPI) 10/11 11/12 12/13 13/14 14/15
FSM - 13 13 16 15Non-FSM - 18 22 18 14
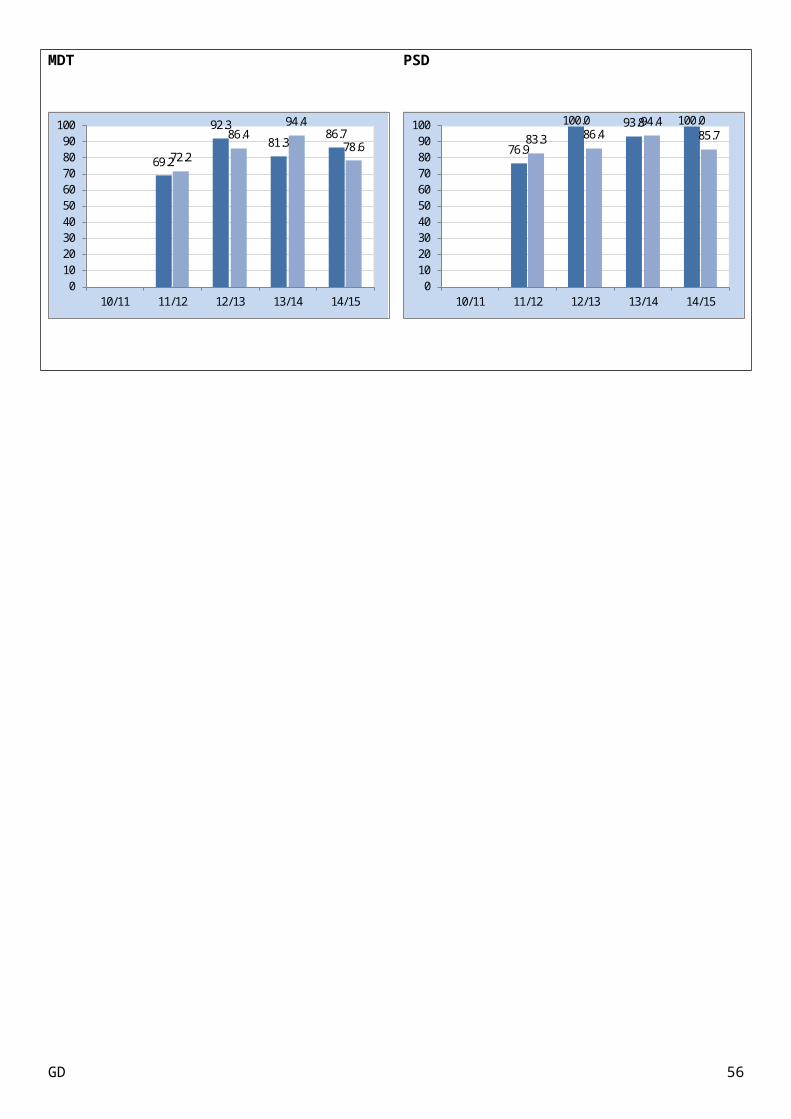
Chart 16: FSM/Non-FSM comparison of pupil achievement (O5+): 2010/11 - 2014/15
Percentages come from the Core Data Sets if available.
As a result, the cohorts may not match perfectly with the percentages. Only (unofficial) provisional data is available for the most recent year – final data will be included in the Core Data Sets later in the year.
69.2 84.6 81.3 86.772.2 77.3 94.4 78.60102030405060708090100 FSM Non-FSM
FPI
69.2
84.6 81.386.7
72.277.3
94.4
78.6
0102030405060708090
100
10/11 11/12 12/13 13/14 14/15
LCW
#N/A #N/A #N/A #N/A#N/A #N/A #N/A #N/A0
102030405060708090
100
10/11 11/12 12/13 13/14 14/15
LCE
69.2
84.6 81.386.7
77.8 77.3
94.4
78.6
0102030405060708090
100
10/11 11/12 12/13 13/14 14/15
MDT PSD
GD 43

69.2
92.381.3
86.7
72.2
86.494.4
78.6
0102030405060708090
100
10/11 11/12 12/13 13/14 14/15
76.9
100.0 93.8 100.083.3 86.4
94.485.7
0102030405060708090
100
10/11 11/12 12/13 13/14 14/15
GD 44

How well does the school perform at KS2?
1. Latest school, family and authority performance
Number of pupils in year 6 at the school
10/11 11/12 12/13 13/14 14/15
Boys 17 21 20 12 15Gi rls 11 20 18 11 15
Pupi ls 28 41 38 23 30
1.3a – Contextual – KS2
Chart 17: Percentage of pupils achieving the expected level (Level 4+), by gender: 2014/15
Boys
#N/A
80.086.7 86.7
80.0
0
10
20
30
40
50
60
70
80
90
100
CYM ENG MAT SCI CSI
Girls
#N/A
86.7 86.793.3
86.7
CYM ENG MAT SCI CSI
School Family ALl
Pupils
#N/A
83.3 86.7 90.083.3
0
10
20
30
40
50
60
70
80
90
100
CYM ENG MAT SCI CSI
2. School performance over time
Chart 18: Percentage of pupils achieving the expected level (Level 4+), by subject: 2010/11 - 2014/15
Welsh English Mathematics Science
Core Subject Indicator (CSI)
0
10
20
30
40
50
60
70
80
90
100
GD 45

0
10
20
30
40
50
60
70
80
90
100
GD 46
3. Subjects in combination
Core Subject Indicator (CSI)
Chart 19: Percentage of pupils achieving the CSI: 2010/11 - 2014/15
0
10
20
30
40
50
60
70
80
90
100
10/11 11/12 12/13 13/14 14/15
LA Family School 1.1a – Performance – KS2
Reading, Writing and Mathematics
Chart 20: Percentage of pupils achieving the expected level (Level 4+) in Reading, Writing and Mathematics in combination: 2010/11 - 2014/15
85.7 82.9
68.4 65.270.0
0
10
20
30
40
50
60
70
80
90
100
10/11 11/12 12/13 13/14 14/15
LA Family School 7.1a – Performance – KS2
GD 47

GD 48
4. Individual core subjects
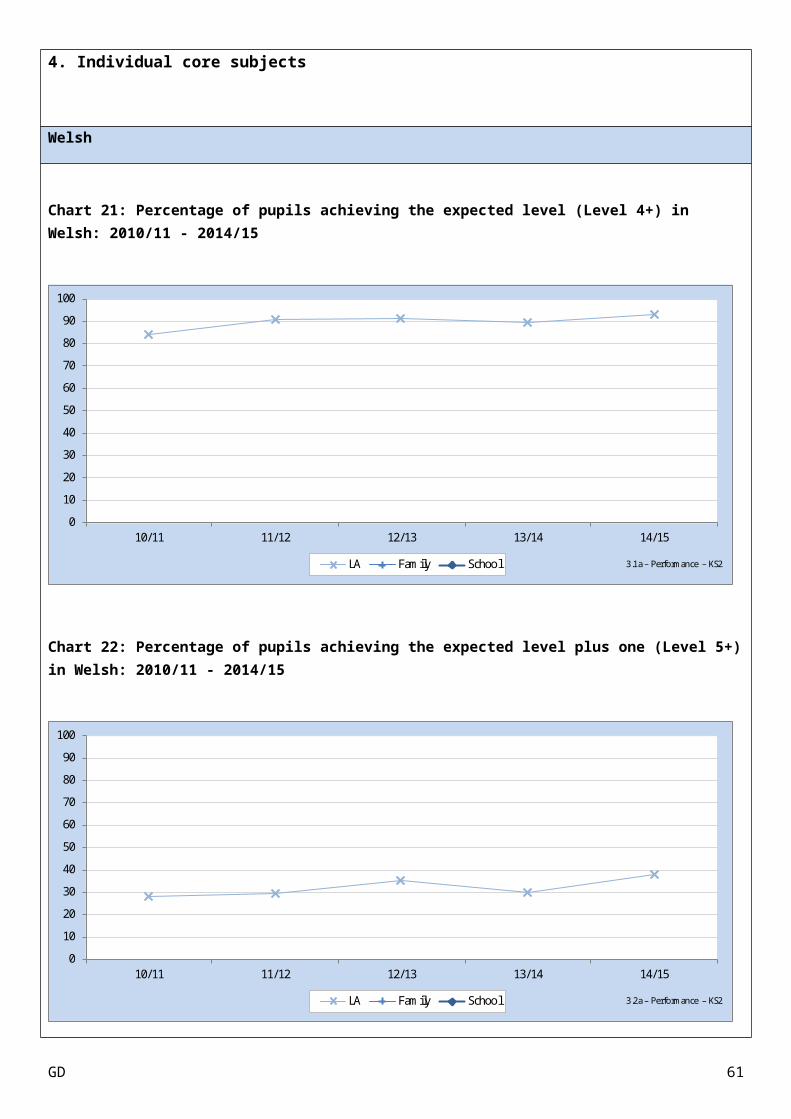
Welsh
Chart 21: Percentage of pupils achieving the expected level (Level 4+) in Welsh: 2010/11 - 2014/15
0
10
20
30
40
50
60
70
80
90
100
10/11 11/12 12/13 13/14 14/15
LA Family School 3.1a – Performance – KS2
Chart 22: Percentage of pupils achieving the expected level plus one (Level 5+) in Welsh: 2010/11 - 2014/15
0
10
20
30
40
50
60
70
80
90
100
10/11 11/12 12/13 13/14 14/15
LA Family School 3.2a – Performance – KS2
GD 49
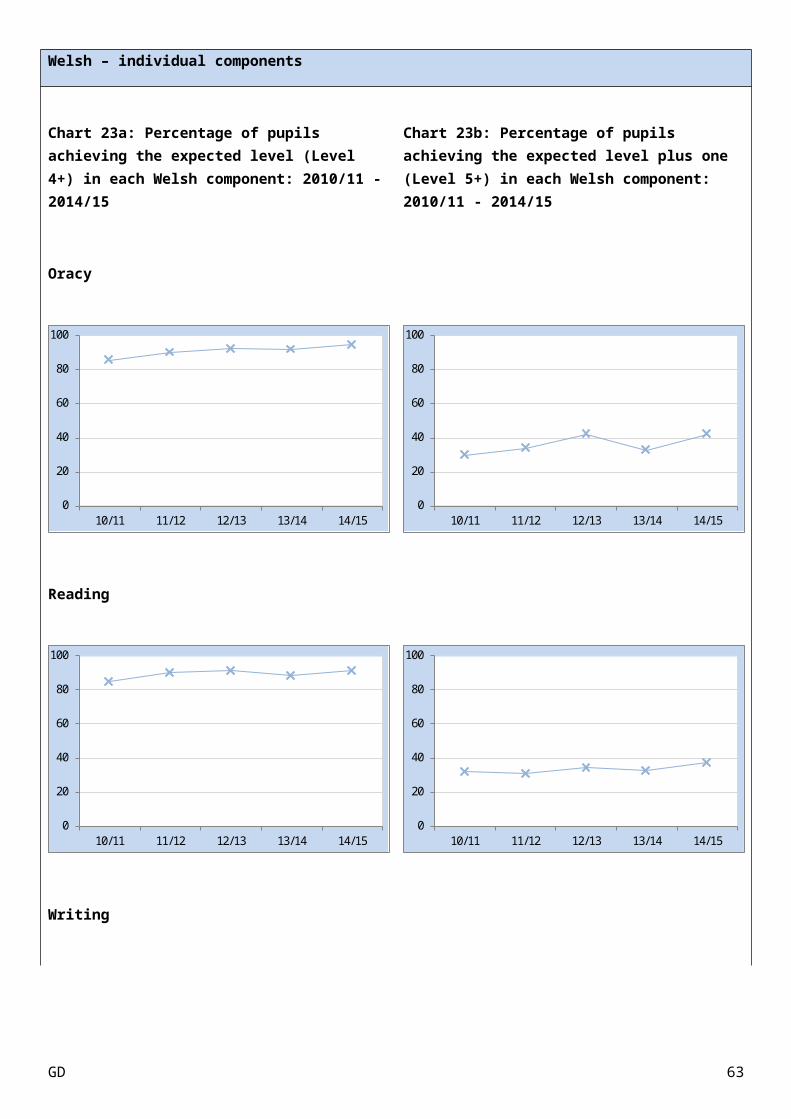
Welsh – individual components
Chart 23a: Percentage of pupils achieving the expected level (Level 4+) in each Welsh component: 2010/11 - 2014/15
Chart 23b: Percentage of pupils achieving the expected level plus one (Level 5+) in each Welsh component: 2010/11 - 2014/15
Oracy
0
20
40
60
80
100
10/11 11/12 12/13 13/14 14/150
20
40
60
80
100
10/11 11/12 12/13 13/14 14/15
Reading
0
20
40
60
80
100
10/11 11/12 12/13 13/14 14/150
20
40
60
80
100
10/11 11/12 12/13 13/14 14/15
Writing
GD 50

0
20
40
60
80
100
10/11 11/12 12/13 13/14 14/150
20
40
60
80
100
10/11 11/12 12/13 13/14 14/15
10/11 11/12 12/13 13/14 14/150
4080
80.0
73.3
64.3
77.8 60
.0LA School
GD 51
English
Chart 24: Percentage of pupils achieving the expected level (Level 4+) in English: 2010/11 - 2014/15
0
10
20
30
40
50
60
70
80
90
100
10/11 11/12 12/13 13/14 14/15
LA Family School 2.1a – Performance – KS2
Chart 25: Percentage of pupils achieving the expected level plus one (Level 5+) in English: 2010/11 - 2014/15
0
10
20
30
40
50
60
70
80
90
100
10/11 11/12 12/13 13/14 14/15
LA Family School 2.2a – Performance – KS2
GD 52

English – individual elements
Chart 26a: Percentage of pupils achieving the expected level (Level 4+) in each English component: 2010/11 - 2014/15
Chart 26b: Percentage of pupils achieving the expected level plus one (Level 5+) in each English component: 2010/11 - 2014/15
Oracy
75.0
90.2 86.8 91.3 90.0
0
20
40
60
80
100
10/11 11/12 12/13 13/14 14/15
25.031.7
23.7
43.5
23.3
0
20
40
60
80
100
10/11 11/12 12/13 13/14 14/15
Reading
85.792.7
81.6 82.6 83.3
0
20
40
60
80
100
10/11 11/12 12/13 13/14 14/15
71.4
58.5
44.7 43.5
20.0
0
20
40
60
80
100
10/11 11/12 12/13 13/14 14/15
Writing
GD 53

85.7 85.4
68.4 65.270.0
0
20
40
60
80
100
10/11 11/12 12/13 13/14 14/15
39.3
19.5 18.413.0 16.7
0
20
40
60
80
100
10/11 11/12 12/13 13/14 14/15
10/11 11/12 12/13 13/14 14/150
4080
80.0
73.3
64.3
77.8 60
.0LA School
GD 54
Mathematics
Chart 27: Percentage of pupils achieving the expected level (Level 4+) in Mathematics: 2010/11 - 2014/15
0
10
20
30
40
50
60
70
80
90
100
10/11 11/12 12/13 13/14 14/15
LA Family School 4.1a – Performance – KS2
Chart 28: Percentage of pupils achieving the expected level plus one (Level 5+) in Mathematics: 2010/11 - 2014/15
0
10
20
30
40
50
60
70
80
90
100
10/11 11/12 12/13 13/14 14/15
LA Family School 4.2a – Performance – KS2
GD 55
Science
Chart 29: Percentage of pupils achieving the expected level (Level 4+) in Science: 2010/11 - 2014/15
0
10
20
30
40
50
60
70
80
90
100
10/11 11/12 12/13 13/14 14/15
LA Family School 5.1a – Performance – KS2
Chart 30: Percentage of pupils achieving the expected level plus one (Level 5+) in Science: 2010/11 - 2014/15
0
10
20
30
40
50
60
70
80
90
100
10/11 11/12 12/13 13/14 14/15
LA Family School 5.2a – Performance – KS2
GD 56

5. Benchmarking
In Table 12 the school’s data is shown, compared with similar schools with regard to FSM. The school’s specific percentages are shown by the figures in colour and the boundaries that would be required to cross in order to move quarter are shown in the boxes.
Table 12: Benchmarking the percentage achieving Level 4+ against school’s FSM group: 2014/15
Quarter 4 Quarter 3 Quarter 2 Quarter 1
Wels h 52.0 77.5 90.4
Engl i sh 77.3 83.3 84.6 89.5
Ma themati cs 77.8 86.1 86.7 90.9
Science 80.0 87.0 90.0 92.3
CSI 74.4 82.4 83.3 87.5
Summary of tables 9.1b – P erformance – KS2
In Table 13 the school’s data is shown, compared with similar schools with regard to FSM for the last 5 years. The quarters are shown in colour.
Table 13: Benchmarking the percentage achieving Level 4+ against school’s FSM group: 2010/11 - 2014/15
One pupi l as %(CSI)
2014/15 3.3 - 83.3 3 86.7 2 90.0 2 83.3 2
2013/14 4.3 - 82.6 3 82.6 3 82.6 3 78.3 3
2012/13 2.6 - 78.9 3 76.3 3 86.8 2 73.7 3
2011/12 2.4 - 87.8 1 85.4 2 82.9 2 80.5 2
2010/11 3.6 - 85.7 1 89.3 1 89.3 1 85.7 1
Summary of tables 9.1b – P erformance – KS2
Wels h Engl i sh Mathematics Science CSI
GD 57
More able pupils
In Table 14 the school’s data is shown, compared with similar schools with regard to FSM. The school’s specific percentages are shown by the figures in colour and the boundaries that would be required to cross in order to move quarter are shown in the boxes.
Table 14: Benchmarking the percentage achieving Level 5+ against school’s FSM group: 2014/15
Quarter 4 Quarter 3 Quarter 2 Quarter 1
Wels h 0.0 0.0 26.4
Engl i sh 20.0 22.2 30.5 37.5
Ma themati cs 20.0 20.8 31.3 39.5
Science 20.0 20.7 30.4 38.9
Summary of tables 9.1c – P erformance – KS2
In Table 15 the school’s data is shown, compared with similar schools with regard to FSM for the last 5 years. The quarters are shown in colour.
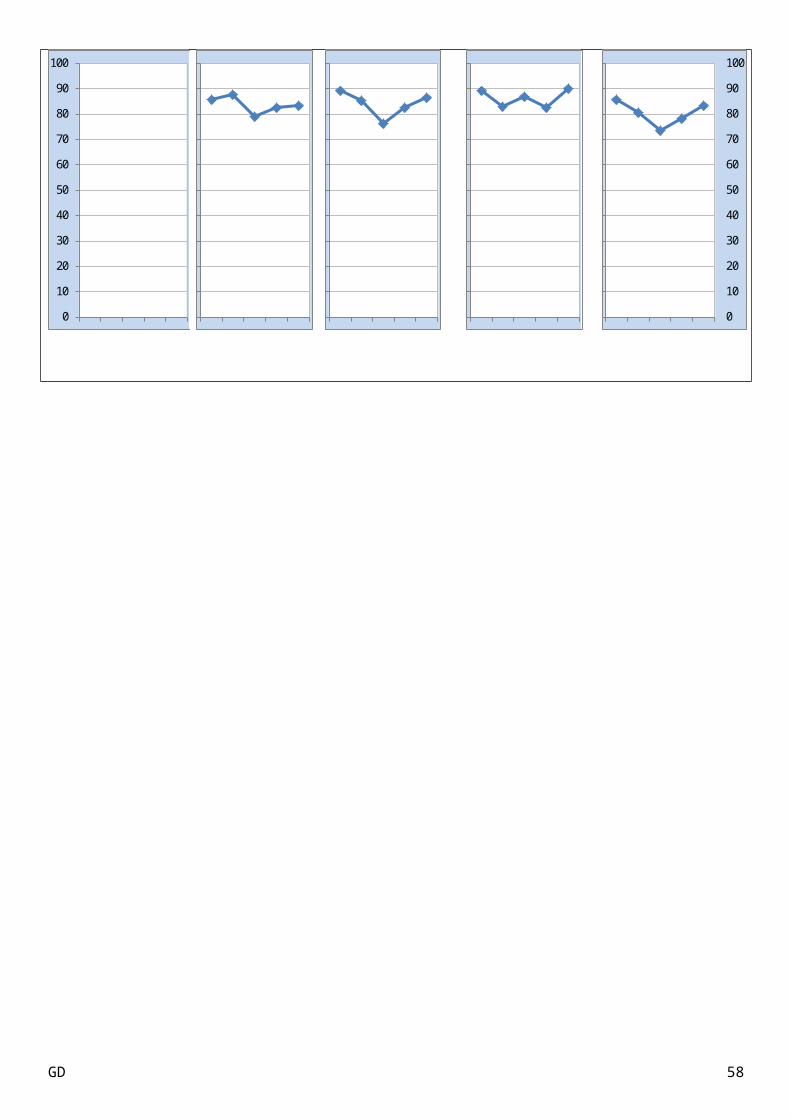
Table 15: Benchmarking the percentage achieving Level 5+ against school’s FSM group: 2010/11 - 2014/15
One pupi l as %(CSI)
2014/15 3.3 - 20.0 4 20.0 4 20.0 4
2013/14 4.3 - 30.4 2 30.4 2 30.4 2
2012/13 2.6 - 26.3 2 28.9 2 31.6 2
2011/12 2.4 - 31.7 1 22.0 3 19.5 3
2010/11 3.6 - 39.3 1 32.1 1 25.0 2
Summary of tables 9.1c – P erformance – KS2
Wel sh Engl i sh Mathematics Science
GD 58

6. Boys vs Girls
Chart 31: Percentage point difference between boys’ and girls’ Level 4+ achievement (boys - girls), by subject:
2010/11 - 2014/15
#N/A
-6.7
0.0
-6.7 -6.7
-100
-80
-60
-40
-20
0
20
40
60
80
100
CYM ENG MAT SCI CSI
10/11 11/12 12/13 13/14 14/15 6.2b – Performance – KS2
Chart 32: Percentage point difference between boys’ and girls’ Level 5+ achievement (boys - girls), by subject:
2010/11 - 2014/15
#N/A
-13.3
0.0
-26.7
-100
-80
-60
-40
-20
0
20
40
60
80
100
CYM ENG MAT SCI
10/11 11/12 12/13 13/14 14/15 6.2a – Performance – KS2
GD 59

7. Pupils eligible for free school meals (FSM)
Number of KS2 pupils eligible for FSM
(those that can be matched to PLASC)
(CSI) 10/11 11/12 12/13 13/14 14/15
FSM 8 18 10 8 6Non-FSM 19 23 27 15 24
Chart 33: FSM/Non-FSM comparison of pupil achievement (L4+): 2010/11 - 2014/15
Percentages come from the Core Data Sets if available.
As a result, the cohorts may not match perfectly with the percentages. Only (unofficial) provisional data is available for the most recent year – final data will be included in the Core Data Sets later in the year.
69.2 84.6 81.3 86.772.2 77.3 94.4 78.60102030405060708090100 FSM Non-FSM
CSI
87.5
72.2 70.0
50.0
83.385.0 87.0
74.1
93.383.3
0102030405060708090
100
10/11 11/12 12/13 13/14 14/15
Welsh
#N/A #N/A #N/A #N/A #N/A#N/A #N/A #N/A #N/A #N/A0
102030405060708090
100
10/11 11/12 12/13 13/14 14/15
English
87.5 83.3 80.0
62.5
83.385.091.3
77.8
93.383.3
0102030405060708090
100
10/11 11/12 12/13 13/14 14/15
Mathematics Science
GD 60
87.5 83.3
70.062.5
83.390.0 87.0
77.8
93.387.5
0102030405060708090
100
10/11 11/12 12/13 13/14 14/15
87.5
72.2
100.0
62.5
83.390.0 91.3
81.593.3 91.7
0102030405060708090
100
10/11 11/12 12/13 13/14 14/15
GD 61

Summary of school’s performance
Family LA Wales 2010/11 2011/12 2012/13 2013/14 2014/15
Pupi l s -- -- -- +3 -4 +11 -3 -13
%FSM (3 years ) / Group 36.6 5 40.7 5 39.8 5 39.0 5 37.0 5 -- 20.6 -- -- -- -- -- --
%SEN (5-15 only) -- 29.0 -- -- -- -- -- --
Attendance 91.7 2 93.0 2 92.9 2 93.8 2 ~ ~ -- ~ ~ -- -- -- -- --
%FSM -- -- -- -- -- -- --
Sta tements¦ School Action+ -- -- -- -- -- -- --
%LAC -- -- -- -- -- -- --
Cohort -- 2,498 -- +6 +1 +1 +0 +0
CSI 85.7 1 80.5 2 73.7 3 78.3 3 83.3 2 74.7 89.2 87.7 -23.5 -18.6 -18.3 -24.2 -6.7
Wels h - - - - - - 92.9 90.5 - - - - -
Engl is h 85.7 1 87.8 1 78.9 3 82.6 3 83.3 3 77.7 90.9 89.6 -23.5 -23.8 -18.9 -15.9 -6.7
Ma thema tics 89.3 1 85.4 2 76.3 3 82.6 3 86.7 2 80.1 91.3 90.2 -17.6 -18.8 -13.3 -33.3 +0.0
Science 89.3 1 82.9 2 86.8 2 82.6 3 90.0 2 80.7 92.6 91.4 -17.6 -13.8 -14.4 -33.3 -6.7
Wels h +1 - - - - - - 38.2 38.0 - - - - -
Engl is h +1 39.3 1 31.7 1 26.3 2 30.4 2 20.0 4 26.4 40.8 40.8 -40.1 -6.4 +7.8 -11.4 -13.3
Ma thema tics +1 32.1 1 22.0 3 28.9 2 30.4 2 20.0 4 30.8 42.4 41.2 -21.9 +13.6 +12.8 -11.4 +0.0
Science +1 25.0 2 19.5 3 31.6 2 30.4 2 20.0 4 26.7 40.5 41.1 -18.7 +8.8 +17.8 -11.4 -26.7
%FSM -- -- -- -- -- -- --
Sta tements¦ School Action+ -- -- -- -- -- -- --
%LAC -- -- -- -- -- -- --
Cohort -- 2,785 -- - -11 +2 +3 -1
FPI - 71.0 3 77.8 2 88.6 1 82.8 2 81.7 86.2 86.8 - -1.4 -19.8 +2.0 -21.9
LCW - - - - - - 92.2 91.3 - - - - -
LCE - 74.2 3 77.8 3 88.6 1 82.8 3 83.5 87.0 88.0 - -6.2 -19.8 +2.0 -21.9
MDT - 71.0 4 86.1 2 88.6 2 82.8 3 84.4 89.0 89.7 - -1.4 -15.2 +2.0 -21.9
PSD - 80.6 3 88.9 3 94.3 2 93.1 3 92.3 94.9 94.8 - -1.0 -9.9 -10.5 -14.3
LCW +1 - - - - - - 35.5 36.9 - - - - -
LCE +1 - 16.1 3 22.2 2 31.4 1 17.2 4 21.5 32.8 34.2 - -9.0 -2.5 -11.2 -5.7
MDT +1 - 19.4 2 22.2 2 40.0 1 24.1 2 25.6 32.7 34.3 - +1.0 -2.5 +4.6 -19.0
PSD +1 - 12.9 4 13.9 4 54.3 1 37.9 3 45.6 55.9 56.0 - -4.3 -18.3 -38.2 -4.3
- 31 36 35 29
- 3.1 0.0 0.0 0.0
3 ¦ 2 2 ¦ 2 3 ¦ 1 204 ¦ 460
1.1
3.3 0.6
Year
2 (F
P)
- 41.9 37.1 47.1
28 41 38 23 30
51.7 21.3
- ¦ - 5 ¦ 2
20.0 19.1
2 ¦ 4 1 ¦ 3
Who
le S
choo
l
271 280 283 283 281
3 ¦ 4 2 ¦ 2 1 ¦ 2 212 ¦ 414
Year
6 (K
S2)
29.6 43.9 27.0 34.8
0.0 2.4 0.0 0.0
39.730.5 29.7 30.8 37.6
2014/15 (1 year)2010/11 2011/12 2012/13 2013/14 2014/15
GD62
Summary of school’s SEN pupils’ performance
10/11 11/12 12/13 13/14 14/15 10/11 11/12 12/13 13/14 14/15 10/11 11/12 12/13 13/14 14/15 10/11 11/12 12/13 13/14 14/15
Cohort 33 34 34 41 48 10 10 13 13 12 15 14 15 17 19 58 58 62 71 79
Whole school %SEN 17.4 17.4 16.9 21.7 24.1 5.3 5.1 6.5 6.9 6.0 7.9 7.2 7.5 9.0 9.5 30.5 29.7 30.8 37.6 39.7
Cohort 6 5 8 5 9 4 3 4 2 2 2 1 3 2 1 12 9 15 9 12
Welsh cohort 0 0 0 0 0 0 0 0 0 0 0 0 0 0 0 0 0 0 0 0
CSI 66.7 80.0 50.0 80.0 66.7 75.0 0.0 50.0 0.0 50.0 50.0 0.0 0.0 0.0 0.0 66.7 44.4 40.0 44.4 58.3
Wels h - - - - - - - - - - - - - - - - - - - -
Engl is h 66.7 80.0 50.0 80.0 66.7 75.0 0.0 50.0 0.0 50.0 50.0 0.0 33.3 50.0 0.0 66.7 44.4 46.7 55.6 58.3
Mathematics 83.3 100.0 62.5 80.0 66.7 75.0 0.0 50.0 50.0 100.0 50.0 0.0 0.0 0.0 0.0 75.0 55.6 46.7 55.6 66.7
Science 83.3 80.0 75.0 80.0 77.8 75.0 0.0 75.0 50.0 100.0 50.0 0.0 33.3 0.0 0.0 75.0 44.4 66.7 55.6 75.0
Wels h +1 - - - - - - - - - - - - - - - - - - - -
Engl is h +1 0.0 0.0 12.5 0.0 11.1 0.0 0.0 0.0 0.0 0.0 0.0 0.0 0.0 0.0 0.0 0.0 0.0 6.7 0.0 8.3
Mathematics +1 0.0 0.0 25.0 0.0 0.0 0.0 0.0 25.0 0.0 0.0 50.0 0.0 0.0 0.0 0.0 8.3 0.0 20.0 0.0 0.0
Science +1 0.0 0.0 25.0 0.0 11.1 0.0 0.0 0.0 0.0 0.0 0.0 0.0 0.0 0.0 0.0 0.0 0.0 13.3 0.0 8.3
Cohort - 2 3 8 7 - 1 3 2 0 - 5 3 2 3 - 8 9 12 10
Welsh cohort - 0 0 0 0 - 0 0 0 0 - 0 0 0 0 - 0 0 0 0
English cohort - 2 3 8 7 - 1 3 2 0 - 5 3 2 3 - 8 9 12 10
FPI - 0.0 33.3 87.5 71.4 - 100.0 66.7 0.0 - - 0.0 33.3 50.0 0.0 - 12.5 44.4 66.7 50.0
LCW - - - - - - - - - - - - - - - - - - - -
LCE - 0.0 33.3 87.5 71.4 - 100.0 66.7 0.0 - - 0.0 33.3 50.0 0.0 - 12.5 44.4 66.7 50.0
MDT - 0.0 100.0 87.5 71.4 - 100.0 66.7 0.0 - - 0.0 33.3 50.0 0.0 - 12.5 66.7 66.7 50.0
PSD - 50.0 100.0 100.0 100.0 - 100.0 66.7 50.0 - - 0.0 33.3 50.0 33.3 - 25.0 66.7 83.3 80.0
LCW +1 - - - - - - - - - - - - - - - - - - - -
LCE +1 - 0.0 0.0 0.0 14.3 - 0.0 0.0 0.0 - - 0.0 0.0 50.0 0.0 - 0.0 0.0 8.3 10.0
MDT +1 - 0.0 0.0 0.0 14.3 - 0.0 0.0 0.0 - - 0.0 0.0 50.0 0.0 - 0.0 0.0 8.3 10.0
PSD +1 - 0.0 0.0 62.5 14.3 - 0.0 0.0 0.0 - - 0.0 0.0 0.0 0.0 - 0.0 0.0 41.7 10.0
Year
2 (F
P)
School Action School Action Plus Statemented
Scho
olYe
ar 6
(KS2
)
GD63

GD64