daniel p. jenny research fellowship …...daniel p. jenny research fellowship design of rectangular...
TRANSCRIPT
DANIEL P. JENNY RESEARCH FELLOWSHIP
Design of RectangularOpenings in Precast WallsUnder Vertical Loads
Research conducted as a part ofthe PRESSS (PREcast SeismicStructural Systems) research
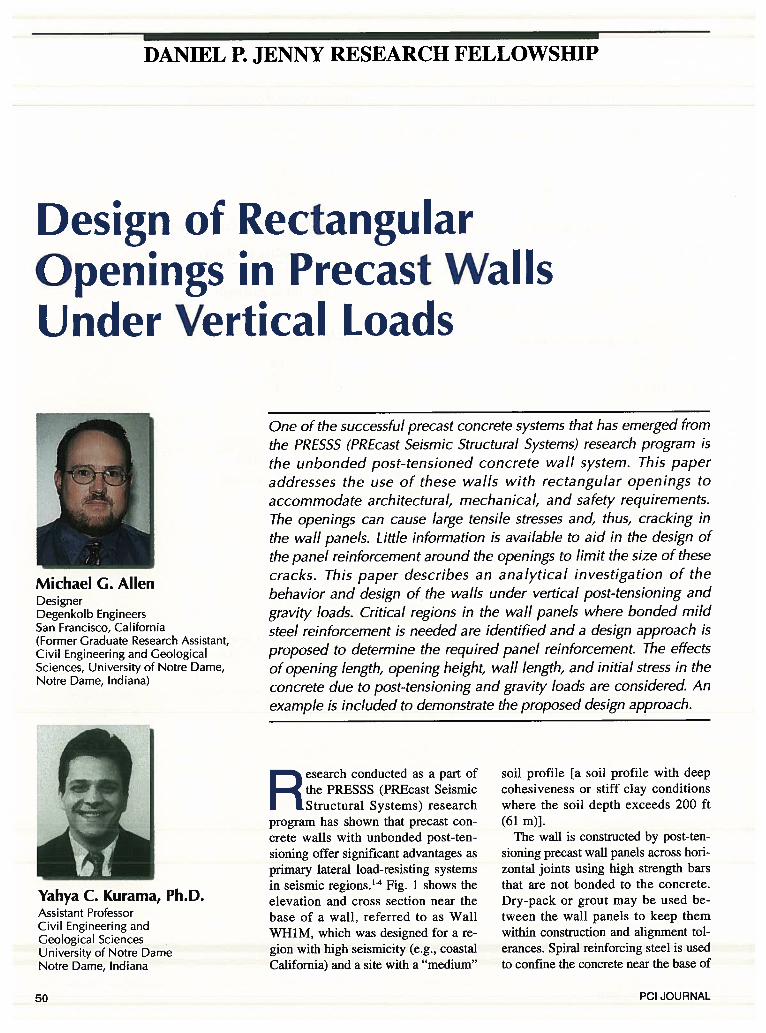
program has shown that precast concrete walls with unbonded post-tensioning offer significant advantages asprimary lateral load-resisting systemsin seismic regions.1-4Fig. 1 shows theelevation and cross section near thebase of a wall, referred to as WallWHiM, which was designed for a region with high seismicity (e.g., coastalCalifornia) and a site with a “medium”
soil profile [a soil profile with deepcohesiveness or stiff clay conditionswhere the soil depth exceeds 200 ft(61 m)J.
The wall is constructed by post-tensioning precast wall panels across horizontal joints using high strength barsthat are not bonded to the concrete.Dry-pack or grout may be used between the wall panels to keep themwithin construction and alignment tolerances. Spiral reinforcing steel is usedto confine the concrete near the base of
Michael G. AllenDesignerDegenkolb EngineersSan Francisco, California(Former Graduate Research Assistant,Civil Engineering and GeologicalSciences, University of Notre Dame,Notre Dame, Indiana)
One of the successful precast concrete systems that has emerged fromthe PRESSS (PREcast Seismic Structural Systems) research program isthe unbonded post-tensioned concrete wall system. This paperaddresses the use of these walls with rectangular openings toaccommodate architectural, mechanical, and safety requirements.The openings can cause large tensile stresses and, thus, cracking inthe wall panels. Little information is available to aid in the design ofthe panel reinforcement around the openings to limit the size of thesecracks. This paper describes an analytical investigation of thebehavior and design of the walls under vertical post-tensioning andgravity loads. Critical regions in the wall panels where bonded mildsteel reinforcement is needed are identified and a design approach isproposed to determine the required panel reinforcement. The effectsof opening length, opening height, wall length, and initial stress in theconcrete due to post-tensioning and gravity loads are considered. Anexample is included to demonstrate the proposed design approach.
Yahya C. Kurama, Ph.D.Assistant ProfessorCivil Engineering andGeological SciencesUniversity of Notre DameNotre Dame, Indiana
50 PCI JOURNAL

the wall. Welded wire fabric is used asbonded reinforcement in the panels.
The post-tensioning steel bars areanchored to the wall at the foundationand roof. Unbonding of the post-tensioning steel, which is achieved byplacing the bars inside oversized ungrouted ducts, has two important advantages under lateral loads:’
1. It results in a uniform strain distribution in the steel and, thus, delaysnonlinear straining (i.e., yielding) ofthe post-tensioning bars.
2. It significantly reduces the tensilestresses in the concrete, and thus reduces cracking, because the stresstransfer between the steel and the concrete due to bond is eliminated.
Previous research on the seismic behavior and design of unbonded post-tensioned precast concrete walls islimited to walls without openings. Theuse of openings in the walls, however,may be needed to accommodate windows, doors, and mechanical penetrations. Large panel openings may alsobe necessary in precast concrete parking structures to provide passive security protection.
The seismic design of Wall WHIMwas done for a prototype structure described in Kurama et al.1 using a designprocedure developed previously forwalls without openings. This designprocedure, which is described in detailby Kurama et al.,’-3 was used to determine the wall length and thickness aswell as the required amount of post-tensioning and spiral reinforcement.
The openings in the wall panels arenot addressed by the previous designapproach. These openings can result inlarge tensile stresses and, thus, cracking in the panels, which can limit thevertical and lateral load-carrying capacity of the walls by causing premature failure of the panels. Thus,bonded mild steel reinforcement maybe needed in the wall panels to limitthe size of the cracks.
This paper addresses the design ofthe required panel reinforcementaround the openings under post-tensioning and gravity loads only. The research, conducted as part of a DanielP. Jenny Research Fellowship fundedby the Precast/Prestressed ConcreteInstitute, is described in detail byAllen and Kurama.5
horizontal —
joint
.11’ 4rIr j
<& ‘Ir1r1r1r
& ‘1r441r’Ir &
U4U &.
<#4444
H[
l=20ft
OBJECTIVES AND SCOPEThe research project focuses on two
stages of loading for the walls. In thefirst stage, the walls are subjected onlyto vertical post-tensioning forces andgravity loads. This is the loading stagethat a typical wall would be subjectedto during most of its service life. Thesecond stage of loading is the combination of vertical loads with lateralloads, such as earthquakes.
The behavior and design of thewalls for the first stage of loading is
discussed in this paper. The secondstage of loading is addressed in Allenand Kurama,6 to be published in theMarch-April 2002 PCI JOURNAL.For each loading stage, the critical regions in the wall panels are identifiedand a design approach to determinethe required amount of bonded panelreinforcement to control cracking andprevent premature failure of the wallsis proposed.
The effects of opening length andheight, wall length, and initial stress in
gravity loadsJr
wall panel—
PT bar —
top horizontalchord
__________
side verticalbottom horizontal chord
chord
wall panel
h=81 ft
......spiralreinforcement
1 ft = 0.30 m1 in. = 25.4 mm
100 in. I
#3 spiralsp =7.3%
Fig. i. Prototype Wail WHiM: elevation and cross section (half the wall length).
January-February 2002 51
the concrete due to post-tensioningand gravity loads on the behavior anddesign of the walls are investigated. Adesign example for the determinationof the required panel reinforcement isprovided in Appendix B.
A series of six-story walls is investigated. The results can be extended towalls with different numbers of stories, as described later. It is assumedthat there is a horizontal joint at eachfloor level and between the wall andthe foundation since larger panel sizes(with fewer horizontal joints) may bedifficult to transport to the construction site. Only rectangular openingslocated at the center of the wall panelsare considered. It is assumed that eachstory panel contains an opening andthat the opening size does not vary.
PARAMETRICINVESTIGATION
A parametric investigation is conducted on walls with openings using afinite element model that is describedlater. The objectives of the parametricinvestigation are to:• Determine the effect of the openings
on the behavior of the walls.• Determine the critical regions in the
wall panels and the required amountof bonded panel reinforcement inthese regions.
• Develop an approach for designingthe panel reinforcement.Table 1 shows the parameters that
are investigated; these are:• Opening length, 10• Opening height, h0• Panel (wall) length, l
• Initial stress in the concrete due togravity and post-tensioning,Fig. 2 shows the elevation and cross
section near the base of the parametricwalls.
In Table 1, the opening length, 10, isnormalized with respect to the panellength, li,, as Yi l/l. The openingheight, h0, is normalized with respectto the height, h, of the base panel as
= hJh, where = 16 ft (4.88 m).Similarly, the initial stress in the concrete, f, is normalized with respect tothe compressive strength of the unconfined concrete, fe’. as =f1/f’, where
f = 6 ksi (41.4 MPa) is assumed. Theparametric wall with I,, = 20 ft (6.10m) and Yf= 0.29 [Fig. 2(a)] is the sameas Wall WHiM (see Fig. 1).
Note that the findings and conclusions presented in this paper are limited to the ranges of the parametersthat are considered, which are described below.
Opening Dimensions, 14, and h,
As shown in Table 1, the parametricinvestigation of the normalized opening dimensions is limited to 0.10<0.40 and 0.13 0.38. The maximum length of the openings is limitedso that the post-tensioning bars can beplaced within the vertical chords at thesides of the openings (see Fig. 1).(The placement of the bars inside theopenings is considered unsafe.)
Moreover, under combined verticaland lateral loads, all or most of theaxial forces in a wall (due to gravityand post-tensioning) are transferred tothe foundation through the verticalchord at the compression side of the
base panel (as described in more detailby Allen and Kurama5’6).The maximum length and height of the openings are limited to ensure that the wallpanels remain stable under these largecompression forces.
For openings that are larger thanthose investigated in this paper, it maybe necessary to brace the openings tostabilize the wall panels under combined vertical and lateral loads. Thepresence of larger openings may alsonecessitate that the walls be designedas either coupled wall systems orframe systems.
Panel Dimensions, Ii,, hi,, and I,
The parametric investigation of thepanel (wall) length is limited to 12 ft(3.66 m) li,, 20 ft (6.10 m) asshown in Table 1 and Fig. 2. Thepanel height, h, is assumed to beequal to 16 ft (4.88 m) for the basepanel and 13 ft (3.96 m) for the upperstory panels. The panel thickness, ti,, iskept constant at 12 in. (305 mm).
The maximum size and weight ofthe panels are limited to ensure thatthe panels can be transported to theconstruction site. The shorter panellengths considered in the paper can beused in wall systems with verticaljoints, similar to the walls investigatedby Priestley et al.,4 Kurama,7 andPerez.8
Initial Concrete Stress, f1The initial stress in the concrete is
calculated as a nominal initial stress,by dividing the axial force near thebase of the wall with the gross cross-sectional area, Ag = The parametric investigation of the normalizedinitial concrete stress due to post-tensioning and gravity loads is limited to0.057 Yj 0.29.
The total initial (i.e., after losses)post-tensioning force in the walls iscalculated as F, = where isthe area of a post-tensioning bar and
is the initial stress in the bar. Thevariation in the initial concrete stressis achieved by varying the total area ofthe post-tensioning steel as shown inFig. 2 to represent walls designed fordifferent levels of seisinicity.
The normalized initial concrete
Table 1. Parametric investigation.Parameter 1,, = 2Oft l,,= 15 ft 1,, = 12 ft
ifh fO.29YfO.181OZW y=OM57 yf= 0.18 yf= 0.18
0.20 x j — x — —
0.30 0.13 x x x x
0.40 0.13 x — — —
0.10 0.25 x x x x x x
0.20 0.25 x x x x x x
0.30 0.25 [ x X X X X X
0.40 0.25 x x x x x
—
—
0.20 038 x — — x — —
030 038 x x x x x
0.40 0.38 x — — x —
Note: If =4,/1,, Yh =h0th,, and Yf=L If . where h =
1 ft = 0.3048 m, I ksi = 6.895 MPa.16 ft andf= 6.0 ksi.
52 PCI JOURNAL

—C
a
/
0IC
I-
I‘CI
II!Z
I
C
p
——
—
——
—
,
I
0UaD0r’1
—a
0
0IIu
l-O
o
r—.
UL
fl
Co(a>j)0
C’,
L)
C’l00C
”Ca
.00UCaC(a
Zrj
00
I‘Cl
IIl
.1I
11
jjII
II
I—
II
I—
C
ZrjIIH

Fig. 3. Analytical model: (a) model elevation; (b) infinite elastic panel; (c) verification of results.
stress values of = 0.29, 0.18, and0.11 in Table 1 represent walls for regions with high, moderate, and lowseismicity, respectively. The case with
Yf = 0.057 represents a wall with gravity loads only, without any post-tensioning.
The initial stress in the post-tensioning bars is kept at a constant value of
f = 0.60f (which is a typical valuefor unbonded post-tensioned precastconcrete walls”2), wheref = 160 ksi(1100 MPa) is the assumed ultimatestrength of the post-tensioning steel.
The distance from the centroid ofthe group of post-tensioning bars oneach side of the wall centerline to thewall centerline is kept at a constantproportion (34.1 percent) of the walllength. This location is selected so that
the bars can be placed outside thelongest opening studied (i.e., y, =
0.40).The gravity load on the walls was
determined from the tributary areabased on the prototype structure layoutgiven in Kurama et al.’ The resultingtotal gravity axial force near the baseof the walls, Gb, is equal to 983 kips(4370 kN). For the walls with 1,,, = 20ft (6.10 m), the gravity axial force of983 kips is approximately equal to 5.7percent of A/C’ (i.e., Yf = 0.057), whereAg = l,,t,, = 20 sq ft (1.86 m2) andf = 6ksi (41.4 MPa).
Analysis of the WalkIn the parametric investigation,
each wall is first subjected to post-
tensioning and gravity loads, and thento equivalent lateral loads (except forthe wall with Yf = 0.057) using the analytical model described below. Theresults of the analyses under post-tensioning and gravity loads are described in this paper. The lateral loadanalyses are discussed in Allen andKurama.6
ANALYTICAL MODELThis section describes an analytical
model to investigate the behavior anddesign of unbonded post-tensionedprecast concrete walls with rectangular panel openings. Full details of themodel are given in Allen andKurama.5
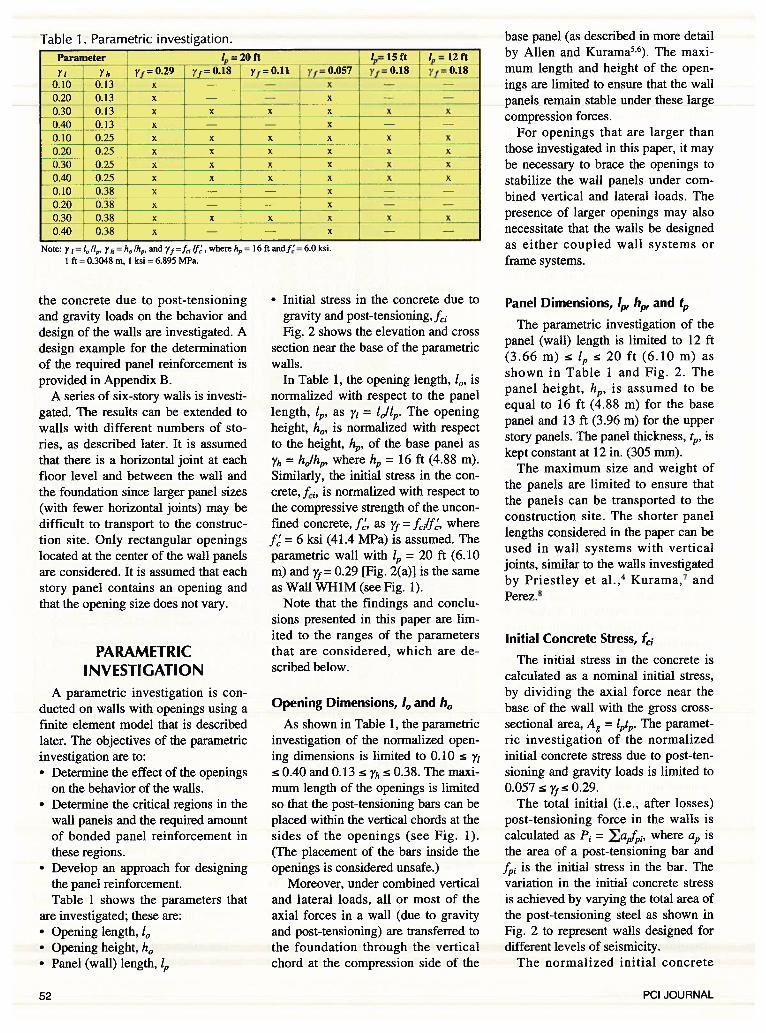
As an example, Fig. 3(a) shows the
N__ rigidelement
nonlinearplane stresselement
5th floor
(b)trusselement
1.2
gap/contactsurface
0 • 3.0 6.0
10/h0
(c)
f= 1.0 ksi
in.l=60 in. h0= 60 in. h°= 60 in.
60 in.
1 ksi = 6.89 MPa1 in. = 25.4 mm
—— closed-form solution
— — finite element model
(a)
54 PCI JOURNAL
analytical model for Wall WHiM.The model, which was developedusing the finite element programABAQUS,9can be used to conductnonlinear analyses of walls with andwithout openings under vertical andlateral loads.
Modeling of the post-tensioningbars, wall panels, and gravity loads isdescribed below. Modeling of the behavior of the walls under lateral loadsis described in Allen and Kurama.5’6
Modeling of Post-Tensioning Bars
The unbonded post-tensioning barsare modeled using truss elements. Thepost-tensioning anchors at the foundation are represented by restraining thevertical and horizontal translationaldegrees of freedom of the truss element nodes located at the foundationlevel. The post-tensioning anchors atthe roof level are modeled using rigidelements that share nodes with elements modeling the wall panels (described below).
The post-tensioning loads are simulated by initial tensile forces in thetruss elements, which are equilibratedwith compression stresses in the wallpanels. The “smooth” stress-strain relationship of the post-tensioning steelin tension is modeled using an idealized tn-linear stress-strain relationship.5
The yield stress of the tn-linear relationship is determined from the linearlimit (i.e., limit of proportionality)stress of the smooth stress-strain relationship as f,,,, = 120 ksi (827 MPa).The strain-hardening stiffness is determined from the nonlinear portion ofthe smooth stress-strain relationshipup to the ultimate strength, f, = 160ksi (1103 MPa).
Modeling of Wall Panels andGravity Loads
The precast concrete wall panels aremodeled using nonlinear rectangularplane stress elements. It is assumedthat the panels remain stable under theapplied loads. The gravity loads aremodeled as uniformly distributedloads applied to the top of the panelsat each floor and roof level.
A series of mesh refinement analyses were conducted to determine the
finite element mesh.5 As shown in Fig.3(a), a large number of elements areused to model the wall panels. Thenumber of elements is increased at thetop of the wall near the post-tensioning anchors and in the base panel,which is the most critical panel due tolarger stresses. The size of each element in the base panel is 2 x 2 in.(50.8 x 50.8 mm). The openings aremodeled by regions in the wall panelswithout any elements.
The spiral reinforcing steel in thewall panels is not modeled explicitly.Instead, the effect of the spiral reinforcement is represented using a confined concrete stress-strain relationship in the elements modeling thewall panels as described in detail byAllen and Kurama.5 The nonlinearcompressive stress-strain relationshipsof the unconfined concrete and thespiral confined concrete are determined using a model developed byMander et al.1°
Variations in the concrete propertiesacross the thickness of the wall panels(such as cover concrete) are ignored toreduce the size of the analytical modeland to prevent numerical problemsdue to the crushing of the cover concrete under lateral loads. Previous investigations of walls without openingshave shown that crushing of the coverconcrete under lateral loads occursover a small region near the bottomcorners of the base panel and does nothave a significant effect on the behavior of the walls.3 Thus, crushing of thecover concrete is not modeled in thisstudy. The reduction in the concretearea due to the post-tensioning ducts isalso not modeled.
Modeling of Bonded PanelReinforcement
The bonded panel reinforcement,which includes the mild steel reinforcement needed around the openingsand the welded wire fabric, is notmodeled explicitly. Since the actualamount and location of the mild steelreinforcement around the openings isnot known in advance, an explicitmodeling of this reinforcement wouldnecessitate an iterative analysis procedure to determine the required area,number, and location of the bars using
an accurate representation of each banin the wall panels. This iterative procedure would significantly limit thenumber of walls that could be investigated by the research because of an increased number of analyses necessaryfor each wall, difficulties in the modeling of individual bars and crackingof concrete, numerical problems, andexecution time.
These difficulties are overcome bymodeling the effect of the bondedsteel reinforcement using elastic tension properties in the plane stress elements for the wall panels. In thismodeling approach, the following assumptions are made:• The panels are reinforced with a
sufficient amount of bonded mildsteel to limit the size of the cracks.
• The panel reinforcement does notyield.
• The reinforcement is well-distributed and well-detailed in the tension regions.Based on these assumptions, the re
quired area of reinforcement can bedetermined from the tensile stresses inthe wall panels.
Note that as a result of using elastictension properties in the wall panels,the redistribution of panel stresses dueto concrete cracking and the actualplacement of the panel reinforcementcannot be modeled. However, in aproperly designed panel with a sufficient amount of well-distributed, well-detailed reinforcement, the cracks remain small and, thus, are not expectedto significantly affect the behavior.
Verification of the AnalyticalModel Under Vertical Loads
The finite element model under vertical loads is verified as describedbelow. The verification of the modelunder combined vertical (due to gravity and post-tensioning) and lateralloads is described in Allen and Kurama.5’6
Closed-form analytical solutions areavailable for the maximum tensilestresses in infinite elastic panels withrectangular openings for a limitednumber of load and opening configurations.5’11 As an example, Fig. 3(b)shows a panel loaded with a uniformcompression stress, f.
January-February 2002 55

(a)
(b)
Fig. 4. Stress contours in the base panel: (a) maximum principal stresses; (b) minimum principal stresses.
This loading condition is similar tothe condition that exists in the wallpanels under vertical loads due togravity and post-tensioning as described later. The presence of an opening in the panel results in the development of normal stresses (in thehorizontal, x-direction) above andbelow the opening as shown in Fig.3(b). The stresses near the opening aretensile, with the maximum tensionstress, ftm, occurring at the middle ofthe opening edge.
Fig. 3(c) shows comparisons between the maximum tension stress, ftm,
calculated using the closed-form solution and the stress predicted using a finite element model of the panel.5 Thecomparisons are provided for threedifferent opening aspect ratios (10/h0 =
1.0, 3.2, and 5.0) under a panel loading off,, = 1.0 ksi (6.89 MPa). The resuits indicate that the finite elementmodel is capable of accurately predict-
ing the maximum tension stress adjacent to the opening for different valuesof opening length, 4, and height, h0.
CRITICAL PANEL REGIONSUNDER VERTICAL LOADSAs described earlier, a typical pre
cast concrete wall with unbondedpost-tensioning would primarily besubjected to vertical loads due to gravity and post-tensioning during most ofits service life. Under these conditions,cracks may form in the wall panelsdue to the openings. To limit the sizeof these cracks, the most critical regions in the wall panels need to beidentified and reinforced with a sufficient amount of bonded mild steel.
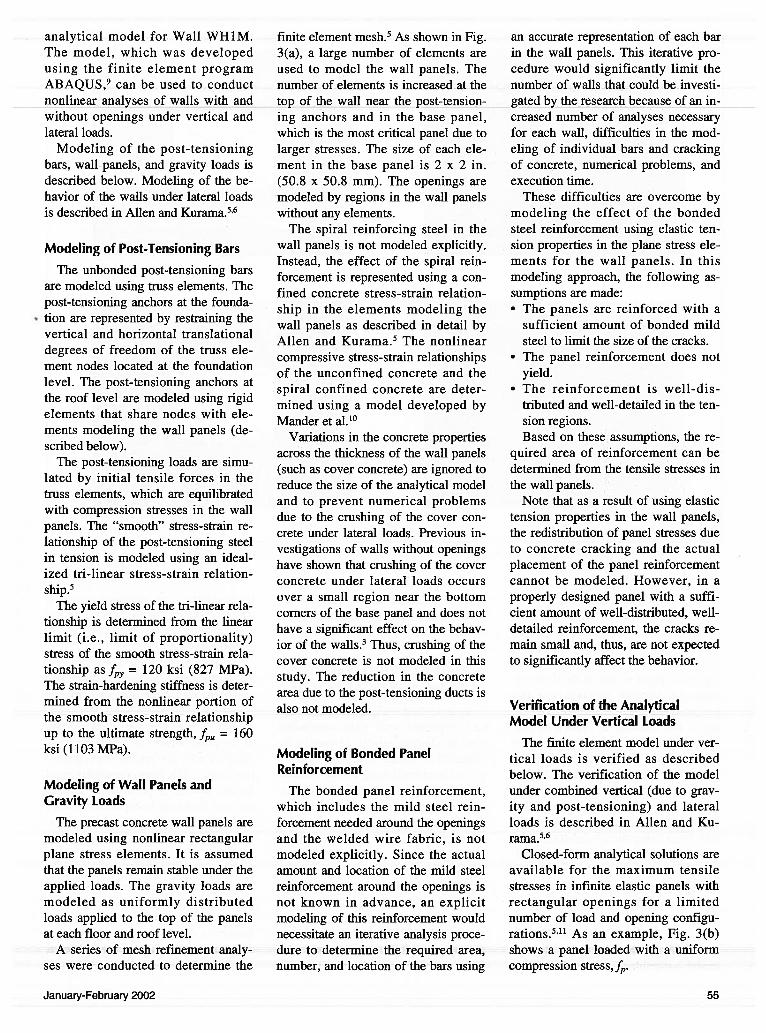
As an example, Fig. 4 shows theprincipal stress contours in the basepanel of Wall WHiM {1, 20 ft (6.10m) and = 0.291 using the finite element model. Figs. 4(a) and 4(b) show
the maximum and minimum principalstress contours, respectively, in thepanel without and with an opening (y= 0.40 and = 0.38).
The red-shaded areas in Fig. 4(a) indicate the critical regions of the panelwhere the maximum principal stressesexceed 7.5k in tension. The red-shaded areas in Fig. 4(b) show regionsof the panel where the minimum principal stresses are tensile (i.e., greaterthan zero). The sign convention usedfor the stresses is positive for tensionstresses. Cracking is expected to occurin the critical regions where the maximum principal stresses are larger than7.57I.
Fig. 4 shows that the presence of anopening disrupts the flow of the compressive stresses from the top to thebottom of the panel, resulting in theformation of tensile stresses. The critical panel regions under vertical loadsare along the top and bottom edges of
56 PCI JOURNAL

the opening. The maximum tensilestresses form at the middle of theopening edges and may be largeenough to cause cracking.
The finite element analysis resultsindicate that the directions of the critical principal stresses in the panel aremostly horizontal5 and, thus, horizontal reinforcement is needed parallel tothe top and bottom edges of the opening. The stresses above and below theopening are similar; thus, similaramounts of reinforcement are neededin both regions.
As described earlier, the panels aremodeled using elastic tension properties assuming that the critical regionsare reinforced with an adequateamount of well-distributed bondedmild steel. Thus, the tensile stresses inthe panels are allowed to exceed thecracking stress. The required area ofthe steel is determined by dividing thestress resultant in the tension region(which is calculated by integrating thetensile stresses) with the assumed allowable strength of the steel. The tensile strength of concrete is ignored inthe design of the reinforcement.
Note that for the opening and panelsizes and loads considered in thispaper, shear reinforcement is notneeded in the wall panels under vertical loads. Thus, the design of the panelshear reinforcement is not addressed.
DESIGN OF PANELREINFORCEMENT
This section investigates the required panel reinforcement above andbelow the openings based on the finiteelement analysis results of the parametric walls in Table 1. A design approach is proposed to estimate theamount of required reinforcement. Foreach wall, the design of the base panelis investigated in detail; this is the critical panel since the effect of the gravity loads is maximum at the base whilethe post-tensioning force is constantover the height of the wall.
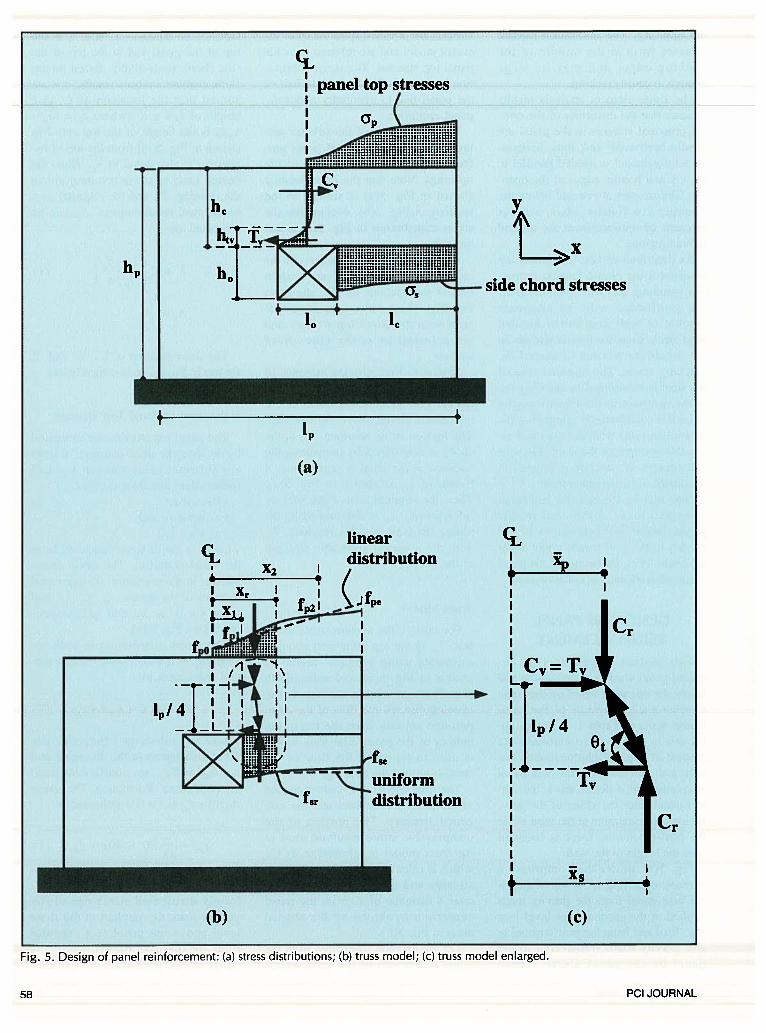
Fig. 5(a) shows the compressionstresses, ci.,, acting at the top of a typical base panel from the gravity loadsapplied at.the second floor level [seeFig. 3(a)] and from the post-tensioningand gravity loads transferred to thepanel by the panel above. These
stresses are obtained from the finite element model and are referred to as thepanel top stresses. The stress distribution is shown only on the right half ofthe panel due to symmetry about thepanel centerline.
The distribution of the stresses acting at the top of the panel is not uniform because of the presence of theopenings. Note that the panel loadingshown in Fig. 5(a) is similar to theloading in Fig. 3(b), except that thestress distribution in Fig. 5(a) is notuniform.
The compressive stresses, qç, at thetop of the vertical chord on the rightside of the opening are also shown inFig. 5(a). These stresses are in equilibrium with the panel top stresses andare referred to as the side chordstresses.
Similar to Fig. 3(b), the presence ofthe opening results in normal stresses(in the horizontal, x-direction) in thehorizontal chord above the opening.The tension stress resultant, T, in thechord is determined by integrating thestresses in the tension region over aheight of as shown in Fig. 5(a).Then, the required area of the steel reinforcement, A, is determined by dividing the tension stress resultant, T,with the assumed allowable strengthof the steel, Lii.
Truss Model
For design, the tension stress resultant, T, in the top horizontal chord isestimated using a “truss” model asshown in Fig. 5(b) and enlarged inFig. 5(c). As shown in Fig. 4, theopening disturbs the flow of the compression stresses from the top to thebottom of the panel. The truss modelis used to represent the flow of thestresses around the opening.
The truss model uses only a portionof the panel top stresses and the sidechord stresses. The portion of thecompressive stress resultant used inthe truss model is referred to as Cr,which is calculated from the panel topstresses and the side chord stressesover a distance of X,- from the panelcenterline as shown by the shadedareas in Fig. 5(b).
Let the location (measured from thepanel centerline) of the stress resul
tant, Cr, be equal to and i at thetop of the panel and at the top of theside chord, respectively. Based on thefinite element analysis results, it is assumed that the location of Cr at aheight of 4,14 h [where h = (1z —
h0)12 is the height of the top chord asshown in Fig. 5(a)] from the top of theopening is also equal to i. Thus, thedesign tension stress resultant abovethe opening, T, and the required areaof the steel reinforcement, A, can beestimated as:
(i .1T=C (I)
4,14 )
The determination of C and ifor use in Eq. (1) is described below.
Estimation of Panel Top Stresses
The panel top stresses are estimatedby dividing the stress distribution fromx = 0 (panel centerline) to x = 4,12(panel edge) into three regions:
• 0 x• x s x; and• x 4,12
where x is the distance measured fromthe panel centerline. The stress distributions in these regions are expressedin terms of the stresses fo fi fp2’ and
fpe at x = 0, x1, x2, and 1,,/2, respectively [see Fig. 5(b)].
The stress distribution in each region, is approximated using a second order curve as:
(2)
where the subscript j indicates thestress distribution in the jth region and
and are coefficients usedfor each stress distribution. The stress(0) =f at x = 0 is estimated as:
-40) +f (3)
The stress f, is equal to the uniformly distributed stress due to thegravity load, €4,, applied at the floorlevel above the panel (e.g., secondfloor for the base panel), and f isequal to the uniformly distributed
January-February 2002 57
panel top stresses
h,
(a)
side chord stresses
Fig. 5. Design of panel reinforcement: (a) stress distributions; (b) truss model; (C) truss model enlarged.
(c)
‘p
lineardistribution
.1.
Xpl
Cr
I.
distribution
(b)
Cr
I
PCI JOURNAL

3rd floor
Fig. 6. Estimation of I: (a) definition of O; (b) I versus O.
stress due to the total post-tensioningforce, P, and the sum of the gravityloads, Ga, applied at the upper floorand roof levels (e.g., third floor and upfor the base panel) as:
Gc P
J PP lPtp
____
Jp01pp
where and t1, are the panel lengthand thickness, respectively.
The angle O (in degrees) is measured between the panel centerline andthe bottom corner of the opening in theupper story panel [see Fig. 6(a)1 as:
Oc =tan(’U- ho)
where is the height of the upperstory panel (i.e., the panel above).
Fig. 6(b) shows how Eq. (3) (shownby the solid lines) compares with thef values obtained using the fmite element model (FEM, as shown by themarkers) for different values of Yi, Yh
and l,. The stress f is normalizedwith respect to the strength of the Un-
confined concrete, f 6 ksi (41.4MPa). The variation in the angle O inFig. 6(b) is a result of the variations in
and Yh.The distances x1 and x2 are selected
such that the stresses and fp2 (at x1and x2, respectively) can be estimatedusing a linear stress distribution asshown by the dashed line in Fig. 5(b).
(4) Based on the stress distributions obtained from the finite element analyses, it is assumed that:
2( + G + Ga)= -f0fpe
2(fpe —f0)x2f2=f0+
ip
0.3G
— 0 7f=O.29,lp=2Oft— o y=0.i8,I=20ft— ‘y=0.1i,1=20ft
0.20 — x‘‘
0.057, l,= 20 ft— * Yf-O.18,1p=l5ft— * ‘yf=O.i8,I=i2ft
markers — FEM0.10 1ines.—. Eq. (3)
lift 0.30 mJ
I I I —
1 30e (degrees)
(a) (b)
‘p
I I I
60 90
xl = 2(X{) = qi(xi)2
2l + l,
4
The stresses fpe’ fp2 and for the
(5) linear stress distribution at x 1,,12, x2,and x1, respectively, are determinedas:
It is assumed that the slope of atx = 0 is zero [i.e., u,1(0) = 0]. Then,the three second-order stress distributions, ai(O x x1), 2(x1 x s
and cr3(x2 x 1,12) can be determined using the following boundaryconditions with f,,, fi and fp2 as determined from Eqs. (3) and (7):
u1(0)fo
2(Xl) = cr(x) =fi
a3(x2)=a2(x2)= fp2
(6) tp3(X2) 02(X2)
Xj X2
tfcr1dx + tfcJ2dx +0
‘p
P+G+Gtfu1,3dx= P a (8)
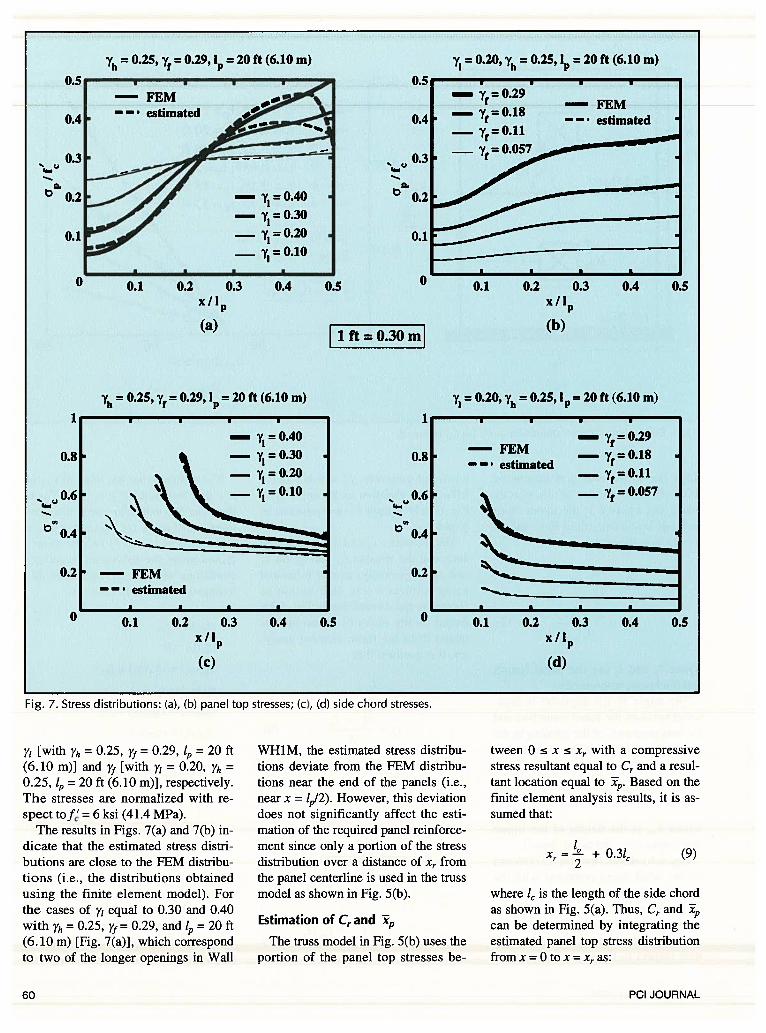
Figs. 7(a) and 7(b) compare the estimated base panel top stress distributions with stress distributions determined using the finite element
(7) analysis results of a selected set ofparametric walls for varying values of
=
+ 2(fpe —f0)x,
ip
January-February 2002 59
= 0.25, Yr = 0.29, l =20 ft (6.10 m)
(a)
0.E -
0.4
0.3
0.2
0.1
0
1ft=O.3Om
= 0.20,‘h
= 0.25, i, =20 ft (6.10 m)
0.1 0.2 0.3 0.4 0.5x/1
(b)
Fig. 7. Stress distributions: (a), (b) panel top stresses; (C), (d) side chord stresses.
—— FEM
— Y =0.18— —. estimated
—Yf= 0.11
0 0.1 0.2 0.3 0.4 0.5
“p
(d)
Vi [with Yh 0.25, y= 0.29, l, = 20 ft(6.10 m)] and Yf [with y = 0.20, m =0.25, l = 20 ft (6.10 m)], respectively.The stresses are normalized with respect tof = 6 ksi (41.4 MPa).
The results in Figs. 7(a) and 7(b) indicate that the estimated stress distributions are close to the FEM distributions (i.e., the distributions obtainedusing the finite element model). Forthe cases of 7j equal to 0.30 and 0.40with Yh = 0.25, Yf= 0.29, and = 20 ft(6.10 m) [Fig. 7(a)], which correspondto two of the longer openings in Wall
WHiM, the estimated stress distributions deviate from the FEM distributions near the end of the panels (i.e.,near x = l/2). However, this deviationdoes not significantly affect the estimation of the required panel reinforcement since only a portion of the stressdistribution over a distance of Xr fromthe panel centerline is used in the trussmodel as shown in Fig. 5(b).
Estimation of Cr and 5,,
The truss model in Fig. 5(b) uses theportion of the panel top stresses be-
tween 0 x X, with a compressivestress resultant equal to Cr and a resultant location equal to
.
Based on thefinite element analysis results, it is assumed that:
x =-- + 0.31‘2
(9)
where l is the length of the side chordas shown in Fig. 5(a). Thus, Cr andcan be determined by integrating theestimated panel top stress distributionfrom x = 0 to x = x,. as:
— ;= 0.29— FEM
— Y = 0.18 ——. estimated
x”p
= 0.25, Yf = 0.29, = 20 ft (6.10 m) = 0.20,‘h
= 0.25, i =20 ft (6.10 m)
1—
0.8
0.6
0.4
0.2
b
0 0.1 0.2 0.3 0.4 0.5x /l
(c)
60 PCI JOURNAL
Cr =t(fa1dx + fa2dx)
Estimation of Side Chord Stressesand
The compressive stress distributionat the top of the side chord is estimated as follows. The stress distribution from x = 1,12 to x = l,,12 is dividedinto two parts, a and a2, between1I2 X Xr and Xr x 1,I2, respectively [where x,. is given in Eq. (9)].The compressive stress resultant for0s1 is assumed to be equal to Cr andthe compressive stress resultant for U2
is assumed to be equal to (P1 + G +
Ga)/2 — Cr.The stress fsr at X = Xr is estimated
using a uniform stress distribution inthe side chord as shown by the dashedline in Fig. 5(b) as:
P+G +Gfsr=
2lt
a
Then, the stress fse at x l,I2 is determined assuming a linear stress distribution for 032 as:
— 1 + G + Ga — 2CrJse
— (i / 2— Xr)tp
Finally, a second order stress distribution is assumed for which canbe determined using the followingboundary conditions:
Gsi(Xr) = O’,2(Xr) Lr
U1(X,)U2(Xr)fsr fse
1I2— Xr
stress resultant Cr at the top of the sidechord, can be determined as follows:
Xr
t,, fa1xdx
Figs. 7(c) and 7(d) compare the estimated base panel side chord stress distributions with stress distributions determined using the finite elementanalysis results of a selected set ofparametric walls for varying values ofY [with Yh = 0.25, Yf= 0.29, 1,, = 20 ft(6.10 m)] and Yj [with Vi 0.20, Yh =0.25, l, = 20 ft (6.10 m)], respectively.The stresses are normalized with respect tof = 6 ksi (41.4 MPa). The results indicate that the estimated stressdistributions are close to the FEM distributions.
Placement of the PanelReinforcement
The design approach describedabove can be used to determine thepanel reinforcement needed to limitthe size of cracks that can occur at anopening. The finite element analysis
(11) results indicate that the tensile stressesabove and below the opening are similar. Thus, the reinforcement determined for the top of the opening canand should also be used at the bottomof the opening. It is recommendedthat:• The welded wire fabric used in the
panels be ignored, and• A minimum reinforcement of two
(12) No. 5 bars [with an area Amj = 0.61sq in. (394 mm2)] be used along thetop and bottom edges of the opening.The reinforcing bars should be
placed as close to the top and bottomedges of the opening as possible (withadequate concrete cover and clear distances between the bars) on both facesof the panel. The reinforcement shouldbe placed horizontally within thedepth of the tension region, h15,, aboveand below the opening [see Fig. 5(a)].Based on the finite element analysisresults, it may be assumed that:
h11, = y h
For the walls investigated in thisstudy, the proposed design requirements can be met without using verylarge bars since the amount of reinforcement needed in the panels is notexcessive, as shown later.
(14) The reinforcing bars should be extended a sufficient distance on bothsides of the middle of the opening toprovide adequate length for the development of the steel strength. The tension regions at the top and bottom ofthe opening extend the entire length ofthe opening [see Fig. 4(a)]. Thus, thelength of each bar should be greaterthan the opening length to provide sufficient embedment beyond the opening corners.
Design of the Upper Story Panels
The finite element analysis resultsof the parametric walls show that tensile stresses form along the top andbottom edges of the openings in theupper story panels, similar to the basepanel. The magnitude of these tensilestresses is most significant in wallswith large amounts of post-tensioning(e.g., Yf= 0.29).
As an example, Figs. 8(a) and 8(b)show the maximum principal stresscontours over the height of WallWHiM [Yf= 0.29 and 1,, = 20 ft (6.10m)] without and with openings (Vi =0.40 and Yh = 0.38), respectively. Thered-shaded areas indicate regions ofthe wall panels where the maximumprincipal stresses exceed 7.5j7 intension and, thus, where cracking isexpected to occur.
Fig. 8(b) shows that the size of thecritical regions with tensile stresseslarger than 7.5U7 decreases in theupper story panels. Several of theupper story panels in Fig. 8(b) do nothave any regions with tensile stressesexceeding However, the finiteelement analysis results show that significantly large (but less than 7.5)tensile stresses do form along the topand bottom edges of the openings inthese panels and, thus, bonded mildsteel reinforcement is recommended.
The proposed design approach canbe used for the upper story panels similar to the design of the base panel described earlier. The only differences
(15) between the base panel and the upper
= tp
.rl XJ.
fa,1xdx + fa2xdxo
(10)Cr
Note that x1 <Xr < X2; thus, both °,i
and G,2 need to be estimated to determine Crand
.
— 112x=
Cr
- fsr
(13)
tfa51dx = Cr
After finding u, the location of the
January-February 2002 61

story panels. Note that the proposeddesign approach cannot be used forthe roof panel where there is no panelabove and concentrated post-tensioning anchor forces are applied. Thispaper does not address the design ofthe roof panel for the post-tensioninganchor forces.
For walls where the post-tensioningforces are significantly larger than thegravity loads, it is recommended thatthe reinforcement designed for thebase panel be used in the upper storypanels since the critical tensile stressesin the panels will be similar. For wallswith little or no post-tensioning, itmay be more economical to determinethe reinforcement needed in each individual panel.
story panels for the design of the panelreinforcement are the amount of gravity load and, possibly, the panelheight. Thus, the proposed design approach can be applied to the upperstory panels by using the appropriate
panel height and the gravity loads acting on the panel.
As in the base panel, a minimum reinforcement of two No. 5 bars is recommended along the top and bottomedges of the openings in the upper
RESULTS OF STUDYFor each parametric wall, the re
quired reinforcing steel area, A, aboveand below the opening in the basepanel is predicted using the proposeddesign approach and compared withthe steel area determined using the finite element model (referred to as theFEM steel area). To determine theFEM steel area, the tensile stressesabove the opening were integratedover the height of the tension region,h1, and then divided by the assumedyield strength of the steel, f. of 60 ksi(414 MPa).
Note that even though the requiredsteel area, A, for the walls investigated in this paper is determined basedon the assumed yield strength of thesteel, f,,, a more conservative allowable steel strength fait equal to 0.5f isrecommended for use in practice.Then, the required steel areas givenbelow should be multiplied by 2.0.
Table 2 compares the predicted andFEM steel areas, A, for the base panels of the parametric walls normalizedwith respect to the horizontal chordarea resulting in the required reinforcement ratio, p, as:
p,=— (16)
In Table 2, the values in bold correspond to the cases where the predictedreinforcement ratio is less than theFEM reinforcement ratio.
(a) (b)
Fig. 8. Principa’ stress contours in Wafl WH1 M (y= 0.29, I,, = 20 ft): (a) withoutopenings; (b) with openings (y = 0.40, Yh = 0.38).
62 PCI JOURNAL

Table 2. Required reinforcement at top and bottom of opening.. 1=20ft l15ft l=12ft
Yj=O.29 Yf=0•’8 0.11 Yf=O•0_ yf=OJX Yf°•18Pv P Pr P Pr Pr Pr P P P Pr P
(percent) (percent) (percent) (percent) (percent) (percent) (percent) (percent) (percent) (percent) (percent) (percent)y y, FEM Pred. FEM Pred. FEM Pred. FEM Pred. FEM Pred. FEM Pred.
0.10 O.130.11 0.11 I — —
— 0.021 0.021 — —
0.20 0.13 0.20 0.22 ——
0.041 0.046 — — — —
0.30 0.13 0.28 0.32 0.18 0.21 0.12 0.14 0.058 0.069 0.17 0.18 0.15 0.160.40 0.13 0.34 0.40 — — — — 0.071 0.092 — — — —
0.10 0.25 0.12 0.12 0.076 0.078 0.049 0.051 0.023 0.070 0.O66Q,Q, 0.0550.20 0.25 0.22 0.23 0.14 I 0.15 0.092 0.10 0.044 011 0.100.30 0.25 0.28 0.32 0.18 0.21 0.12 0.14 0.059 0.071 0.18 0.19 0.170.40 0.25 0.31 0.37 0.21 0.25 0.14 0.17 0.070 0.091 0.22 0.24 0.22 0.230.10038 0.13 0.14 — — — 0.026 0.028 — — — —
0.20 0.38022 0.24 — — — — 0.046:0.0521 — — — —
0.30 0.38 0.26 0.29 0.17 0.19 0.11 0.13 0.058 0.070 0.18 0.19 0.18 0.180.40 — — — — 0.066 0.085
— — — —
avg(predJFEM) 1.10 1.12 1.14 1.16 1.05 0.99Note: The P values should be multiplied by 2.0 if)’,,1 = 0.5)’). is used in design.
, = 4,/I,,, )‘ = hr/hp. and Yf=f, /f,, where h = 16 ft andf, = 6.0 ksi.1 ft = 0.3048 m, 1 ksi = 6.895 MPa.
0.56
0.4(
0.30
‘9 0.20
0.10
0.56
0.40
0.301.
0.20
0.10
1h= 0.25, I,= 20 ft (6.10 m)
— ‘(f— 0.29
— l=O.i8— YfO.li
—0.057
— FEM— — predicted0.40
0.30
‘S 0.20
0.10
0•
= 0.30, Ip= 20 ft (6.10 m)
— 0.29
— lf—O.l8
— ‘(fO.ll
—0.057
—FEM
— — predicted
I. — — — — — —
.-————..————
U 0.10 0.20 0.30 0.40 0.Yl
(a)
Yh— 0.25, Y = 0.18
U
I
— y=040—FEM
0.4( —= 0.30 — — predicted
— 1i0.20
— 11=0.10
0.10 0.20 0.30 0.40 0.
(b)
‘h0.25, I= 20 ft (6.10 m)
0.30
‘5 0.20
0.10
— FEM
— = 0.30 — — predicted
•1• — — a fl — — — _
— i=o2o— 110.10
0 I I
0.5 0.75 1.0 1.25 1.5
(c)
I
Fig. 9. Reinforcement ratio, p,,: (a) effect of yl; (b) effect of yh; (C) effect of h1,/I; Cd) effect of y.
U 0.10 0.20 0.30 0.40
If
(d)
January-February 2002 63

Selected results from the observedtrends and comparisons based on theparametric analyses are given in Fig.9, which shows the predicted andFEM reinforcement ratios for differentvalues of Yi’ Yh’ l, and The resultsindicate that the required reinforcement ratio, p, increases as Vi increasesand increases.
Table 2 shows the average of thepredicted reinforcement ratios dividedby the FEM reinforcement ratios foreach combination of and The results indicate that the design approach,on average, provides a reasonably closeand conservative [except for = 12 ft(3.66 m)] estimate for the requiredpanel reinforcement in the walls.
CONCLUSIONS ANDRECOMMENDATIONS
A brief summary and the conclusions drawn from the investigation aregiven below. The behavior and designof the walls under combined verticalloads and lateral loads, such as earthquakes are discussed in Allen and Kurama.6
This paper has described researchon the behavior and design of unbonded post-tensioned precast concrete walls with rectangular openingsunder vertical loads only. This is theloading stage that a typical wall is subjected to during most of its servicelife.
1. The presence of openings cancause cracking in the wall panelsunder post-tensioning and gravityloads only. Bonded mild steel reinforcement is needed in the panels tolimit the size of these cracks.
2. A finite element model is devel
oped to investigate the behavior anddesign of walls with openings. The finite element model is verified by comparing the maximum tensile stressesaround the openings with availableclosed-form analytical solutions.
3. The finite element model is usedto conduct a parametric investigationon the behavior and design of a seriesof walls. The parameters studied arethe opening length, opening height,panel length, and initial stress in theconcrete due to post-tensioning andgravity loads.
4. The parametric analyses showthat the most critical regions in thewall panels under vertical loads are atthe top and bottom of the openings.The tensile stresses above and belowan opening are similar and, thus, similar amounts of reinforcement areneeded in both regions.
5. A design approach to determinethe amount of reinforcement needed atthe top and bottom of the openings isproposed. The design approach can beused for walls with and without post-tensioning.
6. The required panel reinforcementpredicted by the proposed design approach compares closely with the reinforcement determined using the finiteelement model. On average, the designapproach is conservative.
7. For the walls investigated in thisstudy, the proposed design requirements can be met without the need forusing very large reinforcing bars sincethe amount of reinforcement needed inthe panels is not excessive.
8. The required panel reinforcementshould be placed in two layers (nearthe faces of the panels), as close to thetop and bottom edges of the openings
as possible. The reinforcement shouldbe placed horizontally within the tension region and should be extended asufficient distance beyond the cornersof the openings with adequate lengthto develop the steel strength.
ACKNOWLEDGMENTSThe research was funded by a PCI
Daniel P. Jenny Research Fellowshipand by the University of Notre Dame.The support of the Precast/PrestressedConcrete Institute and the Universityof Notre Dame is gratefully acknowledged.
The support of Paul Johal, PCI research director, and Helmuth Wilden,past chairman of the PCI Research andDevelopment Committee, is gratefullyacknowledged. The support and advice provided by the PCI Ad Hoc Advisory Group on the Fellowship is acknowledged: Ned Cleland, Blue RidgeDesign, Inc.; Tom D’Arcy, The Consulting Engineers Group, Inc.; JamesHoffman, Sturm Engineering Company; and Stephen Pessiki, LehighUniversity. The researchers also wishto thank Kenneth Baur, High ConcreteStructures, Inc., and Richard Sause,Lehigh University, for their contributions to the project.
The authors express their gratitudeto the PCI JOURNAL reviewers fortheir thoughtful and constructive comments.
The opinions, findings, and conclusions expressed in this paper are thoseof the authors and do not necessarilyreflect the views of PCI, the University of Notre Dame, nor the individuals and organizations acknowledgedabove.
64 PCI JOURNAL
REFERENCES1. Kurama, Y., Pessiki, S., Sause, R., and Lu, L., “Seismic Be
havior and Design of Unbonded Post-Tensioned Precast Concrete Walls,” PCI JOURNAL, V. 44, No. 3, May-June 1999,pp. 72-89.
2. Kurama, Y., Sause, R., Pessiki, S., and Lu, L., “Lateral LoadBehavior and Seismic Design of Unbonded Post-TensionedPrecast Concrete Walls,” ACI Structural Journal, V. 96, No. 4,July-August 1999, pp. 622-632,
3. Kurama, Y., Pessjki, S., Sause, R., Lu, L., and El-Sheikh, M.,“Analytical Modeling and Lateral Load Behavior of UnbondedPost-Tensioned Precast Concrete Walls,” Research Report No.EQ-96-02, Department of Civil and Environmental Engineering, Lehigh University, Bethlehem, PA, November 1996, 191pp.
4. Priestley, M., Sritharan, S., Conley, J., and Pampanin, S., “Preliminary Results and Conclusions From the PRESSS Five-Story Precast Concrete Test Building,” PCI JOURNAL, V. 44,No. 6, November-December 1999, pp. 42-67.
5. Allen, M., and Kurama, Y., “Design of Rectangular Openingsin Unbonded Post-Tensioned Precast Concrete Walls,” Research Report No. NDSE-0l-01, Department of Civil Engi
neering and Geological Sciences, University of Notre Dame,Notre Dame, IN, April 2001 (available for download athttp://www.nd.edu/—concrete).
6. Allen, M., and Kurama, Y., “Design of Rectangular Openingsin Precast Walls Under Combined Vertical and Lateral Loads.”To be published in the March-April 2002 PCI JOURNAL.
7. Kurama, Y., “Simplified Seismic Design Approach for Friction-Damped Unbonded Post-Tensioned Precast ConcreteWalls,” ACI Structural Journal, V. 98, No. 5, September-October 2001, pp. 705-7 16.
8. Perez, F., “Lateral Load Behavior of Precast Concrete Wallswith Ductile Vertical Joint Connectors,” M.S. Thesis, Department of Civil and Environmental Engineering, Lehigh University, Bethlehem, PA, December 1998.
9. Hibbitt, Karlsson, and Sorenson, ABA QUS User’s Manual, Hibbitt, Karlsson, & Sorenson, Inc., Version 5.8, 1998.
10. Mander, J., Priestley, M., and Park, R., “Theoretical Stress-Strain Model for Confined Concrete,” ASCE Journal of Structural Engineering, V. 114, No. 8, August 1988, pp. 1804-1826.
11. Savin, G., Stress Concentrations Around Holes, PergamonPress, New York, NY, 1961.
APPENDIX A — NOTATIONAg = gross cross-sectional area of wallAmin = minimum area of mild reinforcing steel (two No. 5
bars)= area of a post-tensioning bar
first coefficient for crA area of required mild reinforcing steelb3 second coefficient forc = third coefficient forC = compression stress resultant in truss modelC = compression stress resultant in horizontal chord
fati = allowable strength of mild reinforcing steel
f’ = compressive strength of unconfined concrete= initial stress in concrete
f,, = compression stress applied to panel
fo = compression stress at top of panel at centerline
fi compression stress at top of panel at x1
fp2 compression stress at top of panel at x2
fpa = uniformly distributed stress transferred from panelabove
fpe = compression stress at top of panel at edge (basedon a linear stress distribution)
f = initial stress in post-tensioning steel
f, = uniformly distributed stress due to gravity load applied at floor level above panel
f = ultimate strength of post-tensioning steel
f = yield strength of post-tensioning steel
fse = compression stress in side chord at edge of panel= compression stress in side chord at x,.
f1 = maximum tension stress at top of opening
f = yield strength of mild reinforcing steelGa = sum of gravity loads applied at upper floor and
roof levelsGb = total axial force in base panel due to gravity loadsG = gravity load applied at floor level above panelh height of horizontal top chord or bottom chord
h0 = height of openingh = height of panel
= height of upper story panelheight of wall
l length of side chord10 = length of opening
= length of panelP1 = sum of initial forces in post-tensioning bars
= thickness of panelT = tension stress resultant at top of openingx = horizontal distance measured from centerline of
panel= location where o,,i changes to= location where 2 changes to 0,3
= resultant location of Cr at top of panelXr = distance over which stresses are integrated to de
termine Cr= resultant location of Cr at top of side chord
yf = ratio off, tof
Yh = ratio of h0 to= ratio of 10 to l= angle to determinef (in degrees)= angle for truss model (in degrees)= volume of spiral reinforcing steel divided by vol
ume of confined concrete core= required mild steel reinforcement ratio
a,,, = panel top stress distribution= second order panel top stress distribution in Region 1= second order panel top stress distribution in Region 2= second order panel top stress distribution in Region 3
cr = second order panel top stress distribution in Regionj= side chord stress distribution= second order side chord stress distribution in Region 1
0s2 = first order side chord stress distribution in Region 2
January-February 2002 65

APPENDIX B — DESIGN EXAMPLEThe following example demonstrates the implementation
of the proposed design approach to determine the requiredpanel reinforcement in a six-story wall with l, = 20 ft (6.10m), Yf= 0.18, y= 0.30, and Yh = 0.38. The dimensions of thewall and the placement of the post-tensioning bars areshown in Fig. 2(b). The applied loads, wall and opening dimensions, and material properties are given below.
Data
Post-tensioning and gravity loads:P, = 228Okips(lOl4OkN)
= 172 kips (765 kN) at the second floor level, 167kips (743 kN) at the third through sixth floor levels,and 143 kips (636 kN) at the roof
Gb= 172+4x167+143=983kips(4370kN)
Wall and panel dimensions:l = 240 in. (6100mm)h = 192 in. (4880 mm) for the base panel and 160 in.
(4060 mm) for the upper story panelst = l2in.(305mm)
Opening and chord dimensions:10 = 72in.(1830mm)
4, = (240— 72)12 = 84 in. (2130 mm)h, 72in. (1830 mm)h = (192 — 72)/2 = 60 in. (1520 mm) for the base panel
and (160— 72)/2 44 in. (1120 mm) for the upperstory panels
Material properties:
f = 6 ksi (41.4 MPa)
f = 60 ksi (414 MPa)
Design Overview
The design of the base panel, which is the most criticalpanel, is presented below. The post-tensioning forces for thewall are significantly larger than the gravity loads. Thus, thereinforcement determined for the base panel will be used inthe upper story panels as described at the end of the designexample.
Estimation of Panel Top Stresses
In order to determine the amount of reinforcement required at the top and bottom of the opening in the basepanel, it is necessary to solve Eq. (1) for T and A. The firststep is to estimate the stresses at the top of the panel byusing Eq. (2) for the regions 0 x x1 and x1 x x2,
where x is measured from the centerline of the panel. UsingEq. (6):
x1= 72/2 = 36 in. (914 mm)= (2 x 72 + 240)/4 = 96 in. (2440 mm)
The stressesfi andf2 (at x1 and x2, respectively) are esti
mated using a linear stress distribution as shown by thedashed line in Fig. 5(b). For the base panel,
G = 172 kips (765 kN)Ga= 4x167+143=8ilkips(3610kN)
Thus,f andfpa can be determined from Eq.(4) as:
f, = 172/(240 x 12) 0.0597 ksi (0.4 12 MPa)
fpa = (2280 + 811)/(240 x 12) = 1.07 ksi (7.38 MPa)
The angle O is calculated using Eq. (5). For the basepanel, = 160 in. (4060 mm) and, thus,
e = tan-’[(160—
72)/72] = 50.7 degrees
The stresses andf0 and the angle O, are then used inEq.(3):
fo = 1.07(50.7 — 40)145 + 0.0597 = 0.3 15 ksi (2.17 MPa)
The stressesfpe,fp2, andfi are determined using Eq. (7):
fpe = 2(2280 + 172 + 811)/(240 X 12)— 0.315= 1.96 ksi (13.5 MPa)
fp2 = 0.315 + 2 X 96(1.96 — 0.315)/240= 1.63 ksi (11.2 MPa)= 0.315 + 2 x 36(1.96 — 0.315)/240= 0.809 ksi (5.58 MPa)
The stresses and fp2 are then used in Eq. (8) to determine the boundary conditions for the panel top stressesand as:
o,1(0) 0.3 15 ksi (2.17 MPa)oji(0)=Oo},2(36) = u,1(36) = 0.809 ksi (5.58 MPa)2(36) = q(36)cr2(96) = 1.63 ksi (11.2 MPa)
These boundary conditions can be used to determine thedistributions for the panel top stresses u1i and L7,,,2 as:
= (3.74 x lOjx2 + 0.3 15 (ksi)= (—2.24 x lOjx2+ 0.043 lx — 0.463 (ksi)
Estimation of Cr and
The stress distributions and u,,2 are then used to estimate Cr and based on Eqs. (9) and (10) as follows:
Xr = 72/2 + 0.3 x 84 = 61.2 in. (1550mm)Cr533 kips(237OkN)
= 38.7 in. (983 mm)
Estimation of Side Chord Stresses and
After determining Cr and , the stresses at the top of the sidechord can be estimated. The slressfsr is found using Eq. (11):
66 PCI JOURNAL

(6.37 x 104)x2— 0.0803x + 4.13 (ksi)
From Eq. (14), x can be calculated as:
= 48.0 in. (1220 mm)
Estimation of T and A
The design tension stress resultant T, the required reinforcement area A, and the reinforcement ratio p in the basepanel are estimated using Eqs. (1) and (16). In this designexample, the required reinforcement area, A, is determinedbased on the steel yield strength, J,. As described in thepaper, a more conservative allowable steel strength, fait =
0.5f, is recommended for use in practice. Then, the A,, andp values calculated below should be multiplied by 2.0.
T,, = 533(48.0 — 38.7)/60 = 82.6 kips (367 kN)
A,, = 82.6/60 1.38 sq in. (890 mm2) > Amjn = 0.61 sq in.(394 mm2)
(OK)
Thus,= 1.38 x 100/(60 x 12)= 0.19 percent as shown in Table 2.
Reinforcement Selection and Placement
The required reinforcement in the base panel is providedusing 8 No. 4 bars [with an area of 1.57 sq in. (1013mm2)J; four bars near each face of the panel, placed at both
the top and the bottom of the opening as shown in Fig. B 1.Based on Eq. (15), the bars should be placed within a distance of:
= 0.30 x 60 = 18 in. (457 mm)
from the opening top and bottom edges to ensure that the reinforcement is within the tension region.
Using a center-to-center spacing of 2.0 in. (50.8 mm) andallowing 1.5 in. (38.1 mm) of clear cover concrete to thefirst layer of bars, the reinforcement can be placed within8.0 in. (203 mm) from the edges of the opening. The barsshould be extended a sufficient distance past the openingcorners with adequate length for the development of thesteel strength.
Design of Upper Story Panels
As described earlier, the reinforcement ratio of p,, = 0.19percent for the base panel is also used in the upper storypanels. Since the height of the horizontal chord, h, in theupper story panels is less than the height of the chord in thebase panel, a smaller reinforcement area may be used in theupper story panels as:
A =0.19x 12x44/100= 1.00 sq in. (645 mm2)>Amin = 0.61 sq in. (394mm2)
(OK)
The design of the top (roof) panel for the post-tensioninganchor forces is not addressed in this example.
f,r=(2280+ 172+811)/(2x84x 12)= 1.62 ksi (11.2 MPa)
The stressf is calculated using Eq. (12):
Le (2280 + 172 + 811 —2 x 533)/[(240/2— 61.2)121 — 1.62
= 1.49 ksi (10.3 MPa)
The boundary conditions for a,1 are determined using Eq.(13):
a,i(6l.2) = s2(61.2) 1.49 ksi (10.3 MPa)u’1(61.2) = a(61.2) = (1.62— 1.49)/(240/2—61.2)
= 0.00221
12j2aidx = 533 kips (2370 kN)
These boundary conditions are then used to solve for u1:
—
2 No. 4 bars4 pairs ® 2.0 in.
1.75 in.
L
><--‘Ii
_______
(to barcenter)0I
10=6ft
I I=20fttp 12 in.
lift = 0.30 m, 1 in. = 25.4 mmlFig. Bi. Design example.
January-February 2002 67