daniel margul, dr. sarah richardson burns, jeffrey
TRANSCRIPT

-1-
Cells Cultured on Porous, Fibrous Poly(Lactic-co-Glycolic Acid) Scaffolds:
The Effects of Fiber diameter on Cell Morphology and Viability
Daniel Margul, Dr. Sarah Richardson Burns, Jeffrey Hendricks,
and Dr. David C. Martin
Abstract
There is a growing need for the development of multifunctional, adaptive and biointegrated
prosthetic limbs for individuals who have lost limb function due to trauma, disease or congenital
disorders. Recent studies have focused on developing a new generation of assistive devices that
directly electronically interface with the patient’s nervous system. However, these devices will
not only require the creation of direct interfaces between the device and the nervous system but
will also require formation of an artificial interface between a robotic prosthetic and the bone,
skin, muscle, and connective tissue. Therefore, we will be investigating the possibility of using
nano and micro scale porous, fibrous polymer mats as scaffolds for culturing endothelial cells
toward development of a tissue scaffold that can serve as dermal tissue. The fibrous polymer
films will provide for robust, reliable mechanical integration between the device surface and the
skin of the individual. This novel tissue scaffold should also provide a barrier to bacterial
infection. We generated polymer fibers of systematically increasing diameters (50 nm-8 µm)
using electrospinning techniques that allowed for controlled variations in fibrous mat structure.
Electrospinning involves the application of an electric field to a solution jetted from a syringe tip.
The liquid jet is distorted in the electric field to create polymer nanofibers and microfibers.
Methodically changing the electrospinning parameters, including flow rate, voltage, distance
from the syringe tip to the substrate, and most importantly the solution concentration, allowed us
to create a gradient in the microstructure by changing the fiber diameter from the microscopic
level to the nanoscopic level. By using this process, we created films with controlled gradients
in diameter and porosity and determined the range of possible fiber diameters using optical
microscopy and scanning electron microscopy. In addition, the cell size, shape, and anisotropy
were examined and compared with cells grown on 2 dimensional tissue culture polystyrene
substrates.
1. Introduction
One of the focuses of the Martin Research Group (MRG) at the University of Michigan is
the development of a completely biointegrated, biomimetic prosthetic for the human body. This
device involves several biological/mechanical interactions including those between the device
and the skin, bone, nerves, and various connective tissues. The Martin Research is working on
the skin and nerve interactions with the device. The group’s previous research includes work on
improving the interfaces between electrodes and tissue, developing conductive polymers for
coating electrodes, and studying the topography and morphology of polymers.
Electrospinning is a moderately old technique used to create nano and micro diameter fibers
and particles. Recently, a variety of applications of this technique have developed in the tissue
engineering field with regard to the fabrication of scaffolds. Fibers or particles are created by

-2-
applying a high voltage electric field to a solution in a syringe. The syringe sits inside a pump
that slowly pushes the solution through the needle. At the end of the syringe tip is an electrode
connected to a high voltage source. The electric field produced by the high voltage draws the
solution out into a shape commonly known as a Taylor cone. As the solution moves towards a
substrate, which is connected to a counter-electrode, it forms into fibers and/or particles. The
fibers that a produced are of similar diameter to fibers of the extra cellular matrix (ECM), which
makes mats of these fibers appealing as a tissue engineering scaffold. In addition, a variety of
proteins and chemicals can be added in order to increase biocompatibility or for drug delivery.
Poly(lactic-co-glycolic acid) PLGA is a common polymer to electrospin because it, in its
many varieties, has diverse biodegradability, good mechanical properties, good biocompatibility,
and Food and Drug Administration (FDA) approval for medical devices. In addition to being
biocompatible, electrospun PLGA scaffold mimics the random morphology of the ECM; making
it a very good polymer for the fabrication of tissue engineering scaffolds.
2. Materials and Methods
Sputter coating of cover slips
Plastic cover slips were placed into the vacuum chamber of a sputter coater with an Au/Pd
source. The covers slips were sputtered for approximately five minutes at ten milliamps. This
produced a thin electrically conductive coating on the surface of the cover slips. This coating
allowed the entire surface of the substrate to be charged by the counter electrode of the
electrospinning system.
Electrospinning
We used electrospun fibers using a KD Scientific Syringe pump KDS 100. BD 3ml syringes
were attached to EFD Precision stainless steel 15 gauge tips. The syringe was placed into the
pump and an electrode from a Hipotronics HV DC power supply. The powers supply produced
up to 12 kV at .1 mA. The solution was jetted to the sputtered cover slips.
Scanning Electron Microscopy
We imaged the surface and cross sections of the fibers in order to visualize the surface
morphology and internal 3-dimensional structure of the electrospun fibrous mats. Images were
obtained using a FEI Nova NanoLab Dualbeam FIB and Scanning Electron Microscope (SEM).
Prior to imaging, a thin film of gold was sputtered onto the surface of the fibers in order to make
them electrically conductive to dissipate charge. Photographs of fibers were taken at 500X,
1500X, 2500X, and 3500X.

-3-
Optical Microscopy
We imaged the surface of the fibers in order to characterize the surface morphology and
structure of electrospun fibrous mats. Images were taken using a Nikon Optiphot POL with a
Spot RT digital camera.
Phase Contrast/Fluorescent Microscopy
We imaged the cells on the fibers using phase contrast/fluorescence microscopy. We used a
Nikon T2000 inverted light/fluorescence microscope with HG arc lamp, Hamamatsu CCD 16 bit
camera with Simple PCI imaging software (courtesy of Takayama Lab). We also used an
upright Olympus BX-51 with HG arc lamp, Olympus CCD camera, and Olympus imaging
software (University of Michigan Microscopy and Image Analysis Core Laboratory, MIL).
Cells
SH-SY5Y neuroblastoma-derived cells, GFP transfected epithelial cancer cells, and 3T3
fibroblasts were maintained in Dulbecco’s Modified-Eagle’s Media (DMEM with glucose, with
L-glutamine; Gibco/Invitrogen, Carlsbad, CA), Penn-Strep mixed antibiotic solution (dilute
1:100 in cell media; Gibco/Invitrogen) and 10% fetal bovine serum (FBS; Gibco/Invitrogen).
3. Results
3.1 Characterization the effects of changing electrospinning parameters
For this experiment, we used solutions made of 75:25 Poly(lactic-co-glycolic acid) in
Chloroform and 75:25 PLGA in Dichloromethane. We systematically altered the electrospinning
parameters one at a time in order to have a series of charts that characterize the results of
changing any single parameter. The parameters that were tested include voltage, solution
concentration, distance from the syringe tip to the substrate, flow rate, and syringe tip size.
By sequentially altering one parameter at a time, we were able to characterize the effect each
electrospinning parameter has on the fibers/beads that are created. We imaged each sample
using a Nikon Optiphot POL microscope and a SPOT RT digital camera, and we measured fiber
and bead diameter using Diagnostic Instrument’s SPOT software. We also described and looked
for trends in morphology.
Experiment 1: Vary Distance
Solution: PLGA (75/25) 15 % (w/v) in Chloroform
Conditions: Flow rate: .35mL/hr, Voltage: 10kV
Distance (cm) Description Fiber Width Trends
7 blobs 40 µm
9 thick fibers 7-8 µm fiber number of
11 medium fibers 5 µm thickness fibers
13 thinner fibers 4 µm
15 fibers: thin, few 3-5 µm

-4-
We characterized the effects of varying the distance between the syringe tip and substrate.
We varied the distance from 7-15 cm with intervals of 2 centimeters. As a general trend, the
further away the substrate and syringe tip were, the thinner the fibers were. And it appeared that
the distance can be no less than 8-9 cm, because at short distances the solution does not have
enough time to dry before hitting the substrate. Also, as the substrate gets further away, less
fiber hit it, meaning that longer spinning times are necessary. Beads normally did not appear in
these samples.
Experiment 2: Vary Flow Rate
Solution: PLGA (75/25) 15 % (w/v) in Chloroform
Conditions: Distance: 11 cm, Voltage: 10kV
Flow Rate (mL/hr) Description Fiber Width Trends
0.75 thick fibers, some beads 5-8 µm
0.65 thick fibers, few beads 4-5 µm
0.55 thinner fibers, very few beads 3-5 µm fiber number of number of
0.45 thinner fibers no beads 3-4 µm thickness fibers beads
0.35 thinner fibers 2-3 µm
0.25 thinner fibers (swirls) 2 µm
0.2 thinnest fibers (swirls) 2 µm
In this experiment, we characterized the effects of varying the flow rate of the solution out
of the syringe. We varied the flow rate from .2-.75 mL/hr. General trends that were noticed
included fiber thickness increases as the flow rate increases, the number of fibers that accumulate
on the substrate increase as flow rate increases, and the number of beads that appear increase as
flow rate increases. The morphologies that we saw ranged from beads on a string at higher flow
rates to thin fibers at the lower flow rates. We also noticed a swirl morphology at very low flow
rates, which is appears in several forms that look like ribbons, like overlapping connected circles,
or like a sinusoidal curve.
Experiment 3: Vary Voltage
Solution: PLGA (75/25) 15 % (w/v) in Chloroform
Conditions: Distance: 11 cm, Flow Rate: .45 mL/hr
Voltage (kV) Description Fiber Width Trends
≤ 6 few fibers develop NA
7 thin fibers 1-2 µm
8 slightly thicker fibers 2-6 µm fiber number of
9 slightly thicker fibers 3-6 µm thickness fibers
10 thicker fibers 6-7 µm
11 thick fibers (unstable cone) 3-7 µm

-5-
In this experiment, we varied the voltage from the high voltage power supply. The voltages
tested ranged from 6 to 11 kV at intervals of 1 kV. The most important trends were that fiber
thickness increased as voltage increased, and higher voltages are associated with faster fiber
accumulation. Also at voltage of 6 kV or less, few fibers appeared and a Taylor cone barely
appeared at the end of the syringe. At voltages above 10 kV, the Taylor cone was very unstable,
sometimes splitting into two cones.
After testing these three parameters (distance, flow rate, and voltage) with PLGA in
chloroform, we tested them again using Dichloromethane, and the same general trends were
observed.
Experiment 4: Vary Solution Concentration
Solution: PLGA (75/25) in Chloroform
Conditions: Distance: 11 cm, Flow Rate: .45 mL/ hr, Voltage: 10 kV,
Temperature 22˚ C, Humidity 28%
Concentration (% w/v) Description Fiber Width Bead Width Trends
7.5 blobs NA 12-120 µm
15 beads on a string 1 µm 10-20 µm Number of Fiber
30 only fibers 2-5 µm NA Beads Thickness
40 thick fibers 6-14 µm NA
In this experiment, we created four different solutions with different concentrations of
PLGA dissolved in the chloroform. The most significant trends were that the number of beads
and particles decreased as concentration increased and that fiber thickness increased as
concentration increases. In addition, when the concentration gets below 8 or 9 % (w/v), blobs
start to appear. Fibers begin to form once the concentration is greater than 12 % (w/v); however,
these fibers exhibit the beads on a string morphology. Once the concentration is above 20%,
only fibers appear.
Experiment 5: Vary syringe tip size
Solution: PLGA (75/25) 15 % (w/v) in Chloroform
Conditions: Distance: 11 cm, Flow Rate: .45mL/hr, Voltage 10kV
Tip Gauge Description Fiber Width Trends
15 Beads on a string <1 µm Fiber Number
23 More beads on a string <1 µm Width of beads
30 Most beads on a string <2 µm
In this experiment, we jetted three identical solutions with different syringe tips. We used
15, 23 and 30 gauge tips. Larger tip sizes (smaller gauges) create thinner fibers with fewer
beads, while smaller tip sizes (larger gauges) produce thicker fibers with more beads.

-6-
Experiment 6: Cold Solution vs. Heated/Homogenized solution
Solution: PLGA (75/25) 15 % (w/v) in Chloroform
Conditions: Distance: 11cm, Flow Rate: .77mL/hr, Voltage: 10kV
In this experiment, we spun samples from the same solution before and after
heating/homogenization. As expected, the fibers made from the solution that came out of the
refrigerator had a variable thickness, which is most probably due to the lack of homogeneity of
the solution. The warmer solution that was homogenized produced thin fibers with the beads on
a string morphology. We are unsure about the effects of temperature at this point, and question
will be investigated in the future.
After completing the above analysis, we came to the conclusion that even if all the
parameters mentioned above are held constant, there will be variance in data from day to day.
We discovered that the cause of this is humidity, which can have a large effect on morphology,
fiber size, and bead size. Although we have not quantitatively measured the effects of humidity,
we noticed that when the humidity is over 60% in the lab, it is difficult to get thin fiber or small
particles. Since the vapor pressure is higher when humidity is high, the solvent in the solution
cannot evaporate as easily, which causes samples created on different days to have different
morphologies, fiber diameters, and particle diameters. Generally speaking, lower humidity is
ideal for creating fibers with diameters in the nanometer range.
3.2 Using Dyes and creating layered mats
In this experiment, we used solutions of 20% 75:25 Poly(lactic-co-glycolic acid) in
Chloroform mixed with various dyes. Dyes tested include red food coloring, blue food coloring,
green food coloring, Trypan blue, Multiple Stain, and Nuclear Fast Red.
The first part of this experiment involved testing the dyes to see if they went into solution
and seeing how visible they made the fibers under light microscopy. We also tested different
concentrations of dye in order to find what concentration was necessary to make the dye visible
to the naked eye and under the microscope.
Dye Result
Red Food Coloring Visible
Blue Food Coloring Visible
Green Food Coloring Visible
Trypan Blue Cannot see dye
Multiple Stain Visible, many particles form
Nuclear Fast Red visible, large particles form
Solution Description
Heated/Homogenized solution (60°C) Fibers with few beads
Refrigerated Solution (~10°C) Large beads on a string, variable thickness

-7-
We concluded that blue, red, and green food dyes work the best as they are all visible and
only did not cause notable changes in the samples’ morphologies. Nuclear Fast Red and
Multiple Stain both visibly colored the fibers, but they caused changes in morphology. Finally,
Trypan blue did not successfully dye the sample. We also came to the conclusion that 5 drops of
food dye per every 2 mL of PLGA solution was the best amount of dye.
The second part of this experiment involved using the dyes to visually represent layered
mats. First, we jetted a mat from a solution that was dyed with red food coloring. We
electrospun the solution until the mat was thick enough that the substrate could not be seen
through the mat. Then we jetted a second solution containing a blue food coloring on top of the
red fibers until we could only see the blue fibers. This was to prove that it is possible to layer
mats on top of each other. Applications of this could involve a vertical gradient of fiber
diameter, putting a certain chemical in only part of the mat, or even layer particles and fibers.
Red Fibers (Bottom Layer of Mat) Blue Fibers (Top Layer of Mat)
Vertical cross section of the layer of blue fibers
on top of the layer of red fibers

-8-
3.3 Masking substrates in order to create patterned mats
For this experiment, we used solutions of 20% 75:25 Poly(lactic-co-glycolic
acid) in Chloroform mixed with red and blue food coloring. The concentration
of food coloring was 5 drops/ 2 mL of solution.
This experiment involved developing a method to create a mat with a pattern. Specifically,
we wanted a design that had to concentric squares. The outer one would have one color of
fibers, while the fibers of the inner square would be another color (Figure 3.3a). The difficult
part of this experiment, was finding a way to prevent random fibers from going to one area,
while encouraging the fibers to go to specific areas on the substrate. We discovered that this
could be done by using a cover slip with a square hole in the center to mask the substrate (Figure
3.3b). While using the outer mask, we jetted the fibers for the middle of the pattern, and, by
using the square cut out from the coverslip as a second mask (Figure 3.3c), we surrounded the
middle square with fibers of another color. The use of masks prevents layering of fibers, but can
prevent the different layers from overlapping at their boundaries
Figure 3.3a
Figure 3.3b: Figure 3.3c:
Outer Mask Inner Mask
Figure 3.3d Figure 3.3e

-9-
As seen in Figure 3.3d and 3.3e, the different layers do not always overlap at the edges. The
reason for this can be explained in Figure 3.3f. In this figure, the mask is lying on top of the
substrate. There is an area near where the edge of the
mask meets the substrate where fibers do not want to
go. Since the height is not uniform between the mask
and the substrate, a shadow area develops where the
fibers do not appear. We found that by moving the
cover slip mask about a millimeter further away from
where we were spinning fibers allowed the fibers
from different sections to overlap. We did this while
creating the fibrous mat in Figure 3.3e, where there is
some overlap between the two fibrous mats.
3.4 Establishing a horizontal gradient in fiber diameter
This experiment was the final product of the masking experiments and previous experiments
involving variation of electrospinning parameters. Again we used 75:25 Poly(lactic-co-glycolic
acid) in chloroform, but this time we used three concentrations: 35 % (w/v), 25 % (w/v), and
17.5 % (w/v). The other parameters follow in Figure 3.4a.
Concentration 17.5 % (w/v) 25 % (w/v) 35 % (w/v)
Voltage 9 kV 10 kV 12 kV
Flow Rate .45 mL/hr .55 mL/hr .65 mL/hr
Distance 13 cm 11 cm 9 cm
Figure 3.4a
In order to create the gradient, we electrospun these three solutions onto different areas of
the cover slip. In order to prevent each new layer of fibers from covering up the others, we
applied the masking techniques explained in section. For the first mat, which was made with the
35 % (w/v) solution, we covered up the right 2/3 of the substrate with a cover slip. Once this
section was completed, the right and left 1/3 of the substrate were masked with cover slips, and
we electrospun the 25 % (w/v) solution into the middle section. Finally, we covered the left 2/3
of the substrate and electrospun the 17.5% (w/v) solution. This created a gradient across the mat
that went from thick fibers on the left side to thinner fibers on the right side.
In Figure 3.4b, we measured the fiber diameters of
many fibers inside the mats we created with the
gradient. We then calculated an approximate µ ± 2σ
for each solution. Since electrospun fibers are created
randomly, the mean and standard deviation are
approximations that will vary from sample to sample.
In addition, there are many outliers.
Mask
Fibers
Shadow Area
without fibers
Solution Fiber Diameter (µ ± 2σ)
35 % (w/v) 4.5 ± 2 µm
25 % (w/v) 2.25 ± 1.5 µm
17.5 % (w/v) 1.5 ± 1.5 µm
Figure 3.4b
Figure 3.3f

-10-
3.5 Analyzing the growth of epithelial cells across the gradient
In this experiment, we took the samples created in the previous experiment and grew three
types of epithelial cells on the surface: SY5Y neuroblastoma-derived cells, 3T3 Fibroblasts, and
GFP transfected epithelial cancer cells. We cultured epithelial cells on the mats that have a
horizontal gradient in fiber diameter (section 3.4). We then imaged the results using fluorescent
microscopy in order to examine the cell size, shape, and anisotropy.
500x 1500X 3500X
Figure 3.4c SEM images of fibers
35 % (w/v)
25 % (w/v)
17.5 % (w/v)
Control Small Fibers Medium Fibers Large Fibers
Figure 3.5a: SY5Y neuroblastoma-derived cells

-11-
The SY5Y cells seem to prefer the medium and thick fibers, as more Actin is present in the
cells that were cultured on the thicker fibers, which means that the cells adhere better the fibers
with larger diameter fibers.
The shape of the 3T3 cells grown on the smaller fibers look more like those in the control;
however, as they are fibroblasts, the function of these cells involves changing their shape in
order to fit into their environment. This means that the cells on the larger fibers developed more
like they would in living tissue.
The GFP transfected epithelial cancer cells seem to prefer the thick fibers as well; there is
more Actin present in the fibers that were cultured on the thicker fibers, which means that the
cells spread out more and adhere better to the fibers with larger diameters.
3.6 Fibers spun simultaneously with particles
In the pursuit of creating a more porous scaffold that cells might prefer over a plain fibrous
scaffold, we worked to electrospin fibers and particles simultaneously. We predicted that we
could get the particles to stack up on each other, creating an uneven surface for the fibers to rest
on. By using two syringes, we were able to spin 10 % (w/v) and 20 % (w/v) solutions at the
same time using one pump and only one voltage source. The positive electrode was connected to
both syringe tips by using a piece of copper wire. (Figure 3.6a)
Control Small Fibers Medium Fibers Large Fibers
Figure 3.5b: 3T3 Fibroblasts
Control Small Fibers Medium Fibers Large Fibers
Figure 3.5c: GFP transfected epithelial cancer cells

-12-
In order to visualize the results, we electrospun clear PLGA fiber simultaneously with blue
particles. As seen in images Figure 3.6b and Figure 3.6c, the fibers and particles were
successfully electrospun together.
We also took SEM mages of mats made of just fibers from the 20% solution in order to
compare the general morphological differences between fibers and fibers electrospun with
particles. In image ZRZ on the left, we only electrospun fibers, and the general structure is
fibrous and flat. In image ZQy on the right, we electrospun the fibers and particles
simultaneously, and the surface is more porous and has much more three dimensional structure.
Figure 3.6a: Electrospinning using
two syringes to simultaneously create
fibers and particles
Figure 3.6b: Clear fibers and blue particles Figure 3.6c: Vertical cross section

-13-
In addition, Figures 3.6d and 3.6e are SEM images that show examples of the large pours
that formed inside these mats. Figure 3.6f was taken at a 55° angle and Figure 3.6g is a vertical
cross section of the mat; this allowed us to see into the mat in order to verify that these mats were
as porous as we predicted.
Figure 3.6d: PLGA fibers under SEM Figure 3.6e: PLGA fibers and particles under SEM
Figure 3.6f: image at a 55° angle Figure 3.6g: vertical cross section
-14-
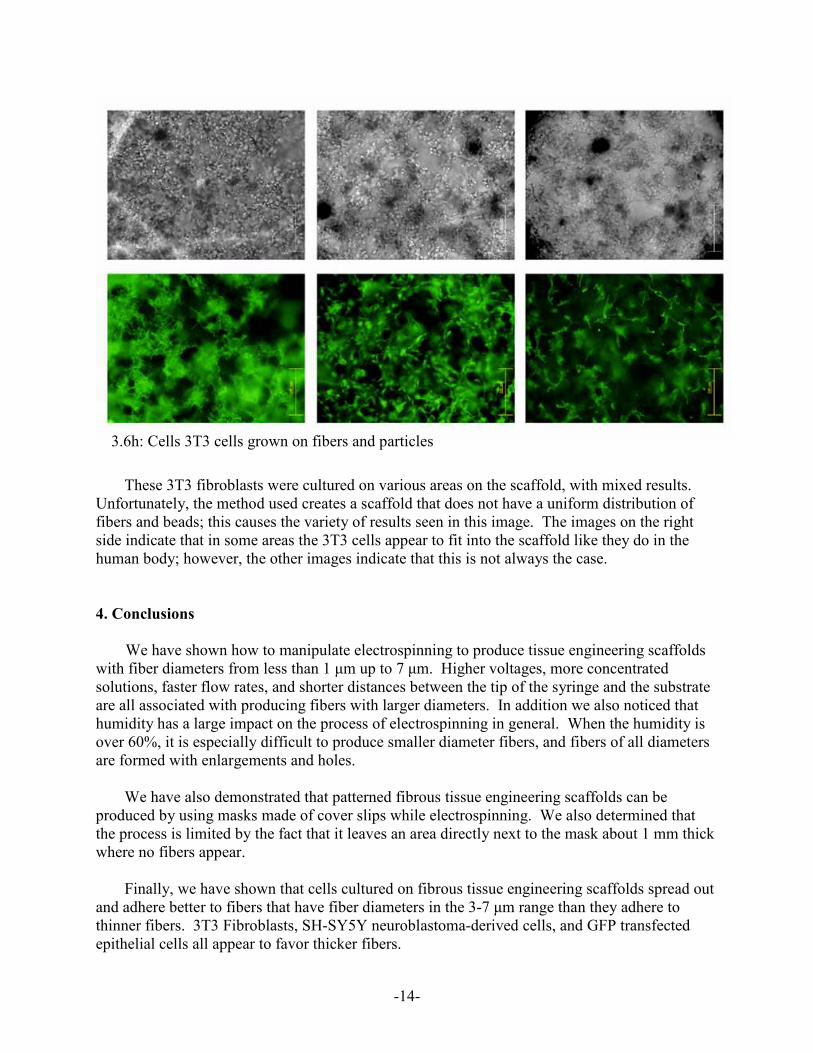
These 3T3 fibroblasts were cultured on various areas on the scaffold, with mixed results.
Unfortunately, the method used creates a scaffold that does not have a uniform distribution of
fibers and beads; this causes the variety of results seen in this image. The images on the right
side indicate that in some areas the 3T3 cells appear to fit into the scaffold like they do in the
human body; however, the other images indicate that this is not always the case.
4. Conclusions
We have shown how to manipulate electrospinning to produce tissue engineering scaffolds
with fiber diameters from less than 1 µm up to 7 µm. Higher voltages, more concentrated
solutions, faster flow rates, and shorter distances between the tip of the syringe and the substrate
are all associated with producing fibers with larger diameters. In addition we also noticed that
humidity has a large impact on the process of electrospinning in general. When the humidity is
over 60%, it is especially difficult to produce smaller diameter fibers, and fibers of all diameters
are formed with enlargements and holes.
We have also demonstrated that patterned fibrous tissue engineering scaffolds can be
produced by using masks made of cover slips while electrospinning. We also determined that
the process is limited by the fact that it leaves an area directly next to the mask about 1 mm thick
where no fibers appear.
Finally, we have shown that cells cultured on fibrous tissue engineering scaffolds spread out
and adhere better to fibers that have fiber diameters in the 3-7 µm range than they adhere to
thinner fibers. 3T3 Fibroblasts, SH-SY5Y neuroblastoma-derived cells, and GFP transfected
epithelial cells all appear to favor thicker fibers.
3.6h: Cells 3T3 cells grown on fibers and particles

-15-
The results from culturing cells on a tissue engineering scaffold consisting of fibers and
particles were inconclusive. The morphology of the scaffold was too varied to determine how
cell growth is effected. More experimentation would be necessary in order to make a more
uniform surface in order to draw any conclusions.
5. Future Directions
The fiber diameter experiment should be conducted again in order to verify the results. It
may also be useful to use fibers that contain a fluorescent protein or polymer in order to better
visualize the results. The method for creating scaffolds consisting of fibers and particles needs to
be more thoroughly developed before any conclusions may be drawn.
6. Acknowledgements
This project was funded by General Electric, Motorola, and the University of Michigan
Undergraduate Research Opportunities program as part of the 2006 Engineering & Physical
Sciences Fellowship. In addition, the project was also supported by the NIH, NSF, University of
Michigan College of Engineering. In addition, the support of Armo MURI on Bio-Integrated
Structural and Neural Prosthetic Materials is also appreciated. The author would also like to
thank Dr. Mohammad Reza Abidian for his guidance and support.
References
[1] Bini, T. B.; Gao, Shujun; Tan, Ter Chyan; Wang, Shu; Lim, Aymeric; Hai, Lim Ben;
Ramakrishna, S. “Electrospun poly(L-lactide-co-glycolide) Biodegradable Polymer Nanofiber
Tubes for Peripheral Nerve Regeneration” NanoTechnology 2004; 1459-64.
[2] Czaplewski, David; Kameoka, Jun; Craighead, H. G. “Nonlithographic Approach to
Nanostructure Fabrication Using a Scanned Electrospinning Source.” Journal of Vacuum
Science & Technology B: Microelectronics and Nanometer Structures Nov. 2003; Volume 21,
Issue 6, pp. 2994-7.
[3] Hill, Elliott; Boontheekul, Tanyarut; Mooney, David J. “Designing Scaffolds to Enhance
Transplanted Myoblast Survival and Migration.” Tissue Engineering, 2006, volume 12, number
5.
[4] Kim, Taek Gyoung; Park, Tae Gwan. “Biomimicking Extracelluar Matrix: Cell Adhesive
RGD Peptide Modified Electrospun poly(D,L-lactic-co-glycolic acid) Nanofiber Mesh” Tissue
Engineering 2006; Volume 12, Number 2.
[5] Li Wan-Ju; Cooper, James A. Jr.; Mauck, Robert L.; Tuan, Rocky S. “Fabrication and
Characterization of Six Electrospun Poly(α-hydroxy ester)- based Scaffolds for Tissue
Engineering Applications.” Acta Biomaterialia 2006; 377-85.

-16-
[6] Moroni, Lorenzo; Licht, Ruud; de Boer, Jan; de Wijn, Joost R.; van Blitterswijk, Clemens
A. “Fiber Diameter and Texture of Electrospun PEOT/PBT Scaffolds Influence Human
Mesenchymal Stem Cell Proliferation and Morphology, and the Release of Incorporated
Compounds.” Biomaterials 2006; 4911-22.
[7] Murugan, Ramalingam; Ramakrishna, Seeram. “Nano-Featured Scaffolds for Tissue
Engineering: A Review of Spinning Methodologies.” Tissue Engineering 2006; volume 12,
number 3.
[8] Telemeco, T. A.; Ayres, C.; Bowlin, G. L.; Wnek, G. E.; Boland, E. D.; Cohen, N.;
Baumgarten, C. M.; Mathews, J.; Simpson, D. G. “Regulation of Cellular Infiltration into Tissue
Engineering Scaffolds Composed of Submicron Diameter Fibrils Produced by Electrospinning.”
Acta Biomateriala 2005, 377-85.
[9] Tuzlakoglu, K; Bolgen, N.; Salgado, A. J.; Gomes, M. E.; Piskin, E.; Reis, R. L. “Nano- and
Micro-Fiber Combined Scaffolds: A New Architecture for Bone Tissue Engineering” Journal of
Materials Science: Materials in Medicine 2005; 1099-1104.