dangerous discrepancies: missing weapons plutonium in … · dangerous discrepancies: missing...
TRANSCRIPT

Dangerous Discrepancies: Missing Weapons Plutonium in Los Alamos National
Laboratory Waste Accounts
Arjun Makhijani, Ph.D. Brice Smith, Ph.D.
November 29, 2005 Reissued with Corrections April 21, 2006
Takoma Park, Maryland

Dangerous Discrepancies
2
Errors were corrected and parts of the analysis were redone in April 2006, when this report was re-issued.

Dangerous Discrepancies
3
Acknowledgements We would like to thank the staff of Concerned Citizens for Nuclear Safety, of Santa Fe, especially Joni Arends, Executive Director, and Sadaf Cameron, Public Education and Outreach Director, for their help in identifying areas that we have studied in this report, supplying documents, and making the arrangements for the release of the report. Other friends in New Mexico have also been a great help. Jay Coghlan, of Executive Director Nuclear Watch of New Mexico, helped frame the study and reviewed a draft of the report before reissue in April 2006. Don Hancock, director of the Nuclear Waste Safety program and administrator at Southwest Research and Information Center in Albuquerque, as always, was able to provide us with some hard to locate information. Cathie Sullivan dug up documents and references for IEER. This study was undertaken as part of a Citizens' Monitoring and Technical Assessment Fund Grant Agreement MTA-05-010, administered by RESOLVE, Inc. We have greatly benefited from the support of Louise Gant, Manager of the MTA Fund at RESOLVE and Brad Lewis, the Chief Financial Officer. It is one of two case studies on remediation and long-term stewardship that IEER is preparing under this grant. The other case study relates the uranium processing plant near Fernald, Ohio which has now been decommissioned. We would like to that Annie Makhijani, IEER Project Scientist, who checked many of the calculations, and Lois Chalmers who helped with the bibliographic research and the references. As always, we, as the authors, remain solely responsible for the contents of this report, its conclusions and recommendations, and any omissions or errors. As it happens there was an error in the analysis of plutonium accounts issued on November 29, 2005. The mistake was pointed out to us by someone whom we know only by an e-mail address and first name. We are very grateful for the message, which enabled us not only to correct the error but also to catch a few other problems and to do a more complete analysis. The errors turned out to be minor in their impact on the actual results; therefore, the main findings of the report are essentially unchanged from the original November version. This revised report is not an update. Correspondence about this report subsequent to its release on November 29, 2005, with officials at Los Alamos, the Department of Energy, including its National Nuclear Security Administration, and the Defense Nuclear Facilities Safety Board is posted on IEER’s website, www.ieer.org. Updates will be provided on that website and/or in printed matter. Arjun Makhijani Brice Smith Takoma Park, Maryland November 29, 2005 Revision April 21, 2006

Dangerous Discrepancies
4
This page is intentionally blank

Dangerous Discrepancies
5
Section One: Summary and Conclusions Main findings 1. There are major discrepancies in the materials accounts for weapons plutonium in Los Alamos Waste. An analysis of official data indicates that the unaccounted for plutonium amounts to about 300 kilograms.1 This estimate takes into account all sources of data for plutonium discharged into waste streams (stored, shallow burial, soil, intermediate depth) as well as the hydronuclear tests that were conducted at the Los Alamos site in 1960-61. Plutonium accounting data in the safeguards account (the Nuclear Materials Management and Safeguards System (NMMSS)) show that discharges from processing areas to waste were particularly high in the 1980s. We have not been able to discover the reason for these high losses to the waste but have provided some indications of possible explanations. 2. If much or most of the unaccounted for plutonium was disposed of as buried low-level waste and buried transuranic waste on site at Los Alamos, the long term radiation doses would far exceed any allowable limits. Remediation would be necessary but would be very complex due to the unknown disposal patterns. Further, in that case the NMMSS plutonium account would be wrong, since it shows less than 50 kilograms of waste before 1980, the period that accounts for almost all the documented buried waste containing significant amounts of plutonium. 3. It is possible that significantly more plutonium is going to the Waste Isolation Pilot Plant (WIPP) than indicated by DOE documentation. If so, this has major implications for the oversight of the operations of WIPP. The IEER review of waste characterization documents prepared for the New Mexico Attorney General’s Office in 1998 indicated many areas of missing and incomplete waste documentation. If the NMMSS account is deemed as correct in the annual reported totals of plutonium in waste, the possibility that WIPP accounts are incorrect appears to be significant. Over 90 percent of 610 kilograms of plutonium in waste in NMMSS is attributed to the 1980s and 1990s. 4. Even if only a part of the unaccounted for plutonium is actually missing, this would have major security implications. As a reference point, North Korea’s entire stock of plutonium is only about 15 percent of our estimate for the plutonium unaccounted for at LANL.
1 Weights of plutonium in this report refer to the sum of plutonium-239 and plutonium-240, unless otherwise specified.

Dangerous Discrepancies
6
Recommendations An urgent, independent investigation of the problem of discrepancies in LANL accounts of plutonium in waste is necessary to address the findings of this report and to resolve the uncertainties. Closer oversight of the characterization of the weapons plutonium content of containers being sent to WIPP is essential and urgent. Since waste containers cannot be practically checked once they are disposed of, more certain characterization and an investigation into the state of the accuracy and completeness of WIPP documentation is essential for environmental as well as security reasons. Section Two: Plutonium in Waste by the Numbers In 1996, the DOE published a historical report on weapons plutonium, often called the “50 Years Report” because it contained data on the first fifty years of plutonium production in the United States.2 The report contained data on plutonium production history as well as details on the inventories of plutonium at various DOE sites around the country. As part of the preparation of this historic document, which was part of the Openness Initiative of then-Energy Secretary Hazel O’Leary, the DOE also made an effort to assess how much plutonium was contained in waste generated in the course of producing and processing plutonium since the inception of the nuclear weapons complex during the Manhattan Project. Since the report was essentially a materials inventory of weapons plutonium, the inclusion of amounts of plutonium discharged in waste was a normal part of the way in which nuclear materials are accounted for in the weapons complex. However, in the course of compiling the data, the DOE found that the plutonium inventories in waste that were part of the materials accounting documentation at DOE Headquarters, which were used to prepare the Fifty Years Report, did not match the plutonium inventories in waste generated by DOE Operations Offices or the Sites that were used to compile waste data. The discrepancies were surprisingly large in some cases, with Los Alamos having the largest discrepancy by far. The size of the discrepancies led to an internal memorandum, prepared for the Secretary of Energy, that detailed the discrepancies between the two accounts.3 That memorandum is reproduced in Appendix A. Moreover, neither of these accounts appear to match other data that is available – notably the data that are part of the formal process of sending wastes to the Waste Isolation Pilot Plant (WIPP – the deep geologic repository to which retrievably stored transuranic wastes are being sent for disposal) and data that the DOE has collected on plutonium in other
2 DOE 1996. Unless otherwise specified, the reference to “plutonium” in this chapter is to the mix of plutonium isotopes in weapons plutonium in the DOE complex that is dominated by plutonium-239 and plutonium-240 in terms of weight. The mass quantities given, therefore, should be interpreted as Pu-239/Pu-240, unless otherwise specified. 3 Guimond and Beckner 1996

Dangerous Discrepancies
7
types of wastes. WIPP was licensed to receive waste under a long and costly process overseen by the U.S. Environmental Protection Agency, with advisory scientific reports being prepared by various bodies, including the National Research Council. IEER has undertaken this detailed analysis of plutonium in waste at Los Alamos because (i) the discrepancies in the data have immense implications for environmental management, long-term stewardship and monitoring of the site, the operation and closure of WIPP, and security of weapons usable nuclear materials, and (ii) so far as public evidence indicates, the DOE has utterly failed to perform the needed follow-up. The data from that memorandum pertaining to Los Alamos and the two other sites where the waste from plutonium pit manufacture was stored and/or dumped, Rocky Flats and Idaho National Laboratory,4 are summarized in Table 1 below. Table 1: Discrepancies in data on plutonium in waste at Los Alamos
Site 50 years report (Note 4) IDB report IDB report IDB report IDB report
kg total kg kg in HLW kg retrievable (WIPP)
kg in buried waste
LANL 610.00 1,375.30 1,323.70 51.60 Source: Guimond and Beckner 1996, Attachment B and for last three columns Attachment C. Notes: 1. The values are reported to two decimal places in Guimond and Beckner 1996. 2. Data are as of September 1994. 3. IDB stands for “Integrated Database” 4. The 50 Years Report states that plutonium data are for plutonium-239 alone (p. 79). However, the production charts may be for total plutonium content. Table 1 shows that there are two sets of plutonium accounts so far as estimates of the amounts that have been discharged to the waste are concerned. Los Alamos has by far the largest discrepancy between these accounts, amounting to about 765 kilograms (we ignore the false accuracy of the DOE reporting of the data to the nearest 0.01 kilograms), which is enough to make more than 150 nuclear bombs.5 IEER has pointed to these discrepancies for many years, beginning with its 1997 report on environmental remediation in the nuclear weapons complex.6 IEER also called attention to the problem during the independent audit of Los Alamos compliance (or lack thereof) with the Clean Air Act.7 Finally, IEER initiated a letter, co-signed by two New Mexico groups, to LANL director Peter Nanos calling his attention to the environmental and security aspects of the discrepancies and asking for an investigation to
4 It is now called Idaho National Laboratory (INL). It was originally Idaho National Engineering Laboratory (INEL) and then Idaho National Engineering and Environmental Laboratory (INEEL). For convenience, we will use INL in this report, regardless of the period. 5 Unless otherwise specified, we will consider that a bomb can be made of 5 kg. of weapons grade plutonium. It can be done with somewhat less. For comparison, the Nagasaki bomb had just over 6 kilograms of plutonium in it. 6 Fioravanti and Makhijani 1997. 7 Makhijani and Franke 2000, Makhijani and Franke 2000b, Makhijani and Franke 2002

Dangerous Discrepancies
8
reconcile plutonium accounts and reduce the discrepancies. That letter is reproduced in Appendix B. Since IEER did not obtain a substantive response to any of these efforts, we decided to undertake an analysis of the problem to the extent possible with public data on waste. IEER has compiled the available data on plutonium in waste originating in weapons manufacturing processing. That is, we undertook to develop estimates of how much waste is generated in the course of making plutonium pits, once separated plutonium is available. This is the main kind of plutonium waste that would be expected to be generated at Los Alamos.8 The first observation from Table 1 is that the discrepancy in the LANL plutonium accounts in waste between the 50 Years Report and the Integrated Data Base Report (IDB) is about 765 kilograms. However, this is not a true indication of the discrepancies in the plutonium in LANL waste. This is because it is not clear whether either number (610 kilograms or 1,375 kilograms) is correct. It is possible that neither figure is accurate. Current official waste data, discussed below, indicate that the 1,375 kilogram figure is incorrect. The DOE has acknowledged that the waste data in the IDB, as well as other waste data for buried transuranic waste produced prior to the IEER 1997 report Containing the Cold War Mess, was not founded on a scientific assessment of the problem. This conclusion in IEER’s report regarding buried transuranic waste data was based on a review of reported amounts of buried TRU waste at various sites. The values for Los Alamos shown in that report are reproduced in Figure 1.
Figure 1: Reported volumes and TRU radioactivity in LANL Buried Waste.
Source: Fioravanti and Makhijani 1997. The Environmental Evaluation Group of the State of New Mexico has also reported similar discrepancies in buried TRU waste data. 8 Experiments that had other isotopes predominant in them, notably plutonium-242, have also been done at LANL. This analysis is focused on the discrepancies in weapons plutonium, which consists almost entirely of Pu-239 and Pu-240 (by weight).

Dangerous Discrepancies
9
After IEER’s 1997 report was issued, the DOE initiated a multi-year review of its conclusions, including its findings on waste. As part of that review, the DOE issued a new report on buried TRU waste (DOE 2000). Further, the then-Assistant Secretary of Environmental Management, Carolyn Huntoon, sent a letter in July 2000 to IEER about DOE’s revised waste numbers, which included the following statement:
Your 1997 report indicated that DOE's "Official data on the volume, mass, and radioactivity of buried transuranic waste and transuranic soil are inconsistent and contradictory. There does not appear to be any scientific basis on which data are entered and changed from one year to the next, and one document to the next." The DOE agreed with this criticism and, in response, committed to "undertake a review and update of its information on its inventory of buried TRU wastes as well as the status of remedial decisions proposed or made to date." The DOE further committed to update the information using consistent and documented assumptions. The results from this study have been compiled and analyzed by my staff and are presented in the enclosed main report and data base in fulfillment of the March 1998 commitment.9
Given that the buried TRU waste data were unreliable up to and including 1996, we looked at the revised data on buried TRU waste published by the DOE in response to IEER’s criticisms of waste data, the datasheets that were the basis for the report, as well as the data on retrievably stored TRU waste that is slated to go to the Waste Isolation Pilot Plant, a deep geologic repository in New Mexico. A perspective on the reasonableness of the data on plutonium in waste can be gained from publicly available estimates of how many pits and experimental devices, most of which would be expected to contain plutonium, were made at LANL. The values of plutonium in waste can then be checked for reasonableness by estimating the amount of waste per pit or device at LANL. A point for comparison would be the plutonium in waste associated with pit production at Rocky Flats. The approach requires TRU waste data from three sites:
• LANL, • Rocky Flats, and • Idaho National Laboratory (INL)
Data from the Idaho National Laboratory are needed because the bulk of the plutonium containing waste from Rocky Flats was shipped to INL. Prior to 1970, the TRU waste was shipped from Rocky Flats to INL in cardboard boxes, 55-gallon drums, and wooden boxes and dumped in open pits and trenches. It was all designated as “low-level” waste then. The category “transuranic waste” waste was created after a fire at Rocky Flats in 1969.10 9 Huntoon 2000, emphasis added. 10 Makhijani and Boyd 2001. This report addresses buried waste and water protection issues at INL.

Dangerous Discrepancies
10
Data on retrievably stored waste are better documented at least in terms of volume, since the number of containers is easily identifiable. Extensive waste characterization has been necessary in order to qualify the waste for shipment to WIPP. Hence, WIPP data, sorted by origin of the waste, provide a third point of reference regarding plutonium in waste, with the first two being the 50 Years Report and the revised DOE Integrated Database for buried TRU waste (DOE 1999 and DOE 2000). Table 2 shows data on retrievably stored TRU waste that has been, or is destined to be sent to WIPP for the three sites that are relevant to this study: LANL, Rocky Flats, and INL. The data include all TRU waste slated to be disposed of in WIPP until closure, which is now scheduled for 2030. While the figures include future TRU waste that will be generated to the time of WIPP closure, the vast majority of the waste has already been generated, notably during the production of tens of thousands of pits during the Cold War. Table 2: TRU Waste Slated to Be Disposed of in WIPP for Three Sites.
WIPP Plutonium total CH and RH for Three Sites
Idaho Rocky Flats LANL Idaho
Rocky Flats LANL
Curies Curies Curies kg kg kg Pu-239 57,035 74,000 11,003 909 1,179 175 Pu-240 7,633 17,000 3,700 33 74 16 Pu-241 51,066 180,000 31,000 0.5 1.7 0.3 Pu-242 12 1.7 0.8 3.0 0.4 0.2 Total 115,746 271,002 45,704 945 1,255 192
Source: DOE 2004. Values are reported as decay-corrected to December 31, 2001. Note: CH = contact handled waste and RH = remote handled waste. Almost all the plutonium content of the waste in this table is attributable to contact handled waste. All values are rounded to the nearest kilogram. These amounts do not include wastes already disposed of. See below. In addition to the waste destined for WIPP detailed in Table 2, by September 30, 2002, there was already a total of 2,322 kilograms of plutonium-239/240 that had been emplaced in WIPP from Rocky Flats, INL, Los Alamos, and the Savannah River Site. Of the shipments that had been completed by that time, roughly 98 percent of the waste mass and nearly 94 percent of the waste volume had been sent by Rocky Flats and INL while only about 1.1 percent of the waste mass and 3.5 percent of the volume had been sent by Los Alamos. The WIPP Waste Information System reports that approximately 2,600 curies of TRU activity was shipped from LANL to WIPP prior to September 30, 2002. By combining these data with the isotopic composition for all WIPP emplaced waste given in DOE 2004, we estimate that roughly 10 kilograms of plutonium-239/240 was sent from Los Alamos in these shipments. In addition, we will add approximately 2,290 kilograms of plutonium to the waste accounts of Rocky Flats and INL in order to account for the amount of waste that had already been emplaced in WIPP when the estimates in Table 2 were made.

Dangerous Discrepancies
11
The first noteworthy item is that the total figure for plutonium in retrievably stored waste at LANL is far lower than the corresponding number for plutonium in waste reported in Guimond and Beckner 1996 (1,323.70 kilograms -- see Table 1 above). There has therefore been a drastic reduction, by over 1,000 kilograms – one metric ton – of plutonium in the estimate of plutonium in retrievably stored waste. Similar discrepancies exist for other sites. For this report we have, therefore, used the most recent estimates for the amount of waste emplaced in or destined for WIPP. In addition to retrievably stored waste, there were several other areas that contained plutonium waste, with two of them accounting for significant amounts of plutonium in subsurface areas in Los Alamos. We use the term subsurface disposal to include all categories of disposal at Los Alamos. Only the retrievably stored WIPP wastes are excluded from this rubric. The data on these sources were published in 1999, in detailed datasheets containing revised estimates for all wastes containing transuranic radionuclides, except for the retrievably stored wastes.11 These datasheets were summarized in a report that the DOE issued in June 2000.12 These datasheets include both buried waste and plutonium contaminated soil from hydronuclear testing of devices carried out during the 1958-1961 test moratorium. During 1960 and 1961 a total of 35 such tests were conducted at Los Alamos.13 These consisted essentially of sub-critical or very low-yield tests that were done during the U.S.-Soviet testing moratorium.14 The three main components of the sub-surface plutonium at Los Alamos are as follows:
• Buried waste • Waste discharged at depths greater than 30 meters (intermediate depth waste) • Plutonium dispersed due to tests officially described as hydronuclear tests..
There were other smaller sources of waste, such as laundry discharges, that are also detailed below. The largest component of plutonium in subsurface discharges is that present in waste that was dumped in shallow pits and trenches, defined as those of less than 30 meters’ depth, mainly in the years prior to 1970, but also to some extent after that. Therefore this item deserves detailed discussion, especially as the manner in which the official data are presented is problematic from the point of view of estimating the amount of weapons plutonium (i.e. the sum of Pu-239 and Pu-240). Buried waste The term buried waste in the context of this report (and of the study of plutonium contaminated wastes) refers to wastes buried in trenches and pits at depths of less than 30 meters (about 100 feet). Buried waste is second in quantity of radioactivity only to the retrievably stored waste category. Buried waste at LANL totals about 21,000 curies of alpha-emitting transuranic
11 DOE 1999. 12 DOE 2000. 13 Johnston 2005. 14 Thorn and Westervelt 1987.

Dangerous Discrepancies
12
radionuclides in buried TRU and low-level waste.15 The LANL section of DOE 1999 reports that almost all of this (20,844 curies) was buried at LANL in trenches or pits. The value is not decay-corrected and there are no data on isotopic content of the waste.16 Isotopic composition of plutonium is critical to its accounting because all weapons plutonium consists of a mixture of isotopes, from plutonium-238 to plutonium-242. The major component by weight is plutonium-239 (usually 93 or 94 percent by weight in weapons plutonium), which has a half-life of over 24,000 years. Plutonium-240 comes next in terms of weight at about 5 to 6 percent. While plutonium-241 is only about 0.5 percent by weight in weapons plutonium, it constitutes most of the radioactivity, since it has a short half-life and hence a very high specific activity. The contribution of plutonium-241 to the weight of weapons plutonium is generally well under one percent but its radioactivity contribution as a fraction of the total depends significantly on the age of the plutonium. Hence when plutonium numbers are specified in units of radioactivity (curies), their interpretation in terms of weight of plutonium becomes uncertain in the absence of data regarding age or isotopic composition. This is the case with the DOE data on buried waste at Los Alamos. Table 3 shows how the weight of the components of plutonium varies over time Table 3: Change in weapon-grade plutonium composition with time, by weight
Fresh
Plutonium After 14 years After 28 years
Pu-239 93.00% 93.23% 93.42% Pu-240 6.00% 6.01% 6.01% Pu-241 0.50% 0.26% 0.07% Pu-242 0.50% 0.50% 0.50%
Since Pu-241 decays rapidly (half-life 14.4 years) its contribution to the weight goes down, though it never contributes much to the weight of weapons plutonium. By contrast it remains the main component of the radioactivity of weapons plutonium for many decades, as can be seen in Table 4. Table 4: Radioactivity proportions in weapons plutonium as a function of time
Fresh
Plutonium After 14 years After 28 years
Pu-239 10.24% 17.90% 42.25% Pu-240 2.41% 4.21% 9.92% Pu-241 87.35% 77.89% 47.81% Pu-242 0.003% 0.006% 0.014%
Hence if one only has data on the total radioactivity of plutonium, the error in the estimate of plutonium can be large if one does not know the age of the plutonium. Strangely, DOE 1999
15 DOE 2000, Table 5. 16 DOE 1999, page 43 of the LANL section. This datasheet is reported as being generated on December 17, 1999. The volume of the emplaced waste is reported as being 184,000 m3 and the radioactivity context is reported as being the “initial (emplaced) values.”

Dangerous Discrepancies
13
states that all of the radioactivity can be considered as plutonium-239 because “no [isotopic] inventory data are available.”17 This is undoubtedly an incorrect assumption. As noted above, Pu-241 accounts for only a small portion of the weight of weapon-grade plutonium, however, it generally accounts for a significant portion of the radioactivity. As the Pu-241 activity declines, the activity of americium-241 builds up, since the former decays into the latter, which has a half-life of 432 years. Table 5 shows how much difference the decay-correction makes for buried waste amounting to 21,000 curies of plutonium. If it were fresh weapon grade-plutonium, the estimate of the weight of plutonium would be about 36.3 kilograms; the estimate would be 63.5 kilograms if one assumes plutonium that has decayed for 14 years (just under one half life of Pu-241); it would be 149.9 kilograms if one assumes that it has decayed for 28 years has occurred. Table 5: Estimated Weights of plutonium for an initial 21,000 curies of weapons plutonium mix as a function of time at which the radioactivity is specified
Fresh weapons
plutonium
After 14 years
After 28 years
Pu-239 34.12 59.66 140.85 Pu-240 2.20 3.84 9.06 Pu-241 0.18 0.16 0.10 Pu-242 0.18 0.32 0.76 Total Pu-239 and Pu- 240 36.32 63.50 149.90
Table 5 shows that the estimate of weight if only the radioactivity of the plutonium is known depends greatly on knowledge of the time after production that the radioactivity was measured. If the time is unknown, the uncertainty is considerable due to the short half-life of plutonium-241 relative to the other isotopes of plutonium. The data on buried wastes indicate that the estimate of 21,000 curies is a non-decay corrected estimate – that is it is the amount of radioactivity that was initially buried in the waste pits and trenches. This would not have been fresh weapons plutonium, since weapons plutonium typically consisted of mixes of old and fresh plutonium and plutonium returns likely occurred on a 20 to 25 year time frame given the rate of replacement of old weapon designs with new ones. Hence an assumption of plutonium being somewhere between fresh plutonium and 10 to 15 year old plutonium on average at the time of disposal is a reasonable one. This means that a reasonable estimate or “best” estimate of the amount of weapons plutonium buried in shallow land burial at Los Alamos is about 50 kilograms. This is about the same as the value of 51.6 kilograms in the 1996 DOE memorandum authored by Guimond and Beckner.18 It also corresponds approximately to the total for plutonium in waste in the NMMSS data until the end of the 1970s (see below). 17 DOE 1999, LANL Section, p. 43. 18 Guimond and Beckner 1996, Attachment C.

Dangerous Discrepancies
14
We can get a rough high estimate of the amount of weapons plutonium in Los Alamos buried waste by assuming it had the same isotopic composition as the WIPP waste, the values of which are decay-corrected to 2001. This procedure yields an estimate of about 87 kilograms of plutonium in Los Alamos buried waste. There are a variety of other sources of plutonium in the underground environment at Los Alamos. The main one other than buried waste is the plutonium dispersed underground during hydronuclear testing in the 1958 to 1961 test moratorium period. We have not found any data for the use of weapons plutonium in subsequent sub-critical or hydronuclear tests at Los Alamos. The tests conducted at the Nevada Test Site would, of course, not contribute to sub-surface plutonium at Los Alamos. Table 6 shows the various sources and estimates of subsurface waste at Los Alamos. Table 6: Plutonium in the subsurface environment in Los Alamos – High estimate
Pu-239/240 (kilograms) Comments
TA-21 Material Disposal Area A 0.24 TA-21 Material Disposal Area B 0.10 Uses WIPP Isotopic Ratios TA-50 Material Disposal Area C – Pits 0.39 TA-54 Material Disposal Area G – Pits 86.99 Uses WIPP Isotopic Ratios TA-50 Material Disposal Area C - Shafts 0.24 Uses WIPP Isotopic Ratios TA-54 Material Disposal Area G - Shafts 15.15 Uses WIPP Isotopic Ratios TA-21 Material Disposal Area T - Shafts 1.27 TA-49 Material Disposal Area AB - Hydronuclear Test Shafts 39.19
TA-21 Material Disposal Area T - Adsorption Beds 0.04 Uses WIPP Isotopic Ratios TA-21 Material Disposal Area V - Laundry Adsorption Beds 0.0004 Uses WIPP Isotopic Ratios
Total (high estimate) 143.60
Except for hydronuclear tests, Table 6 gives a high estimate of plutonium in waste, since the WIPP isotopic ratios are assumed for most components. A better estimate of the total plutonium in the Los Alamos subsurface environment, taking into consideration the available information about the time of emplacement of the various components of waste, is about 100 kilograms (of which 50 kilograms is buried waste, 39 is subsurface plutonium dispersed due to hydronuclear tests, and the rest consists of the relatively small categories in the Los Alamos subsurface environment). We will use this value in our analysis unless otherwise specified.

Dangerous Discrepancies
15
Section Three: Los Alamos Plutonium-in-Waste Account Balance As discussed above, the Nuclear Material Management Safeguard System account, which is the master account of plutonium that is maintained to ensure that no significant quantities of plutonium are missing or unaccounted for (other than those attributable to measurement errors) is 610 kilograms. The 50 Years Report states that this value is for plutonium-239 alone:
Two primary reasons for these apparent inconsistencies include: (1) the NMMSS waste data reflect only fissile plutonium inventories (i.e., Pu-239), while other sources include all isotopes of plutonium; and (2) the IDB [Integrated Database] does not differentiate between waste that requires nuclear materials safeguards and, therefore is still recorded as part of the inventory, and waste that has actually been removed from the inventory and physically sent to a waste burial site.19
However, this explanation was a DOE attempt to explain why the waste accounts contained a larger value for plutonium in waste than the NMMSS account. The situation was later reversed when the estimated for stored waste was reduced from over 1,300 kilograms to only about 200 kilograms in the WIPP documentation (see above). Other parts of the 50 Years Report indicate that it is a total for weapon-grade plutonium. For instance, the report notes that Hanford produced 54.5 metric tons of “weapon-grade plutonium.”20 This indicates that the totals may be for all isotopes or for plutonium-239 and plutonium-240, which is one common way in which to report weapon-grade material. Our analysis has interpreted the 610 kilogram number in the NMMSS for Los Alamos as plutonium-239 plus plutonium-240. We have considered the impact of assuming that it is only plutonium-239, for purposes of completeness as discussed below. The impact of considering the NMMSS value as including all other isotopes is small (except for decay correction issues discussed above) and well within the uncertainties in the present analysis. Table 7 and Figure 2 show our estimates of plutonium in waste and the discrepancies between the waste management accounts and the NMMSS account. Table 7: Plutonium-239/240 discrepancies between Los Alamos Waste Accounts and the NMMSS Account Waste Declaration (610 kilograms). All figures have been rounded to the nearest 10 kilograms.
Subsurface total WIPP Total waste
accounts Discrepancy
Total Buried and WIPP Bound Wastes (High estimate) 140 200 340 270
(low estimate) Total Buried and WIPP Bound Wastes (More Realistic) 100 200 300 310
(more realistic)
19 DOE 1996, p. 79. 20 DOE 1996, p. 26.

Dangerous Discrepancies
16
0
50
100
150
200
250
300
350
400
450
500
550
600
650
Plutonium: The First50 Years
Total Buried andWIPP Bound Wastes
(High Estimate)
Total Buried andWIPP Bound Wastes
(More Realistic)
Kilo
gram
s of
Pu-
239/
240
Discrepancy
Waste Destinedfor WIPPSubsurface Total
Figure 2: Plutonium-239/240 discrepancies between Los Alamos Waste accounts and the
NMMSS account waste declaration from the Plutonium 50 Years Report. If we round the numbers to the nearest 10 kilograms, the discrepancy in Los Alamos plutonium accounts is at least 270 kilograms and more likely about 310 kilograms. This assumes that the total in the NMMSS account of 610 kilograms includes plutonium-240. If it does not, then the figure for plutonium-239 plus plutonium-240 in the NMMSS account would be about 650 kilograms, and the discrepancies above would be greater by about 40 kilograms – that is, the would range from about 310 kilograms to about 350 kilograms (rounded to the nearest ten kilograms). Analysis of plutonium discrepancies Table 8 and Figure 3 show the annual discharges of plutonium to waste in the NMMSS account as presented in the 50 Years Plutonium report. The total cumulative plutonium in waste through the end of 1968 is reported as only 4.3 kilograms. It is clear, therefore, that the NMMSS account indicates, among other things, that
• There was very little waste of plutonium in the first twenty years or so of Los Alamos operation.
• Plutonium used in devices made for hydronuclear testing is not included in the NMMSS waste data, since the former amounts to about 40 kilograms in the period 1958 to 1961 alone and the cumulative value of the latter up to 1968 is only 4.3 kilograms. Note that

Dangerous Discrepancies
17
we have included the 40 kilograms of hydronuclear testing plutonium in our estimate of about 100 kilograms of plutonium in subsurface Los Alamos discharges.
Table 8: Normal operating losses of plutonium (in kilograms) at Los Alamos National Laboratory as reported in the Plutonium 50 Years Report.21
Year Annual Losses Cumulative Losses through 1968 4.3 4.3
1969 1.3 5.6 1970 0.3 5.9 1971 0.2 6.1 1972 0.4 6.5 1973 0.7 7.2 1974 5.3 12.5 1975 5.0 17.5 1976 4.6 22.1 1977 4.2 26.3 1978 8.2 34.5 1979 13.1 47.6 1980 20.0 67.6 1981 22.1 89.7 1982 55.1 144.8 1983 69.7 214.5 1984 78.9 293.4 1985 92.4 385.8 1986 84.8 470.6 1987 24.7 495.3 1988 26.9 522.2 1989 28.8 551.0 1990 18.9 569.9 1991 2.0 571.9 1992 4.6 576.5 1993 24.9 601.4 1994 8.6 610.0
21 DOE 1996, p. 57 (Table 9)

Dangerous Discrepancies
18
0
50
100
150
200
250
300
350
400
450
500
550
600
650
1968
1970
1972
1974
1976
1978
1980
1982
1984
1986
1988
1990
1992
1994
Kilo
gram
s of
Plu
toni
um
Annual LossesCumulative Losses
Figure 3. Normal operating losses at Los Alamos National Laboratory as reported in the
Plutonium 50 Years Report, DOE 1996, Table 9, p. 57. If the rapid rise of plutonium in waste in the 1980s reported by the NMMSS account is taken as accurate, then the large annual losses would have been discharged essentially in their entirety to retrievably stored waste. But the WIPP account indicates only about 20 kilograms of plutonium in the waste (decay correction does not make a material difference to the weight quantities). Therefore the clear implication of putting together the data in the 50 Years Report and the WIPP waste data is that if the NMMSS account is correct and if the waste discharge pattern was as described in the 50 Years Report, then the WIPP data are wrong by a large amount. In other words, the wastes designated to be sent to WIPP could contain about 300 kilograms more plutonium than now certified by the DOE. This would put the total of WIPP waste plutonium at about almost 500 kilograms, or about 150 percent larger than the present official estimate of 200 kilograms (total of waste in retrievable storage and disposed of at WIPP). It is possible of course that there is more plutonium in the buried waste at Los Alamos. But the total amount of plutonium logged as buried waste at Los Alamos in the NMMSS account is less than 50 kilograms until the end of the 1970s, when burial of waste containing significant quantities of plutonium was stopped in favor of retrievable storage. This corresponds approximately to the estimate of buried waste we arrived at above and the estimate in the Integrated Database as well. If far more waste was buried at Los Alamos until 1979, it would mean that the amount of plutonium logged in the NMMSS account for that period is wrong by several-fold, and that all other estimates of buried waste plutonium are wrong as well. It would also mean that the rest of the NMMSS annual account of plutonium waste is wrong because the

Dangerous Discrepancies
19
disposal estimates would have to be shifted from the 1980s to the earlier period. This appears to be implausible, but not impossible. One of the following conclusions, or some combination thereof, appears to be a possible explanation for the discrepancy:
• The present estimate of plutonium in WIPP waste is wrong. We note that the earlier estimate in the Integrated Database, cited by Guimond and Beckner, was much larger. This would mean the plutonium processing and conversion to weapons and other devices at Los Alamos in the 1980s was extremely wasteful.
• The NMMSS account is wrong in its temporal distribution of waste amounts and there was much more waste in the earlier period, which was buried on site. This would lead to questions about the integrity of the safeguards system accounting because the grand total is just the sum of the annual amounts, which could no longer be regarded as sound.
• There were classified activities at Los Alamos, especially in the 1980s, for which the plutonium was logged as waste.
• There was diversion of some plutonium that was logged as waste. We do not have enough information to make a more definitive analysis of which of these possibilities is more likely. However, we note that if more plutonium was buried at Los Alamos, then the NMMSS plutonium account is wrong in its allocation of waste to various periods. This would make the cumulative value in that account suspect as well. Comparison with other sites Some perspective can be thrown on the above result (that approximately 300 kilograms of plutonium appears to be unaccounted for at LANL) by examining the waste that one might expect per plutonium pit or device. LANL was not routinely a mass manufacturing site for plutonium pits. That role was played in the nuclear weapons complex by Rocky Flats. Table 9 shows the plutonium in waste at Rocky Flats, Idaho and Los Alamos. The total of plutonium in waste at Rocky Flats and Idaho represents approximately the plutonium in waste created by the production of about 70,000 plutonium pits at Rocky Flats.22 Only about 600 pits were produced at Los Alamos and about 57 experimental devices.23
22 Ackland 1999. 23 Mann and McDonald 2001; Johnston 2005b, Johnston 2005c, Johnston 2005d.

Dangerous Discrepancies
20
Table 9: Total amounts of weapons plutonium (i.e. Pu-239/240) in waste at INL, Rocky Flats, and LANL (including wastes already disposed of at WIPP)
Idaho and
Rocky Flats Idaho and
Rocky Flats LANL, waste
data LANL, waste
data LANL
NMMSS data Curies kg Curies kg kg Total 400,380 5,573 23,150 300 610
Sources: DOE 2004 (see Table 2 above), DOE 1999, DOE 2000 Table 5, and DOE WIPP disposal data. Notes: Idaho and Rocky Flats wastes are considered together for Rocky Flats production since Rocky Flats TRU waste was sent to INL. A small amount, 4 kg, (small in this context) has been added to Rocky Flats waste to account for residual plutonium in the soil based on 100,000 m3 of soil contaminated to 10 nanocuries per gram. As noted above, Los Alamos did hydronuclear testing involving about 40 kilograms of plutonium. However, this does not appear to be part of the 610 kilograms of waste reported in the NMMSS waste account, in which only 4.3 kilograms of cumulative plutonium in waste are logged until 1968. Rather, the plutonium in the devices that were tested at Los Alamos appears to have been logged as part of the production data. This is reasonable, since these devices were not waste but part of LANL’s output of materials at the time they left the production areas. According to the NMMSS account, large increases in the plutonium discharged to waste in Los Alamos occurred mainly in the 1979 to 1990 period, from the time of the Islamic Iranian Revolution to the end of the Cold War. The amounts discharged increased from less than 10 kilograms per year before 1979 to more 13 kilograms in 1979 and much more in the 1980s, when they ranged from a low of 20 kilograms in 1980 to over 92 kilograms in 1985. It is unclear why plutonium discharged to waste took a sudden leap in 1979 and continued a climb to the mid-1980s, after which there was again a sudden drop (but still more than the pre-1979 values, generally). The year 1979 marked the beginning of new weapons programs, major security crises, including the Iranian revolution and the U.S.-Soviet hostilities in Afghanistan (by Islamic fundamentalist proxy for the U.S.), and U.S. decisions to deploy new nuclear weapons in Europe, etc. It is possible that a large scale waste of plutonium occurred in the 1979-1990 period in those years, due to haste in designing new weapons and fabricating prototypes for testing. Further, there may also have been other plutonium processing activities that are not encompassed However, the waste generated from such activities and recorded as such in the NMMSS account should show up in the data for WIPP. But it does not. Since dumping of buried transuranic waste had stopped by 1979 (DOE 1999) and since waste buried as low-level waste is estimated to contain very small amounts of plutonium, the discrepancy between the waste data as indicated by the NMMSS account and that indicated by the WIPP account are stark. Los Alamos produced about 600 pits in five decades of operation.24 In addition, 57 other devices of Los Alamos design were used for hydronuclear and other safety tests. The 35 hydronuclear tests at Los Alamos contained 39 kilograms of plutonium, or about 1.1 kilograms per device.
24 Mann and McDonald 2001

Dangerous Discrepancies
21
Hence if all the Los Alamos safety test devices were made there, the total of plutonium in these devices would be roughly 60 to 70 kilograms and in any case most likely under 100 kilograms. As regards the amount of plutonium per pit one estimate can be derived from the public record regarding plutonium consumed in the 1030 nuclear tests done by the United States. According to the 50 Years Report this total was 3.4 metric tons,25 or about 3.3 kilograms per weapon. Of course, some test weapons may not have had any plutonium, but been fabricated using only highly enriched uranium. And it is possible that the devices made at Los Alamos had somewhat more, possibly ~4 kilograms, per pit. The total amount of plutonium processed into pits at Los Alamos can therefore be estimated at somewhere between about 2,000 and 2,400 kilograms. Adding 100 kilograms for the safety test devices, we get a total of about 2,500 kilograms as a high estimate. Taking into account that there are other minor uses of plutonium at Los Alamos, we place the estimate of plutonium actually processed in the sense of chemical processing, machining, casting, and the like at about 3,000 kilograms or less.26 For the 70,000 pits produced at Rocky Flats a reasonable range for plutonium processed (including that from returned devices) would be 230,000 to 280,000 kilograms. If the 3,000-kilogram figure for plutonium processed into devices at Los Alamos at Los Alamos is taken as being near the correct figure then 610 kilograms of plutonium in the waste would mean that, on average, about 20 percent of the amount of plutonium processed at Los Alamos wound up in waste. Given the distribution of waste over the decades, the figure in the 1980s was likely to have been considerably higher. The comparable figure for Rocky Flats would be about 2 percent to 2.4 percent – about an order of magnitude lower than for Los Alamos. As noted above, it is possible that there were activities that occurred at Los Alamos in the 1980s that involved processing of large amounts of plutonium that were not captured in the 3,000-kilogram estimate described above. However, if the waste generation was comparable in percentage to Rocky Flats, the total amount of plutonium processed in the 1980s would be in the range of about 20,000 to 25,000 kilograms. While this is possible, it seems rather unlikely. It seems more likely that the huge amounts logged as discharged to waste have some other explanation, such as larger discharges to WIPP, larger discharges to buried waste in the pre-1980 era, possible diversion, or some combination of these explanations.27 If the NMMSS account is correct, hundreds of millions of dollars of plutonium were sent to waste in the 1980s at rates of wastage per unit of production that were likely to have been much larger than Rocky Flats. If 25 DOE 1996, pp. 49-50. 26 Note that this report does not cover plutonium-242 tests, which contain relatively pure plutonium-242, since this analysis only covers weapon plutonium. Data for plutonium-242 have been separated out of the analysis of plutonium discrepancies. 27 Some of the unaccounted for plutonium may also have been discharged to the air and into waste water, above the amounts logged in those accounts. However, typically, solid wastes contain far more of the radioactive materials in waste than air or water. Further, the largest waste amounts are in the 1980s and 1990s (over 90 percent in all). The vigilance regarding water and air emissions in these years was far greater than in the pre-1970 period. Hence, air and waste water accounts are not analyzed in this report as a major explanation for the plutonium discrepancy. However, it is an aspect that needs investigation, since additional discharges into air and/or water above those reported may have implications for health, environment, clear-up, and compliance with regulations.

Dangerous Discrepancies
22
pits, hydro-nuclear, sub-critical, and safety devices were the main activities for plutonium processing, then Los Alamos discarded plutonium to waste streams at a rate about an order of magnitude greater than Rocky Flats. WIPP accounts appear likely to be incorrect in that case. WIPP data accuracy In a 1998 evaluation done for the New Mexico Attorney General’s office, IEER found that the data characterizing the initial 36 containers to be sent to WIPP contained many deficiencies, including missing and incomplete documentation:
3.1 Missing Documentation There are two types of missing documentation. The first is when a data package is missing a form in its entirety. For example, Drum LA 55666 is missing the Waste Origination and Disposition Form for one of the waste packages in the drum…. …
• Waste Drum Report/Printed TWSR. Some information (such as confirmatory assays) are only presented on these forms and do not appear on their written counterparts. In cases where these cover sheets were missing it was impossible to determine if there was agreement between estimates of the amount of Special Nuclear Material in the drum (see below). The second type of missing documentation is when a portion of a form is missing. A number of drum data packages are missing the second page of the Transuranic Waste Storage Record and/or the Waste Profile Form. 3.2 Incomplete Documentation Incomplete documentation consists of sections of forms being incomplete, missing signatures, or missing data entries. One example of incomplete forms is the second page of the Transuranic Waste Storage Record. It is blank for all drums (except those in which the second page is completely missing). It is not clear at this time why this page is always either blank or missing. Again, this shows a lack of documentation on the storage of TA-55-43 waste at the TA-55 storage area. Signatures are missing from a number of Document Traveler forms, as well as TRU Waste Manifest forms and one DWLS. The following are examples of missing data entries: …
• The weight measurements of individual packages are not always complete. In many cases the gross weight was either not measured and/or not recorded. Furthermore, blank entries are assumed to be zero in adding the gross weights and therefore the total of the gross weight is in error in these cases. In at least one case the gross weight was measured and recorded on the WODF but not on the DWLS printout.28
28 Franke and Zerriffi 1998, pp. 10-11, emphasis added.

Dangerous Discrepancies
23
Given that these deficiencies existed in packages that the DOE had spent large amounts of money to characterize, it might safely be assumed that the state of the documentation for the rest of the packages destined for WIPP would not be vastly superior. It is possible therefore that the wastes going to WIPP from LANL have considerably more plutonium than is indicated by the WIPP documentation published by the DOE (DOE 2004). This raises troubling questions of oversight, safety, transportation emergency response, and WIPP repository performance assessment. Such questions are beyond the scope of this report but would need to be addressed in any investigation of the LANL plutonium-in-waste issue. Section Four: Environmental Implications of more Plutonium in Buried Waste As discussed above, one possible explanation for the discrepancies is that the unaccounted for plutonium is in some combination of retrievable and buried waste. The possibility that it may all be in the buried waste is raised by the continued poor state of the buried waste data, even after the DOE spent three years examining the problem. In her letter to IEER, the then-Assistant Secretary of Energy characterized the revised data stated:
The main results for the updated buried TRU study are as follows:
• Due to the lack of adequate records on, and the lack of formal waste characterization of, the buried TRU wastes, staff at field sites by necessity used back-extrapolations from process knowledge and facility accountability records to derive estimates of the buried TRU inventories. These types of information bases lead to generally low confidence in the reported numbers.29
Hence, even the revised data are not reliable. There has been no significant improvement in the quality of these data since the year 2000. This does raise the possibility that a large amount of the 300 or more kilograms could be in the TRU waste that was buried at LANL before 1970 (it was all called low-level waste then). As we have noted, this would mean that the NMMSS annual totals of plutonium in waste for Los Alamos are also wrong. In any case, we decided to examine the environmental implications of 300 kilograms of plutonium in buried waste by performing a RESRAD analysis of plutonium buried in Area G at a depth of 4 feet, with the very low erosion rate that is used by LANL in its calculations (5 to 50 times slower than typical for semiarid areas).30 Even these assumptions oriented to low impact results, indicate that once the surface is eroded away sufficiently for the roots of plants to reach the waste the resultant doses in the very long term (more than 10,000 years) could be about a 100 times larger than the maximum dose target of 15 mrem/per year set by LANL. If a faster erosion rate is considered, as is reasonable, high doses would result much faster. The RESRAD run and the assumptions and parameter values on which the results are based are shown in Appendix C.
29 Huntoon 2000, emphasis added. 30 See memorandum by James Carr and other analysis in Makhijani and Smith 2005.

Dangerous Discrepancies
24
The remediation and long-term stewardship implications of such large amounts of additional plutonium in shallow land burial, for instance, in Area G is immense. The dose calculations indicate that it should not be left in the soil. The average concentration of plutonium-239 could be approximately 23 nanocuries per gram. Hot spots might run far higher; some may even fall into the category of transuranic waste (more than 100 nanocuries per gram or alpha-emitting, long-lived transuranic radionuclides). . At the same time recovery of vast amounts of soil with unknown hot spots would be very expensive and pose considerable safety challenges, mainly due to the unknown dispersal of the plutonium and unknown disposal patterns. If the material is not recovered, the long term stewardship implications would not only involve environmental monitoring but also security issues. For these reasons, it is imperative that the issues of the unaccounted for plutonium be addressed, if only to rule out that vast amounts were put in shallow land burial. Section Five: Security Implications The data and analysis above raise the clear possibility that some or all of the plutonium that is not accounted for (approximately 300 kilograms) may not be in the waste. This is a very distinct possibility, since the comparison waste per unit of plutonium processed and per pit indicates that it is improbable that as much as 300 kilograms of plutonium above the amount indicated by WIPP and buried waste data would have resulted from LANL production operations. The security implications of a loss of even a few percent of 300 kilograms are extremely serious, since less than two percent of the unaccounted for plutonium is enough to make one nuclear bomb. In 2004, when LANL was shut down for a security reasons, three organizations31 sent a letter to LANL Director Peter Nanos raising concerns about the environmental and security implications of the discrepancies in plutonium in waste accounts reported in Guimond and Beckner 1996. That letter is reproduced in Appendix B. Guimond and Beckner mention that a DOE task force to look into the plutonium accounting problem was established. But no account of its work has been forthcoming since 1996. It is unknown whether it did any work or analysis and if so what. The apparent failure of LANL or the DOE to address such a vast security issue is puzzling and troubling, to say the least. It raises questions about the origins of the data presented in the 50 Years Report, the nature of plutonium accounting, and the apparent lack of vigilance on the part of the authorities regarding large discrepancies in plutonium accounts. A small fraction of the discrepancy is large enough to cause concerns of the highest magnitude. For perspective, 300 kilograms is roughly seven times the amount of plutonium that North Korea is supposed to possess and that has rightly been the object of immense concern to the United States and other
31 IEER, Concerned Citizens for Nuclear Safety, and Nuclear Watch of New Mexico.

Dangerous Discrepancies
25
countries as well as the International Atomic Energy Agency.32 Why the large amount of unaccounted for plutonium has not excited significant concern remains a mystery. It can only be addressed by an urgent, independent, and thorough investigation.
32 The most recent estimate of North Korea’s plutonium stock is 40 to 55 kilograms as of mid-2005. ISIS 2005. International concerns were already high when North Korea’s plutonium stock was estimated to be in the 20 to 30 kilogram range.

Dangerous Discrepancies
26
References Ackland 1999 Len Ackland. Making A Real Killing: Rocky Flats And The Nuclear West.
Albuquerque: University of New Mexico Press, 1999.
Allen 2003 Lawrence E. Allen. Identification of issues concerning buried transuranic waste. EEG-87; DOE/AL58309-87. Albuquerque, NM: Environmental Evaluation Group, October 2003. On the Web at http://www.trex-center.org/pdfs/EEG/EEG87.pdf
Birdsell et al. 2005
Kay H. Birdsell, Brent D. Newman, David E. Broxton, and Bruce A. Robinson. “Conceptual models of vadose zone flow and transport beneath the Pajarito Plateau, Los Alamos, New Mexico.” Vadose Zone Journal, v.4, August 2005. pages 620-636.
Breshears, Nyhan, and Davenport 2005
David D. Breshears, John W. Nyhan, and David W. Davenport. “Ecohydrology Monitoring and Excavation of Semiarid Landfill Covers a Decade after Installation.” Vadose Zone Journal, v.4, August 2005. pages 798-810.
DOE 1994 U.S. Department of Energy. Plutonium Working Group Report on Environmental, Safety and Health Vulnerabilities Associated with the Department’s Plutonium Storage. DOE/EH-0415. [Washington, DC]: DOE, September 1994.
DOE 1996 U.S. Department of Energy. Plutonium: The First 50 Years: United States Plutonium Production, Acquisition, and Utilization from 1944 to 1994. Washington, DC: DOE, February 1996. On the Web at http://www.fas.org/sgp/othergov/doe/pu50y.html.
DOE 1999 U.S. Department of Energy. Office of Environmental Management. Buried Transuranic-Contaminated Waste and Related Materials Database. Washington, DC: [DOE EM], December 15, 1999.
DOE 2000 U.S. Department of Energy. Office of Environmental Management. Buried Transuranic-Contaminated Waste Information for U.S. Department of Energy Facilities. Washington, DC: DOE EM, June 2000. On the Web at http://cid.em.doe.gov/Modules/Reporting/Summary/Buried_TRU.pdf.
DOE 2000b U.S. Department of Energy. United States Nuclear Tests July 1945 through September 1992. DOE/NV--209-REV 15. Las Vegas: DOE, Nevada Operations Office. Date Published - December 2000. On the Web at http://www.nv.doe.gov/library/publications/historical/DOENV_209_REV15.pdf.
DOE 2004 U.S. Department of Energy. 2004 WIPP Compliance Recertification Application. At head of title: Title 40 CFR Part 191 Subparts B and C Compliance Recertification Application 2004. DOE/WIPP 04-3231. [Washington, DC?: DOE], March 2004. Title from Web link. On the Web at: http://www.wipp.ws/library/CRA/index.htm.
Fioravanti and Makhijani 1997
Marc Fioravanti and Arjun Makhijani. Containing the Cold War Mess: Restructuring the Environmental Management of the U.S. Nuclear Weapons Complex. Takoma Park, Maryland: Institute for Energy and Environmental Research, October 1997. On the Web at http://www.ieer.org/reports/cleanup.
Franke and Zerriffi 1998
Bernd Franke and Hisham Zerriffi. Review of Documents Relating to the Proposed Shipments of LANL TA-55-43 Wastes to the Waste Isolation Pilot Plant. Takoma Park, Maryland: Institute for Energy and Environmental Research, June 5, 1998

Dangerous Discrepancies
27
Guimond and Beckner 1996
Guimond, R.J. (Principal Deputy Assistant Secretary for Environmental Management), and E.H.Beckner (Principal Deputy Assistant Secretary for Defense Programs), Memorandum on Plutonium in Waste Inventories, U.S. Department of Energy, January 30, 1996. On the Web at http://www.ieer.org/offdocs/Guimond1996Memo.pdf.
Huntoon 2000 Letter from Carolyn L. Huntoon, Assistant Secretary for Environmental Management, U.S. Department of Energy, to Arjun Makhijani, July 18, 2000. On the Web at http://www.ieer.org/comments/waste/tru2ieer.html.
ISIS 2005 Institute for Science and International Security. The North Korean Plutonium Stock Mid-2005. [Washington, DC]: ISIS, September 7, 2005. On the Web at http://www.isis-online.org/publications/dprk/dprkplutoniumstockmid05.pdf.
Johnston 2005 Wm. Robert Johnston, compiler. Database of nuclear tests, United States: hydronuclear tests. Last modified 19 June 2005. On the Web at http://www.johnstonsarchive.net/nuclear/tests/USA-ntestsH.html.
Johnston 2005b Wm. Robert Johnston, compiler. Database of nuclear tests, United States: part 1, 1945-1963. Last modified 19 June 2005. On the Web at http://www.johnstonsarchive.net/nuclear/tests/USA-ntests1.html
Johnston 2005c Wm. Robert Johnston, compiler. Database of nuclear tests, United States: part 2, 1964-1972. Last modified 19 June 2005. On the Web at http://www.johnstonsarchive.net/nuclear/tests/USA-ntests2.html.
Johnston 2005d Wm. Robert Johnston, compiler. Database of nuclear tests, United States: part 3, 1973-1992. Last modified 19 June 2005. On the Web at http://www.johnstonsarchive.net/nuclear/tests/USA-ntests3.html.
Makhijani and Boyd 2001
Arjun Makhijani and Michele Boyd. Poison in the Vadose Zone: An examination of the threats to the Snake River Plain aquifer from the Idaho National Engineering and Environmental Laboratory. Takoma Park, Maryland: Institute for Energy and Environmental Research, October 2001. On the Web at http://www.ieer.org/reports/poison/toc.html.
Makhijani and Franke 2000
Arjun Makhijani Arjun and Bernd Franke. Monitoring Report of The Institute for Energy and Environmental Research on the First Independent Technical Audit of the Los Alamos National Laboratory’s Compliance Status with Respect to the Clean Air Act. Takoma Park, MD: Institute for Energy and Environmental Research, April 11, 2000. On the Web at http://www.ieer.org/reports/lanl/audit1.html.
Makhijani and Franke 2000b
Arjun Makhijani and Bernd Franke. Final Report of the Institute for Energy and Environmental Research on the Second Clean Air Act Audit of Los Alamos National Laboratory by the Independent Technical Audit Team. Takoma Park, MD: Institute for Energy and Environmental Research, 13 December 2000. On the Web at http://www.ieer.org/reports/lanl/audit2.html.

Dangerous Discrepancies
28
Makhijani and Franke 2002
Arjun Makhijani and Bernd Franke. Report of the Monitoring Team of the Institute for Energy and Environmental Research on the [Third] Independent Audit of Los Alamos National Laboratory for Compliance With the Clean Air Act, 40 CFR 61, Subpart H in 2001 to Concerned Citizens for Nuclear Safety. Takoma Park, MD: Institute for Energy and Environmental Research, December 18, 2002. On the Web at http://www.ieer.org/reports/lanl/audit3.pdf.
Makhijani, Coghlan, and Arends 2004
Letter from Arjun Makhijani, Jay Coghlan, and Joni Arends to G. Peter Nanos (Director, Los Alamos National Laboratory). August 10, 2004 On the Web at http://www.ieer.org/comments/pu/nanosltr.html.
Makhijani and Smith 2005
Arjun Makhijani and Brice Smith. Update to Costs and Risks of Management and Disposal of Depleted Uranium from the National Enrichment Facility Proposed to be Built in Lea County New Mexico by LES by Arjun Makhijani, PhD. and Brice Smith, Ph.D. based on information obtained since November 2004. Takoma Park, MD: Institute for Energy and Environmental Research, July 5, 2005. Version for public release, redacted August 10, 2005 to remove information considered confidential by LES. On the Web at http://www.ieer.org/reports/du/LESrptupdate.pdf.
Mann and McDonald 2001
David Mann and Sean McDonald. "Pit Manufacturing Project Presents Many Challenges." Actinide Research Quarterly 1st Quarter 2001, pages 4 and 5. On the web at http://arq.lanl.gov/source/orgs/nmt/nmtdo/AQarchive/01spring/pitman.html.
Purtymun and Kennedy 1971
William D. Purtymun and William R. Kennedy. Geology and Hydrology of Mesita del Buey. LA-4660, UC-41, Health and Safety, TID-4500. Los Alamos, NM: Los Alamos Scientific Laboratory of the University of California, written November 1970; distributed May 1971.
Robinson et al. 2005
Bruce A. Robinson, Gregory Cole, James W. Carey, Marc Witkowski, Carl W. Gable, Zhiming Lu, and Robert Gray. “A vadose zone flow and transport model for Los Alamos Canyon, Los Alamos, New Mexico.” Vadose Zone Journal, v.4, August 2005. pages 729-743.
Shuman, Jennrich, and Merrell 1991
R. Shuman, E.A. Jennrich, and G.B. Merrell. Assessment of Greater-Than-Class C Waste at Los Alamos National Laboratory. RAE-8915/3-3; DE93010746. Salt Lake City: Rogers and Associates Engineering Corporation, February 1991. “Task 3.”
Thorn and Westervelt 1987
Robert N. Thorn and Ronald R. Westervelt. Hydronuclear Experiments. LA-10902MS. Los Alamos, NM: Los Alamos National Laboratory, February 1987.
WCS 2004 Waste Control Specialists, LLC., “Application for License to Authorize Near-Surface Land Disposal of Low-Level Radioactive Waste”, originally filed on August 4, 2004 and ruled Administratively Complete by the Texas Commission on Environmental Quality on February 18, 2005, available online at http://64.224.191.188/wcs/

Appendix A


Appendix B

http://www.ieer.org/comments/pu/nanosltr.html
IEER | Subject Index
August 10, 2004
G. Peter NanosDirector, Los Alamos National LaboratoryP. O. Box 1663Los Alamos, NM 87545
Dear Director Nanos,
Thank you very much for the difficult decision you made to stand down operations at the Los Alamos NationalLaboratory (LANL) so that serious security and safety issues could be addressed.
There is, however, another critical security and safety problem that the staffs of LANL and Department of Energy(DOE) headquarters have ignored for several years. It relates to an immense discrepancy in the accounts for howmuch plutonium is in the waste at LANL. We suggest that this issue be considered and resolved before LANLresumes full-scale operations.
The problem was discovered in January 1996 when then-Secretary of Energy Hazel O'Leary published a reportentitled Plutonium: The First Fifty Years as part of her openness initiative. At that time Admiral Richard J. Guimond,then Principal Deputy Assistant Secretary for Environmental Management, and Principal Deputy Assistant Secretary for Defense Programs Everet H. Beckner prepared a memorandum detailing plutonium accounting discrepancies throughout the nuclear weapons complex. That memorandum is attached to this letter.
The Guimond-Beckner memorandum shows that the security-related nuclear materials accounts do not agree with thewaste accounts. The Department of Energy reported a discharge to waste from LANL of 610 kilograms of plutonium;Los Alamos indicates a figure of 1,375 kilograms (Attachment B of the memorandum). Evidently, there is adiscrepancy of 765 kilograms, the equivalent of 150 nuclear weapons. This is unacceptable by any imaginable standards and constitutes a crucial security, environmental, and safety issue.
Attachment B to the memorandum also clearly shows that the plutonium accounting discrepancy is by far the largestfor Los Alamos. The second largest discrepancy of 391 kilograms is at Savannah River Site, mainly relating to thehigh-level waste tanks.
The huge discrepancy at LANL is especially troubling and puzzling because Los Alamos was not continuously anindustrial-scale production site. If the LANL number is anywhere close to correct, then there may be very seriousimplications regarding the lack of due care in minimizing losses of an extremely expensive, proliferation-sensitive, and dangerous material.
On the other hand, if the 1,375 kilograms that is now booked as waste is not, in fact, in the waste, the securityimplications are obvious. They are at least as serious as those of loss of nuclear weapon design information. As youknow, the difficulty of obtaining fissile materials is generally considered the most important barrier to proliferation.
As the Guimond-Beckner memorandum states, Secretary O'Leary set up a working group to address the issue andurged individual sites to do so as well. The DOE working group seems to have melted away in the bureaucracy. Tothe best of our knowledge, LANL has yet to explain the large plutonium accounting discrepancy or address its security implications.
It is completely unacceptable for a discrepancy of 150 bombs worth of plutonium to remain on the books eight yearsafter it was first discovered. We hope that you agree. Since you have already stood down LANL on other security andsafety issues, we request that you seize this moment and immediately appoint an independent task force to investigatethis issue until it is resolved. We believe it is important to continue the stand down of all plutonium operations,

http://www.ieer.org/comments/pu/nanosltr.html
including those at TA-55 and the Chemistry and Metallurgy Research building, until the accounting discrepancy is sorted out and LANL's plutonium books are reconciled.
We look to you to take this courageous and necessary action now. Please address questions regarding thememorandum to Arjun Makhijani at 301-270-5500 or 301-365-6723 or arjun[at]ieer.org. You can reach Jay Coghlan505-989-7342 or jay[at]nukewatch.org and Joni Arends at (505) 986-1973 or jarends[at]nuclearactive.org.
Yours Sincerely,
Arjun Makhijani, Ph.D.President, Institute for Energy and Environmental Research
Jay CoghlanExecutive Director, Nuclear Watch of New Mexico
Joni ArendsExecutive Director, Concerned Citizens for Nuclear Safety
cc: Secretary of Energy Spencer AbrahamU.S. Senator Pete DomeniciU.S. Senator Jeff BingamanU.S. Representative Tom UdallU.S. Representative Heather WilsonU.S. Representative Steve PearceNew Mexico Governor Bill RichardsonNational Nuclear Security Administration Administrator Linton Brooks University of California President Robert DynesU.S. Representative Sherwood Boehlert, Chairman, House Science CommitteeU.S. Representative Bart Gordon, Ranking Member, House Science CommitteeU.S. Representative Duncan Hunter, Chairman, House Armed Services CommitteeU.S. Representative Ike Skelton, Ranking Member, House Armed Services CommitteeU.S. Representative Joe Barton, Chairman, House Energy and Commerce CommitteeU.S. Representative John Dingell, Ranking Member, House Energy and Commerce Committee
Also on this site: 1996 DOE memorandum identifying LANL's plutonium accounting issue Press release Radio commentary: Los Alamos and plutonium
Institute for Energy and Environmental Research
Comments to Outreach Coordinator: ieer[at]ieer.orgTakoma Park, Maryland, USA
Posted August 11, 2004Radio commentary added August 12, 2004

Appendix C
RESRAD Calculations for Disposal of Plutonium and Americium in Area G

Summary of non-default parameters used in ResRad calculations of plutonium discrepancy impacts ResRad Parameter Value Source
plutonium-239 concentration 23.1 nCi/gm
300 kilograms of plutonium WIPP data indicates that for Los Alamos, Pu-239 makes up 91.4 percent of the mass of plutonium isotopes. (DOE 2004 Appendix DATA, Attachment F p. 59) 17,277 curies of Pu-239 volume of waste = 4.68 x 10⁵ m3 (see below) mass of waste = 7.49 x 10¹¹ grams (see below)
plutonium-240 concentration 2.12 nCi/gm
300 kilograms of plutonium WIPP data indicates that for Los Alamos, Pu-240 makes up 8.42 percent of the mass of plutonium isotopes. (DOE 2004 Appendix DATA, Attachment F p. 59) 1,592 curies of Pu-240 volume of waste = 4.68 x 10⁵ m3 (see below) mass of waste = 7.49 x 10¹¹ grams (see below)
americium-241 concentration 11.7 nCi/gm
300 kilograms of plutonium WIPP data indicates that for every curie of plutonium-239/240 there will be 0.463 curies of Am-241. (DOE 2004 Appendix DATA, Attachment F p. 59-60) 8,729 curies of Am-241 volume of waste = 4.68 x 10⁵ m3 (see below) mass of waste = 7.49 x 10¹¹ grams (see below)
area of contaminated zone 33,445 m2
Transuranic waste is reported to have been disposed of in six Area G waste disposal pits. For illustrative purposes we have assumed the unaccounted for plutonium is uniformly mixed into six pits, each 600 feet long by 100 feet wide. (Purtymun and Kennedy 1971 p. 10, Shuman, Jennrich, and Merrell 1991 p. 3-1, and Allen 2003 p. 12-13)
depth of contaminated zone 14 m (Shuman, Jennrich, and Merrell 1991 p. 3-10)
length parallel to aquifer 366 m
Length of two waste disposal pits. (For simplicity this assumes the pits are arranged three wide and two long on the mesa. This assumption does not affect the projected doses since the contaminants do not reach the water table.)
cover depth 1.22 m (Purtymun and Kennedy 1971 p. 10 and Shuman, Jennrich, and Merrell 1991 p. 3-1)
cover erosion rate 2.2 x 10⁻⁵ m/yr (Purtymun and Kennedy 1971 p. 9) density of contaminated zone 1.6 gm/cm3 (WCS 2004 p. 8.0-6-32)

ResRad Parameter Value Source contaminated zone erosion rate 2.2 x 10⁻⁵ m/yr (Purtymun and Kennedy 1971 p. 9)
evapotranspiration 0.982
Yields a net infiltration rate of 1 mm per year for precipitation and irrigation. This is also consistent with the measured values from long-term assessment of landfill covers. (Breshears, Nyhan, and Davenport 2005 p. 801, Birdsell et al. 2005 p. 629, and Robinson et al. 2005 p. 733)
precipitation 0.457 m/yr (Purtymun and Kennedy 1971 p. 8 and Breshears, Nyhan, and Davenport p. 801)
irrigation 0.1 m/yr (Shuman, Jennrich, and Merrell 1991 p. 3-10)
runoff coefficient 0 Evapotranspiration rate sets proper level of water infiltration through the cover.
thickness of unsaturated zone 366 m (Purtymun and Kennedy 1971 p. 8-9 and Allen 2003 p. 9)
inhalation rate 8,000 m3/yr (Shuman, Jennrich, and Merrell 1991 p. 3-10) mass loading for inhalation
1.8 x 10⁻⁴ gm/m3 (Shuman, Jennrich, and Merrell 1991 p. 3-10)
indoor time fraction 0.43 (Shuman, Jennrich, and Merrell 1991 p. 3-10) outdoor time fraction 0.27 (Shuman, Jennrich, and Merrell 1991 p. 3-10) fruit, vegetable, and grain consumption 176 kg/yr (Shuman, Jennrich, and Merrell 1991 p. 3-10)
leafy vegetable consumption 18 kg/yr (Shuman, Jennrich, and Merrell 1991 p. 3-10)
milk consumption 112 kg/yr (Shuman, Jennrich, and Merrell 1991 p. 3-10) meat and poultry consumption 85 kg/yr (Shuman, Jennrich, and Merrell 1991 p. 3-10)

0.00E+01
2.00E+02
4.00E+02
6.00E+02
8.00E+02
1.00E+03
1.20E+03
1.40E+03
1.60E+03
1.80E+03
10000 100000Years
External
Inhalation
Radon (Water Independent)
Plant (Water Independent)
Meat (Water Independent)
Milk (Water Independent)
Soil Ingest
Drinking Water
Fish
Radon (Water Dependent)
Plant (Water Dependent)
Meat (Water Dependent)
Milk (Water Dependent)
LANL_Pu_Waste.RAD 11/28/2005 18:32 GRAPHICS.ASC
DOSE: All Nuclides Summed, Component Pathways

RESRAD, Version 6.3 T½ Limit = 180 days 11/28/2005 18:32 Page 1
Summary : Resolve Plutonium Waste Calculations File: LANL_Pu_Waste.RAD
Table of Contents
Part I: Mixture Sums and Single Radionuclide Guidelines
Dose Conversion Factor (and Related) Parameter Summary ... 2
Site-Specific Parameter Summary .......................... 5
Summary of Pathway Selections ............................ 10
Contaminated Zone and Total Dose Summary ................. 11
Total Dose Components
Time = 0.000E+00 .................................... 12
Time = 1.000E+04 .................................... 13
Time = 1.000E+05 .................................... 14
Dose/Source Ratios Summed Over All Pathways .............. 15
Single Radionuclide Soil Guidelines ...................... 15
Dose Per Nuclide Summed Over All Pathways ................ 16
Soil Concentration Per Nuclide ........................... 17

RESRAD, Version 6.3 T½ Limit = 180 days 11/28/2005 18:32 Page 2
Summary : Resolve Plutonium Waste Calculations File: LANL_Pu_Waste.RAD
Dose Conversion Factor (and Related) Parameter Summary
File: FGR 13 MORBIDITY
Current Base Parameter
Menu Parameter Value Case* Name
B-1 Dose conversion factors for inhalation, mrem/nCi:
B-1 Ac-227+D 6.724E+03 6.700E+03 DCF2( 1)
B-1 Am-241 4.440E+02 4.440E+02 DCF2( 2)
B-1 Np-237+D 5.400E+02 5.400E+02 DCF2( 3)
B-1 Pa-231 1.280E+03 1.280E+03 DCF2( 4)
B-1 Pu-239 4.290E+02 4.290E+02 DCF2( 5)
B-1 Pu-240 4.290E+02 4.290E+02 DCF2( 6)
B-1 Ra-228+D 5.078E+00 4.770E+00 DCF2( 8)
B-1 Th-228+D 3.454E+02 3.420E+02 DCF2( 9)
B-1 Th-229+D 2.169E+03 2.150E+03 DCF2( 10)
B-1 Th-232 1.640E+03 1.640E+03 DCF2( 11)
B-1 U-233 1.350E+02 1.350E+02 DCF2( 12)
B-1 U-235+D 1.230E+02 1.230E+02 DCF2( 13)
B-1 U-236 1.250E+02 1.250E+02 DCF2( 14)
D-1 Dose conversion factors for ingestion, mrem/nCi:
D-1 Ac-227+D 1.480E+01 1.410E+01 DCF3( 1)
D-1 Am-241 3.640E+00 3.640E+00 DCF3( 2)
D-1 Np-237+D 4.444E+00 4.440E+00 DCF3( 3)
D-1 Pa-231 1.060E+01 1.060E+01 DCF3( 4)
D-1 Pu-239 3.540E+00 3.540E+00 DCF3( 5)
D-1 Pu-240 3.540E+00 3.540E+00 DCF3( 6)
D-1 Ra-228+D 1.442E+00 1.440E+00 DCF3( 8)
D-1 Th-228+D 8.086E-01 3.960E-01 DCF3( 9)
D-1 Th-229+D 4.027E+00 3.530E+00 DCF3( 10)
D-1 Th-232 2.730E+00 2.730E+00 DCF3( 11)
D-1 U-233 2.890E-01 2.890E-01 DCF3( 12)
D-1 U-235+D 2.673E-01 2.660E-01 DCF3( 13)
D-1 U-236 2.690E-01 2.690E-01 DCF3( 14)
D-34 Food transfer factors:
D-34 Ac-227+D , plant/soil concentration ratio, dimensionless 2.500E-03 2.500E-03 RTF( 1,1)
D-34 Ac-227+D , beef/livestock-intake ratio, (nCi/kg)/(nCi/d) 2.000E-05 2.000E-05 RTF( 1,2)
D-34 Ac-227+D , milk/livestock-intake ratio, (nCi/L)/(nCi/d) 2.000E-05 2.000E-05 RTF( 1,3)
D-34
D-34 Am-241 , plant/soil concentration ratio, dimensionless 1.000E-03 1.000E-03 RTF( 2,1)
D-34 Am-241 , beef/livestock-intake ratio, (nCi/kg)/(nCi/d) 5.000E-05 5.000E-05 RTF( 2,2)
D-34 Am-241 , milk/livestock-intake ratio, (nCi/L)/(nCi/d) 2.000E-06 2.000E-06 RTF( 2,3)
D-34
D-34 Np-237+D , plant/soil concentration ratio, dimensionless 2.000E-02 2.000E-02 RTF( 3,1)
D-34 Np-237+D , beef/livestock-intake ratio, (nCi/kg)/(nCi/d) 1.000E-03 1.000E-03 RTF( 3,2)
D-34 Np-237+D , milk/livestock-intake ratio, (nCi/L)/(nCi/d) 5.000E-06 5.000E-06 RTF( 3,3)
D-34
D-34 Pa-231 , plant/soil concentration ratio, dimensionless 1.000E-02 1.000E-02 RTF( 4,1)
D-34 Pa-231 , beef/livestock-intake ratio, (nCi/kg)/(nCi/d) 5.000E-03 5.000E-03 RTF( 4,2)
D-34 Pa-231 , milk/livestock-intake ratio, (nCi/L)/(nCi/d) 5.000E-06 5.000E-06 RTF( 4,3)
D-34
D-34 Pu-239 , plant/soil concentration ratio, dimensionless 1.000E-03 1.000E-03 RTF( 5,1)
D-34 Pu-239 , beef/livestock-intake ratio, (nCi/kg)/(nCi/d) 1.000E-04 1.000E-04 RTF( 5,2)
D-34 Pu-239 , milk/livestock-intake ratio, (nCi/L)/(nCi/d) 1.000E-06 1.000E-06 RTF( 5,3)
D-34

RESRAD, Version 6.3 T½ Limit = 180 days 11/28/2005 18:32 Page 3
Summary : Resolve Plutonium Waste Calculations File: LANL_Pu_Waste.RAD
Dose Conversion Factor (and Related) Parameter Summary (continued)
File: FGR 13 MORBIDITY
Current Base Parameter
Menu Parameter Value Case* Name
D-34 Pu-240 , plant/soil concentration ratio, dimensionless 1.000E-03 1.000E-03 RTF( 6,1)
D-34 Pu-240 , beef/livestock-intake ratio, (nCi/kg)/(nCi/d) 1.000E-04 1.000E-04 RTF( 6,2)
D-34 Pu-240 , milk/livestock-intake ratio, (nCi/L)/(nCi/d) 1.000E-06 1.000E-06 RTF( 6,3)
D-34
D-34 Ra-228+D , plant/soil concentration ratio, dimensionless 4.000E-02 4.000E-02 RTF( 8,1)
D-34 Ra-228+D , beef/livestock-intake ratio, (nCi/kg)/(nCi/d) 1.000E-03 1.000E-03 RTF( 8,2)
D-34 Ra-228+D , milk/livestock-intake ratio, (nCi/L)/(nCi/d) 1.000E-03 1.000E-03 RTF( 8,3)
D-34
D-34 Th-228+D , plant/soil concentration ratio, dimensionless 1.000E-03 1.000E-03 RTF( 9,1)
D-34 Th-228+D , beef/livestock-intake ratio, (nCi/kg)/(nCi/d) 1.000E-04 1.000E-04 RTF( 9,2)
D-34 Th-228+D , milk/livestock-intake ratio, (nCi/L)/(nCi/d) 5.000E-06 5.000E-06 RTF( 9,3)
D-34
D-34 Th-229+D , plant/soil concentration ratio, dimensionless 1.000E-03 1.000E-03 RTF( 10,1)
D-34 Th-229+D , beef/livestock-intake ratio, (nCi/kg)/(nCi/d) 1.000E-04 1.000E-04 RTF( 10,2)
D-34 Th-229+D , milk/livestock-intake ratio, (nCi/L)/(nCi/d) 5.000E-06 5.000E-06 RTF( 10,3)
D-34
D-34 Th-232 , plant/soil concentration ratio, dimensionless 1.000E-03 1.000E-03 RTF( 11,1)
D-34 Th-232 , beef/livestock-intake ratio, (nCi/kg)/(nCi/d) 1.000E-04 1.000E-04 RTF( 11,2)
D-34 Th-232 , milk/livestock-intake ratio, (nCi/L)/(nCi/d) 5.000E-06 5.000E-06 RTF( 11,3)
D-34
D-34 U-233 , plant/soil concentration ratio, dimensionless 2.500E-03 2.500E-03 RTF( 12,1)
D-34 U-233 , beef/livestock-intake ratio, (nCi/kg)/(nCi/d) 3.400E-04 3.400E-04 RTF( 12,2)
D-34 U-233 , milk/livestock-intake ratio, (nCi/L)/(nCi/d) 6.000E-04 6.000E-04 RTF( 12,3)
D-34
D-34 U-235+D , plant/soil concentration ratio, dimensionless 2.500E-03 2.500E-03 RTF( 13,1)
D-34 U-235+D , beef/livestock-intake ratio, (nCi/kg)/(nCi/d) 3.400E-04 3.400E-04 RTF( 13,2)
D-34 U-235+D , milk/livestock-intake ratio, (nCi/L)/(nCi/d) 6.000E-04 6.000E-04 RTF( 13,3)
D-34
D-34 U-236 , plant/soil concentration ratio, dimensionless 2.500E-03 2.500E-03 RTF( 14,1)
D-34 U-236 , beef/livestock-intake ratio, (nCi/kg)/(nCi/d) 3.400E-04 3.400E-04 RTF( 14,2)
D-34 U-236 , milk/livestock-intake ratio, (nCi/L)/(nCi/d) 6.000E-04 6.000E-04 RTF( 14,3)
D-5 Bioaccumulation factors, fresh water, L/kg:
D-5 Ac-227+D , fish 1.500E+01 1.500E+01 BIOFAC( 1,1)
D-5 Ac-227+D , crustacea and mollusks 1.000E+03 1.000E+03 BIOFAC( 1,2)
D-5
D-5 Am-241 , fish 3.000E+01 3.000E+01 BIOFAC( 2,1)
D-5 Am-241 , crustacea and mollusks 1.000E+03 1.000E+03 BIOFAC( 2,2)
D-5
D-5 Np-237+D , fish 3.000E+01 3.000E+01 BIOFAC( 3,1)
D-5 Np-237+D , crustacea and mollusks 4.000E+02 4.000E+02 BIOFAC( 3,2)
D-5
D-5 Pa-231 , fish 1.000E+01 1.000E+01 BIOFAC( 4,1)
D-5 Pa-231 , crustacea and mollusks 1.100E+02 1.100E+02 BIOFAC( 4,2)
D-5
D-5 Pu-239 , fish 3.000E+01 3.000E+01 BIOFAC( 5,1)
D-5 Pu-239 , crustacea and mollusks 1.000E+02 1.000E+02 BIOFAC( 5,2)
D-5
D-5 Pu-240 , fish 3.000E+01 3.000E+01 BIOFAC( 6,1)
D-5 Pu-240 , crustacea and mollusks 1.000E+02 1.000E+02 BIOFAC( 6,2)
D-5

RESRAD, Version 6.3 T½ Limit = 180 days 11/28/2005 18:32 Page 4
Summary : Resolve Plutonium Waste Calculations File: LANL_Pu_Waste.RAD
Dose Conversion Factor (and Related) Parameter Summary (continued)
File: FGR 13 MORBIDITY
Current Base Parameter
Menu Parameter Value Case* Name
D-5 Ra-228+D , fish 5.000E+01 5.000E+01 BIOFAC( 8,1)
D-5 Ra-228+D , crustacea and mollusks 2.500E+02 2.500E+02 BIOFAC( 8,2)
D-5
D-5 Th-228+D , fish 1.000E+02 1.000E+02 BIOFAC( 9,1)
D-5 Th-228+D , crustacea and mollusks 5.000E+02 5.000E+02 BIOFAC( 9,2)
D-5
D-5 Th-229+D , fish 1.000E+02 1.000E+02 BIOFAC( 10,1)
D-5 Th-229+D , crustacea and mollusks 5.000E+02 5.000E+02 BIOFAC( 10,2)
D-5
D-5 Th-232 , fish 1.000E+02 1.000E+02 BIOFAC( 11,1)
D-5 Th-232 , crustacea and mollusks 5.000E+02 5.000E+02 BIOFAC( 11,2)
D-5
D-5 U-233 , fish 1.000E+01 1.000E+01 BIOFAC( 12,1)
D-5 U-233 , crustacea and mollusks 6.000E+01 6.000E+01 BIOFAC( 12,2)
D-5
D-5 U-235+D , fish 1.000E+01 1.000E+01 BIOFAC( 13,1)
D-5 U-235+D , crustacea and mollusks 6.000E+01 6.000E+01 BIOFAC( 13,2)
D-5
D-5 U-236 , fish 1.000E+01 1.000E+01 BIOFAC( 14,1)
D-5 U-236 , crustacea and mollusks 6.000E+01 6.000E+01 BIOFAC( 14,2)
*Base Case means Default.Lib w/o Associate Nuclide contributions.

RESRAD, Version 6.3 T½ Limit = 180 days 11/28/2005 18:32 Page 5
Summary : Resolve Plutonium Waste Calculations File: LANL_Pu_Waste.RAD
Site-Specific Parameter Summary
User Used by RESRAD Parameter
Menu Parameter Input Default (If different from user input) Name
R011 Area of contaminated zone (m**2) 3.344E+04 1.000E+04 --- AREA
R011 Thickness of contaminated zone (m) 1.400E+01 2.000E+00 --- THICK0
R011 Length parallel to aquifer flow (m) 3.660E+02 1.000E+02 --- LCZPAQ
R011 Basic radiation dose limit (mrem/yr) 2.500E+01 3.000E+01 --- BRDL
R011 Time since placement of material (yr) 0.000E+00 0.000E+00 --- TI
R011 Times for calculations (yr) 1.000E+04 1.000E+00 --- T( 2)
R011 Times for calculations (yr) 1.000E+05 3.000E+00 --- T( 3)
R011 Times for calculations (yr) not used 1.000E+01 --- T( 4)
R011 Times for calculations (yr) not used 3.000E+01 --- T( 5)
R011 Times for calculations (yr) not used 1.000E+02 --- T( 6)
R011 Times for calculations (yr) not used 3.000E+02 --- T( 7)
R011 Times for calculations (yr) not used 1.000E+03 --- T( 8)
R011 Times for calculations (yr) not used 0.000E+00 --- T( 9)
R011 Times for calculations (yr) not used 0.000E+00 --- T(10)
R012 Initial principal radionuclide (nCi/g): Am-241 1.170E+01 0.000E+00 --- S1( 2)
R012 Initial principal radionuclide (nCi/g): Pu-239 2.310E+01 0.000E+00 --- S1( 5)
R012 Initial principal radionuclide (nCi/g): Pu-240 2.120E+00 0.000E+00 --- S1( 6)
R012 Concentration in groundwater (nCi/L): Am-241 not used 0.000E+00 --- W1( 2)
R012 Concentration in groundwater (nCi/L): Pu-239 not used 0.000E+00 --- W1( 5)
R012 Concentration in groundwater (nCi/L): Pu-240 not used 0.000E+00 --- W1( 6)
R013 Cover depth (m) 1.220E+00 0.000E+00 --- COVER0
R013 Density of cover material (g/cm**3) 1.500E+00 1.500E+00 --- DENSCV
R013 Cover depth erosion rate (m/yr) 2.200E-05 1.000E-03 --- VCV
R013 Density of contaminated zone (g/cm**3) 1.600E+00 1.500E+00 --- DENSCZ
R013 Contaminated zone erosion rate (m/yr) 2.200E-05 1.000E-03 --- VCZ
R013 Contaminated zone total porosity 4.000E-01 4.000E-01 --- TPCZ
R013 Contaminated zone field capacity 2.000E-01 2.000E-01 --- FCCZ
R013 Contaminated zone hydraulic conductivity (m/yr) 1.000E+01 1.000E+01 --- HCCZ
R013 Contaminated zone b parameter 5.300E+00 5.300E+00 --- BCZ
R013 Average annual wind speed (m/sec) 2.000E+00 2.000E+00 --- WIND
R013 Humidity in air (g/m**3) not used 8.000E+00 --- HUMID
R013 Evapotranspiration coefficient 9.820E-01 5.000E-01 --- EVAPTR
R013 Precipitation (m/yr) 4.570E-01 1.000E+00 --- PRECIP
R013 Irrigation (m/yr) 1.000E-01 2.000E-01 --- RI
R013 Irrigation mode overhead overhead --- IDITCH
R013 Runoff coefficient 0.000E+00 2.000E-01 --- RUNOFF
R013 Watershed area for nearby stream or pond (m**2) 1.000E+06 1.000E+06 --- WAREA
R013 Accuracy for water/soil computations 1.000E-03 1.000E-03 --- EPS
R014 Density of saturated zone (g/cm**3) 1.500E+00 1.500E+00 --- DENSAQ
R014 Saturated zone total porosity 4.000E-01 4.000E-01 --- TPSZ
R014 Saturated zone effective porosity 2.000E-01 2.000E-01 --- EPSZ
R014 Saturated zone field capacity 2.000E-01 2.000E-01 --- FCSZ
R014 Saturated zone hydraulic conductivity (m/yr) 1.000E+02 1.000E+02 --- HCSZ
R014 Saturated zone hydraulic gradient 2.000E-02 2.000E-02 --- HGWT
R014 Saturated zone b parameter 5.300E+00 5.300E+00 --- BSZ
R014 Water table drop rate (m/yr) 1.000E-03 1.000E-03 --- VWT
R014 Well pump intake depth (m below water table) 1.000E+01 1.000E+01 --- DWIBWT
R014 Model: Nondispersion (ND) or Mass-Balance (MB) ND ND --- MODEL

RESRAD, Version 6.3 T½ Limit = 180 days 11/28/2005 18:32 Page 6
Summary : Resolve Plutonium Waste Calculations File: LANL_Pu_Waste.RAD
Site-Specific Parameter Summary (continued)
User Used by RESRAD Parameter
Menu Parameter Input Default (If different from user input) Name
R014 Well pumping rate (m**3/yr) 2.500E+02 2.500E+02 --- UW
R015 Number of unsaturated zone strata 1 1 --- NS
R015 Unsat. zone 1, thickness (m) 3.660E+02 4.000E+00 --- H(1)
R015 Unsat. zone 1, soil density (g/cm**3) 1.500E+00 1.500E+00 --- DENSUZ(1)
R015 Unsat. zone 1, total porosity 4.000E-01 4.000E-01 --- TPUZ(1)
R015 Unsat. zone 1, effective porosity 2.000E-01 2.000E-01 --- EPUZ(1)
R015 Unsat. zone 1, field capacity 2.000E-01 2.000E-01 --- FCUZ(1)
R015 Unsat. zone 1, soil-specific b parameter 5.300E+00 5.300E+00 --- BUZ(1)
R015 Unsat. zone 1, hydraulic conductivity (m/yr) 1.000E+01 1.000E+01 --- HCUZ(1)
R016 Distribution coefficients for Am-241
R016 Contaminated zone (cm**3/g) 2.000E+01 2.000E+01 --- DCNUCC( 2)
R016 Unsaturated zone 1 (cm**3/g) 2.000E+01 2.000E+01 --- DCNUCU( 2,1)
R016 Saturated zone (cm**3/g) 2.000E+01 2.000E+01 --- DCNUCS( 2)
R016 Leach rate (/yr) 0.000E+00 0.000E+00 2.221E-05 ALEACH( 2)
R016 Solubility constant 0.000E+00 0.000E+00 not used SOLUBK( 2)
R016 Distribution coefficients for Pu-239
R016 Contaminated zone (cm**3/g) 2.000E+03 2.000E+03 --- DCNUCC( 5)
R016 Unsaturated zone 1 (cm**3/g) 2.000E+03 2.000E+03 --- DCNUCU( 5,1)
R016 Saturated zone (cm**3/g) 2.000E+03 2.000E+03 --- DCNUCS( 5)
R016 Leach rate (/yr) 0.000E+00 0.000E+00 2.238E-07 ALEACH( 5)
R016 Solubility constant 0.000E+00 0.000E+00 not used SOLUBK( 5)
R016 Distribution coefficients for Pu-240
R016 Contaminated zone (cm**3/g) 2.000E+03 2.000E+03 --- DCNUCC( 6)
R016 Unsaturated zone 1 (cm**3/g) 2.000E+03 2.000E+03 --- DCNUCU( 6,1)
R016 Saturated zone (cm**3/g) 2.000E+03 2.000E+03 --- DCNUCS( 6)
R016 Leach rate (/yr) 0.000E+00 0.000E+00 2.238E-07 ALEACH( 6)
R016 Solubility constant 0.000E+00 0.000E+00 not used SOLUBK( 6)
R016 Distribution coefficients for daughter Ac-227
R016 Contaminated zone (cm**3/g) 2.000E+01 2.000E+01 --- DCNUCC( 1)
R016 Unsaturated zone 1 (cm**3/g) 2.000E+01 2.000E+01 --- DCNUCU( 1,1)
R016 Saturated zone (cm**3/g) 2.000E+01 2.000E+01 --- DCNUCS( 1)
R016 Leach rate (/yr) 0.000E+00 0.000E+00 2.221E-05 ALEACH( 1)
R016 Solubility constant 0.000E+00 0.000E+00 not used SOLUBK( 1)
R016 Distribution coefficients for daughter Np-237
R016 Contaminated zone (cm**3/g) -1.000E+00 -1.000E+00 2.574E+02 DCNUCC( 3)
R016 Unsaturated zone 1 (cm**3/g) -1.000E+00 -1.000E+00 2.574E+02 DCNUCU( 3,1)
R016 Saturated zone (cm**3/g) -1.000E+00 -1.000E+00 2.574E+02 DCNUCS( 3)
R016 Leach rate (/yr) 0.000E+00 0.000E+00 1.738E-06 ALEACH( 3)
R016 Solubility constant 0.000E+00 0.000E+00 not used SOLUBK( 3)
R016 Distribution coefficients for daughter Pa-231
R016 Contaminated zone (cm**3/g) 5.000E+01 5.000E+01 --- DCNUCC( 4)
R016 Unsaturated zone 1 (cm**3/g) 5.000E+01 5.000E+01 --- DCNUCU( 4,1)
R016 Saturated zone (cm**3/g) 5.000E+01 5.000E+01 --- DCNUCS( 4)
R016 Leach rate (/yr) 0.000E+00 0.000E+00 8.925E-06 ALEACH( 4)
R016 Solubility constant 0.000E+00 0.000E+00 not used SOLUBK( 4)

RESRAD, Version 6.3 T½ Limit = 180 days 11/28/2005 18:32 Page 7
Summary : Resolve Plutonium Waste Calculations File: LANL_Pu_Waste.RAD
Site-Specific Parameter Summary (continued)
User Used by RESRAD Parameter
Menu Parameter Input Default (If different from user input) Name
R016 Distribution coefficients for daughter Ra-228
R016 Contaminated zone (cm**3/g) 7.000E+01 7.000E+01 --- DCNUCC( 8)
R016 Unsaturated zone 1 (cm**3/g) 7.000E+01 7.000E+01 --- DCNUCU( 8,1)
R016 Saturated zone (cm**3/g) 7.000E+01 7.000E+01 --- DCNUCS( 8)
R016 Leach rate (/yr) 0.000E+00 0.000E+00 6.380E-06 ALEACH( 8)
R016 Solubility constant 0.000E+00 0.000E+00 not used SOLUBK( 8)
R016 Distribution coefficients for daughter Th-228
R016 Contaminated zone (cm**3/g) 6.000E+04 6.000E+04 --- DCNUCC( 9)
R016 Unsaturated zone 1 (cm**3/g) 6.000E+04 6.000E+04 --- DCNUCU( 9,1)
R016 Saturated zone (cm**3/g) 6.000E+04 6.000E+04 --- DCNUCS( 9)
R016 Leach rate (/yr) 0.000E+00 0.000E+00 7.460E-09 ALEACH( 9)
R016 Solubility constant 0.000E+00 0.000E+00 not used SOLUBK( 9)
R016 Distribution coefficients for daughter Th-229
R016 Contaminated zone (cm**3/g) 6.000E+04 6.000E+04 --- DCNUCC(10)
R016 Unsaturated zone 1 (cm**3/g) 6.000E+04 6.000E+04 --- DCNUCU(10,1)
R016 Saturated zone (cm**3/g) 6.000E+04 6.000E+04 --- DCNUCS(10)
R016 Leach rate (/yr) 0.000E+00 0.000E+00 7.460E-09 ALEACH(10)
R016 Solubility constant 0.000E+00 0.000E+00 not used SOLUBK(10)
R016 Distribution coefficients for daughter Th-232
R016 Contaminated zone (cm**3/g) 6.000E+04 6.000E+04 --- DCNUCC(11)
R016 Unsaturated zone 1 (cm**3/g) 6.000E+04 6.000E+04 --- DCNUCU(11,1)
R016 Saturated zone (cm**3/g) 6.000E+04 6.000E+04 --- DCNUCS(11)
R016 Leach rate (/yr) 0.000E+00 0.000E+00 7.460E-09 ALEACH(11)
R016 Solubility constant 0.000E+00 0.000E+00 not used SOLUBK(11)
R016 Distribution coefficients for daughter U-233
R016 Contaminated zone (cm**3/g) 5.000E+01 5.000E+01 --- DCNUCC(12)
R016 Unsaturated zone 1 (cm**3/g) 5.000E+01 5.000E+01 --- DCNUCU(12,1)
R016 Saturated zone (cm**3/g) 5.000E+01 5.000E+01 --- DCNUCS(12)
R016 Leach rate (/yr) 0.000E+00 0.000E+00 8.925E-06 ALEACH(12)
R016 Solubility constant 0.000E+00 0.000E+00 not used SOLUBK(12)
R016 Distribution coefficients for daughter U-235
R016 Contaminated zone (cm**3/g) 5.000E+01 5.000E+01 --- DCNUCC(13)
R016 Unsaturated zone 1 (cm**3/g) 5.000E+01 5.000E+01 --- DCNUCU(13,1)
R016 Saturated zone (cm**3/g) 5.000E+01 5.000E+01 --- DCNUCS(13)
R016 Leach rate (/yr) 0.000E+00 0.000E+00 8.925E-06 ALEACH(13)
R016 Solubility constant 0.000E+00 0.000E+00 not used SOLUBK(13)
R016 Distribution coefficients for daughter U-236
R016 Contaminated zone (cm**3/g) 5.000E+01 5.000E+01 --- DCNUCC(14)
R016 Unsaturated zone 1 (cm**3/g) 5.000E+01 5.000E+01 --- DCNUCU(14,1)
R016 Saturated zone (cm**3/g) 5.000E+01 5.000E+01 --- DCNUCS(14)
R016 Leach rate (/yr) 0.000E+00 0.000E+00 8.925E-06 ALEACH(14)
R016 Solubility constant 0.000E+00 0.000E+00 not used SOLUBK(14)
R017 Inhalation rate (m**3/yr) 8.000E+03 8.400E+03 --- INHALR
R017 Mass loading for inhalation (g/m**3) 1.800E-04 1.000E-04 --- MLINH

RESRAD, Version 6.3 T½ Limit = 180 days 11/28/2005 18:32 Page 8
Summary : Resolve Plutonium Waste Calculations File: LANL_Pu_Waste.RAD
Site-Specific Parameter Summary (continued)
User Used by RESRAD Parameter
Menu Parameter Input Default (If different from user input) Name
R017 Exposure duration 3.000E+01 3.000E+01 --- ED
R017 Shielding factor, inhalation 4.000E-01 4.000E-01 --- SHF3
R017 Shielding factor, external gamma 7.000E-01 7.000E-01 --- SHF1
R017 Fraction of time spent indoors 4.300E-01 5.000E-01 --- FIND
R017 Fraction of time spent outdoors (on site) 2.700E-01 2.500E-01 --- FOTD
R017 Shape factor flag, external gamma 1.000E+00 1.000E+00 >0 shows circular AREA. FS
R017 Radii of shape factor array (used if FS = -1):
R017 Outer annular radius (m), ring 1: not used 5.000E+01 --- RAD_SHAPE( 1)
R017 Outer annular radius (m), ring 2: not used 7.071E+01 --- RAD_SHAPE( 2)
R017 Outer annular radius (m), ring 3: not used 0.000E+00 --- RAD_SHAPE( 3)
R017 Outer annular radius (m), ring 4: not used 0.000E+00 --- RAD_SHAPE( 4)
R017 Outer annular radius (m), ring 5: not used 0.000E+00 --- RAD_SHAPE( 5)
R017 Outer annular radius (m), ring 6: not used 0.000E+00 --- RAD_SHAPE( 6)
R017 Outer annular radius (m), ring 7: not used 0.000E+00 --- RAD_SHAPE( 7)
R017 Outer annular radius (m), ring 8: not used 0.000E+00 --- RAD_SHAPE( 8)
R017 Outer annular radius (m), ring 9: not used 0.000E+00 --- RAD_SHAPE( 9)
R017 Outer annular radius (m), ring 10: not used 0.000E+00 --- RAD_SHAPE(10)
R017 Outer annular radius (m), ring 11: not used 0.000E+00 --- RAD_SHAPE(11)
R017 Outer annular radius (m), ring 12: not used 0.000E+00 --- RAD_SHAPE(12)
R017 Fractions of annular areas within AREA:
R017 Ring 1 not used 1.000E+00 --- FRACA( 1)
R017 Ring 2 not used 2.732E-01 --- FRACA( 2)
R017 Ring 3 not used 0.000E+00 --- FRACA( 3)
R017 Ring 4 not used 0.000E+00 --- FRACA( 4)
R017 Ring 5 not used 0.000E+00 --- FRACA( 5)
R017 Ring 6 not used 0.000E+00 --- FRACA( 6)
R017 Ring 7 not used 0.000E+00 --- FRACA( 7)
R017 Ring 8 not used 0.000E+00 --- FRACA( 8)
R017 Ring 9 not used 0.000E+00 --- FRACA( 9)
R017 Ring 10 not used 0.000E+00 --- FRACA(10)
R017 Ring 11 not used 0.000E+00 --- FRACA(11)
R017 Ring 12 not used 0.000E+00 --- FRACA(12)
R018 Fruits, vegetables and grain consumption (kg/yr) 1.760E+02 1.600E+02 --- DIET(1)
R018 Leafy vegetable consumption (kg/yr) 1.800E+01 1.400E+01 --- DIET(2)
R018 Milk consumption (L/yr) 1.120E+02 9.200E+01 --- DIET(3)
R018 Meat and poultry consumption (kg/yr) 8.500E+01 6.300E+01 --- DIET(4)
R018 Fish consumption (kg/yr) not used 5.400E+00 --- DIET(5)
R018 Other seafood consumption (kg/yr) not used 9.000E-01 --- DIET(6)
R018 Soil ingestion rate (g/yr) 3.650E+01 3.650E+01 --- SOIL
R018 Drinking water intake (L/yr) 5.100E+02 5.100E+02 --- DWI
R018 Contamination fraction of drinking water 1.000E+00 1.000E+00 --- FDW
R018 Contamination fraction of household water not used 1.000E+00 --- FHHW
R018 Contamination fraction of livestock water 1.000E+00 1.000E+00 --- FLW
R018 Contamination fraction of irrigation water 1.000E+00 1.000E+00 --- FIRW
R018 Contamination fraction of aquatic food not used 5.000E-01 --- FR9
R018 Contamination fraction of plant food -1 -1 0.500E+00 FPLANT
R018 Contamination fraction of meat -1 -1 0.100E+01 FMEAT
R018 Contamination fraction of milk -1 -1 0.100E+01 FMILK

RESRAD, Version 6.3 T½ Limit = 180 days 11/28/2005 18:32 Page 9
Summary : Resolve Plutonium Waste Calculations File: LANL_Pu_Waste.RAD
Site-Specific Parameter Summary (continued)
User Used by RESRAD Parameter
Menu Parameter Input Default (If different from user input) Name
R019 Livestock fodder intake for meat (kg/day) 6.800E+01 6.800E+01 --- LFI5
R019 Livestock fodder intake for milk (kg/day) 5.500E+01 5.500E+01 --- LFI6
R019 Livestock water intake for meat (L/day) 5.000E+01 5.000E+01 --- LWI5
R019 Livestock water intake for milk (L/day) 1.600E+02 1.600E+02 --- LWI6
R019 Livestock soil intake (kg/day) 5.000E-01 5.000E-01 --- LSI
R019 Mass loading for foliar deposition (g/m**3) 1.000E-04 1.000E-04 --- MLFD
R019 Depth of soil mixing layer (m) 1.500E-01 1.500E-01 --- DM
R019 Depth of roots (m) 9.000E-01 9.000E-01 --- DROOT
R019 Drinking water fraction from ground water 1.000E+00 1.000E+00 --- FGWDW
R019 Household water fraction from ground water not used 1.000E+00 --- FGWHH
R019 Livestock water fraction from ground water 1.000E+00 1.000E+00 --- FGWLW
R019 Irrigation fraction from ground water 1.000E+00 1.000E+00 --- FGWIR
R19B Wet weight crop yield for Non-Leafy (kg/m**2) 7.000E-01 7.000E-01 --- YV(1)
R19B Wet weight crop yield for Leafy (kg/m**2) 1.500E+00 1.500E+00 --- YV(2)
R19B Wet weight crop yield for Fodder (kg/m**2) 1.100E+00 1.100E+00 --- YV(3)
R19B Growing Season for Non-Leafy (years) 1.700E-01 1.700E-01 --- TE(1)
R19B Growing Season for Leafy (years) 2.500E-01 2.500E-01 --- TE(2)
R19B Growing Season for Fodder (years) 8.000E-02 8.000E-02 --- TE(3)
R19B Translocation Factor for Non-Leafy 1.000E-01 1.000E-01 --- TIV(1)
R19B Translocation Factor for Leafy 1.000E+00 1.000E+00 --- TIV(2)
R19B Translocation Factor for Fodder 1.000E+00 1.000E+00 --- TIV(3)
R19B Dry Foliar Interception Fraction for Non-Leafy 2.500E-01 2.500E-01 --- RDRY(1)
R19B Dry Foliar Interception Fraction for Leafy 2.500E-01 2.500E-01 --- RDRY(2)
R19B Dry Foliar Interception Fraction for Fodder 2.500E-01 2.500E-01 --- RDRY(3)
R19B Wet Foliar Interception Fraction for Non-Leafy 2.500E-01 2.500E-01 --- RWET(1)
R19B Wet Foliar Interception Fraction for Leafy 2.500E-01 2.500E-01 --- RWET(2)
R19B Wet Foliar Interception Fraction for Fodder 2.500E-01 2.500E-01 --- RWET(3)
R19B Weathering Removal Constant for Vegetation 2.000E+01 2.000E+01 --- WLAM
C14 C-12 concentration in water (g/cm**3) not used 2.000E-05 --- C12WTR
C14 C-12 concentration in contaminated soil (g/g) not used 3.000E-02 --- C12CZ
C14 Fraction of vegetation carbon from soil not used 2.000E-02 --- CSOIL
C14 Fraction of vegetation carbon from air not used 9.800E-01 --- CAIR
C14 C-14 evasion layer thickness in soil (m) not used 3.000E-01 --- DMC
C14 C-14 evasion flux rate from soil (1/sec) not used 7.000E-07 --- EVSN
C14 C-12 evasion flux rate from soil (1/sec) not used 1.000E-10 --- REVSN
C14 Fraction of grain in beef cattle feed not used 8.000E-01 --- AVFG4
C14 Fraction of grain in milk cow feed not used 2.000E-01 --- AVFG5
C14 DCF correction factor for gaseous forms of C14 not used 0.000E+00 --- CO2F
STOR Storage times of contaminated foodstuffs (days):
STOR Fruits, non-leafy vegetables, and grain 1.400E+01 1.400E+01 --- STOR_T(1)
STOR Leafy vegetables 1.000E+00 1.000E+00 --- STOR_T(2)
STOR Milk 1.000E+00 1.000E+00 --- STOR_T(3)
STOR Meat and poultry 2.000E+01 2.000E+01 --- STOR_T(4)
STOR Fish 7.000E+00 7.000E+00 --- STOR_T(5)
STOR Crustacea and mollusks 7.000E+00 7.000E+00 --- STOR_T(6)
STOR Well water 1.000E+00 1.000E+00 --- STOR_T(7)
STOR Surface water 1.000E+00 1.000E+00 --- STOR_T(8)
STOR Livestock fodder 4.500E+01 4.500E+01 --- STOR_T(9)

RESRAD, Version 6.3 T½ Limit = 180 days 11/28/2005 18:32 Page 10
Summary : Resolve Plutonium Waste Calculations File: LANL_Pu_Waste.RAD
Site-Specific Parameter Summary (continued)
User Used by RESRAD Parameter
Menu Parameter Input Default (If different from user input) Name
R021 Thickness of building foundation (m) not used 1.500E-01 --- FLOOR1
R021 Bulk density of building foundation (g/cm**3) not used 2.400E+00 --- DENSFL
R021 Total porosity of the cover material not used 4.000E-01 --- TPCV
R021 Total porosity of the building foundation not used 1.000E-01 --- TPFL
R021 Volumetric water content of the cover material not used 5.000E-02 --- PH2OCV
R021 Volumetric water content of the foundation not used 3.000E-02 --- PH2OFL
R021 Diffusion coefficient for radon gas (m/sec):
R021 in cover material not used 2.000E-06 --- DIFCV
R021 in foundation material not used 3.000E-07 --- DIFFL
R021 in contaminated zone soil not used 2.000E-06 --- DIFCZ
R021 Radon vertical dimension of mixing (m) not used 2.000E+00 --- HMIX
R021 Average building air exchange rate (1/hr) not used 5.000E-01 --- REXG
R021 Height of the building (room) (m) not used 2.500E+00 --- HRM
R021 Building interior area factor not used 0.000E+00 --- FAI
R021 Building depth below ground surface (m) not used -1.000E+00 --- DMFL
R021 Emanating power of Rn-222 gas not used 2.500E-01 --- EMANA(1)
R021 Emanating power of Rn-220 gas not used 1.500E-01 --- EMANA(2)
TITL Number of graphical time points 1024 --- --- NPTS
TITL Maximum number of integration points for dose 17 --- --- LYMAX
TITL Maximum number of integration points for risk 1 --- --- KYMAX
Summary of Pathway Selections
Pathway User Selection
1 -- external gamma active
2 -- inhalation (w/o radon) active
3 -- plant ingestion active
4 -- meat ingestion active
5 -- milk ingestion active
6 -- aquatic foods suppressed
7 -- drinking water active
8 -- soil ingestion active
9 -- radon suppressed
Find peak pathway doses suppressed

RESRAD, Version 6.3 T½ Limit = 180 days 11/28/2005 18:32 Page 11
Summary : Resolve Plutonium Waste Calculations File: LANL_Pu_Waste.RAD
Contaminated Zone Dimensions Initial Soil Concentrations, nCi/g
Area: 33445.00 square meters Am-241 1.170E+01
Thickness: 14.00 meters Pu-239 2.310E+01
Cover Depth: 1.22 meters Pu-240 2.120E+00
Total Dose TDOSE(t), mrem/yr
Basic Radiation Dose Limit = 2.500E+01 mrem/yr
Total Mixture Sum M(t) = Fraction of Basic Dose Limit Received at Time (t)
t (years): 0.000E+00 1.000E+04 1.000E+05
TDOSE(t): 5.853E-11 6.798E-08 6.655E+02
M(t): 2.341E-12 2.719E-09 2.662E+01
Maximum TDOSE(t): 2.357E+03 mrem/yr at t = 55449 ± * years
Total Dose Contributions TDOSE(i,p,t) for Individual Radionuclides (i) and Pathways (p)
As mrem/yr and Fraction of Total Dose At t = 5.545E+04 years
Water Independent Pathways (Inhalation excludes radon)
Ground Inhalation Radon Plant Meat Milk Soil
Radio-
Nuclide mrem/yr fract. mrem/yr fract. mrem/yr fract. mrem/yr fract. mrem/yr fract. mrem/yr fract. mrem/yr fract.
Nuclide
Am-241 1.535E+00 0.0007 2.274E-01 0.0001 0.000E+00 0.0000 1.809E+01 0.0077 1.470E+00 0.0006 1.330E-02 0.0000 2.718E-01 0.0001
Pu-239 1.194E+00 0.0005 2.415E+02 0.1024 0.000E+00 0.0000 1.591E+03 0.6750 8.012E+01 0.0340 1.028E+00 0.0004 4.176E+02 0.1772
Pu-240 4.875E-04 0.0000 3.117E-01 0.0001 0.000E+00 0.0000 2.038E+00 0.0009 1.021E-01 0.0000 5.791E-03 0.0000 5.318E-01 0.0002
Total 2.729E+00 0.0012 2.420E+02 0.1027 0.000E+00 0.0000 1.612E+03 0.6836 8.169E+01 0.0347 1.047E+00 0.0004 4.184E+02 0.1775
Total Dose Contributions TDOSE(i,p,t) for Individual Radionuclides (i) and Pathways (p)
As mrem/yr and Fraction of Total Dose At t = 5.545E+04 years
Water Dependent Pathways
Water Fish Radon Plant Meat Milk All Pathways*
Radio-
Nuclide mrem/yr fract. mrem/yr fract. mrem/yr fract. mrem/yr fract. mrem/yr fract. mrem/yr fract. mrem/yr fract.
Nuclide
Am-241 0.000E+00 0.0000 0.000E+00 0.0000 0.000E+00 0.0000 0.000E+00 0.0000 0.000E+00 0.0000 0.000E+00 0.0000 2.161E+01 0.0092
Pu-239 0.000E+00 0.0000 0.000E+00 0.0000 0.000E+00 0.0000 0.000E+00 0.0000 0.000E+00 0.0000 0.000E+00 0.0000 2.333E+03 0.9896
Pu-240 0.000E+00 0.0000 0.000E+00 0.0000 0.000E+00 0.0000 0.000E+00 0.0000 0.000E+00 0.0000 0.000E+00 0.0000 2.990E+00 0.0013
Total 0.000E+00 0.0000 0.000E+00 0.0000 0.000E+00 0.0000 0.000E+00 0.0000 0.000E+00 0.0000 0.000E+00 0.0000 2.357E+03 1.0000
*Sum of all water independent and dependent pathways.

RESRAD, Version 6.3 T½ Limit = 180 days 11/28/2005 18:32 Page 12
Summary : Resolve Plutonium Waste Calculations File: LANL_Pu_Waste.RAD
Total Dose Contributions TDOSE(i,p,t) for Individual Radionuclides (i) and Pathways (p)
As mrem/yr and Fraction of Total Dose At t = 0.000E+00 years
Water Independent Pathways (Inhalation excludes radon)
Ground Inhalation Radon Plant Meat Milk Soil
Radio-
Nuclide mrem/yr fract. mrem/yr fract. mrem/yr fract. mrem/yr fract. mrem/yr fract. mrem/yr fract. mrem/yr fract.
Am-241 4.272E-13 0.0073 0.000E+00 0.0000 0.000E+00 0.0000 0.000E+00 0.0000 0.000E+00 0.0000 0.000E+00 0.0000 0.000E+00 0.0000
Pu-239 5.811E-11 0.9927 0.000E+00 0.0000 0.000E+00 0.0000 0.000E+00 0.0000 0.000E+00 0.0000 0.000E+00 0.0000 0.000E+00 0.0000
Pu-240 2.500E-19 0.0000 0.000E+00 0.0000 0.000E+00 0.0000 0.000E+00 0.0000 0.000E+00 0.0000 0.000E+00 0.0000 0.000E+00 0.0000
Total 5.853E-11 1.0000 0.000E+00 0.0000 0.000E+00 0.0000 0.000E+00 0.0000 0.000E+00 0.0000 0.000E+00 0.0000 0.000E+00 0.0000
Total Dose Contributions TDOSE(i,p,t) for Individual Radionuclides (i) and Pathways (p)
As mrem/yr and Fraction of Total Dose At t = 0.000E+00 years
Water Dependent Pathways
Water Fish Radon Plant Meat Milk All Pathways*
Radio-
Nuclide mrem/yr fract. mrem/yr fract. mrem/yr fract. mrem/yr fract. mrem/yr fract. mrem/yr fract. mrem/yr fract.
Am-241 0.000E+00 0.0000 0.000E+00 0.0000 0.000E+00 0.0000 0.000E+00 0.0000 0.000E+00 0.0000 0.000E+00 0.0000 4.272E-13 0.0073
Pu-239 0.000E+00 0.0000 0.000E+00 0.0000 0.000E+00 0.0000 0.000E+00 0.0000 0.000E+00 0.0000 0.000E+00 0.0000 5.811E-11 0.9927
Pu-240 0.000E+00 0.0000 0.000E+00 0.0000 0.000E+00 0.0000 0.000E+00 0.0000 0.000E+00 0.0000 0.000E+00 0.0000 2.500E-19 0.0000
Total 0.000E+00 0.0000 0.000E+00 0.0000 0.000E+00 0.0000 0.000E+00 0.0000 0.000E+00 0.0000 0.000E+00 0.0000 5.853E-11 1.0000
*Sum of all water independent and dependent pathways.
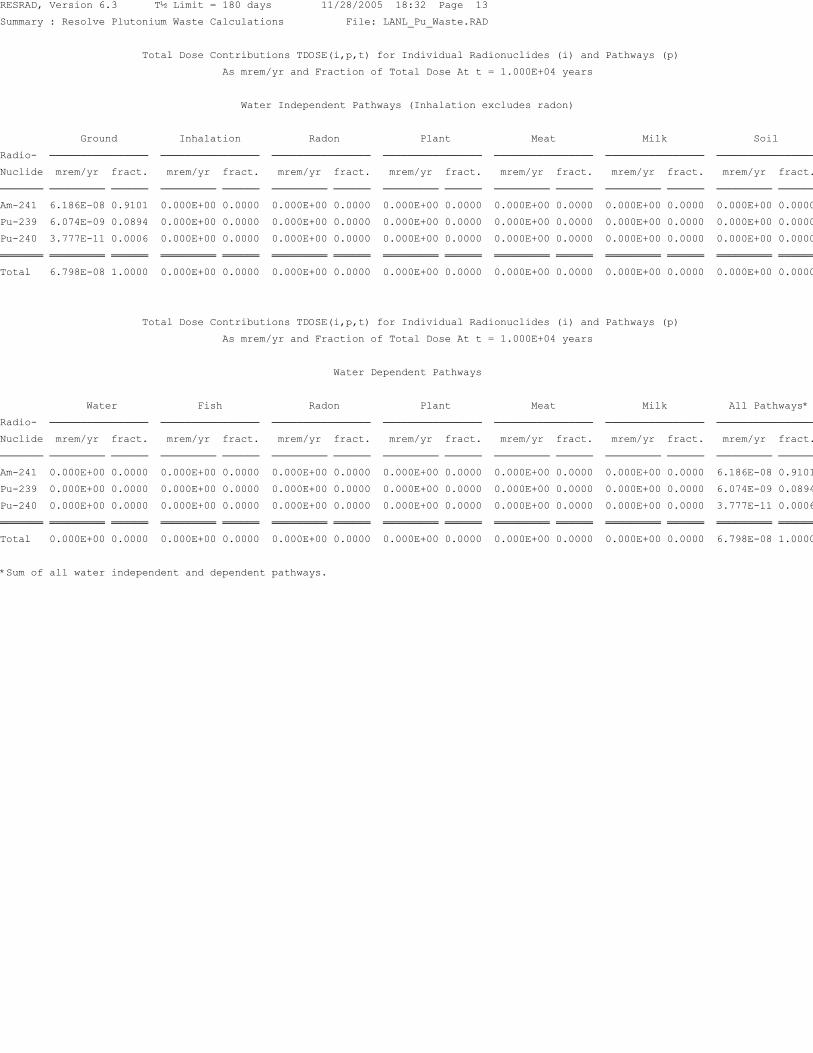
RESRAD, Version 6.3 T½ Limit = 180 days 11/28/2005 18:32 Page 13
Summary : Resolve Plutonium Waste Calculations File: LANL_Pu_Waste.RAD
Total Dose Contributions TDOSE(i,p,t) for Individual Radionuclides (i) and Pathways (p)
As mrem/yr and Fraction of Total Dose At t = 1.000E+04 years
Water Independent Pathways (Inhalation excludes radon)
Ground Inhalation Radon Plant Meat Milk Soil
Radio-
Nuclide mrem/yr fract. mrem/yr fract. mrem/yr fract. mrem/yr fract. mrem/yr fract. mrem/yr fract. mrem/yr fract.
Am-241 6.186E-08 0.9101 0.000E+00 0.0000 0.000E+00 0.0000 0.000E+00 0.0000 0.000E+00 0.0000 0.000E+00 0.0000 0.000E+00 0.0000
Pu-239 6.074E-09 0.0894 0.000E+00 0.0000 0.000E+00 0.0000 0.000E+00 0.0000 0.000E+00 0.0000 0.000E+00 0.0000 0.000E+00 0.0000
Pu-240 3.777E-11 0.0006 0.000E+00 0.0000 0.000E+00 0.0000 0.000E+00 0.0000 0.000E+00 0.0000 0.000E+00 0.0000 0.000E+00 0.0000
Total 6.798E-08 1.0000 0.000E+00 0.0000 0.000E+00 0.0000 0.000E+00 0.0000 0.000E+00 0.0000 0.000E+00 0.0000 0.000E+00 0.0000
Total Dose Contributions TDOSE(i,p,t) for Individual Radionuclides (i) and Pathways (p)
As mrem/yr and Fraction of Total Dose At t = 1.000E+04 years
Water Dependent Pathways
Water Fish Radon Plant Meat Milk All Pathways*
Radio-
Nuclide mrem/yr fract. mrem/yr fract. mrem/yr fract. mrem/yr fract. mrem/yr fract. mrem/yr fract. mrem/yr fract.
Am-241 0.000E+00 0.0000 0.000E+00 0.0000 0.000E+00 0.0000 0.000E+00 0.0000 0.000E+00 0.0000 0.000E+00 0.0000 6.186E-08 0.9101
Pu-239 0.000E+00 0.0000 0.000E+00 0.0000 0.000E+00 0.0000 0.000E+00 0.0000 0.000E+00 0.0000 0.000E+00 0.0000 6.074E-09 0.0894
Pu-240 0.000E+00 0.0000 0.000E+00 0.0000 0.000E+00 0.0000 0.000E+00 0.0000 0.000E+00 0.0000 0.000E+00 0.0000 3.777E-11 0.0006
Total 0.000E+00 0.0000 0.000E+00 0.0000 0.000E+00 0.0000 0.000E+00 0.0000 0.000E+00 0.0000 0.000E+00 0.0000 6.798E-08 1.0000
*Sum of all water independent and dependent pathways.

RESRAD, Version 6.3 T½ Limit = 180 days 11/28/2005 18:32 Page 14
Summary : Resolve Plutonium Waste Calculations File: LANL_Pu_Waste.RAD
Total Dose Contributions TDOSE(i,p,t) for Individual Radionuclides (i) and Pathways (p)
As mrem/yr and Fraction of Total Dose At t = 1.000E+05 years
Water Independent Pathways (Inhalation excludes radon)
Ground Inhalation Radon Plant Meat Milk Soil
Radio-
Nuclide mrem/yr fract. mrem/yr fract. mrem/yr fract. mrem/yr fract. mrem/yr fract. mrem/yr fract. mrem/yr fract.
Am-241 1.562E+00 0.0023 2.583E-01 0.0004 0.000E+00 0.0000 1.659E+01 0.0249 1.346E+00 0.0020 1.431E-02 0.0000 2.680E-01 0.0004
Pu-239 7.169E-01 0.0011 6.653E+01 0.1000 0.000E+00 0.0000 4.398E+02 0.6609 2.319E+01 0.0349 2.914E-01 0.0004 1.148E+02 0.1726
Pu-240 5.189E-05 0.0000 6.702E-03 0.0000 0.000E+00 0.0000 3.490E-02 0.0001 2.254E-03 0.0000 3.049E-03 0.0000 6.466E-03 0.0000
Total 2.279E+00 0.0034 6.680E+01 0.1004 0.000E+00 0.0000 4.565E+02 0.6859 2.454E+01 0.0369 3.088E-01 0.0005 1.151E+02 0.1730
Total Dose Contributions TDOSE(i,p,t) for Individual Radionuclides (i) and Pathways (p)
As mrem/yr and Fraction of Total Dose At t = 1.000E+05 years
Water Dependent Pathways
Water Fish Radon Plant Meat Milk All Pathways*
Radio-
Nuclide mrem/yr fract. mrem/yr fract. mrem/yr fract. mrem/yr fract. mrem/yr fract. mrem/yr fract. mrem/yr fract.
Am-241 0.000E+00 0.0000 0.000E+00 0.0000 0.000E+00 0.0000 0.000E+00 0.0000 0.000E+00 0.0000 0.000E+00 0.0000 2.004E+01 0.0301
Pu-239 0.000E+00 0.0000 0.000E+00 0.0000 0.000E+00 0.0000 0.000E+00 0.0000 0.000E+00 0.0000 0.000E+00 0.0000 6.454E+02 0.9698
Pu-240 0.000E+00 0.0000 0.000E+00 0.0000 0.000E+00 0.0000 0.000E+00 0.0000 0.000E+00 0.0000 0.000E+00 0.0000 5.343E-02 0.0001
Total 0.000E+00 0.0000 0.000E+00 0.0000 0.000E+00 0.0000 0.000E+00 0.0000 0.000E+00 0.0000 0.000E+00 0.0000 6.655E+02 1.0000
*Sum of all water independent and dependent pathways.

RESRAD, Version 6.3 T½ Limit = 180 days 11/28/2005 18:32 Page 15
Summary : Resolve Plutonium Waste Calculations File: LANL_Pu_Waste.RAD
Dose/Source Ratios Summed Over All Pathways
Parent and Progeny Principal Radionuclide Contributions Indicated
Parent Product Thread DSR(j,t) At Time in Years (mrem/yr)/(nCi/g)
(i) (j) Fraction 0.000E+00 1.000E+04 1.000E+05
Am-241 Am-241 1.000E+00 2.776E-24 7.373E-27 0.000E+00
Am-241 Np-237+D 1.000E+00 3.651E-14 2.164E-09 1.641E+00
Am-241 U-233 1.000E+00 1.502E-24 4.755E-15 4.789E-03
Am-241 Th-229+D 1.000E+00 4.611E-22 3.123E-09 6.706E-02
Am-241 ∑DSR(j) 3.651E-14 5.288E-09 1.713E+00
Pu-239 Pu-239 1.000E+00 2.515E-12 1.619E-10 2.766E+01
Pu-239 U-235+D 1.000E+00 2.038E-18 3.209E-12 9.064E-03
Pu-239 Pa-231 1.000E+00 2.122E-22 2.335E-12 1.977E-01
Pu-239 Ac-227+D 1.000E+00 1.230E-22 9.546E-11 7.292E-02
Pu-239 ∑DSR(j) 2.515E-12 2.629E-10 2.794E+01
Pu-240 Pu-240 4.950E-08 5.836E-27 2.685E-24 6.057E-10
Pu-240 Pu-240 1.000E+00 1.179E-19 5.424E-17 1.224E-02
Pu-240 U-236 1.000E+00 1.977E-25 1.590E-18 1.295E-02
Pu-240 Th-232 1.000E+00 1.739E-36 3.496E-25 4.667E-07
Pu-240 Ra-228+D 1.000E+00 5.634E-24 6.214E-13 8.238E-06
Pu-240 Th-228+D 1.000E+00 2.064E-23 1.719E-11 4.893E-06
Pu-240 ∑DSR(j) 1.179E-19 1.781E-11 2.520E-02
The DSR includes contributions from associated (half-life ≤ 180 days) daughters.
Single Radionuclide Soil Guidelines G(i,t) in nCi/g
Basic Radiation Dose Limit = 2.500E+01 mrem/yr
Nuclide
(i) t= 0.000E+00 1.000E+04 1.000E+05
Am-241 *3.431E+09 *3.431E+09 1.460E+01
Pu-239 *6.214E+07 *6.214E+07 8.948E-01
Pu-240 *2.278E+08 *2.278E+08 9.920E+02
*At specific activity limit
Summed Dose/Source Ratios DSR(i,t) in (mrem/yr)/(nCi/g)
and Single Radionuclide Soil Guidelines G(i,t) in nCi/g
at tmin = time of minimum single radionuclide soil guideline
and at tmax = time of maximum total dose = 55449 ± * years
Nuclide Initial tmin DSR(i,tmin) G(i,tmin) DSR(i,tmax) G(i,tmax)
(i) (nCi/g) (years) (nCi/g) (nCi/g)
Am-241 1.170E+01 55518 ± * 1.847E+00 1.353E+01 1.847E+00 1.353E+01
Pu-239 2.310E+01 55449 ± * 1.010E+02 2.476E-01 1.010E+02 2.476E-01
Pu-240 2.120E+00 23972 ± * 6.236E+00 4.009E+00 1.411E+00 1.772E+01

RESRAD, Version 6.3 T½ Limit = 180 days 11/28/2005 18:32 Page 16
Summary : Resolve Plutonium Waste Calculations File: LANL_Pu_Waste.RAD
Individual Nuclide Dose Summed Over All Pathways
Parent Nuclide and Branch Fraction Indicated
Nuclide Parent THF(i) DOSE(j,t), mrem/yr
(j) (i) t= 0.000E+00 1.000E+04 1.000E+05
Am-241 Am-241 1.000E+00 3.247E-23 8.627E-26 0.000E+00
Np-237 Am-241 1.000E+00 4.272E-13 2.532E-08 1.920E+01
U-233 Am-241 1.000E+00 1.757E-23 5.564E-14 5.603E-02
Th-229 Am-241 1.000E+00 5.395E-21 3.654E-08 7.846E-01
Pu-239 Pu-239 1.000E+00 5.811E-11 3.741E-09 6.390E+02
U-235 Pu-239 1.000E+00 4.709E-17 7.413E-11 2.094E-01
Pa-231 Pu-239 1.000E+00 4.901E-21 5.395E-11 4.567E+00
Ac-227 Pu-239 1.000E+00 2.841E-21 2.205E-09 1.685E+00
Pu-240 Pu-240 4.950E-08 1.237E-26 5.692E-24 1.284E-09
Pu-240 Pu-240 1.000E+00 2.499E-19 1.150E-16 2.594E-02
Pu-240 ∑DOSE(j) 2.499E-19 1.150E-16 2.594E-02
U-236 Pu-240 1.000E+00 4.191E-25 3.372E-18 2.746E-02
Th-232 Pu-240 1.000E+00 0.000E+00 7.412E-25 9.894E-07
Ra-228 Pu-240 1.000E+00 1.194E-23 1.317E-12 1.746E-05
Th-228 Pu-240 1.000E+00 4.376E-23 3.645E-11 1.037E-05
THF(i) is the thread fraction of the parent nuclide.

RESRAD, Version 6.3 T½ Limit = 180 days 11/28/2005 18:32 Page 17
Summary : Resolve Plutonium Waste Calculations File: LANL_Pu_Waste.RAD
Individual Nuclide Soil Concentration
Parent Nuclide and Branch Fraction Indicated
Nuclide Parent THF(i) S(j,t), nCi/g
(j) (i) t= 0.000E+00 1.000E+04 1.000E+05
Am-241 Am-241 1.000E+00 1.170E+01 1.015E-06 0.000E+00
Np-237 Am-241 1.000E+00 0.000E+00 2.286E-03 1.899E-03
U-233 Am-241 1.000E+00 0.000E+00 8.902E-05 4.971E-04
Th-229 Am-241 1.000E+00 0.000E+00 3.067E-05 4.739E-04
Pu-239 Pu-239 1.000E+00 2.310E+01 1.728E+01 1.268E+00
U-235 Pu-239 1.000E+00 0.000E+00 1.885E-04 4.015E-04
Pa-231 Pu-239 1.000E+00 0.000E+00 1.921E-05 2.830E-04
Ac-227 Pu-239 1.000E+00 0.000E+00 1.909E-05 2.828E-04
Pu-240 Pu-240 4.950E-08 1.049E-07 3.626E-08 2.548E-12
Pu-240 Pu-240 1.000E+00 2.120E+00 7.326E-01 5.148E-05
Pu-240 ∑S(j): 2.120E+00 7.326E-01 5.148E-05
U-236 Pu-240 1.000E+00 0.000E+00 3.668E-04 2.634E-04
Th-232 Pu-240 1.000E+00 0.000E+00 1.084E-10 1.802E-09
Ra-228 Pu-240 1.000E+00 0.000E+00 1.082E-10 1.802E-09
Th-228 Pu-240 1.000E+00 0.000E+00 1.082E-10 1.802E-09
THF(i) is the thread fraction of the parent nuclide.
RESCALC.EXE execution time = 7.70 seconds